Article

Crop Nitrogen Fertilization Schedule in Bread Wheat Affects the Mechanical Performances of Thermoplastic Films Obtained by Plasticization of Flours

1
Department of Agricultural, Food and Environmental Sciences, University of Perugia, Borgo XX Giugno, 74, 06123 Perugia, Italy
2
Department of Civil and Environmental Engineering, University of Perugia, Strada di Pentima 4, 05100 Terni, Italy
3
Department of Materials, Environmental Sciences and Urban Planning (SIMAU), Polytechnic University of Marche, 60131 Ancona, Italy
4
ASSAM Marche, Agenzia per i Servizi nel Settore Agroalimentare delle Marche, Via Giulio Latini, 64, 60035 Jesi, Italy
5
CREA—Research Centre for Engineering and Agro-Food Processing, Via Manziana, 30, 00189 Rome, Italy
*
Author to whom correspondence should be addressed.
Agronomy 2023, 13(3), 697; https://doi.org/10.3390/agronomy13030697
Submission received: 22 January 2023 / Revised: 23 February 2023 / Accepted: 24 February 2023 / Published: 27 February 2023

Abstract

:
Recent research has investigated the plasticization of wheat flour as a non-food alternative application. In this work, we analyzed the performances of thermoplastic films obtained using flours of two bread wheat cultivars (Bologna and Bora) grown in fall–spring under four nitrogen (N) fertilization treatments: (1) continuously well-N-fed (N300 = 300 kg N ha−1, split throughout the growth cycle); (2) N-fed only very early (N60-0 = 60 kg N ha−1, just one month after sowing); (3) N-fed only extremely late (N0-120 = 120 kg N ha−1 at pollination); (4) unfertilized control (N0). Flours were characterized for glutenin and gliadin fractions, Chopin’s alveograph parameters, Field Emission Scanning Electron Microscopy (FESEM) images, and thermogravimetric analysis (TGA), while films were evaluated for mechanical properties (tensile strength at break, σb; elongation at break, εb; Young’s modulus, E) and FESEM images. Differences among treatments for absolute and relative abundances of gluten fractions and alveographic parameters were extremely marked and gave rise to differences in tensile properties of thermoplastic films. Within each cultivar, the ranking of treatments for εb values was N0 > N60-0 > N0-120 > N300. Thus, εb was inversely correlated with crop N availability and total gluten content of the flour. The σb was less variable among N treatments; however, in both cultivars, it was high in N0 and N300 and appreciably lower in N0-120. Overall, the best mechanical performances were obtained with flours from crops not subjected to imbalances in N nutrition (N0, N300). Our work demonstrates that bioplastic engineering needs to take into consideration the variability of biological source material like that caused by different crop N availability.

1. Introduction

Although wheat is thought to be used for human or animal feeding, there might be circumstances involving alternative non-food uses, e.g., due to unsold stocks, the presence of toxins or pesticides, etc., so that the grains or flours would ultimately represent a material to dispose of. One possible non-food alternative of wheat flours is the production of thermoplastics [1]. These have been found to be highly affected by flour characteristics. In particular, the proteins and bran may play an important role since they work as reinforcement, therefore affecting the mechanical properties of either thermoplastic films or bulk samples [2,3]. As far as proteins are concerned, most of those contained in the grain are storage proteins, better known under the name of gluten. Leblanc et al. [1] suggested flours with less than 10% protein as more suitable for plasticization. More recently, Puglia et al. [4] and then Benincasa et al. [2] demonstrated that the tensile performances of thermoplastics derived from wheat refined flours, more than on the total protein content, depend on the kind of proteins and their structural organization in the grain, as revealed by the grain hardness and the Chopin’s alveograph parameters (P, L, P/L, W), commonly used to describe flour’s baking properties. Wheat gluten is composed of two major protein groups, glutenins and gliadins [5], referred to as prolamines. Glutenins, representing about 45% of the total protein in the endosperm of bread wheat, are polymeric proteins ranging in molecular weight from 80 to several million kDa, in which many subunits are cross-linked by disulphide bonds. These subunits can be fractionated, after reduction, by SDS-PAGE, and they subdivide into high-molecular-weight subunits (HMW-GS, 80–120 kDa) and low-molecular-weight subunits (LMW-GS, 30–50 kDa). Gliadins account for approximately 30% of the total kernel protein, they are monomeric, having molecular weight lower than 80 KDa, and they are represented by a large family of proteins which can be classified as α- and β-gliadins (30–35 kDa), γ-gliadins (35–45 kDa), and ω-gliadins (45–75 kDa), based on their electrophoretic mobility. It is the absolute abundance of each fraction and the relative abundance among fractions that affects the baking properties of flours [6,7] and, likely, the mechanical properties of derived thermoplastics.
The accumulation of gluten fractions in the wheat grain depends on the genotype (i.e., the “cultivar”, contraction of “cultivated variety”) and the environment sensu latu, including either the soil and climate or the cultivation practices. No doubt, the genotype plays a primary role. Thus, for example, Benincasa et al. [2] tested a total of 24 single-cultivar flours in a wide range of baking properties and discovered relationships with the mechanical properties of derived thermoplastic films. However, the environment may also have an important effect. There is a body of literature on the effect of the rainfall and temperature regimes during grain filling and the effect of these variables on current photosynthesis and assimilate translocation to the grain. In this regard, it is worth noting that, in most cultivated areas, wheat is a rainfed crop, grown without irrigation; therefore, the grain filling is highly dependent on the rainfall regime and soil water capacity [8,9]. Similarly, there is a body of literature on the effect of cultivation choices (soil tillage, sowing density, nitrogen fertilization rate and timing, crop defense against pathogens) on wheat grain yield and quality [10].
For a given genotype in a given environment, the nitrogen (N) fertilization schedule is probably the most important factor affecting the content and kind of proteins in the grain. The N requirement for a wheat crop yielding 6–7 Mg ha−1 (the orientative yield of a rainfed crop in plains of temperate countries with developed agriculture) is around 150–200 kg ha−1, whereas the amount of N available in the soil generally accounts for a few tens of kg ha−1. The missing amount is supplied with N fertilization. N promotes first the size and functioning of the photosynthetic apparatus (i.e., the source of assimilates) and then the grain set and filling (i.e., the final sink for assimilates). Since N is relocated within the plant from the vegetative apparatus to the grains, the total crop N uptake, and thus the total N fertilization rate, is the primary factor affecting the grain protein content [11]. Nonetheless, the timing of N fertilization may also have an effect, since late more than early N availability contributes to the accumulation of proteins in the grain [12,13,14]. Moreover, glutenins and gliadins, due to their different molecular weight, have different accumulation dynamics in the grain and, again, the timing of N fertilization, combined with the rainfall regime, may favor one or the other fraction, with effects on gluten composition that vary year by year for the same locality.
In a recent work aimed at investigating the effect of the timing of N availability on the wheat grain development, Benincasa et al. [15] imposed different N fertilization schedules, differing for total N rates and application timing. Part of the grains harvested were milled and flours were destined to produce thermoplastics. Hence, the aim of this work was to evaluate the effect of N fertilization schedules on the protein content, gluten subunit composition, and alveographic parameters of wheat flours and on the mechanical properties of derived thermoplastics.

2. Materials and Methods

2.1. Origin of the Source Grains: The Field Trial and Crop N Fertilization Treatments

The wheat (Triticum aestivum L.) grains used as the source of the flours used for plasticization were harvested in June 2018 from a field experiment carried out at the experimental station of the Department of Agricultural, Food, and Environmental Sciences of the University of Perugia, located in Papiano (43° N, 12.3° E, 165 m a.s.l.), in the middle Tiber Valley, Central Italy. A detailed description of the field trial and crop management is reported in Benincasa et al. [15].
Briefly, two hexaploid bread wheat cultivars were used: Bora (BR), producing large grains (about 50 mg each), and Bologna (BL), producing small grains (about 35 mg each), which had been already studied for plasticization in the experiment by Benincasa et al. [2]. The different cultivars were exposed to different fertilization schedules, according to a split-plot design with four replicates (randomized blocks), with the cultivar allotted to the main plot and the N fertilization treatment allotted to the sub-plot. The source grains of the flours used here for plasticization were harvested from the following four fertilization treatments: (1) continuously well-N-fed (N300), i.e., fertilized with 300 kg N ha−1, split into five applications of 60 kg N ha−1 each, on 16 December (early tillering), 10th January and 12th February (tillering phase), 15th March (early shoot elongation), and 8th April (late shoot elongation); (2) N-fed only very early (N60-0), i.e., fertilized only in one application of 60 kg N ha−1 on 16th December; (3) N-fed only extremely late (N0-120), i.e., fertilized only in one application of 120 kg N ha−1 on 2nd May (pollination in the main spike); (4) unfertilized control (N0).
The four fertilization treatments were effective and differences among them were very marked for both cultivars, resulting in very different grain yield and yield components (spikes per m2, grains per spike, grain weight), as reported in Benincasa et al. [15]. It is worth noting that rainfall during the fall–winter season was very high, and this allowed the desired imbalance in crop N nutrition in treatments 60-0 and 0-120, which is unusual, but possible, in wheat cultivation practice. In particular, in N0 and N300, the crop could set a number of grains adequate to the photosynthetic capacity allowed by its constant N availability (low and high in N0 and N300, respectively), while in N60-0, the crop set a number of grains greater than required by the low late photosynthetic capacity, and finally, in N0-120, the crop was somehow “surprised” by an unexpected sharp increase in late N availability and could only fill up the few grains available with a large amount of new resources. In particular, N300 produced over 6 tons of grains per hectare, while N0-120 produced just 2 tons per hectare (thus, N compounds concentrated in this small amount of grains). Further details on agronomic and crop physiology aspects can be referred to in Benincasa et al. [15].

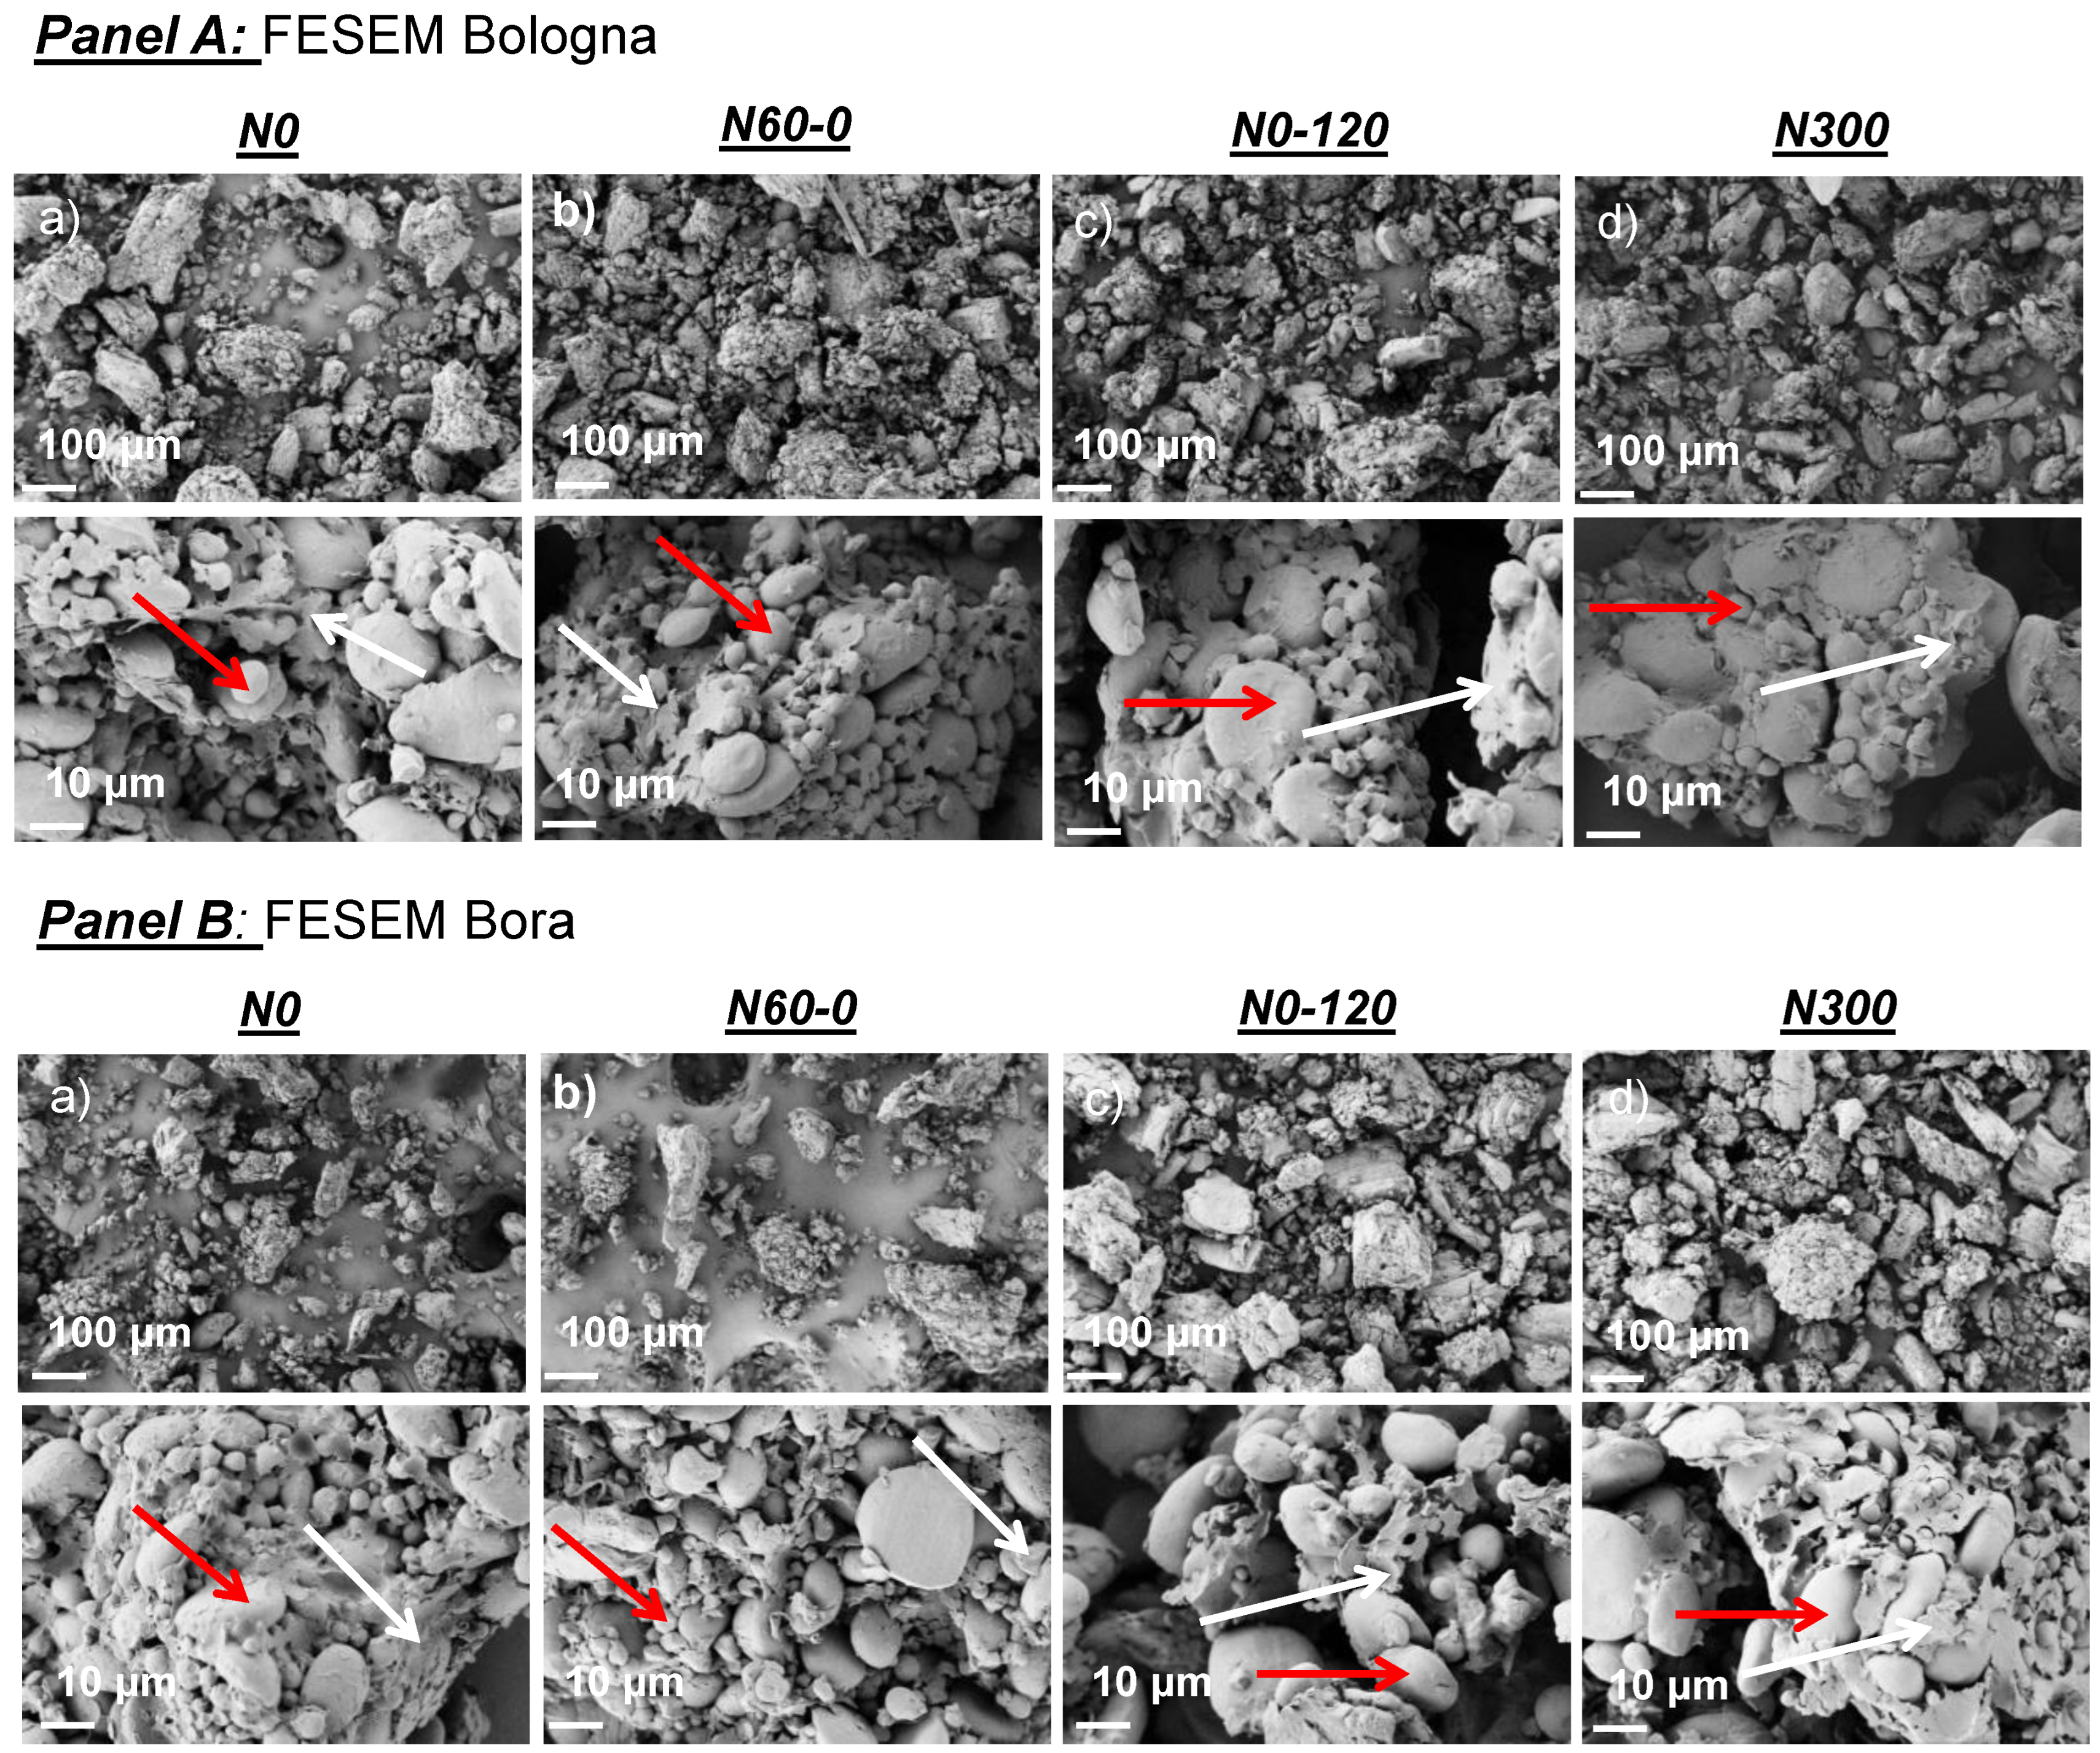
2.2. Grain Morphology and Microstructure of Flours

The morphology of different wheat grains and the microstructure of flours were investigated by FESEM (field emission scanning electron microscopy, Supra 25-Zeiss, Oberkochen, Germany, accelerating voltage 2 kV). The flour grains were deposited on adhesive tape, gold-sputtered, and then analyzed without staining, in accordance with Roman-Gutierrez et al. [16].

2.3. Grain Milling and Determination of Flour Alveographic Parameters

Sample grains from the four field replicates of each of the eight treatments (2 cultivars × 4 crop N fertilization schedules) were regrouped and accurately mixed to obtain an average sample for each treatment. Then, grains of each treatment were separately milled with a laboratory mill (Labormill, 4.RB., R. Bona srl, Monza, Italy) by the ASSAM (Agenzia Servizi Settore Agroalimentare delle Marche) laboratory of Jesi (Ancona Province) with standardized calibration and procedure. Chopin’s alveograph (Alveolink NG, Chopin, France) parameters (P, L, P/L, W) of the dough obtained by mixing flour with a 2.5% NaCl water solution were recorded on five dough disks according to a standard procedure (method UNI EN ISO 27971:2015). The mean outputs of the five replicated alveograms as provided by the alveograph, without SD values, were taken, provided that the five curves were very similar; otherwise, the test was repeated on five new dough disks. A more detailed description of alveographic parameters is reported in Puglia et al. (2015) [4].

2.4. Analysis of Gluten Content and Gluten Fractions

Gluten content determination was conducted on two analytical replicates with the Glutomatic 2200 (Perten Instruments) according to the AACC method 38-12 [17] and expressed as dry matter (d.m.).
Storage proteins were obtained from 50 mg of whole meal flour for 1 h at room temperature in a solution containing 0.0625 M Tris–HCl, pH 6.8, 2% (w/v) SDS, 40% (w/v) glycerol, and 5% β-mercaptoethanol. The extracts were incubated at 80 °C for 10 min and then centrifuged. A total of 10 µL of supernatant was added onto an SDS-PAGE gel prepared with 10% acrylamide (T = 10%, C = 0.05%), 0.375 M Tris–HCl, pH 8.4, and 0.1% (w/v) SDS; proteins were fractionated for 2 h at 200 V. Gliadins were extracted and fractionated by A-PAGE as described by Pogna et al. [18]. A 0.25% (w/v) solution of Coomassie Brillant Blue R250 in 6% trichloracetic acid was utilized to fix and stain the gel. After destaining for 24 h in distilled water, the gels were scanned with a UVIpro densitometer (Uvitec, Cambridge, UK) using the UVIpro Bronze software. High-molecular-weight glutenin subunits (HMW-GS) were numbered according to the nomenclature of Payne and Lawrence [19] and low-molecular-weight glutenin subunits (LMW-GS) with different relative mobilities were numerically named. HMW-GS and LMW-GS and gliadin classes (α/β, γ, and ꞷ, named according to Bushuk and Zillman [20]) were quantitatively compared by calculating their pixel volumes. All the determinations were repeated twice, and the k pixel volumes data were expressed as the mean of two replications.

2.5. Thermal Analysis of Wheat Flours

Thermal degradation of the different wheat flours was carried out by thermogravimetric analysis (TGA, Seiko Exstar 6300, Tokyo, Japan) applying a thermal profile from 30 °C to 600 °C at 10 °C/min. About 5 mg of each sample was used, and dynamic tests were carried out under nitrogen flow (200 mL/min). Mass loss (TG) and derivative mass loss (DTG) curves for each tested material were determined.

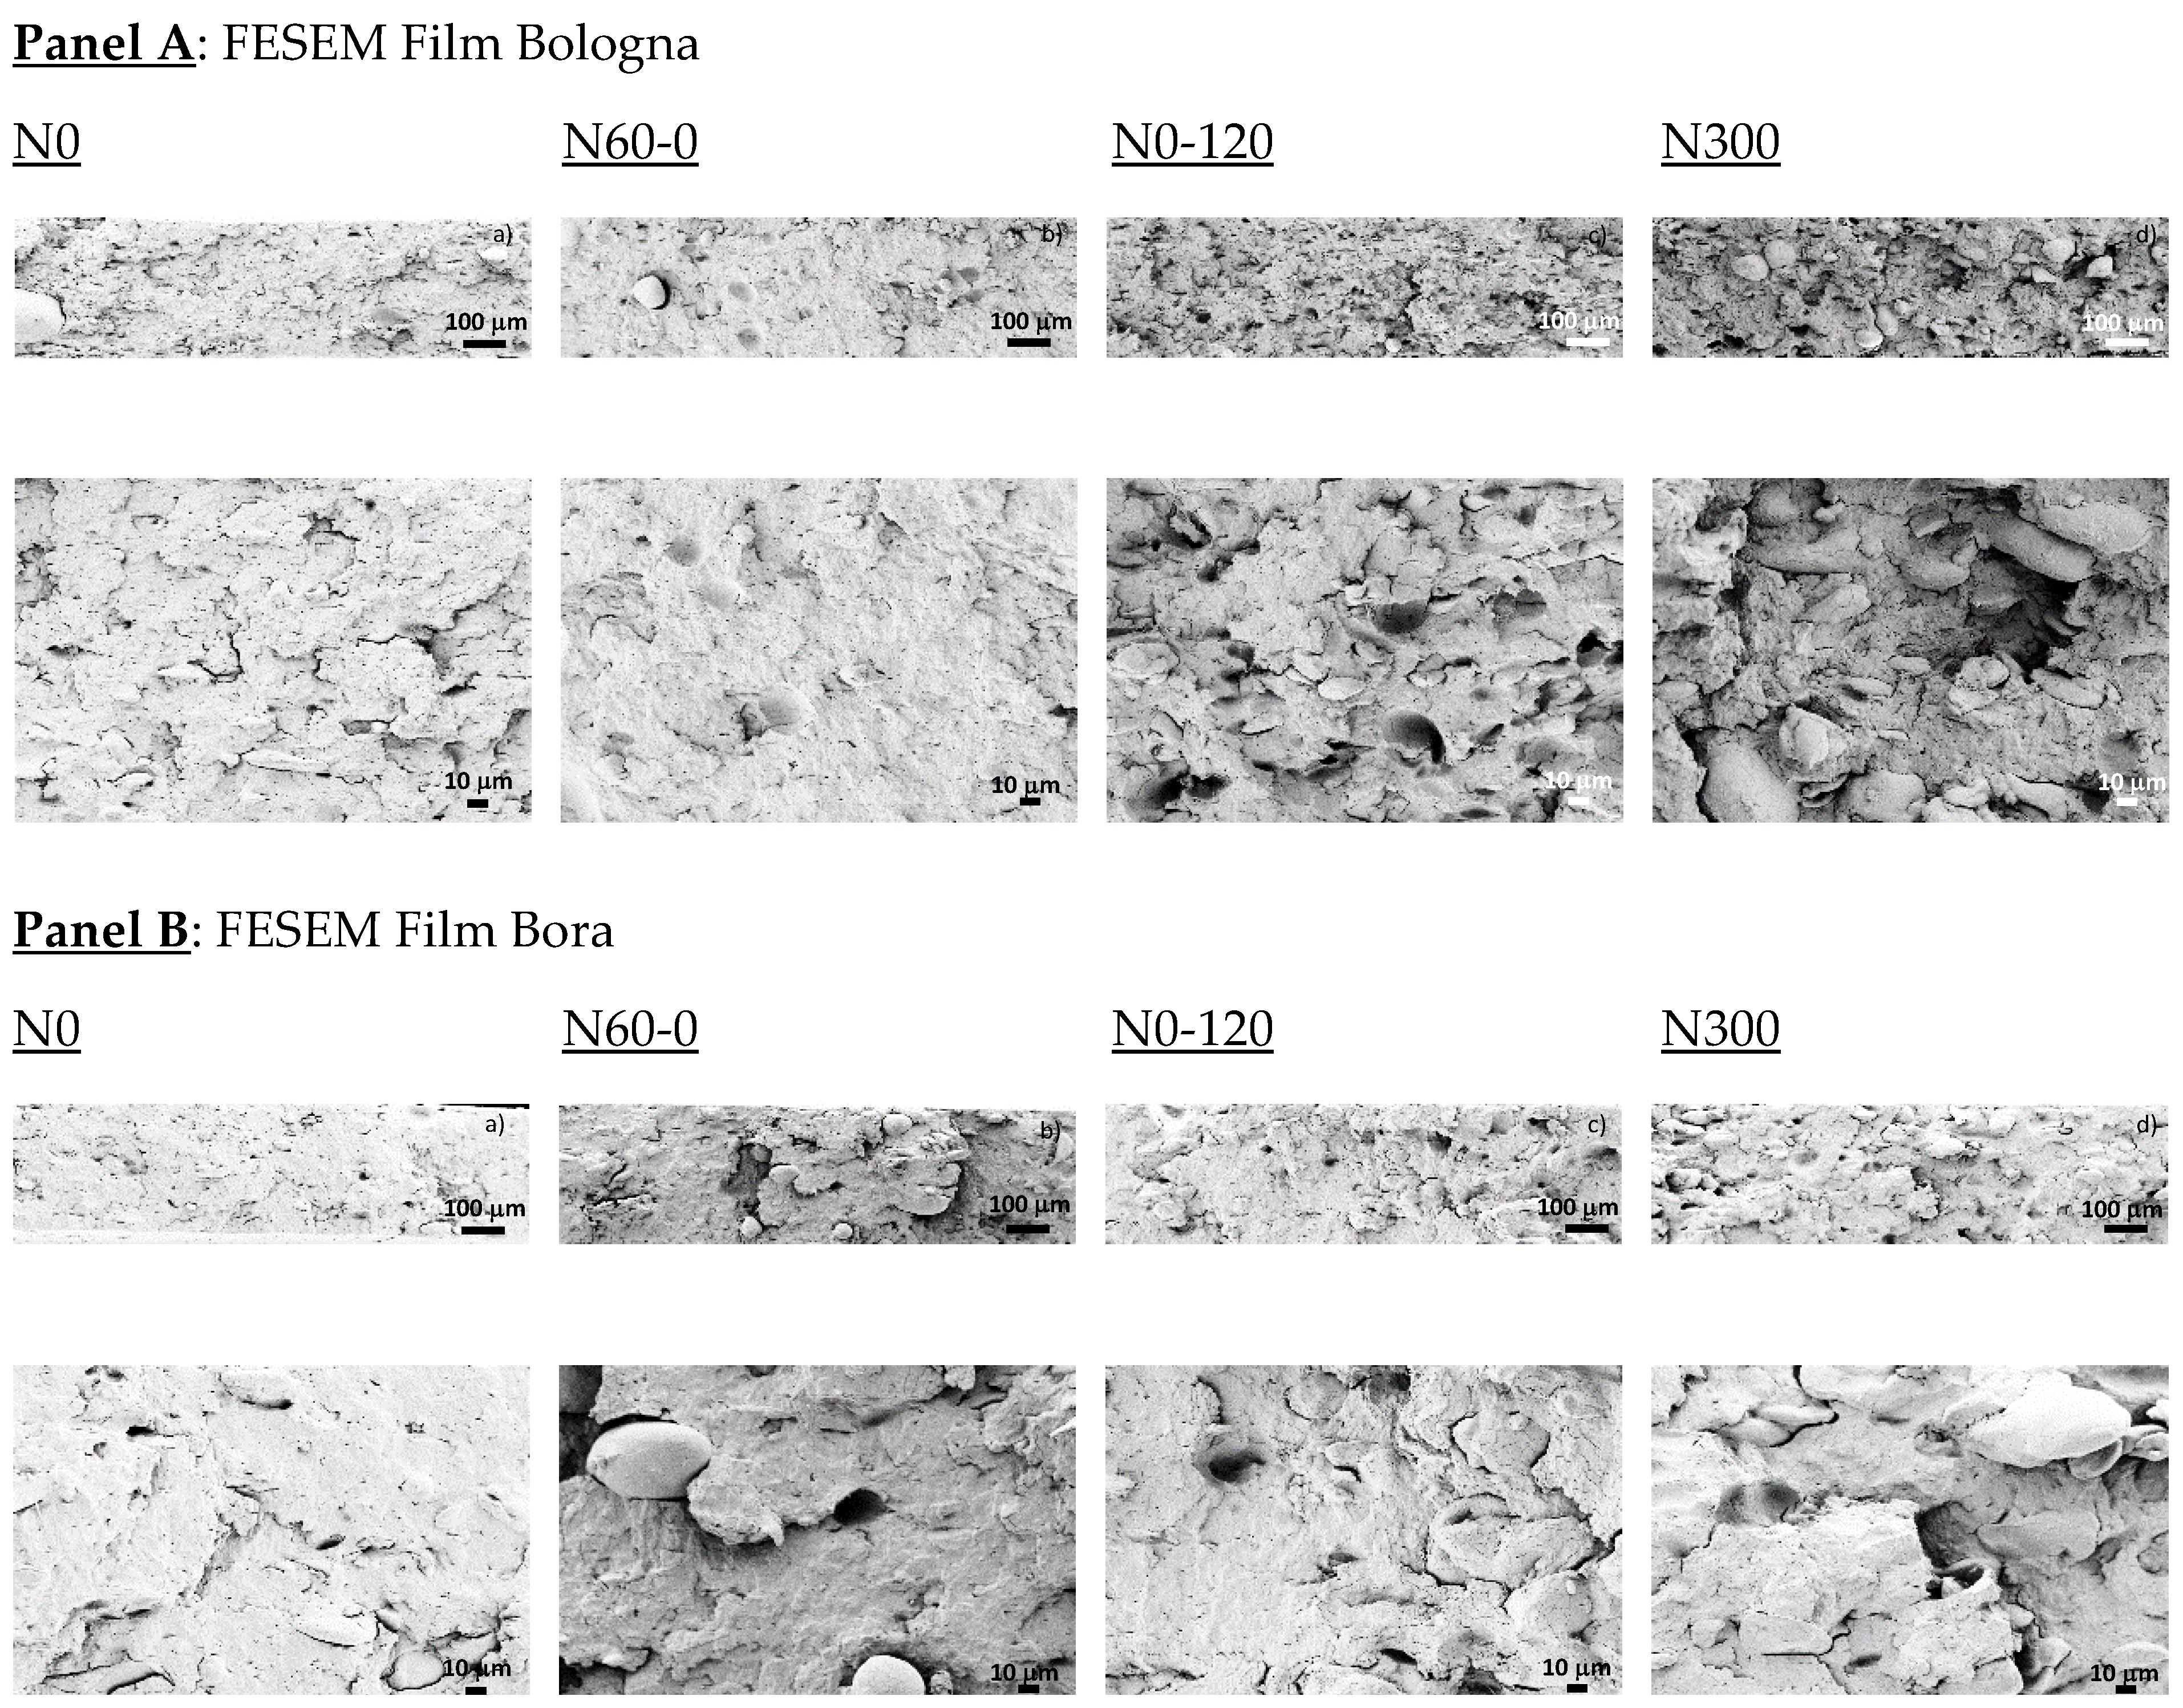
2.6. Plasticization, Filming, and Measurements on Films

Plasticization of the flour samples was performed with an Xplore Microcompounder 5 and 15 cc extruder (DSM, Sittard, The Netherlands) by using suitable amounts of glycerol, water, and other additives to facilitate the process: flour (68%, w/w), glycerol (23%, w/w), PVA in aqueous solution PVA/water 1:20 (2%, w/w), sorbitol (5.2%, w/w), and magnesium stearate (1.8%, w/w). The different contents of additives were chosen regardless of the specific characteristics of the wheat flour and applied for all flours without any variation, in order to establish a comparative set of samples. Thermoplastic films were formed by using a microfilm die for cast film (DSM Film Device). All the materials were firstly mixed at low speed in a laboratory mixer (planetary mixer, 60 rpm for 3 min), then the mix was introduced into the extruder and a further mixing was obtained at 120 rpm for 6 min. A temperature profile of 135–140–145 °C was selected for the three areas of the extruder, i.e., feeding, metering, and die, according to Puglia et al. (2015) [4], who found that this profile was the most suitable for the mechanical characteristics (deformability and strain-to-break) of films. The films had an average thickness of 300 ± 50 μm.

2.7. Tensile Properties of Produced Films

The mechanical properties of different films tested were measured in tensile mode by adopting the standard method UNI ISO 527. The different samples were cut into strips with a test dimension of 50 mm × 10 mm and conditioned for 48 h at 23 ± 2 °C and 50% RH before tests. The tensile tests were performed by using a universal test machine (Lloyd L30K) analyzer with a 5 N load cell. Initial gauge length was set to 25 mm. The film strips were tested at a crosshead speed of 5 mm/min. Different parameters, such as elastic modulus, tensile strength, and elongation at break, were determined. Ten replicates for each formulation have been considered.

2.8. Statistical Analysis

Gluten content and absolute values of gluten subunits are reported as the means of two analytical replicates with standard errors. For ratios between gluten subunits, since analytical replicates of glutenins and gliadins were obtained from different extracts run on different gels, any association of a replicate of glutenins with a replicate of gliadins would be arbitrary. For this reason, the associated error (ΔX1/X2) was computed by using a standard formula from the error propagation theory in a ratio [21], i.e., ΔX1/X2 = [(X1 ΔX2) + (X2 ΔX1)]/X22.
Data of mechanical tests were analyzed by analysis of variance (ANOVA) using the Statgraphics Plus 5.1. Program (Manugistics Corp. Rockville, MD, USA). To differentiate samples, Fisher’s least significant difference (LSD) was used at the 95% confidence level.

3. Results and Discussion

Table 1 summarizes the values of gluten content and alveographic parameters of flours obtained from grains harvested in the eight treatments (2 cultivars × 4 N fertilization treatments).
In both cultivars, the gluten content, as well as the W and L, were low in N60-0 and N0 and extremely high in N0-120, while N300 showed intermediate (but high in absolute) values. Differences in alveographic parameters between fertilization treatments were much greater than expected from the literature for a similar cultivar in the same environment and year. However, these differences appear to be in agreement with the differences observed in the gluten content (Table 1) and in the absolute and relative abundances of the different gluten subunits and gel bands (Table 2).
Differences among N fertilization treatments in the absolute values of gluten subunits were remarkable in many cases. However, differences among N fertilization treatments in the glutenins/gliadins ratio (to be calculated from data in Table 2) were not very relevant or consistent for the two cultivars, except for a higher total glutenins/total gliadins ratio and a higher total LMW-GS/total gliadins ratio in treatment N60-0. However, any ratio between subunits and gel bands reported in Table 2 deserves to be considered for possible effects on the baking properties of flours and mechanical properties of derived thermoplastics. Although any regrouping of fractions and bands might be arbitrary and needs to be further evaluated, some general trends seem to be worth highlighting, as suggested from ratios reported in Table 3.
For example, in both cultivars, the ratio between total HMW-GS and total LMW-GS was lower in N0 and N60-0 than in N300, while the ratio between total HMW-GS and the bands 1+2+3 of LMW-GS was higher in N0 and N60-0 and the lowest in N0-120. Among the HMW-GS, in both cultivars, the ratios between the upper three bands (i.e., 2*+5+7 in Bologna, 1+5+7 in Bora) and the lower two bands (8+10) were markedly higher in N0 and N60-0 and the lowest in N0-120. Among the LMW-GS, in both cultivars, the ratio between the upper bands (1+2+3) and the lower bands (4+5+6) was low in N0 and N60-0 and the highest in N0-120. Among gliadins, ω-gliadins and the ratio between them and the other gliadins were low in N0 and N60-0 and much higher in N0-120. Interestingly, the more ω-gliadins are expressed, the laxer the gluten is, since this group of gliadins acts as a chain terminator [22]. Thus, data suggest that very late fertilization favors the accumulation of molecules with intermediate molecular weight (i.e., lower bands of HMW-GS, upper bands of LMW-GS and ω-gliadins). This trend would be in agreement with [11,12] and with the very high extensibility of the dough (L) observed in the alveograph test of treatment N0-120 (Table 1). For most of the aforementioned ratios, N300 showed intermediate values between those of N0 and N60-0 and those of N0-120.
Although effects of treatments were generally consistent for the two cultivars, some differences between cultivars were observed, which merits consideration of the different genetic and physiological traits. Among these, the band 2* of HMW-GS in Bologna (with respect to the band 1 of HMW-GS in Bora) would be responsible for the better baking properties (i.e., the higher values of alveographic paramenters) of this cultivar [23]. In addition, the very different grain size (50 mg for Bora vs. 35 mg for Bologna) might explain the different accumulation dynamics and timing for gluten subunits having different molecular weight. However, FESEM images of native flours did not show substantial differences in gluten accumulation between cultivars (Figure 1).
They only revealed differences among N treatments in the amount of proteins around starch granules, which was greater in the well-N-fed and late N-fed treatments (N300 and N0-120, respectively), confirming findings by Uthumporn et al. [24]. In these FESEM images, unfractionated starch granules appear to have a classic bimodal pattern, with large granules surrounded by small granules [25], but no appreciable dimensional differences among treatments can be observed, although these cannot be excluded in view of a lack of an adequate number of replicated images per treatment (Figure 1).
The TG/DTG curves of flours (Figure 2) presented two main peaks, the first one related to water evaporation, the second, centered at 300 °C, corresponding to starch decomposition [26]. The maximum degradation rate at the second peak temperature was higher, for both cultivars, in treatments never or early/little fertilized (N0 and N60-0) and lower in treatments constantly or late/well fertilized (N300 and N0-120) (Figure 2a,c), whereas an opposite ranking of treatments was observed for the residual weight at the end of the test (900 °C) (Figure 2b,d).
Our evidence is not easy to discuss based on the very scarce literature on this subject. A first claim would be that the thermal stability of flours from treatments having increased amount of proteins, due to constantly high or late N availability (i.e., N300 and N0-120), is reduced. Being the thermal degradation of starch superimposed on gluten decompositions [27,28], the contribution of the two components to the main peak profile cannot be easily distinguished. Thermal degradation of the two components (protein and starch in wheat flour) mainly involves breaking of the covalent peptide bonds in the amino acid residues and cleavage of S–S, O–N, and O–O linkages from protein molecules, as well as the removal of polyhydroxyl groups from starch. In any case, our hypothesis is that total protein content is not the only aspect affecting the output. Li et al. [27] reported a lower degradation temperature for flours with higher glutenin and lower gliadin/glutenin ratio [29], which substantially supports our findings, although our further splitting of gluten fractions (Table 2 and Table 3) would deserve to be considered. Higher thermal stability could be correlated to the spherical dimension of gliadins, inducing the chemical bonds to break and protein molecular chains to stretch [30]. According to Khatkar et al. [31], the residual mass changes provided information about the variations in the gluten structure with an increase in weight loss, suggesting the creation of a more open and weak gluten structure.
The tensile properties of thermoplastic films derived from flours of the eight experimental treatments are shown in Figure 3 and Table 4. As a general trend, Bologna showed higher σb, lower εb, and higher E values. Within each cultivar, the highest εb values of films were obtained with flours from the unfertilized treatment (N0), followed by the low and early fertilized treatment (N60-0), then the late fertilized treatment (N0-120) and, finally, the always well-fertilized treatment (N300). Thus, the εb would appear to be inversely correlated with crop N availability and total gluten content of the flour. The σb was less variable among N treatments; however, in both cultivars, it was high in N0 and N300 and appreciably lower in N0-120. Overall, based on the three tensile parameters, the best mechanical performance was obtained with flours characterized by a good balance of gluten subunits, i.e., those obtained from the crop not subjected to imbalances in N nutrition, independent of low or high N availability (N0, N300). It seems worth clarifying that the mechanical behavior of a thermoplastic film can be considered satisfying depending on the specific selected application, which could require alternatively high tensile strength or high deformability. In all cases, these properties are strongly correlated to the selection of a specific plasticizer that can finely tune the overall response. However, within the range of values obtained in this experiment with glycerol, higher values of σb and E can be considered desirable.
Results on tensile properties and alveographic parameters obtained in this experiment appear to be in conflict with the results of Benincasa et al. [2], where the maximum σb, εb, and E of flours in the same group of Bologna and Bora (i.e., those having P > 60, P/L ≥ 0.43, and W > 170) were positively correlated to P and negatively correlated to P/L and W. However, it must be pointed out that the work by Benincasa et al. [2] investigated the effect on tensile properties of plastic films from several cultivars all grown under a similar N fertilization schedule providing normal crop N feeding (i.e., quite high and constant throughout the growing cycle), while this work was carried out on purpose for investigating the effect of extreme differences and imbalances in N nutrition of a same cultivar, just to point out that bioplastic engineering needs to take into consideration the variability of biological source material. Moreover, in the present work, further considerations may be drawn based on both the abundances and the allelic variability of the different gluten subunits, which likely play a role [32,33,34].
Finally, N fertilization schedule might affect not only the protein component of flours but also the integrity of starch granules, since the amount and structure of the protein matrix surrounding starch granules might imply a different breaking of granules during milling. In this regard, it is worth noting that Bora and Bologna have different content in puroindolines, which are starch membrane proteins. Bora contains both puroindoline A and B wild type, while Bologna has only puroindoline B. This might have differently affected the integrity of starch granules during milling with consequent differences in starch plasticization. Furthermore, different N availability might have caused differences in starch granule number, size, shape, and composition, but this could not be ascertained in this work.
Of course, N fertilization in soft wheat is normally scheduled to increase crop yield and bread-making quality while limiting environmental impact; thus, cultivation practice is generally aimed at guaranteeing a good and constant N nutrition. However, the need to limit economic and environmental N fertilization costs, as well as extreme climatic events, such as unusual heavy rainfall occurring early or late in the growing season, may give rise to more and more frequent situations of N deficiency or imbalances (e.g., early N availability followed by severe N deficiency or late N availability after severe early N deficiency, i.e., our treatments N60-0 or N0-120, respectively).
The results obtained with the mechanical characterization are consistent with the morphological analysis of the fracture surfaces of the plasticized flour films obtained with FESEM micrographs (Figure 4). The films obtained from both Bologna (Panel A) and Bora (Panel B) flours show differences among N fertilization treatments that can be accounted for by the different gluten and starch content and composition. In particular, in the case of Bora (Figure 4, Panel B), the films of N0 and 60-0 have a rough fractured surface. Films of N0-120 are less wrinkled and show a more heterogeneous matrix, with smooth and fragile sections, alternating rough and deformable parts in which small and poorly interfaced starch granules are incorporated. The surface of N300 is less rough; starch granules are well-interfaced with the relatively smooth plasticized matrix, typical of brittle fractures. In the case of Bologna (Figure 4, Panel A), it is evident that in films of N0 and N60-0, the plasticization occurred properly, with homogenized sample surface and limited presence of poorly hydrated starch granules. On the other hand, the increased amount of protein matrix in N0-120 and N300 made the incorporation of granules less uniform, with the presence of some intact starch granules and few small cracks in the matrix. The presence of different gluten content and composition is likely responsible for differences in surface roughness and the presence of agglomerates and cracks that might have been formed during the extrusion and filming process at a different level, involving partial or complete destructuring of starch granules. In general, a homogeneous surface without cracks and with small, agglomerated particles indicates a strong interfacial adhesion between the protein and the thermoplastic matrix.
Given the lack of literature, any comment on the effect of absolute and relative abundances of gluten fractions would represent speculation. In any case, it is worth repeating that, in both cultivars, compared to the constantly well-fertilized treatment (N300), unfertilized or little and early fertilized treatments (N0 and N60-0) had a lower protein content and a prevalence of the upper bands of HMW-GS, while the late fertilized treatment (N0-120) had higher protein content and prevalence of lower bands of HMW-GS, upper bands of LMW-GS, and gliadins. The constantly well-fertilized treatment (N300) had high protein content and more balanced proportions of gluten subunits. In addition, differences in the size and shape of starch granules might have been caused by the different amount and timing of N availability, which would help explain differences in derived thermoplastic films [31,35,36,37], but this aspect will need further investigation.

4. Conclusions

Our results demonstrate that the tensile properties of thermoplastic films derived from wheat flours greatly depend on the cultivar and the crop nitrogen availability due to their effect on the protein content and on the absolute and relative abundances of gluten fractions. Differences among N fertilization treatments in gluten composition and alveographic parameters were extremely marked and greater than expected, giving rise to differences in the tensile properties of thermoplastic films. As a general trend, Bologna showed higher σb, lower εb, and higher E values than Bora. Within each cultivar, the highest εb values of films were obtained with flours from the unfertilized treatment (N0), followed by the low/early fertilized treatment (N60-0), then the late fertilized treatment (N0-120) and, finally, the always well-fertilized treatment (N300). Thus, the εb appeared to be inversely correlated with crop N availability and total gluten content of the flour. The σb was less variable among N treatments; however, in both cultivars, it was high in the flours from N0 and N300. Overall, the best mechanical performance was obtained with flours characterized by a good balance of gluten subunits, i.e., those obtained from the crop not subjected to imbalances in N nutrition, independent of low or high N availability (N0, N300). Our work demonstrates that bioplastic engineering needs to take into consideration the variability of biological source material like that caused by different N availability, since the crop may be subjected to different N fertilization schedules (N form, N rate, and application timing) and, moreover, imbalances in N nutrition, although not desired, may occur as a consequence of the need to limit economic and environmental N fertilization costs, as well as due to extreme climatic events such as unusual heavy rainfall occurring early or late in the growing season.

Author Contributions

Conceptualization, P.B., D.P.; methodology, P.B., D.P., F.D., F.L., C.G., L.G.; formal analysis, F.D., F.L., C.G., E.G., G.T.; investigation, P.B., D.P., F.D., F.L., C.G., L.G., E.G., G.T.; resources, P.B., D.P., C.G.; data curation, P.B., D.P., F.D., F.L., C.G., L.G., G.T.; writing—original draft preparation P.B., D.P., F.D.; writing—review and editing, P.B., D.P.; supervision, P.B., D.P.; project administration, P.B., D.P.; funding acquisition, P.B., D.P. All authors have read and agreed to the published version of the manuscript.

Funding

This research was not supported by any specific project.

Institutional Review Board Statement

Not applicable.

Informed Consent Statement

Not applicable.

Data Availability Statement

The data that support the findings of this study can be made available on request by the corresponding author.

Acknowledgments

We gratefully acknowledge the Agenzia per i Servizi nel Settore Agroalimentare delle Marche, ASSAM, for milling the grains and performing Chopin’s alveograph tests at their own expense.

Conflicts of Interest

The authors declare no conflict of interest.

References

  1. Leblanc, N.; Saiah, R.; Beucher, E.; Gattin, R.; Castandet, M.; Saiter, J.-M. Structural investigation and thermal stability of new extruded wheat flour based polymeric materials. Carbohydr. Polym. 2008, 73, 548–557. [Google Scholar] [CrossRef] [PubMed]
  2. Benincasa, P.; Dominici, F.; Bocci, L.; Governatori, C.; Panfili, I.; Tosti, G.; Torre, L.; Puglia, D. Relationships between wheat flour baking properties and tensile characteristics of derived thermoplastic films. Ind. Crops Prod. 2017, 100, 138–145. [Google Scholar] [CrossRef]
  3. Dominici, F.; Luzi, F.; Benincasa, P.; Torre, L.; Puglia, D. Biocomposites based on plasticized wheat flours: Effect of bran content on thermomechanical behavior. Polymers 2020, 12, 2248. [Google Scholar] [CrossRef]
  4. Puglia, D.; Dominici, F.; Kenny, J.M.; Santulli, C.; Governatori, C.; Tosti, G.; Benincasa, P. Tensile behavior of thermoplastic films from wheat flours as function of raw material baking properties. J. Polym. Environ. 2015, 24, 37–47. [Google Scholar] [CrossRef]
  5. Day, L. 10-Wheat gluten: Production, properties and application. In Handbook of Food Proteins, Woodhead Publishing Series in Food Science, Technology and Nutrition; Phillips, G.O., Williams, P.A., Eds.; Woodhead Publishing: Sawston, UK, 2011; pp. 267–288. [Google Scholar] [CrossRef]
  6. Foca, G.; Ulrici, A.; Corbellini, M.; Pagani, M.A.; Lucisano, M.; Franchini, G.C.; Tassi, L. Reproducibility of the Italian ISQ method for quality classification of bread wheats: An evaluation by expert assessors. J. Sci. Food Agric. 2007, 87, 839–846. [Google Scholar] [CrossRef]
  7. Khatkar, B.S.; Barak, S.; Mudgil, D. Effects of gliadin addition on the rheological, microscopic and thermal characteristics of wheat gluten. Int. J. Biol. Macromol. 2013, 53, 38–41. [Google Scholar] [CrossRef] [PubMed]
  8. Bonciarelli, U.; Onofri, A.; Benincasa, P.; Farneselli, M.; Guiducci, M.; Pannacci, E.; Tosti, G.; Tei, F. Long-term evaluation of productivity, stability and sustainability for cropping systems in Mediterranean rainfed conditions. Eur. J. Agron. 2016, 77, 14655. [Google Scholar] [CrossRef]
  9. Slafer, G.A.; Savin, R.; Sadras, V.O. Coarse and fine regulation of wheat yield components in response to genotype and environment. Field Crops Res. 2014, 157, 71–83. [Google Scholar] [CrossRef]
  10. Dupont, F.M.; Altenbach, S.B. Molecular and biochemical impacts of environmental factors on wheat grain development and protein synthesis. J. Cereal Sci. 2003, 38, 133–146. [Google Scholar] [CrossRef]
  11. De Santis, M.A.; Giuliani, M.M.; Flagella, Z.; Reyneri, A.; Blandino, M. Impact of nitrogen fertilisation strategies on the protein content, gluten composition and rheological properties of wheat for biscuit production. Field Crops Res. 2020, 254, 107829. [Google Scholar] [CrossRef]
  12. Blandino, M.; Visioli, G.; Marando, S.; Marti, A.; Reyneri, A. Impact of late-season N fertilisation strategies on the gluten content and composition of high protein wheat grown under humid Mediterranean conditions. J. Cereal Sci. 2020, 94, 102995. [Google Scholar] [CrossRef]
  13. Guiducci, M.; Tosti, G.; Falcinelli, B.; Benincasa, P. Sustainable management of nitrogen nutrition in winter wheat through temporary intercropping with legumes. Agron. Sustain. Dev. 2018, 38, 31. [Google Scholar] [CrossRef] [Green Version]
  14. Tosti, G.; Farneselli, M.; Benincasa, P.; Guiducci, M. Nitrogen fertilization strategies for organic wheat production: Crop yield and nitrate leaching. Agron. J. 2016, 108, 770–781. [Google Scholar] [CrossRef] [Green Version]
  15. Benincasa, P.; Reale, L.; Cerri, M.; Tedeschini, E.; Tosti, G.; Falcinelli, B.; Rosati, A. Nitrogen fertilization levels and timing affect the plasticity of yield components in bread wheat (Triticum aestivum L.). Field Crops Res. 2022, 289, 108734. [Google Scholar] [CrossRef]
  16. Roman-Gutierrez, A.D.; Guilbert, S.; Cuq, B. Description of Microstructural Changes in Wheat Flour and Flour Components during Hydration by using Environmental Scanning Electron Microscopy. LWT 2002, 35, 730–740. [Google Scholar] [CrossRef]
  17. American Association of Cereal Chemists. 38-12, Wet Gluten, Dry Gluten, Water-Binding Capacity, and Gluten Index. In Approved Methods of Analysis, 11th ed.; AACC International: St. Paul, MN, USA, 2010. [Google Scholar]
  18. Pogna, N.E.; Autran, J.C.; Mellini, F.; Lafiandra, D.; Feillet, P. Chromosome 1B-encoded gliadins and glutenin subunits in durum wheat: Genetics and relationship to gluten strength. J. Cereal Sci. 1990, 11, 15–34. [Google Scholar] [CrossRef]
  19. Payne, P.I.; Lawrence, G.J. Catalogue of alleles for the complex gene loci, Glu-A1, Glu-B1, and Glu-D1 which code for high-molecular-weight subunits of glutenin in exaploidy wheat. Cereal Res. Commun. 1983, 11, 29–35. [Google Scholar]
  20. Bushuk, W.; Zillman, R.R. Wheat cultivar identification by gliadin electrophoregrams, I. Apparatus, method and nomenclature. Can. J. Plant Sci. 1978, 58, 505–515. [Google Scholar] [CrossRef]
  21. Ku, H.H. Notes on the use of propagation of error formulas. J. Res. Natl. Bur. Stand. 1966, 70, 263. [Google Scholar] [CrossRef]
  22. Altenbach, S.B.; Chang, H.-C.; Yu, X.B.; Seabourn, B.W.; Green, P.H.; Alaedini, A. Elimination of Omega-1,2 gliadins from bread wheat (Triticum aestivum) flour: Effects on immunogenic potential and end-use quality. Front. Plant Sci. 2019, 10, 580. [Google Scholar] [CrossRef]
  23. Pogna, N.E.; Mellini, F.; Beretta, A.; Dal Belin Peruffo, A. The high-molecular-weight glutenin subunits of common wheat cultivars grown in Italy. J. Genet Breed. 1989, 43, 17–24. [Google Scholar]
  24. Uthumporn, U.; Karim, A.A.; Fazilah, A. Defatting improves the hydrolysis of granular starch using a mixture of fungal amylolytic enzymes. Ind. Crops Prod. 2013, 43, 441–449. [Google Scholar] [CrossRef]
  25. Kumar, R.; Khatkar, B.S. Thermal, pasting and morphological properties of starch granules of wheat (Triticum aestivum L.) varieties. J. Food Sci. Technol. 2017, 54, 2403–2410. [Google Scholar] [CrossRef] [PubMed]
  26. Liu, X.; Wang, Y.; Yu, L.; Tong, Z.; Chen, L.; Liu, H.; Li, X. Thermal degradation and stability of starch under different processing conditions. Starch-Stärke 2013, 65, 48–60. [Google Scholar] [CrossRef]
  27. Li, M.; Yue, Q.; Liu, C.; Zheng, X.; Hong, J.; Li, L.; Bian, K. Effect of gliadin/glutenin ratio on pasting, thermal, and structural properties of wheat starch. J. Cereal Sci. 2020, 93, 102973. [Google Scholar] [CrossRef]
  28. Wang, Z.; Ma, S.; Sun, B.; Wang, F.; Huang, J.; Wang, X.; Bao, Q. Effects of thermal properties and behavior of wheat starch and gluten on their interaction: A review. Int. J. Biol. Macromol. 2021, 177, 474–484. [Google Scholar] [CrossRef]
  29. Lagrain, B.; Thewissen, B.G.; Brijs, K.; Delcour, J.A. Mechanism of gliadin–glutenin cross-linking during hydrothermal treatment. Food Chem. 2008, 107, 753–760. [Google Scholar] [CrossRef]
  30. Ma, S.; Han, W.; Li, L.; Zheng, X.; Wang, X. The thermal stability, structural changeability, and aggregability of glutenin and gliadin proteins induced by wheat bran dietary fiber. Food Funct. 2019, 10, 172–179. [Google Scholar] [CrossRef]
  31. Khatkar, B.S.; Bell, A.E.; Schofield, J.D. The dynamic rheological properties of glutens and gluten sub-fractions from wheats of good and poor bread making quality. J. Cereal Sci. 1995, 22, 29–44. [Google Scholar] [CrossRef]
  32. Muneer, F.; Andersson, M.; Koch, K.; Hedenqvist, M.S.; Gällstedt, M.; Plivelic, T.S.; Menzel, C.; Rhazi, L.; Kuktaite, R. Innovative gliadin/glutenin and modified potato starch green composites: Chemistry, structure, and functionality induced by processing. ACS Sustain. Chem. Eng. 2016, 4, 6332–6343. [Google Scholar] [CrossRef]
  33. Wieser, H. Chemistry of gluten proteins. Food Microbiol. 2007, 24, 115–119. [Google Scholar] [CrossRef] [PubMed]
  34. Yu, X.; Chen, X.; Wang, L.; Yang, Y.; Zhu, X.; Shao, S.; Cui, W.; Xiong, F. Novel insights into the effect of nitrogen on storage protein biosynthesis and protein body development in wheat caryopsis. J. Exp. Bot. 2017, 68, 2259–2274. [Google Scholar] [CrossRef] [PubMed]
  35. Ni, Y.; Wang, Z.; Yin, Y.; Li, W.; Yan, S.; Cai, T. Starch granule size distribution in wheat grain in relation to phosphorus fertilization. J. Agric. Sci. 2012, 150, 45–52. [Google Scholar] [CrossRef]
  36. Ottenhof, M.A.; Farhat, I.A. Starch retrogradation. Biotechnol. Genet. Eng. Rev. 2004, 21, 215–228. [Google Scholar] [CrossRef] [PubMed] [Green Version]
  37. Tanetrungroj, Y.; Prachayawarakorn, J. Effect of starch types on properties of biodegradable polymer based on thermoplastic starch process by injection molding technique. Songklanakarin J. Sci. Technol. 2015, 37, 193–199. [Google Scholar]
Figure 1. Field Emission Scanning Electron Microscopy (FESEM) images at two different magnifications of wheat flours for the two cultivars Bologna (Panel A) and Bora (Panel B) grown under four nitrogen fertilization schedules: (N0) (a), (N60-0) (b), (N0-120) (c), and (N300) (d). N0: unfertilized control; N60-0: N-fed only very early with 60 kg N ha−1; N0-120: N-fed only extremely late (i.e., at pollination) with 120 kg N ha−1; N300: continuously N-fed with five applications of 60 kg N ha−1 for a total of 300 kg ha−1. Red arrows identify starch granules, while white arrows identify the protein matrix.
Agronomy 13 00697 g001
Figure 2. Thermogravimetric analysis (TGA) of wheat flour for the two cultivars Bologna (a,b) and Bora (c,d) grown under four nitrogen fertilization schedules (N0, N60-0, N0-120, N300). N0: unfertilized control; N60-0: N-fed only very early with 60 kg N ha−1; N0-120: N-fed only extremely late (i.e., at pollination) with 120 kg N ha−1; N300: continuously N-fed with five applications of 60 kg N ha−1 for a total of 300 kg ha−1. DTG: derivative thermogravimetry.
Agronomy 13 00697 g002
Figure 3. Stress–strain curves of tensile tests carried out on plasticized films obtained from wheat flours of two cultivars, Bologna (left) and Bora (right), grown under four nitrogen fertilization schedules (N0, N60-0, N0-120, N300). N0: unfertilized control; N60-0: N-fed only very early with 60 kg N ha−1; N0-120: N-fed only extremely late (i.e., at pollination) with 120 kg N ha−1; N300: continuously N-fed with five applications of 60 kg N ha−1 for a total of 300 kg ha−1. σb: tensile strength at break; εb: elongation at break.
Agronomy 13 00697 g003
Figure 4. Field Emission Scanning Electron Microscopy (FESEM) images at two different magnifications of plasticized films from wheat flours of the two cultivars, Bologna (Panel A) and Bora (Panel B), grown under four different nitrogen fertilization schedules: (N0) (a), (N60-0) (b), (N0-120) (c), and (N300) (d). N0: unfertilized control; N60-0: N-fed only very early with 60 kg N ha−1; N0-120: N-fed only extremely late (i.e., at pollination) with 120 kg N ha−1; N300: continuously N-fed with five applications of 60 kg N ha−1 for a total of 300 kg ha−1.
Agronomy 13 00697 g004
Table 1. Humidity, gluten content (standard error in brackets), and Chopin’s alveograph parameters (as described by Puglia et al. [4]) of flours obtained from grains of the two soft wheat cultivars (Bora and Bologna) grown under four nitrogen fertilization schedules (N0, N60-0, N0-120, N300). N0: unfertilized control; N60-0: N-fed only very early with 60 kg N ha−1; N0-120: N-fed only extremely late (i.e., at pollination) with 120 kg N ha−1; N300: continuously N-fed with five applications of 60 kg N ha−1 for a total of 300 kg ha−1. The reported values are the mean outputs of five replicated alveograms as provided by the alveograph, without SD values. d.m.: dry matter.
CultivarN TreatmentHumidity (%)Gluten Content
(% d.m.)
PLWP/L
Bologna014.26.02 (0.03)72782150.92
60-014.54.54 (0.04)88431662.05
0-12015.612.75 (0.01)742025390.37
30015.810.00 (0.11)96953801.01
Bora014.76.31 (0.01)83592001.41
60-014.35.30 (0.04)105321453.28
0-12015.613.14 (0.9)841403610.60
30015.59.93 (0.06)791142770.69
Table 2. Pixel volumes (×103) of wheat gluten fractions for the flours of the two cultivars (Bora and Bologna) grown under four nitrogen fertilization schedules (N0, N60-0, N0-120, N300). N0: unfertilized control; N60-0: N-fed only very early with 60 kg N ha−1; N0-120: N-fed only extremely late (i.e., at pollination) with 120 kg N ha−1; N300: continuously N-fed with five applications of 60 kg N ha−1 for a total of 300 kg ha−1. SE: Standard error/errors.
FractionsBandsN0N60-0N0-120N300
MeanSEMeanSEMeanSEMeanSE
Bologna
HMW-GS2 *11.52.39.00.918.22.017.31.5
545.34.246.40.759.112.567.85.6
781.48.582.81.882.19.492.16.4
89.82.97.20.635.03.920.94.5
1033.75.434.30.955.95.456.48.1
Tot181.723.3179.70.4250.429.2254.626.2
LMW-GS123.00.324.00.6100.06.471.615.3
2 + 391.915.197.55.5174.912.5150.76.4
4 + 5521.12.8536.238.0584.129.7550.812.3
660.918.958.58.483.27.585.311.6
Tot696.930.8716.223.5942.256.0858.445.7
Gliadinsω158.419.1144.59.3366.816.6320.825.9
γ274.830.5266.98.9320.036.1400.935.3
α + β317.542.4290.132.6660.3170.5693.078.1
Tot750.691.9701.614.51347.2223.21414.8139.3
Bora
HMW-GS117.92.622.71.546.40.039.12.9
545.73.757.33.184.61.479.23.6
749.52.962.13.986.01.383.55.1
810.70.315.31.439.00.531.00.7
1034.90.246.22.480.62.267.14.5
Tot158.89.3203.612.3336.64.5300.09.6
LMW-GS118.82.831.26.397.215.044.13.7
2 + 379.87.3118.315.2281.245.1182.511.2
4 + 5254.021.5317.426.4411.258.5311.927.2
6195.542.6242.060.6269.510.0187.613.5
Tot548.274.1708.8108.51059.0108.6726.155.6
Gliadinsω152.327.8118.79.2382.269.9179.82.8
γ241.927.7210.313.2258.218.5215.56.3
α + β419.090.4342.550.5815.053.4577.43.6
Tot813.2145.8671.572.81455.4141.8972.812.7
MEANS OF TOTALS (CV confounded)
HMW-GSTot170.212.2191.78.6293.527.7277.317.4
LMW-GSTot622.654.0712.545.41000.660.2792.348.2
GliadinsTot781.972.7686.631.51401.3112.41193.8139.8
HMW-GS = high-molecular-weight glutenin subunits. LMW-GS = low-molecular-weight glutenin subunits. The * in the band 2* means it is expressed by the genome A.
Table 3. Tentative ratios between gluten fractions for the flours of the two wheat cultivars (Bologna and Bora) grown under four nitrogen fertilization schedules (N0, N60-0, N0-120, N300). N0: unfertilized control; N60-0: N-fed only very early with 60 kg N ha−1; N0-120: N-fed only extremely late (i.e., at pollination) with 120 kg N ha−1; N300: continuously N-fed with five applications of 60 kg N ha−1 for a total of 300 kg ha−1. The ratios are calculated from mean values reported in Table 2. SE: Standard error.
Gluten FractionsN0N60-0N0-120N300
MeanSEMeanSEMeanSEMeanSE
Bologna
Total GLUTENINS/GLIADINS1.170.1531.280.0610.890.2100.790.128
Total HMW-GS/GLIADINS0.240.0610.260.0060.190.0520.180.036
Total LMW-GS/GLIADINS0.930.1551.020.0550.700.1570.610.092
Total HMW-GS/total LMW-GS0.260.0450.250.0090.270.0470.300.046
Total HMW-GS/LMW-GS (1+2+3)1.580.4061.480.0780.910.1691.150.230
HMW-GS (2*+5+7)/HMW-GS (8+10)3.180.9513.330.1701.750.3992.290.549
LMW-GS (1+2+3)/LMW-GS (4+5+6)0.200.0310.200.0200.410.0510.350.047
GLIADINS ω/(α + β + γ)0.270.0650.260.0280.370.0960.290.054
GLIADINS ω/γ0.580.1330.540.0531.150.1810.800.135
Bora
Total GLUTENINS/GLIADINS0.870.2361.360.3270.960.1711.050.081
Total HMW-GS/GLIADINS0.200.0460.300.0510.230.0260.310.014
Total LMW-GS/GLIADINS0.670.2121.060.2760.730.1460.750.067
Total HMW-GS/total LMW-GS0.290.0560.290.0610.320.0370.410.045
Total HMW-GS/LMW-GS (1+2+3)1.610.2571.360.2780.890.1531.320.130
HMW-GS (1+5+7)/HMW-GS (8+10)2.480.2072.310.2811.810.0492.060.139
LMW-GS (1+2+3)/LMW-GS (4+5+6)0.220.0540.270.0800.560.1280.450.067
GLIADINS ω/(α + β + γ)0.230.0830.210.0410.360.0890.230.006
GLIADINS ω/γ0.630.1870.560.0791.480.3770.830.038
Table 4. Mechanical properties (tensile strength at break, σb; elongation at break, εb; Young’s modulus, E) of the tensile tests carried out on plasticized films obtained from wheat flours of two cultivars, Bologna (left) and Bora (right), grown under four different nitrogen fertilization schedules (N0, N60-0, N0-120, N300). N0: unfertilized control; N60-0: N-fed only very early with 60 kg N ha−1; N0-120: N-fed only extremely late (i.e., at pollination) with 120 kg N ha−1; N300: continuously N-fed with five applications of 60 kg N ha−1 for a total of 300 kg ha−1.
Source Floursσb (MPa)εb (%)E (MPa)
Bologna
N02.31 ± 0.22 c40.40 ± 6.89 b48.23 ± 2.42 b
N60-01.94 ± 0.05 ab36.69 ± 1.52 b41.33 ± 5.03 ab
N0-1201.73 ± 0.15 a33.56 ± 4.03 ab33.28 ± 7.96 a
N3002.20 ± 0.14 bc27.80 ± 2.34 a69.56 ± 9.41 c
Bora
N01.29 ± 0.17 a51.75 ± 6.75 c19.77 ± 3.53 a
N60-01.27 ± 0.17 a45.01 ± 3.87 bc22.72 ± 7.32 a
N0-1201.16 ± 0.04 a35.40 ± 3.13 ab20.40 ± 1.83 a
N3001.32 ± 0.14 a31.64 ± 6.01 a23.00 ± 2.99 a
(a–c) Different superscripts within the same column indicate significant differences among formulations for the source flour (p < 0.05).
Disclaimer/Publisher’s Note: The statements, opinions and data contained in all publications are solely those of the individual author(s) and contributor(s) and not of MDPI and/or the editor(s). MDPI and/or the editor(s) disclaim responsibility for any injury to people or property resulting from any ideas, methods, instructions or products referred to in the content.

