Article

Insight into the Boron Toxicity Stress-Responsive Genes in Boron-Tolerant Triticum dicoccum Shoots Using RNA Sequencing

1
Department of Soil Science and Plant Nutrition, Faculty of Agriculture, Selcuk University, Konya 42079, Türkiye
2
Department of Botany, Hansraj College, University of Delhi, Delhi 110007, India
3
Department of Plant Biology, Faculty of AgriSciences, Mendel University in Brno, 61300 Brno, Czech Republic
4
Department of Field Crops, Faculty of Agriculture, Selcuk University, Konya 42079, Türkiye
5
Amity Institute of Biotechnology, Amity University, Noida 201313, India
*
Author to whom correspondence should be addressed.
These authors have contributed equally to this work.
Agronomy 2023, 13(3), 631; https://doi.org/10.3390/agronomy13030631
Submission received: 18 January 2023 / Revised: 15 February 2023 / Accepted: 16 February 2023 / Published: 22 February 2023

Abstract

:
Wheat production losses due to boron (B) toxicity can be reduced by breeding and growing modern wheat cultivars with a greater tolerance to high B. However, breeding of tolerant genotypes is possible by identifying B-tolerant wheat genetic resources and understanding their underlying molecular mechanism. Triticum dicoccum, despite being one of the oldest cultivated wheat species, mostly remained neglected and has been less explored for its potential towards abiotic stresses. In this study, for the first time, we report a B-toxicity-tolerant T. dicoccum genotype, PI94655, and its transcriptomic response towards high-B treatment (10 mM B) using RNA sequencing and RT-qPCR. More than 450 genes were significantly differentially expressed in the shoots of PI94655 under high B. A total 3237 novel genes and 12,206 novel transcripts were determined in the study. AP2-EREBP, MYB, and C3H were the families with the highest percentages of differentially expressed transcription factors (TFs) under B toxicity. Interestingly, KEGG pathway photosynthesis–antenna proteins showed the most significant enrichment. The obtained results suggested potential candidate genes that can be focused on to improve wheat tolerance to high B in future breeding programs. These genes can be functionally characterized to elucidate their role in providing tolerance to high B.

1. Introduction

Most of the semi-arid and arid agrarian regions in the world suffer from boron (B) toxicity [1], which largely reduces crop production. A number of countries including the US, Türkiye, Syria, Serbia, Russia, Peru, Pakistan, Morocco, Mexico, Malaysia, Libya, Jordan, Italy, Israel, Iraq, India, Hungary, Egypt, Chile and Australia have been reported to have excessive soil B [2,3]. B-rich irrigation water and B-rich soil with reduced leaching causes precipitation of B in the topmost layer of soil, decreasing crop production [4,5]. Though the deficiency of B in crops can be dealt with the supply of B fertilizers, toxicity is difficult to handle as the washing of agricultural soil is not realistic [6]. Plants take in B through passive diffusion in deficient or sufficient B conditions, while they need borate exporters and boric acid channels to carry B under deficient and excess-B supply [7]. Crucial processes such as carbohydrate metabolism, antioxidant defense strategy, cell wall stability, cell division, and photosynthesis are influenced by excess B in plants, damaging the biochemical, physiological, and molecular mechanisms [8,9]. B toxicity not only decreases the root growth but also causes the yellowing of leaf tips along with the localized death of cells in the leaf tips [10,11].
The concentration of B in cells is maintained by different gene families, particularly borate exporters which take part in B efflux. Moreover, plant adaptation to B toxicity is enhanced with the breakdown of the mRNA of primary intrinsic protein NIP5 [12]. In roots, B efflux is regulated by BOR1 homologs that consequently control the movement of B to the shoots [7]. TaBOR1.2 is up-regulated under high B to remove surplus B out of the tissues. The wheat ortholog Ta-BOR2 is expressed to reduce the amount of root B mostly in tolerant genotypes [13]. B toxicity is suppressed through the prevention of B entrance into the xylem, which is decreased by the differential regulation of BOR4 in root tissues [14].
Wheat is one of the most broadly cultivated crops in the world, fulfilling the food demand of developed and developing countries [15]. A number of studies reported reduced wheat yields under boron toxicity [16,17,18,19,20,21,22]. The variable critical shoot boron concentrations have been reported for different wheat genotypes in different studies regulating the plants’ response to B toxicity [23,24,25,26]. The older leaves are firstly influenced by high B with necrosis and chlorosis on the leaf tips and brown lesions on different parts of the wheat plants. B toxicity decreases wheat emergence, foliation, shoot length, dry biomass, number of spikes per plant, grain weight, and yield [16,20,24,27]. Reduction in B concentrations of tissues, lessening of cellular active B, and improvement in plant biological tolerance are some of the mechanisms involved in the mitigation of boron toxicity (BT) [28]. Moreover, identifying B-tolerant genotypes and employing them in breeding programs to produce tolerant lines is another important approach to address B toxicity [28,29].
Wild wheat relatives and the available primitive forms are known to be a great resource of tolerance towards environmental stress conditions. The cultivated emmer wheat [Triticum turgidum subsp. dicoccum (Schrank) Thell.] with the AuAuBB genome and hulled grains is one of the most primitive types of cultivated crops in the world [30]. The tetraploid species developed from the domestication of wild emmer wheat (Triticum turgidum subsp. dicoccoides) around 10,000 years ago in the Karaca Dag Mountain of Türkiye [31,32]. Several studies have reported its complete genomic compatibility with durum wheat [30], making it a potential target for breeding programs. Although the T. dicoccum species is well-known for its valuable traits such as tillering, grain weight, and resistance to several biotic stresses [30], it is least explored for its tolerance towards boron (B) toxicity in soil, which is a significant agricultural problem around the world. Moreover, although several investigations focused on wheat response towards B toxicity and reported differentially expressed genes (DEGs) related to B tolerance in durum and bread wheat accessions [3,33], no study has reported a B-tolerant T. dicoccum genotype and its differentially regulated genes under B toxicity stress.
Considering the lack in this research area, after a thorough screening (unpublished data), a B-toxicity-tolerant T. dicoccum accession, PI94655, was recognized in one of our previous studies. To explore the molecular mechanisms behind the high B tolerance of this identified T. dicoccum genotype, PI94655, we analyzed the shoot transcriptome of the genotype treated with normal and high boron via RNA sequencing (RNA seq). RNA sequencing is used to determine the amount of available RNA and, subsequently, the level of gene expression at a certain moment [3,34]. The genome-wide differential regulation of genes, novel transcripts, and involved transcriptional pathways and factors in plant tissues suffering from a particular stress can be recognized via RNA sequencing.
The method has been extensively used to assess the transcriptional changes in several plants grown under B toxicity. However, it was not used before to understand the transcriptional differences in any boron-tolerant T. dicoccum genotype grown under B toxicity as compared to controlled growth conditions. Consequently, the hypothesis was that there would be significant transcriptional changes in the B-toxicity-tolerant T. dicoccum accession, PI94655, under high-boron treatment in comparison to control. Accordingly, the objective of the experiment was to report differentially expressed genes (DEGs), involved metabolic pathways, gene ontology and other molecular features of T. dicoccum genotype grown under a high-B environment as compared to normal growth conditions. This would not only provide further knowledge of molecular mechanisms underlying the B-tolerant T. dicoccum wheat response to high B, but might also suggest potential candidate genes for functional characterization and future use in upcoming breeding programs to improve wheat tolerance to B toxicity.

2. Materials and Methods

2.1. Plant Material, Boron Treatment and Estimation of Physiological Parameters

Initially, we screened 158 accessions comprising different wild and neglected wheat species for B tolerance and recognized a high-B-tolerant T. dicoccum genotype, PI94655 (our unpublished data). Hexaploid wheat cultivar Bolal 2973, whose high-B tolerance has been well-established in several previous studies [35,36], was employed as the reference cultivar to estimate the extent of B tolerance of PI94655. The accessions were hydroponically grown in a chamber with 45–55% humidity, 16/8 h light/dark photoperiod, 22 ± 10 °C temperature, and 16,000 Lx/day light intensity. Three replicates of both the T. dicoccum genotype and Bolal 2973 were allowed to grow in both the control [1/5th Hoagland with 3.1 µM B] and the highly toxic B treatment [10 mM B]. Seeds were initially kept for germination at room temperature without light for 3 days. Further, triplicates of five germinated seedlings of each accession were moved to pots with 1/5th Hoagland solution in two different sets (one set for every treatment). Thus, one biological replicate was composed of five plants and three replicates comprised a total of 15 plants per genotype for each treatment. B treatments were followed by three days of growth with continuous treatment for seven days and the solutions were replaced after every three days. After seven days, plants were harvested (at the tillering stage, Feekes scale 4–5) and growth parameters of genotypes including shoot length (SL), root length (RL), shoot fresh weight (SFW), root fresh weight (RFW), shoot dry weight (SDW), and root dry weight (RDW) were measured. In addition, for molecular analysis, three replicates of shoots of T. dicoccum genotype were taken from both treatments using liquid nitrogen and stored at −80 °C for RNA isolation.

2.2. RNA Extraction, Formation of cDNA Libraries, Shoot Transcriptome Sequencing of T. dicoccum Genotype

RNA isolation from the triplicate shoot samples of the T. dicoccum genotype, PI94655, was carried out using the manual total RNA extraction method as provided by Pandey et al. [3]. QIAzol-Lysis reagent was used for extraction and the received RNA pellet was diluted in 100 μL double distilled nuclease-free water. The quantity and quality, along with the RNA integrity score (RIS) values, were assessed employing a nanodrop spectrophotometer, 1% agarose gel, and the QIAxcel advanced fragment analyzer, respectively. The samples from two treatments (control and high B) were prepared for RNA sequencing using all the three biological replicates of the T. dicoccum PI94655 genotype by mixing equal amounts of their total RNA. Both the samples with RIN values higher than 7 were used to prepare cDNA libraries. MGI sequencing was conducted employing the DNBseq platform. With >97% of Q20 bases and >90% of Q30 bases, ~76 million high-quality paired end reads were developed per sample employing the oligoDT selection. The good quality reads with a phred score >30 from both treatment samples were deployed as clean reads for reference genome mapping and quantification of transcripts.

2.3. Assessment of Differentially Expressed Genes

HISAT2 (Hierarchical Indexing for Spliced Alignment of Transcripts) software was employed to align acquired clean reads with the Triticum aestivum reference genome (IWGSC_CS_RefSeq_v2.1), whereas Bowtie2 was used to align clean reads with the reference genes. Additionally, gene expression of each sample was assessed using RSEM. Cufflinksv2.2.2 software was used to normalize the expression of genes/transcripts employing the fragments per kilobase of transcript per million fragments mapped (FPKM) method. FPKM values were used to determine the differential fold change of the genes and FDR (false discovery rate) values. Smaller FDR values of genes denote their higher fold change and significant expression difference. Significantly differentially expressed genes (DEGs) were those with adjusted p value ≤ 0.01, false discovery rate (FDR) ≤ 0.001, and log2FoldChange ≥ 1. The iDEG R package was used to identify statistical significance of the differential expression of genes under two treatments in the absence of replicates [37,38].

2.4. Functional Assessment and Enrichment Analysis of DEGs

Enrichment of a specific gene in a specific pathway, molecular function and the biological process are determined via the enrichment analysis. The details of the significant DEGs-enriched GO functional terms were obtained via gene ontology (GO) enrichment analysis and the DEGs linked to particular biological processes were extracted. The alignment of DEGs to each entry in the gene ontology database provides information about significantly enriched GO functions. The p values and Q values were estimated to depict the statistical significance of enriched GO terms, and a Q value (corrected p value) ≤ 0.05 shows significant enrichment of GO terms in DEGs. Significantly enriched metabolic pathways and signal transduction pathways in DEGs were identified employing KEGG pathway enrichment analysis. The most significantly enriched biochemical, metabolic, and signaling pathways in DEGs were those with a Q value ≤ 0.05.

2.5. Involved Transcription Factors (TFs)

The transcription factor-encoding genes that were differentially expressed were identified and their transcription factor families were categorized.

2.6. RT-qPCR Based Expression Analysis

RNA samples from three biological replicates were employed to conduct reverse transcription and quantitative PCR (RT-qPCR). RT-qPCR was conducted to validate the differential expression of genes obtained from RNA sequencing. The normalization of target genes was carried out using Glyceraldehyde-3-phosphate dehydrogenase gene (TaGAP) as the internal control [33,36]. The NCBI Primer-BLAST program was used to design primers for four randomly selected genes for RT-qPCR (Table 1). Following the manufacturer’s instructions, the Transcriptor First Strand cDNA Synthesis Kit (Roche) and oligo-dT primers were used to reverse-transcribe cleaned total RNA samples into cDNA. The 1:10 dilutions of cDNA were used for final qPCR reactions of 20 μL that were performed in LightCycler® 96 (Roche, Germany) following the method and materials described by Pandey et al. [3]. Three biological and three technical replicates were used for qPCR reactions of each gene from both treatments. The levels of expression of target and reference genes and average errors of the means for two treatments were calculated. Melting curves revealed the sensitivity of individual samples and the ΔCt method proposed by Livak and Schmittgen [39] was employed to identify relative quantification.

3. Results

3.1. Physiological Changes in T. dicoccum, PI94655 and Bolal 2973 under B toxicity Stress

Several studies have shown the utility of measuring root–shoot growth parameters to understand the tolerance level of wheat genotypes [36,40,41,42]. In this experiment, B-toxicity-tolerance of T. dicoccum PI94655 genotype was determined in comparison with the check cultivar Bolal 2973, which is a well-known B-toxicity-tolerant genotype. Less yellowing of the leaves was observed in T. dicoccum PI94655 under high-B treatment in comparison with Bolal. High B significantly affected all the estimated growth parameters (p value < 0.0001) and it was revealed that PI94655 was less influenced by high B as compared to Bolal 2973 (Table 2 and Table S1). While the RL and SL of Bolal decreased by 50% and 38%, respectively, under high B as compared to control, the RL of PI94655 decreased by only 2% and shoot length increased by 4% under high B.
Likewise, a decrease of 108% and 30% was observed in the RFW and SFW of Bolal, but PI94655 showed an increase of 3% and a decrease of only 7%, respectively, for these two parameters under high B. High B reduced the DW of Bolal roots by 53% as compared t the no stress conditions, while it did not negatively affect the roots of PI94655, showing an increase of 10% in RDW. The SDW of Bolal neither increased nor decreased under B toxicity. While the SDW of PI94655 increased 16%, check cultivar showed no (0%) effect under B toxicity. On the other hand, the RDW of PI94655 increased only 10%, and check cultivar showed 53% decrease under B toxicity.

3.2. Transcriptome Sequencing and Genome Mapping of Sequencing Reads

RNA samples mixed from three biological replicates of shoots from both treatments and totaling 15 plants each were used for RNA sequencing analysis of the B-tolerant PI94655 genotype. Sequencing of RNA samples from control and high-B treatment gave a total of 152.19 million clean reads with an average of 76 million reads from each sample (Table 3). A total of approximately 180 million clean reads were obtained at the Q30 level (Table 3). The Triticum aestivum reference genome (IWGSC_CS_RefSeq_v2.1) was mapped to 14.69 and 16.68 high-quality clean reads from two libraries, with a unique mapping ratio of 4.84 and 5.50%, respectively (Table 3). A total of 43,852 and 44,921 genes, as well as 49,471 and 51,449 transcripts, were found in the control and treatment libraries, respectively (Table 3). Determining novel genes and/or transcripts is one of the major benefits of RNA sequencing [43]. In this study, we determined a total 3237 novel genes and 12,206 novel transcripts, respectively.

3.3. Differentially Regulated Genes of T. dicoccum Shoots under High B

The two shoot libraries showed a differential regulation of a total of 50,862 genes. Among these, 483 genes were significantly differentially expressed in the shoots of PI94655 under high B. Out of these significantly regulated genes, 112 were found to be down-regulated, while 371 genes were up-regulated (Figure 1).

3.4. Gene Ontology (GO) Analysis of Differentially Expressed Genes

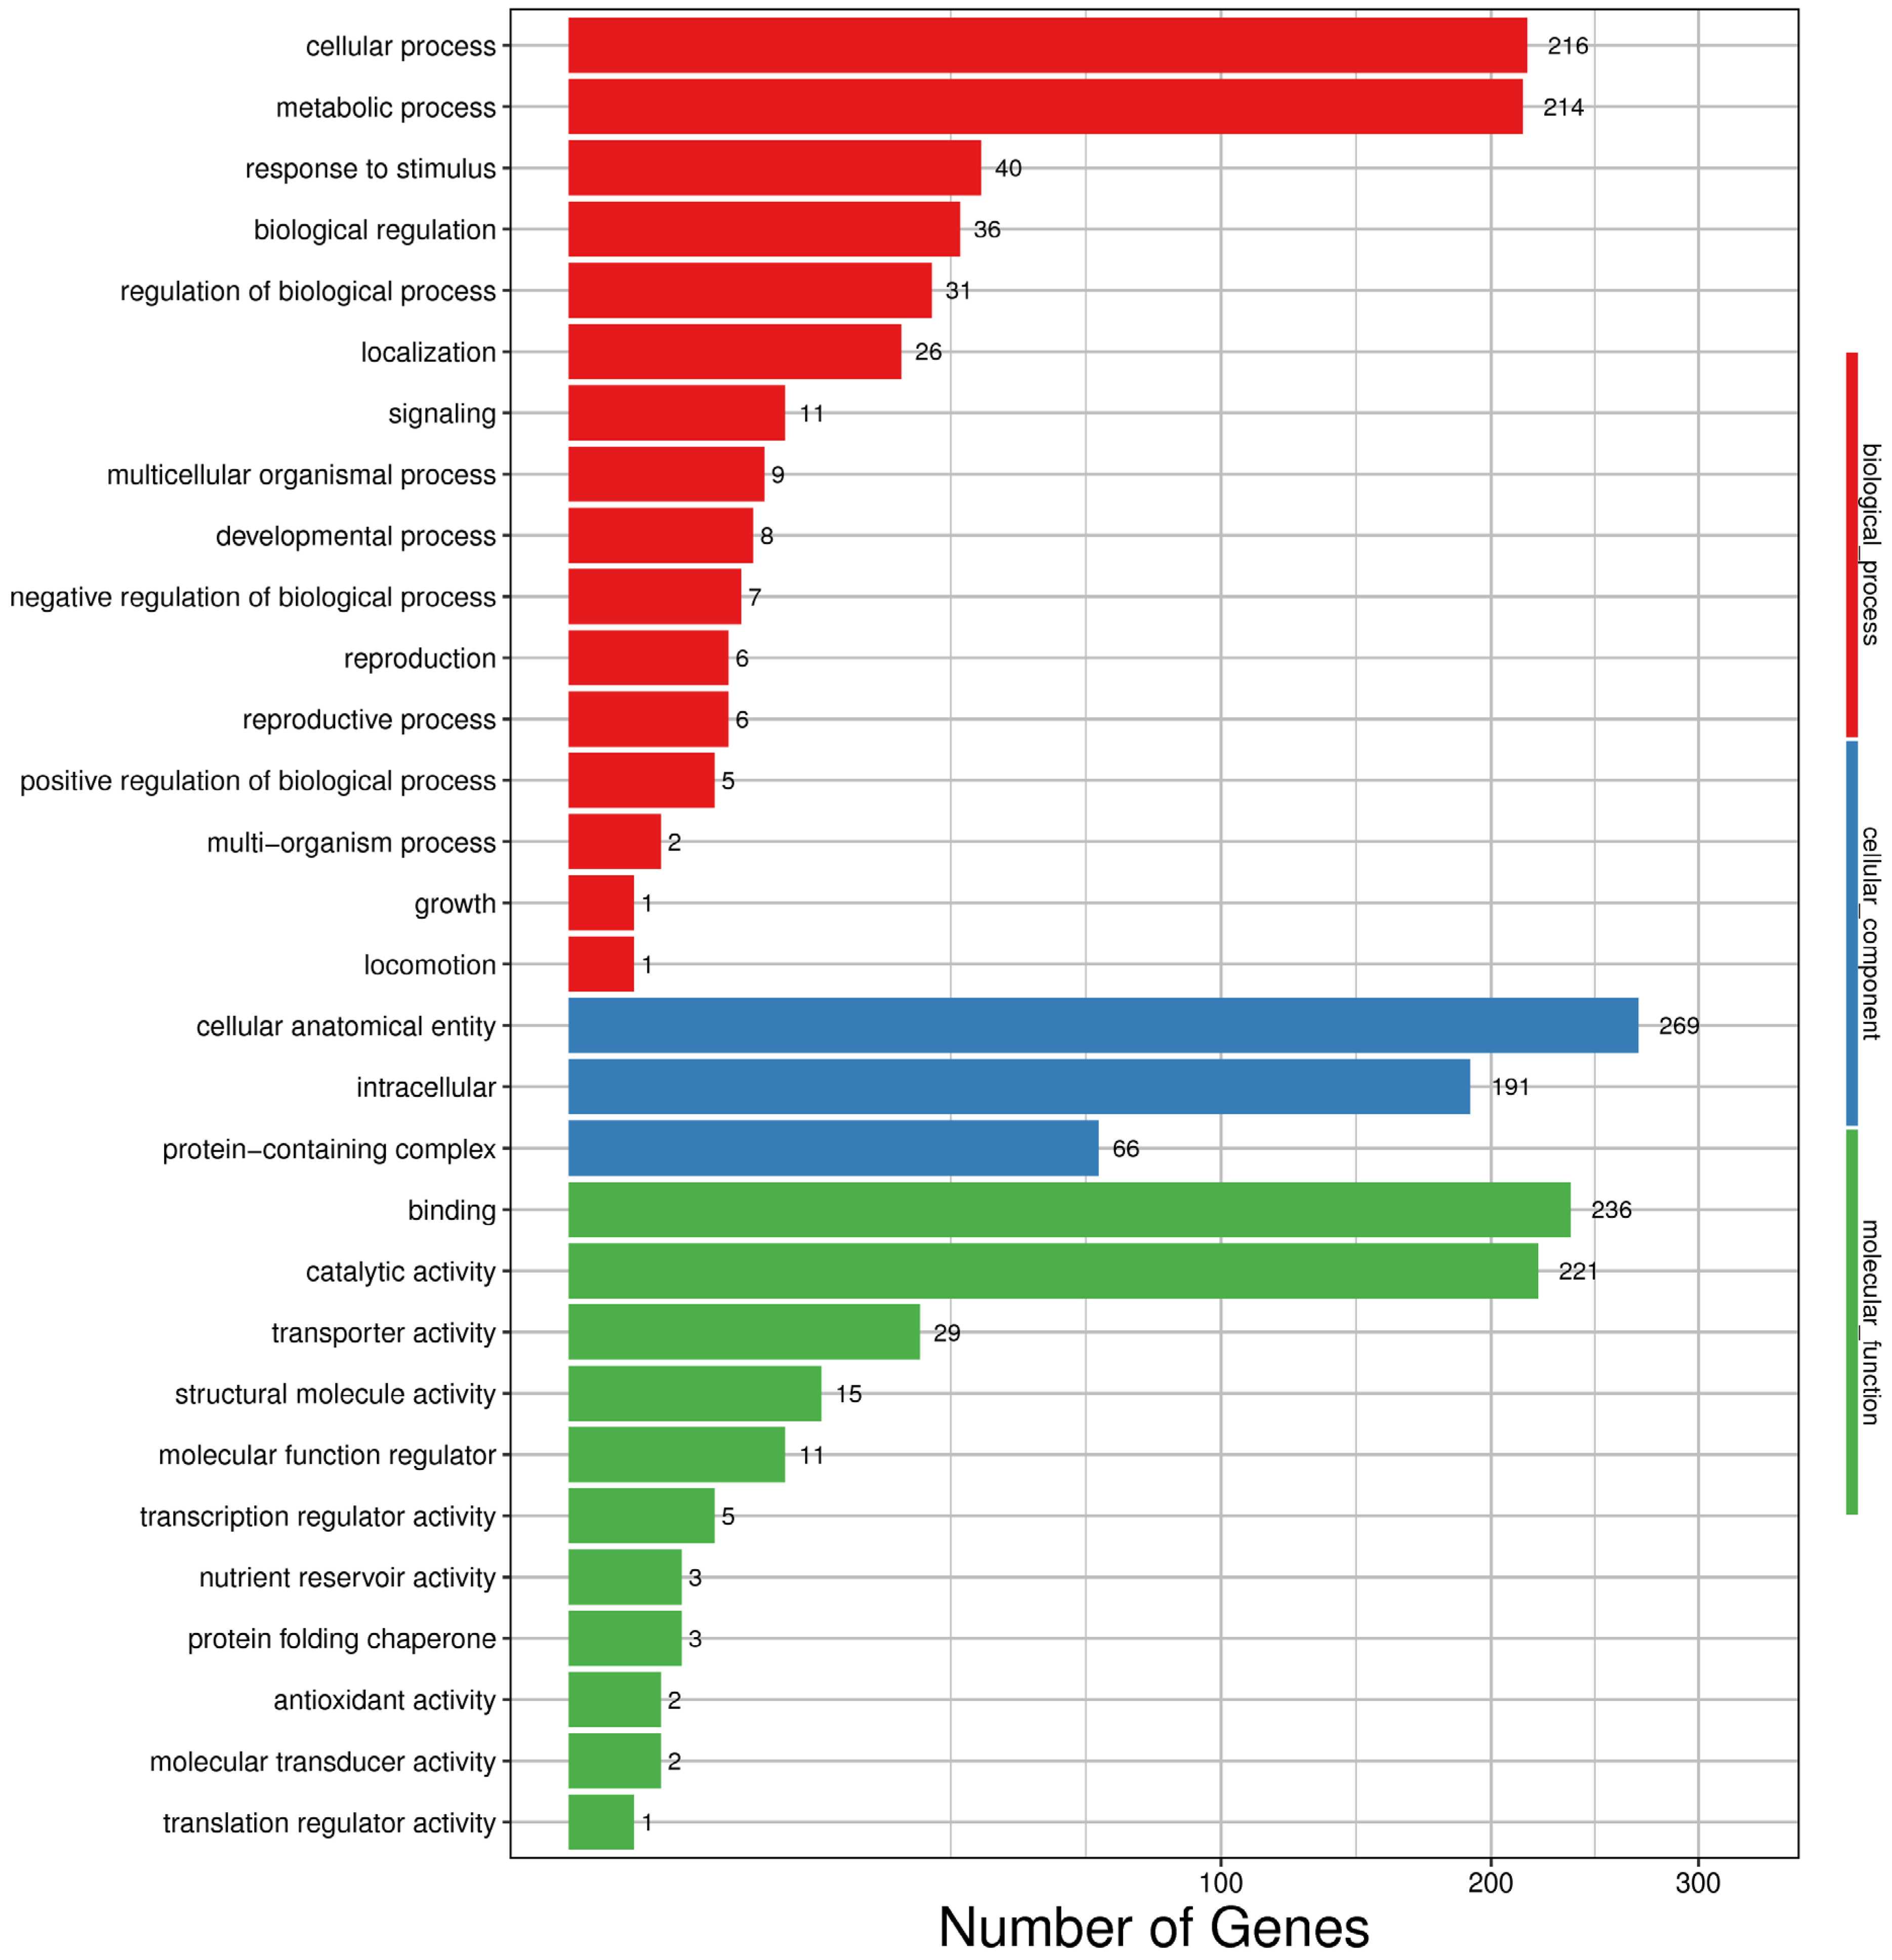
Gene ontology functional enrichment was conducted to gain a better understanding of the roles played by the DEGs of B-tolerant T. dicoccum under high-B treatment. The DEGs of cellular component, biological process, and molecular function were categorized in to 3, 16, and 11 groups, respectively (Figure 2 and Figure S1). In the cellular components, genes associated with cellular anatomical entity, intracellular and protein-containing complexes were enriched. In the biological process, the genes associated with the cellular process, the metabolic process, the response to stimulus, and biological regulation were most enriched. In the molecular functions, genes linked with binding and catalytic activity were rich, followed by the genes associated with transporter activity.

3.5. KEGG Pathway Enrichment (Functional Regulatory Network Analysis) of DEGs of T. dicoccum under High B

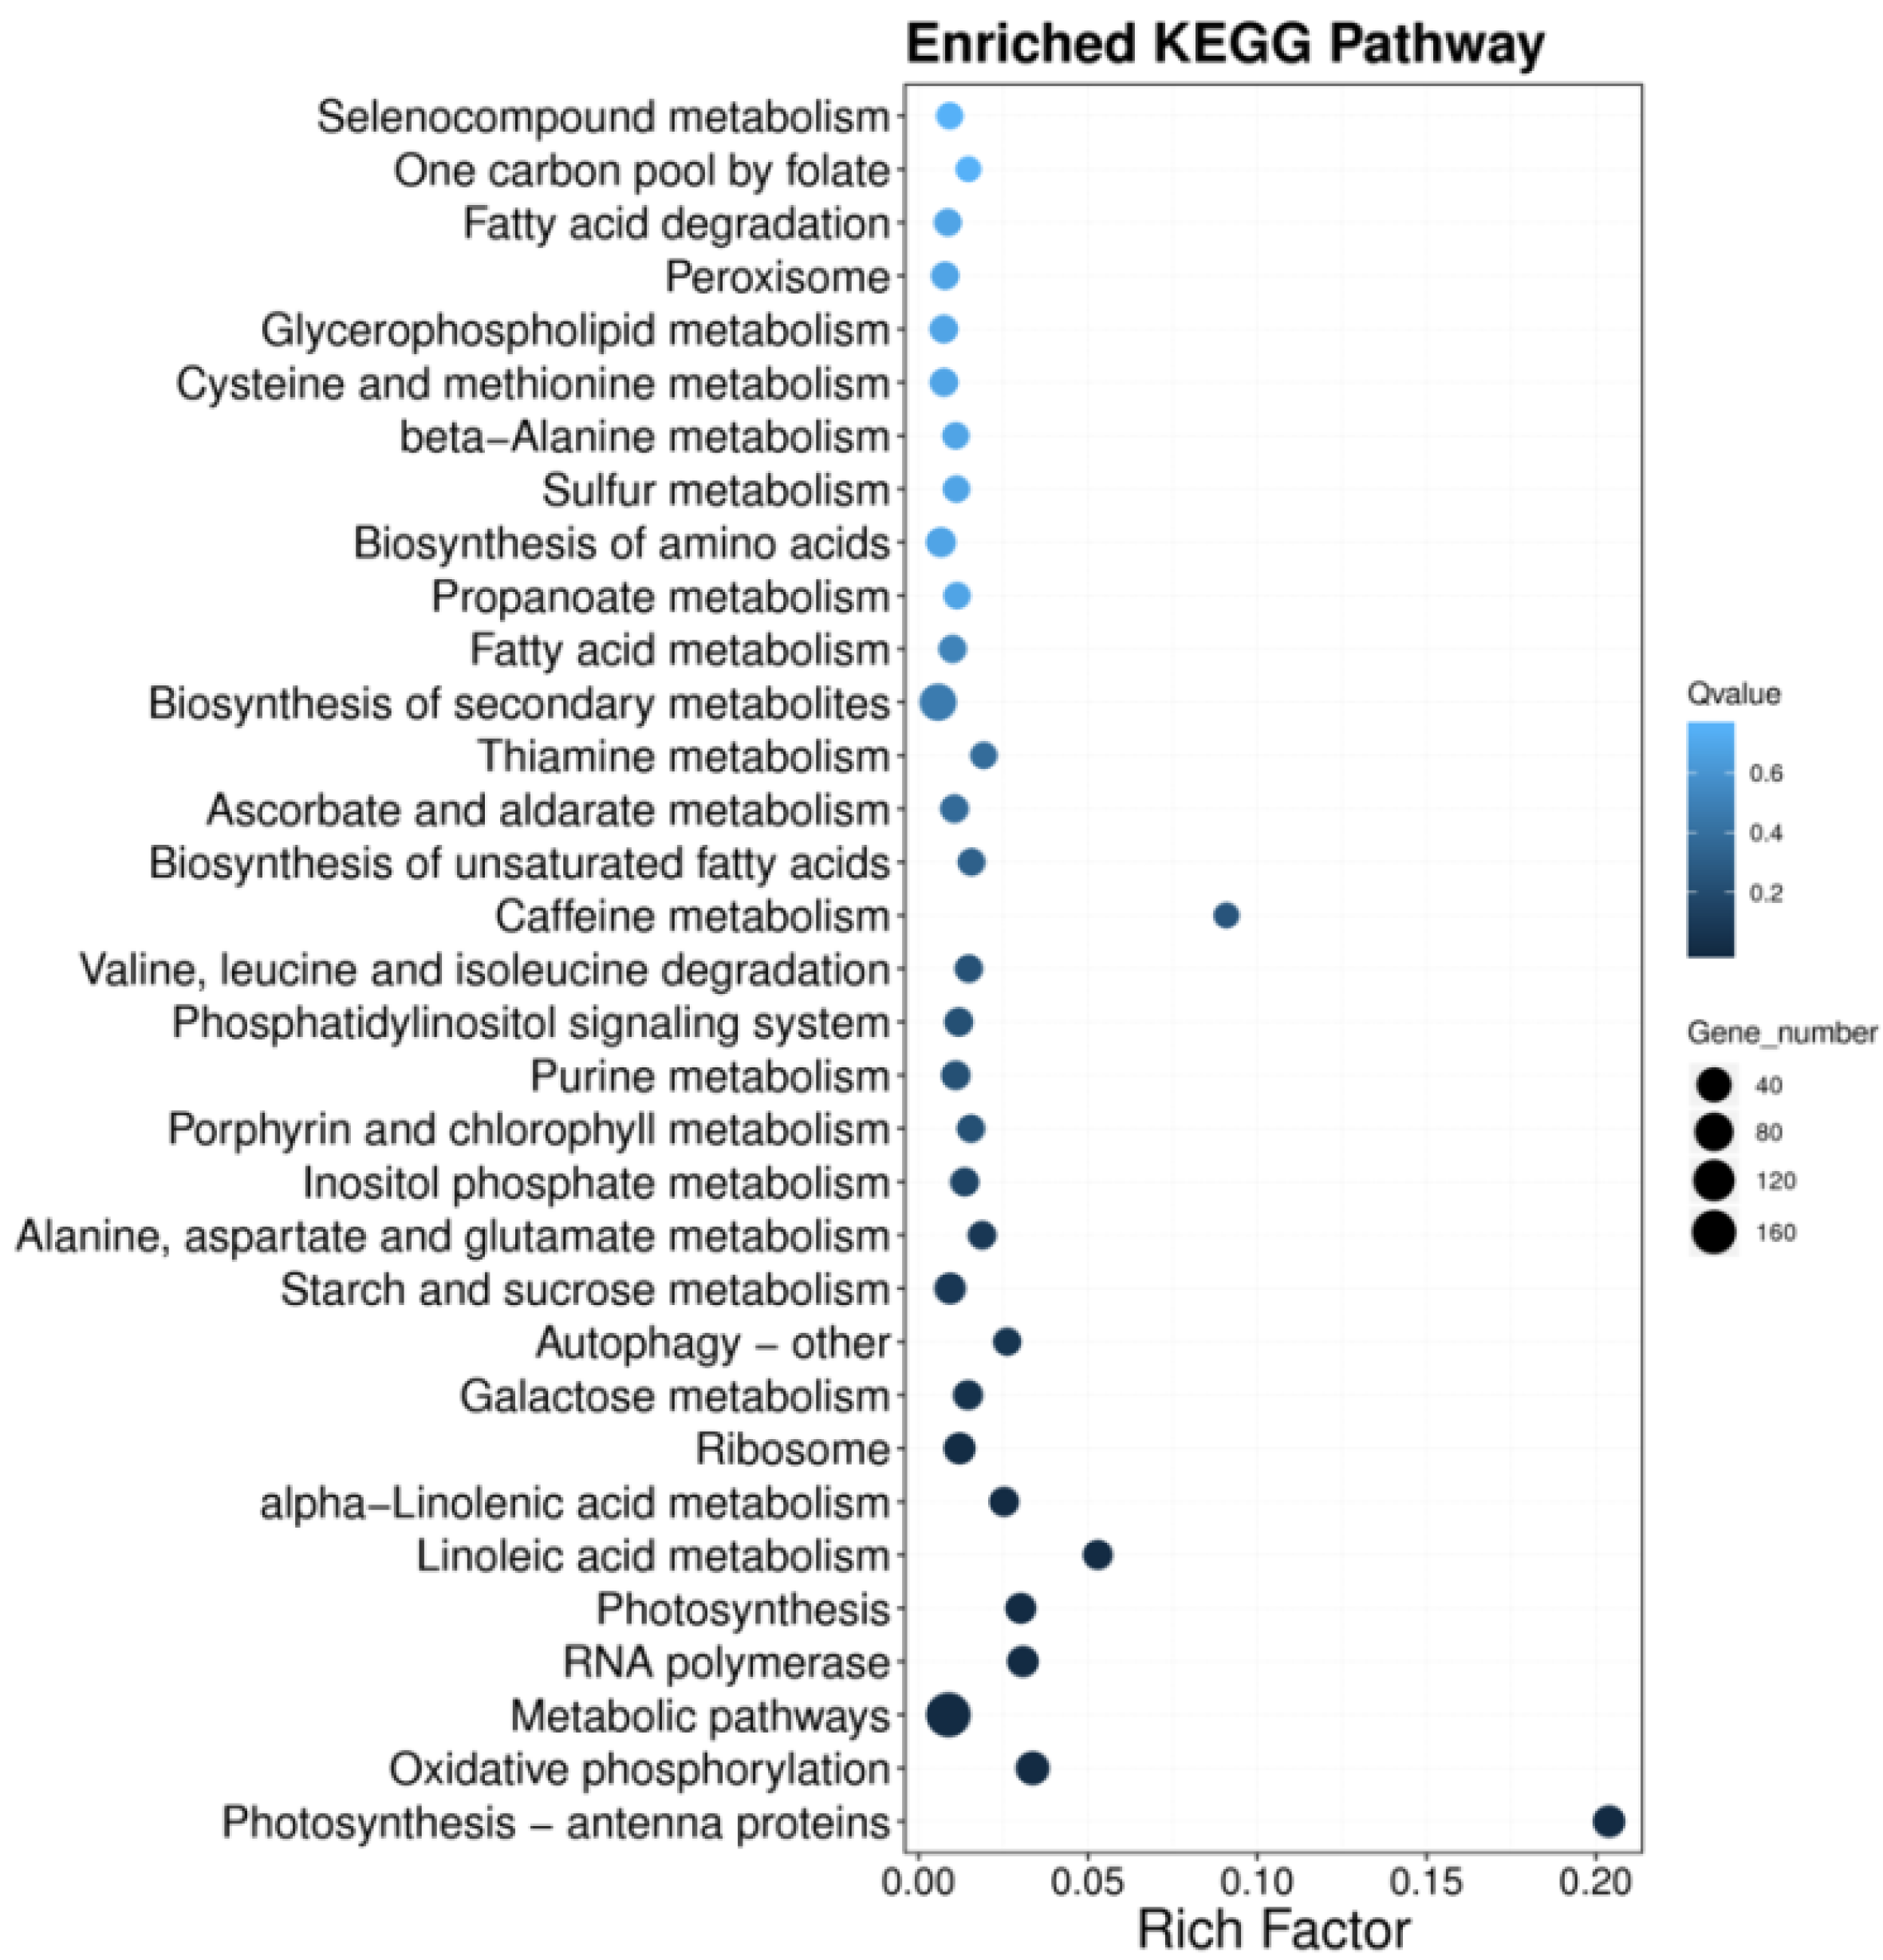
Pathway-dependent analysis is used to understand biological functions that are affected by the interaction of genes. The KEGG (Kyoto Encyclopedia of Genes and Genomes) database is used to perform pathway enrichment analysis of DEGs. The pathway annotation of 456 DEGs was observed in the analysis that were grouped in five key KEGG classes covering 85 KEGG pathways (Figure S2). The pathways with the highest number of DEGs included metabolic pathways, biosynthesis of secondary metabolites, and oxidative phosphorylation (Table 4). The global and overview maps, energy metabolism, carbohydrate metabolism, translation and transcription comprised most of the DEGs of level 2. Photosynthesis–antenna proteins, followed by the caffeine metabolism, revealed maximum rich ratio in the KEGG pathway enrichment (Figure 3).

3.6. High-B-Responsive Transcription Factors of PI94655

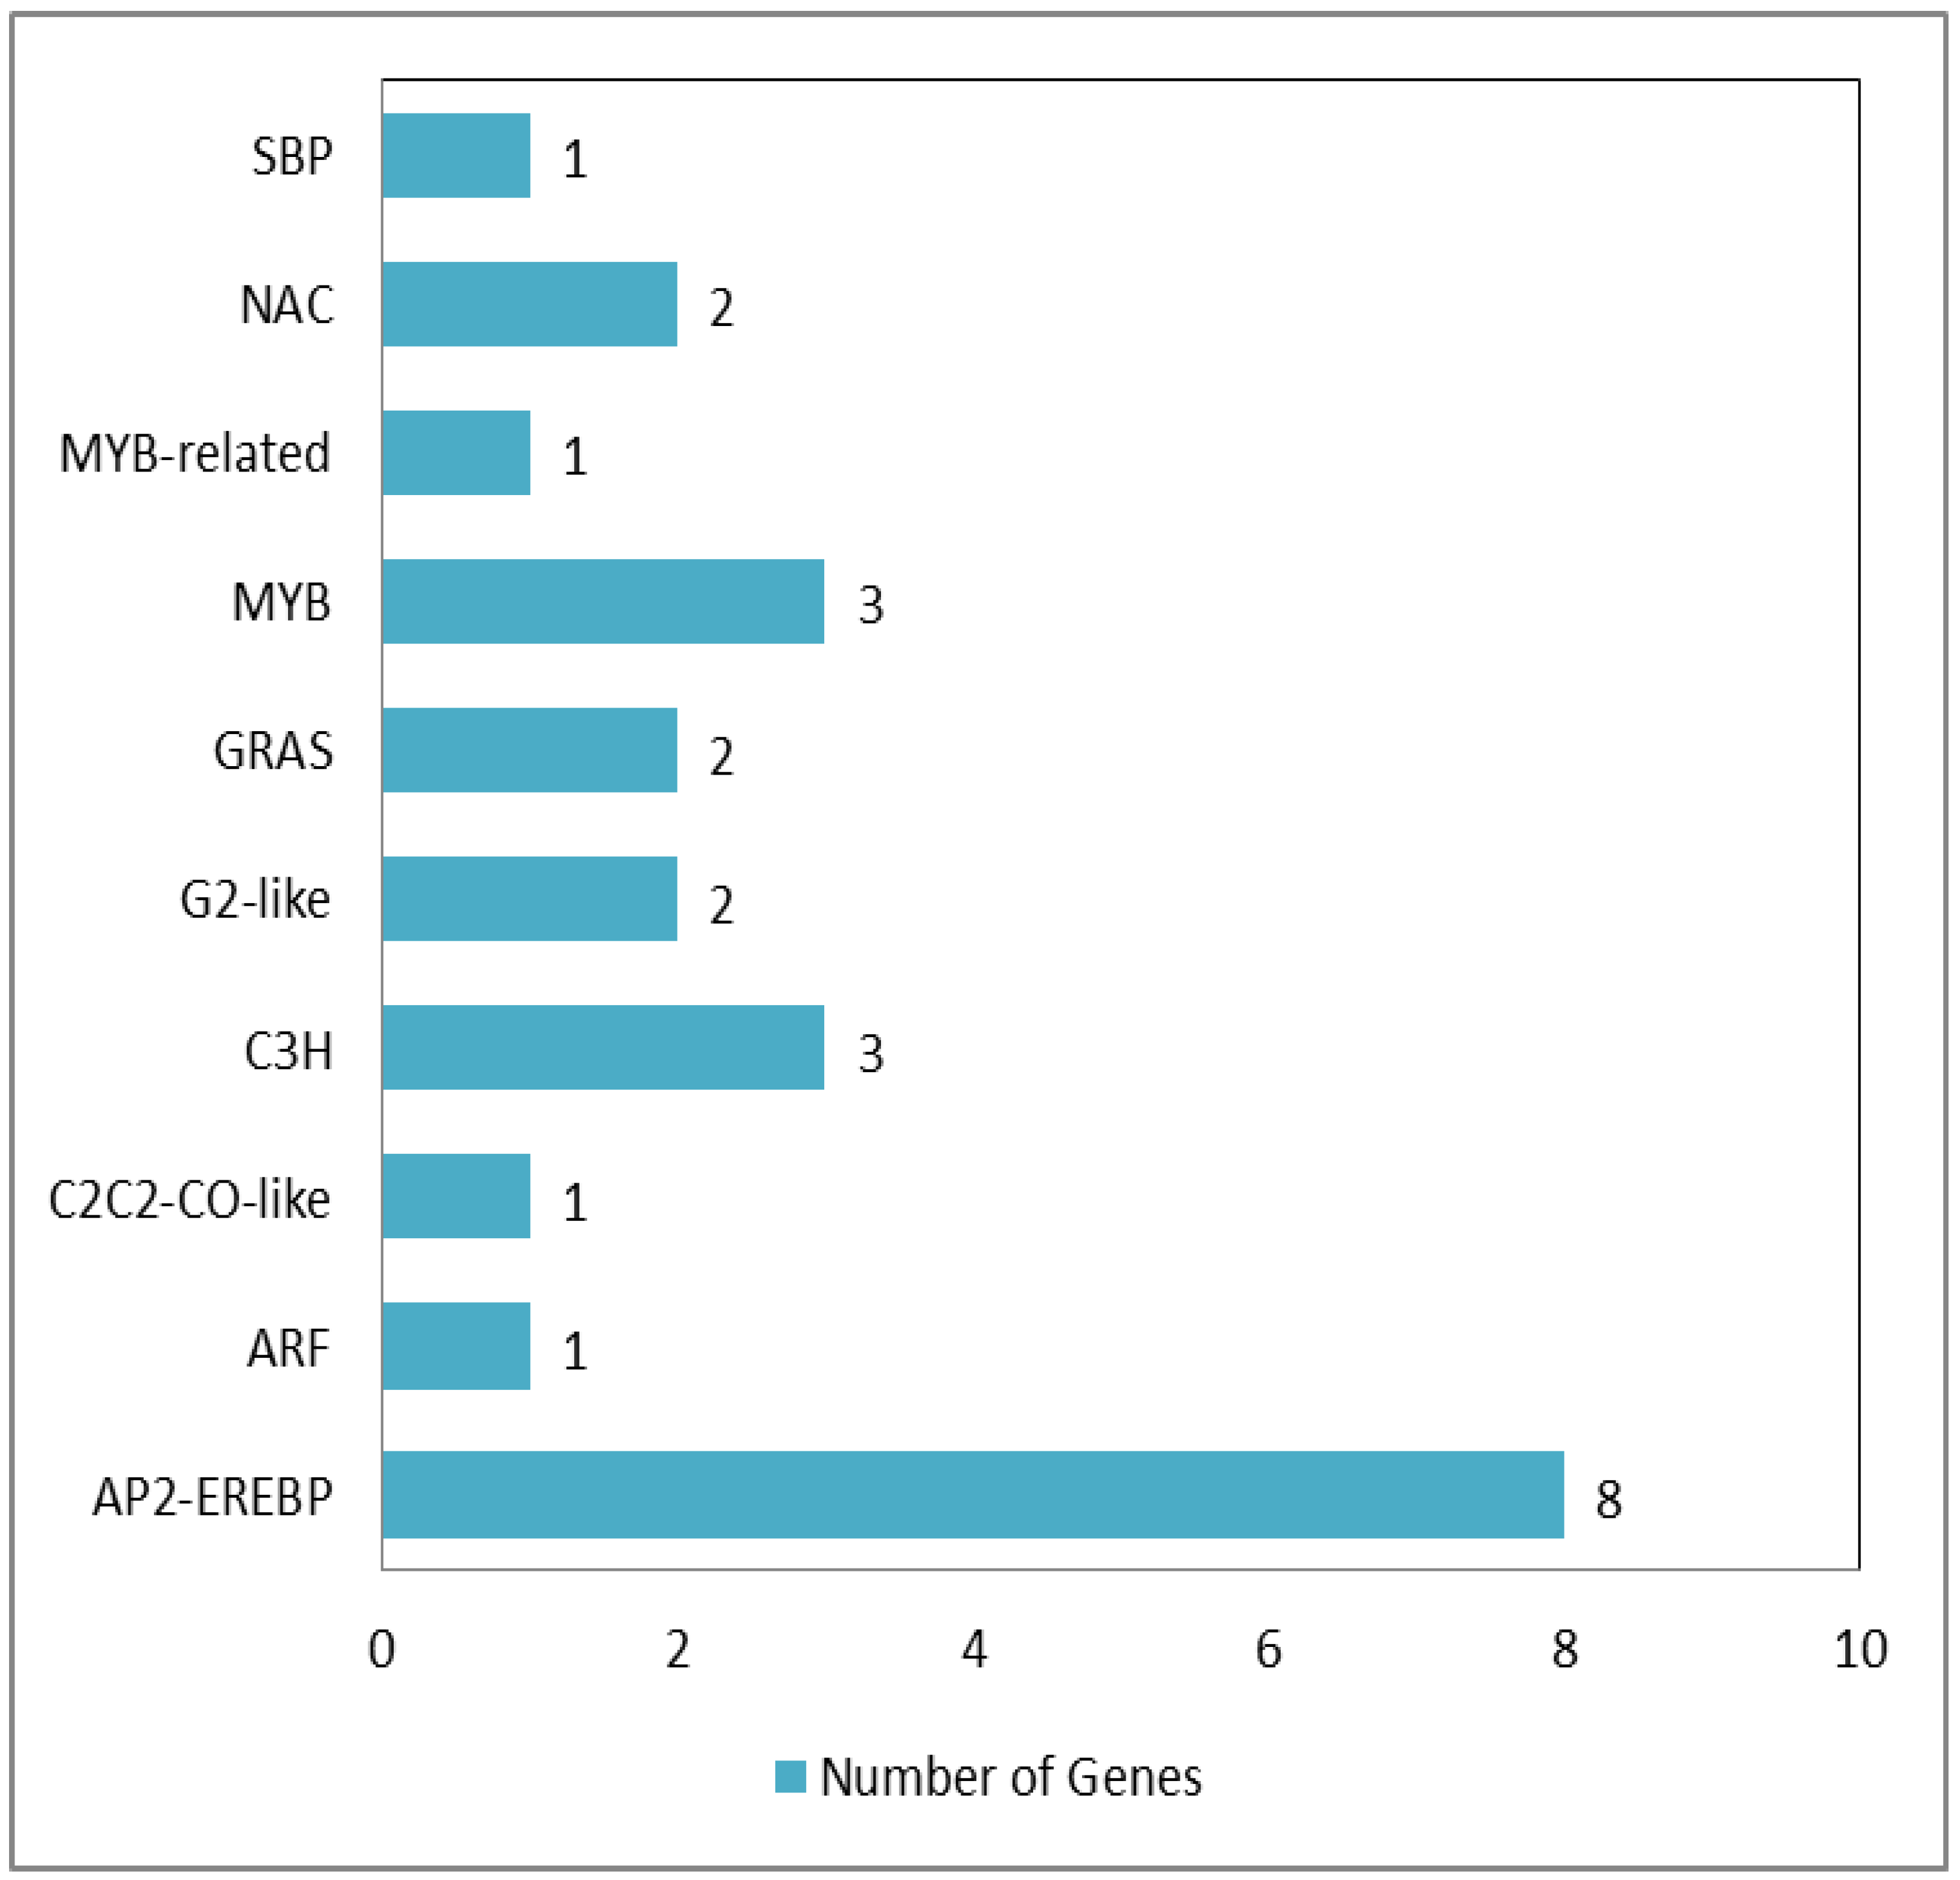
A number of transcription factors regulating the response to boron toxicity stress have been identified in other Triticum species [3]. The gene expression is controlled by the binding of transcription factors (TFs) to their specific cis-acting elements. In T. dicoccum shoots, differential expression of 28 TFs from 10 TFs families was observed under high B as compared to the control. The highest percentages of differentially expressed TFs were from the AP2-EREBP, MYB, C3H, G2-like, GRAS, and NAC families. These transcription factors have already been shown to affect the plants’ response to abiotic stress (Figure 4).

3.7. RT-qPCR Analysis for Confirmation of Sequencing Results

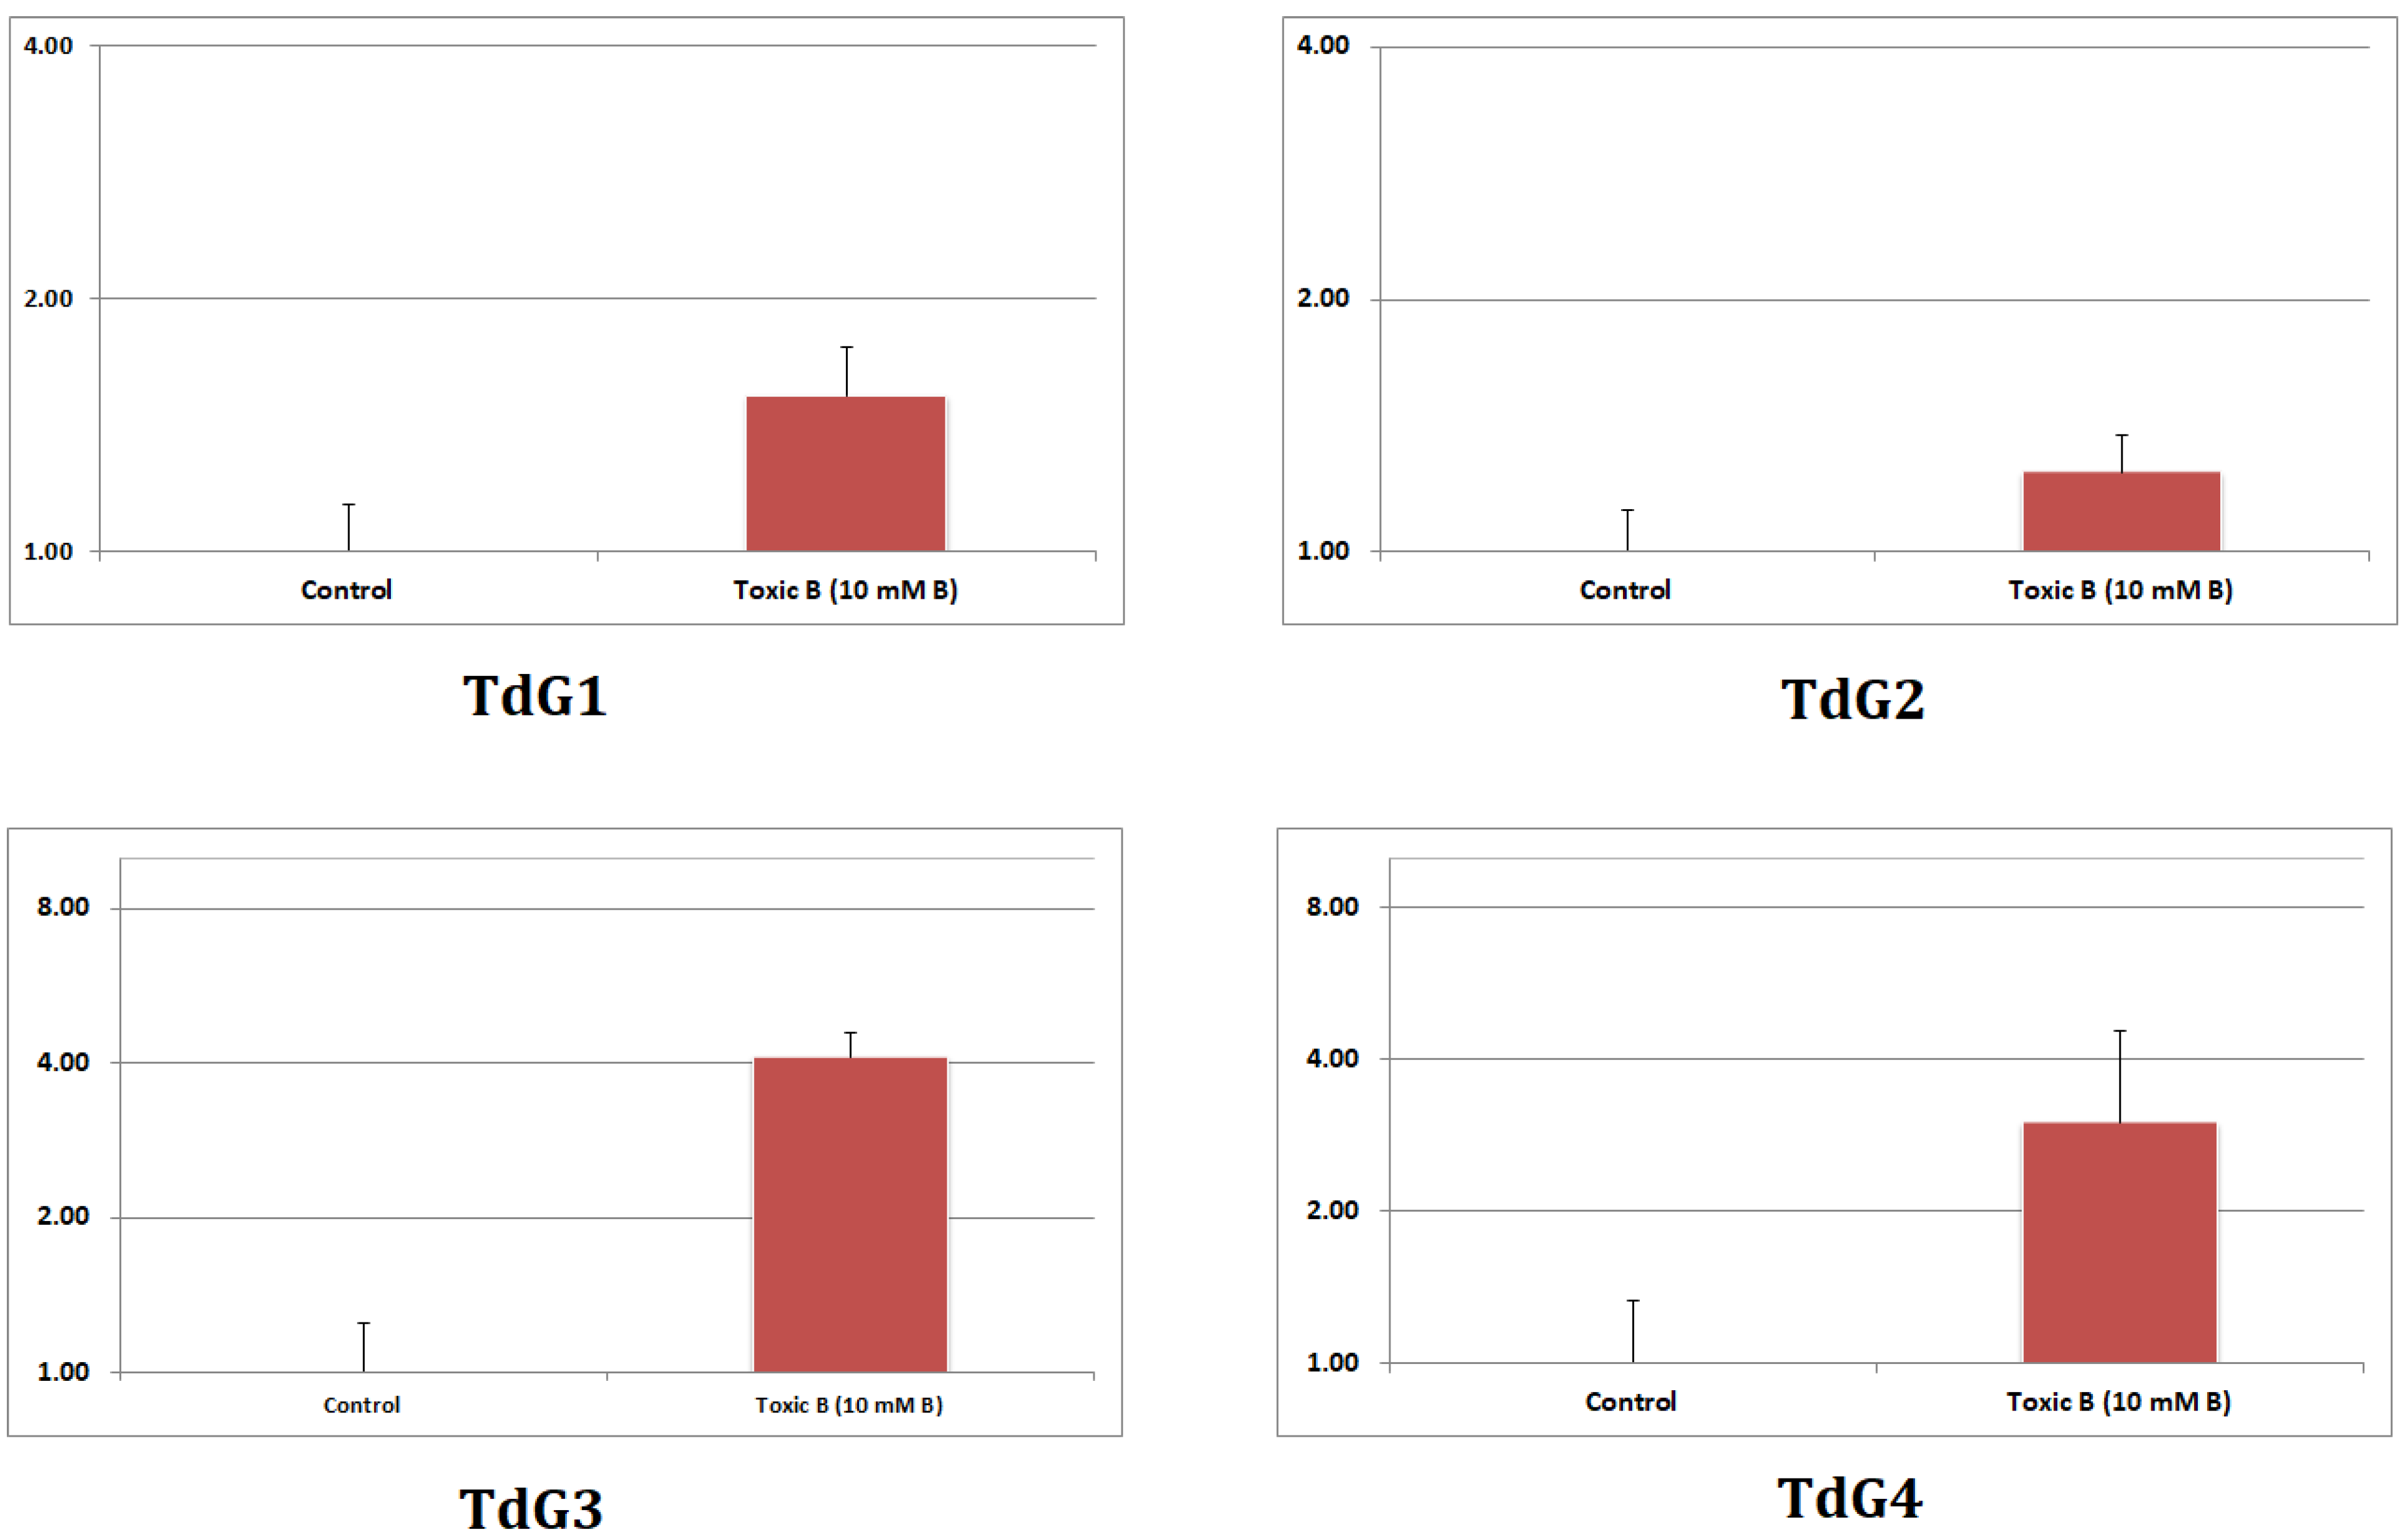
RNA sequencing results were validated through the RT-qPCR of four candidate genes responsive to high boron (Table 1). The RNA sequencing results corroborated the RT-qPCR outcomes for four of the selected genes. Based on the obtained RT-qPCR results, TdG1 (TraesCS3B02G001500) and TdG2 (TraesCS3B02G252900) revealed an up-regulation of few folds under high B in comparison to control. TdG3 (TraesCS3B02G191500) and TdG4 (TraesCS3B02G388100) genes showed a significant increase of several folds in the expression (Figure 5).

4. Discussion

The modern wheat crop has become more susceptible to the continuously changing environment as its genetic diversity is largely reduced during the process of breeding and domestication [5]. Thus, wheat progenitors, either wild or cultivated types, have greater chances of tolerance to biotic and abiotic stress conditions. Thus, screening of different wheat progenitors and identifying their adaptation level to a particular stress may provide efficient genetic resources for breeding programs [1]. Furthermore, finding the genes that may be involved in providing tolerance to these genotypes of underutilized species and introducing them into contemporary cultivars can be a successful strategy for enhancing stress tolerance in current genotypes. T. dicoccum is one of the oldest cultivated cereal crops and it is still consumed in countries such as Türkiye, Italy and Switzerland as bread and pasta [44]. Cultivated emmer is regarded as suitable for planting in challenging environmental conditions and in small cultivation areas because it requires little agricultural input and does not require the use of pesticides. Despite its popularity for several traits, T. dicoccum has not been explored at all for high B tolerance. Here, we discuss how the high B supply affected the growth and transcriptome of the high-B-tolerant T. dicoccum genotype PI94655.

4.1. Higher B Toxicity Tolerance in T. dicoccum PI94655 as Compared to Bolal 2973

As compared to Bolal 2973, T. dicoccum PI94655 demonstrated reduced physiological consequences of B toxicity. Plant growth parameters are largely employed to predict B tolerance in wheat genotypes [1,5,26,36,40,41,42,45]. All the evaluated growth parameters revealed that PI94655 was less affected by high B as compared to Bolal 2973. The growth parameters of PI94655 either increased or decreased very little under high B in comparison to the check cultivar. This was comparable to earlier experiments that showed that B toxicity had less of an impact on wild or neglected wheat genotypes growth parameters as compared to the check cultivars used in the studies [1,5]. Root–shoot dry matter content is an important criterion to understand the level of tolerance of genotypes towards various stresses [1,41,46]. Our results of greater root length of more tolerant T. dicoccum genotype in comparison to the check cultivar under high B corroborated with those of Schnurbusch et al. [47], and Pallotta et al. [36]. Schnurbusch et al. [47] revealed that other than a few exceptions, the B tolerance levels of the examined 94 wheat lines under high B was associated with the root length of the genotypes. For root–shoot biomass, similar to our study, Torun et al. [26] also found that the SDW of tolerant genotypes was greater as compared to less tolerant genotypes. In one of our previous studies [1], high increment and less decrement in SDW and RDW of B-tolerant Aegilops genotypes was observed under B toxicity. In line with this study, the B-tolerant T. zhukovskyi genotype showed much less effect of B toxicity on root–shoot dry matter as compared to the check genotype Bolal [3]. On the basis of lesser increase and greater decrease in RDW of PI94655 and check cultivar, respectively, under B toxicity as compared to SDW, B toxicity seems to have more diminishing effect on roots as compared to shoots independent of the B tolerance level of the genotype [3,48].

4.2. Gene Ontology Analysis

Gene ontology functional analyses of DEGs revealed that in the biological process of B-tolerant T. dicoccum shoots, the maximum enrichment of DEGs was observed in the cellular process, metabolic process, response to stimulus, biological regulation, regulation of biological process and localization subgroups. Some of the enriched subgroups under high B were in agreement with the previous experiments conducted on high B (Figure 2) [3,49] and should be focused for further studies. Similarly, structural molecule activity, transporter activity, catalytic activity, and binding subgroups were most enriched with DEGs in the molecular functioning of B-tolerant T. dicoccum shoots. The enrichment of these subgroups in T. dicoccum under B toxicity corroborated with the studies on Puccinellia sp. [49] and T. zhukovskyi [3]. Interestingly, the enrichment of cellular anatomical entity, intracellular and protein-containing complex subgroups in cellular components of B-tolerant T. dicoccum shoots in this study was not in agreement with the above-mentioned literature. In most of the GO terms, the number of up-regulated genes was higher than that of the down-regulated genes. As expected in shoot tissues, in cellular components, the genes related to plastid, chloroplast, thylakoid and related membranes, photosynthetic membrane, organelle subcompartment, photosystem I, photosystem II, cytoplasm (GO:0009536, GO:0009507, GO:0009535, GO:0055035, GO:0042651, GO:0034357, GO:0009534, GO:0031976, GO:0009579, GO:0031984, GO:0009521, GO:0009523, GO:0005737, GO:0009522) were significantly enriched in high B stress. In the molecular function, genes associated with chlorophyll binding (GO:0016168), quinone binding (GO:0048038), oxidoreductase activity, acting on NAD(P)H, quinone or similar compound as acceptor (GO:0016655), NADH dehydrogenase (quinone) activity (GO:0050136), and NADH dehydrogenase activity (GO:0003954) were significantly enriched in high B stress. The enriched genes in biological processes included genes involved in photosynthesis, light reaction, light harvesting (GO:0015979 GO:0019684 GO:0009765), generation of precursor metabolites and energy (GO:0006091), protein–chromophore linkage (GO:0018298), and electron transport chain (GO:0022900).

4.3. Involved Transcription Factors

Transcription factors (TFs) are known to control multiple stress-responsive genes and may thus be used in genetic engineering to create stress-tolerant crops [50]. The crops’ ability to withstand stress can be improved by modifying the TFs of several families including the ones that were observed in our study, i.e., AP2-EREBP, MYB, C3H, G2-like, GRAS, and NAC. In this study, interestingly, all the TFs were up-regulated. Among these, the AP2/EREBP (APETALA2/ethylene-responsive element-binding proteins) family revealed maximum enrichment in the TFs of T. dicoccum shoots under high B (Figure 4).
AP2/EREBP TFs are known to regulate abiotic stresses such as freezing, salt, heat, drought and cold via participation in redox, sugar and hormone signaling [51]. A combination of many responsive elements or the conserved cis-elements found in the promoter regions of AP2/ERFs regulates AP2/ERFs expression. In Arabidopsis, several regulators of the AP2/EREBP family have been reported to be involved in cold, drought, salt and heat stress [52]. A significant enrichment of eight DEGs of the AP2/EREBP TF family under high B was observed in our study. In agreement with our study, Kayihan et al. [33] reported differential regulation of three AP2 transcription factor genes (ta.27316.1.s1_at, taaffx.80154.2.s1_at, ta.21124.1.s1_x_at) in wheat leaves of B-toxicity-tolerant and susceptible genotypes grown under high B.
MYB TFs that are extensively disseminated in plants regulate plants’ responses to environmental changes, and show direct involvement in several physiological and biochemical processes. A significant enrichment of three DEGs of the MYB TF family under high B was observed in our study. It has been established that R2R3 MYB TFs in barley play responsive roles towards high B [53]. Two Myb TFs of Arabidopsis thaliana, AtMYB13 and AtMYB68, provided B toxicity tolerance to wild-type yeast by confirming their involvement in maintaining B equilibrium in plants [54]. Contrary to our study, the leaves of B-susceptible and B-tolerant wheat genotypes showed down-regulation of two MYB transcription factor genes, ta.27337.1.s1_at and taaffx.81130.1.s1_at, respectively, under high B [33].
Several abiotic stresses including cold, salinity, and drought are regulated by the NAC (NAM, ATAF and CUC) gene family, which is one of the major plant-specific TFs families [55]. In the present study, high B significantly enriched two up-regulated DEGs from the NAC gene family (100499184 and 123060990). This was concurrent with a study on barley leaves where 10 mM B supply up-regulated the expression of the NAC domain TF (HM07L17r_at) [56]. In addition, in rice, B toxicity tolerance was developed with the down-regulation of BORON EXCESS TOLERANT1 (BET1) gene, which is a NAC-Like TF gene [57].
The cysteine3Histidine (C3H) gene family is a subgroup of the zinc finger protein (ZFP) family, which is one of the major TFs families in plants, and is known to play a significant role in regulating plant development, growth, and responses to environmental changes [58]. In our study, a total of three C3H family genes (123068901, 123060371 and 123189473) were significantly enriched in T. dicoccum shoots under high B, all of which were up-regulated. Golden 2-like (G2-like) genes are affiliated with the newly characterized GARP superfamily of transcription factors and are known to regulate the chloroplast development [59]. Several G2-like TF genes were observed to be differentially expressed in cold stress in mulberry [60], drought and cold stress conditions in maize [59], cold stress and osmotic stress in moso bamboo [61], and cold, salt, and drought stress in tomato [62]. In our study, two G2-like genes were up-regulated under B toxicity. The GRAS transcription factors (TFs) are a significant family of plant-specific TFs that have a variety of biological roles in plants, including symbiosis, biotic and abiotic stress tolerance, cell signaling, growth, development, and phytochrome signaling [63]. In wheat, elevated light up-regulated the expression of the GRAS gene TaSCL14, which is involved in delayed leaf senescence, protection from photooxidative stress, reduction in membrane injury under environmental stresses and increment in photosynthetic capacity [63,64].
As per the literature, the enrichment of the C3H, G2-like and GRAS TF genes in wheat genotypes grown under high B has not been previously reported. This can be due to a comparatively lesser number of transcriptomic studies on B stress in wheat. In addition, the specific enrichment of the C3H, G2-like and GRAS TF families presented in this study can be attributed to the experimental B-tolerant genotype (PI94655) or experimental species (T. dicoccum), as the transcriptome of both of them has not been previously explored for B toxicity tolerance.

4.4. Transporters

To date, several transporters have been reported for B uptake by roots, entry into the xylem and its distribution among leaves, thus balancing B equilibrium in plants [3,7,65,66,67]. ABC transporters deliver the B-anthocyanin complexes, internally detoxify B and facilitate the transmembrane movement of substrates [33,56]. Our results showed significant up-regulation of 4 ABC transporters that directed towards their involvement in maintaining B equilibrium in T. dicoccum shoots grown under high B. Two of these transporters were ABC transporter C subfamily members (genes 123069100, 123060539) and one was an ABC transporter B subfamily member (gene 123190482). While our results were not completely in line with the outcomes obtained in P. distans showing down-regulation of these transporters [65,68], these were concurrent with the ones obtained in wheat [33] and B-susceptible barley [56] showing up-regulation of these genes.
B toxicity in soil strongly regulates the expression of transporter-encoding genes such as B exporters, nodulin-26-like intrinsic proteins (NIPs) and plasma membrane intrinsic proteins (PIP). Aquaporins, which are intrinsic membrane proteins, not only assist the water exchange at the transmembrane, but also allow the diffusion of uncharged molecules [69,70]. In our study, six aquaporins, including TIP2-2 (genes 100037531 (up-regulated), 100037645 (up-regulated)), PIP2-7 (gene 123112894 (down-regulated)), NIP2-2 (genes 123151130; 123,160,605 (down-regulated)), and PIP2-2 (gene 123137541 (down-regulated)), were significantly differentially regulated under B toxicity in T. dicoccum shoots. The down-regulation of NIPs in our study corroborated the findings obtained in zhukovskyii wheat [3], bread wheat [33], Citrus macrophylla [71], and barley [56]. PIP2-7 (gene 123112894) and NIP2-2 (gene 123151130) were homologs to Aegilops tauschii. Other than ABC and B transporters, several other transporters, including peptide/histidine transporters, potassium transporters, copper transporter, amino acid transporters, silicon efflux transporter, proton coupled transmembrane transporters, were significantly differentially expressed in high B stress in T. dicoccum shoots.

4.5. Involved KEGG Pathways

In KEGG pathway analysis, the most significant enrichment was observed in the photosynthesis–antenna proteins and caffeine metabolism pathways. The highest number of enriched DEGs in high B stress was observed in metabolic pathways, biosynthesis of secondary metabolites, and oxidative phosphorylation (Figure 3). The metabolic pathways comprised 109 up-regulated and 63 down-regulated genes; the biosynthesis of secondary metabolites comprised 37 up-regulated and 25 down-regulated genes; and the oxidative phosphorylation comprised 27 up-regulated and 5 down-regulated genes. Similar to our study, the metabolic pathways were most enriched in the leaves of barley plants grown in high B [53]. In plants, different abiotic stress conditions trigger the production of secondary metabolites [72]. The activity of ABC transporters increases with the accumulation of secondary plant metabolites, such as indole alkaloids, anthocyanins, phenylpropanoids, and flavonoids in vacuoles [73,74]. In line with the present study, T. zhukovskyi roots showed up- and down-regulated genes involved in the biosynthesis of secondary metabolites in high B stress [3]. Different from our study, all genes taking part in secondary plant metabolisms were down-regulated in black poplar under high B [75].
A number of studies have reported the activation of plant defense responses via the photosynthesis–antenna proteins pathway on exposure to biotic and abiotic stresses [76]. Interestingly, in our study, all the genes of photosynthesis–antenna proteins were down-regulated under high boron. These outcomes corroborated the study on wheat where powdery mildew down-regulated the enzymes involved in the photosynthesis–antenna proteins pathway [76]. However, the results were different from those obtained in soybean seedlings grown under light deficiency stress, where most of the genes of photosynthesis–antenna proteins pathway were up-regulated [77]. The genes of this pathway in our study were participants in the light-harvesting chlorophyll protein complex (LHC) (light-harvesting complex II chlorophyll a/b binding protein 1). Plants’ thylakoid membranes include an array of protein and chlorophyll molecules called LHCs, which absorb light and transmit it to the photosynthetic reaction center (RC) [78]. The down-regulation of LHC-associated genes may lead to a decrease in light absorption, consequently reducing the photosynthesis rate. This can be a reason for the enrichment of the genes in GO terms related to plastid, chloroplast, thylakoid and related membranes, photosynthetic membrane, organelle subcompartment, photosystem I, photosystem II, cytoplasm in high B in our study.

4.6. Annotated Genes Confirmed with RT-qPCR

RT-qPCR validated the up-regulation (Figure 5) of the TdG1 gene (TraesCS3B02G001500) of T. dicoccum, which is a homolog of the Triticum dicoccoides swi5-dependent recombination DNA repair protein 1 (LOC119274246) gene. The gene showed 10-fold and 0.5-fold up-regulation in transcriptome sequencing and RT-qPCR. In line with our study, a change of two folds was observed in the expression of this wheat gene in response to low temperature as compared to control [79].
The TdG2 gene (TraesCS3B02G252900) of T. dicoccum that revealed increased expression in high B in our study (Figure 5) is a homolog of the Triticum dicoccoides ATP-dependent zinc metalloprotease FTSH 9 chloroplastic/mitochondrial (LOC119276292) gene. In agreement with our study, the increased expression of FTSH protein was recorded in response towards salinity stress in chickpea genotypes [80]. Several studies have reported the direct involvement of genes of the thylakoid FtsH complex in the stress response [81].
The TdG3 gene (TraesCS3B02G191500) of T. dicoccum that showed an up-regulation of approximately four times in high B in our study (Figure 5) is a homolog of the Triticum dicoccoides DDB1- and CUL4-associated factor (DCAF) 13-like (LOC119275595) gene. The result obtained was in agreement with a study on Arabidopsis where DCAF1 was up-regulated after ABA treatment and salinity stress [82]. In addition, a DCAF protein, DDI1, was shown to be up-regulated by salt, mannitol and UV-C treatment in tomato.
The TdG4 gene (TraesCS3B02G388100) of T. dicoccum that showed an up-regulation of approximately three times in high B stress in our study (Figure 5) is a homolog of the Triticum dicoccoides UDP-glucuronic acid decarboxylase 1-like (LOC119277519) gene. These results corroborated the ones obtained by Zhang et al. [83], where the gene was up-regulated by the powdery mildew and stripe rust in wheat line N9134. The NAD-dependent decarboxylation of UDP-glucuronic acid to UDP-xylose is catalyzed via this gene and the gene is required for the synthesis of the primary tetrasaccharide in glycosaminoglycan biosynthesis.

5. Conclusions

Wheat production and quality have been significantly restrained due to the negative impact of boron toxicity stress [45]. For the first time, we report the results of RNA sequencing of a high-B-tolerant T. dicoccum genotype, PI94655, grown under normal and high-B stress. The results suggest that several mechanisms in T. dicoccum interact in boron toxicity stress. Transcriptional profiling successfully identified putative functional candidate genes involved in B toxicity tolerance in T. dicoccum via differential regulation of different transporters including ABC transporters, aquaporins (NIP, PIP, TIP) and transmembrane proteins. Metabolic pathways, biosynthesis of secondary metabolites, and oxidative phosphorylation revealed the highest number of DEGs along with the highest enrichment in photosynthesis–antenna proteins and caffeine metabolism pathways. Moreover, TFs genes AP2-EREBP, MYB, C3H, G2-like, GRAS, and NAC families can be additional potential candidates for enhancing boron toxicity tolerance in wheat genotypes. Despite being one of the oldest cultivated cereal species, the potential of T. dicoccum has not been well-explored for biotic and abiotic stress tolerances. Due to its closeness with modern durum wheat and compatibility of producing fertile hybrids, the reported B-tolerant T. dicoccum genotype PI94655 in this study can be effectively utilized as a source of B toxicity tolerance in breeding programs and to further conduct further omics studies in wheat crop. In addition, the reported high B responsive candidate genes can be futuristically employed by plant breeders and molecular biologists for combining high B tolerance in high yielding wheat accessions. Being the first transcriptomic study on the high B tolerance of the T. dicoccum genotype, the obtained results should be focused, and the functional characterization of potential candidate genes should be conducted to elucidate the gene function in providing tolerance to high B.

Supplementary Materials

The following supporting information can be downloaded at: https://www.mdpi.com/article/10.3390/agronomy13030631/s1, Table S1: Means of the RL (root length), SL (shoot length), RFW (root fresh weight), SFW (shoot fresh weight), RDW (root dry weight), and SDW (shoot dry weight) of PI94655 (T. dicoccum) and Bolal 2973 (T. aestivum) grown under control (3.1 μM B), and highly toxic B (10 mM B). Figure S1: GO classification of up-regulated and down-regulated genes of shoots of the T. dicoccum (Td) genotype grown under high B (TB 10 mM) treatment relative to those grown in control (3.1 μM B) treatment. Figure S2: KEGG Pathway classification of DEGs of shoots of the T. dicoccum (Td) genotype grown under high B (TB 10 mM) treatment relative to those grown in control (3.1 μM B) treatment. X axis represents number of DEG. Y axis represents functional classification of KEGG. There are five classes for KEGG pathways: Organismal Systems, Metabolism, Genetic Information Processing, Environmental Information Processing, and Cellular Processes.

Author Contributions

Conceptualization: M.K.K. and A.P.; methodology: M.K.K. and A.P.; validation: M.K.K. and A.P.; formal analysis: M.K.K., A.P., M.H., V.R.R., T.V. and S.N.R.; investigation, M.K.K., A.P., A.T. and S.G.; writing—original draft preparation: M.K.K. and A.P.; writing—review and editing: M.K.K., A.P., M.H., V.R.R., T.V., A.T., S.N.R. and S.G.; project administration: M.K.K. and A.P.; funding acquisition: A.P. All authors have read and agreed to the published version of the manuscript.

Funding

We thank the TUBITAK 1001 (No. 119O455) project for the funding provided to perform this research work.

Acknowledgments

We thank the National Small Grains Collection (NSGC), U.S. Department of Agriculture—Agricultural Research Service, USA, for providing the Triticum dicoccum genotype PI94655 genotype to A.P. for performing the research work of TUBITAK 1001 (No. 119O455) project.

Conflicts of Interest

The authors declare no conflict of interest.

References

  1. Khan, M.K.; Pandey, A.; Hamurcu, M.; Avsaroglu, Z.Z.; Ozbek, M.; Omay, A.H.; Elbasan, F.; Omay, M.R.; Gokmen, F.; Topal, A.; et al. Variability in Physiological Traits Reveals Boron Toxicity Tolerance in Aegilops Species. Front. Plant Sci. 2021, 12, 736614. [Google Scholar] [CrossRef] [PubMed]
  2. Brdar-Jokanovic, M. Boron Toxicity and Deficiency in Agricultural Plants. Int. J. Mol. Sci. 2020, 21, 1424. [Google Scholar] [CrossRef] [PubMed] [Green Version]
  3. Pandey, A.; Khan, M.K.; Hamurcu, M.; Brestic, M.; Topal, A.; Gezgin, S. Insight into the Root Transcriptome of a Boron-Tolerant Triticum zhukovskyi Genotype Grown under Boron Toxicity. Agronomy 2022, 12, 2421. [Google Scholar] [CrossRef]
  4. Camacho-Cristóbal, J.J.; Navarro-Gochicoa, M.T.; Rexach, J.; González-Fontes, A.; Herrera-Rodríguez, M.B. Chapter 6—Plant Response to Boron Deficiency and Boron Use Efficiency in Crop Plants. In Plant Micronutrient Use Efficiency; Hossain, M.A., Kamiya, T., Burritt, D.J., Phan Tran, L.-S., Fujiwara, T., Eds.; Academic Press: Cambridge, MA, USA, 2018; pp. 109–121. [Google Scholar]
  5. Khan, M.K.; Pandey, A.; Hamurcu, M.; Germ, M.; Yilmaz, F.G.; Ozbek, M.; Avsaroglu, Z.Z.; Topal, A.; Gezgin, S. Nutrient Homeostasis of Aegilops Accessions Differing in B Tolerance Level under Boron Toxic Growth Conditions. Biology 2022, 11, 1094. [Google Scholar] [CrossRef] [PubMed]
  6. Reid, R.J.; Hayes, J.E.; Post, A.; Stangoulis, J.C.R.; Graham, R.D. A critical analysis of the causes of boron toxicity in plants. Plant Cell Environ. 2004, 27, 1405–1414. [Google Scholar] [CrossRef]
  7. Pandey, A.; Khan, M.K.; Hamurcu, M.; Yilmaz, F.G.; Gezgin, S. Boron Toxicity: An Insight on Its Influence on Wheat Growth. In Metal Toxicology Handbook; CRC Press: Boca Raton, FL, USA, 2020; pp. 417–432. [Google Scholar]
  8. Landi, M.; Degl’Innocenti, E.; Pardossi, A.; Guidi, L. Antioxidant and Photosynthetic Responses in Plants under Boron Toxicity: A Review. Am. J. Agric. Biol. Sci. 2012, 7, 255–270. [Google Scholar] [CrossRef] [Green Version]
  9. Hamurcu, M.; Khan, K.; Pandey, A.; Avşaroğlu, Z.Z.; Elbasan, F.; Gezgin, S. Boron stress exposes differential antioxidant responses in maize cultivars (Zea mays L.). J. Elem. 2020, 24, 1291–1304. [Google Scholar]
  10. Sakamoto, T.; Inui, Y.T.; Uraguchi, S.; Yoshizumi, T.; Matsunaga, S.; Mastui, M.; Umeda, M.; Fukui, K.; Fujiwara, T. Condensin II alleviates DNA damage and is essential for tolerance of boron overload stress in Arabidopsis. Plant Cell 2011, 23, 3533–3546. [Google Scholar] [CrossRef] [Green Version]
  11. Catav, S.S.; Genc, T.O.; Kesik Oktay, M.; Kucukakyuz, K. Effect of Boron Toxicity on Oxidative Stress and Genotoxicity in Wheat (Triticum aestivum L.). Bull. Environ. Contam. Toxicol. 2018, 100, 502–508. [Google Scholar] [CrossRef]
  12. Tanaka, M.; Takano, J.; Chiba, Y.; Lombardo, F.; Ogasawara, Y.; Onouchi, H.; Naito, S.; Fujiwara, T. Boron-dependent degradation of NIP5;1 mRNA for acclimation to excess boron conditions in Arabidopsis. Plant Cell 2011, 23, 3547–3559. [Google Scholar] [CrossRef] [Green Version]
  13. Reid, R. Identification of boron transporter genes likely to be responsible for tolerance to boron toxicity in wheat and barley. Plant Cell Physiol. 2007, 48, 1673–1678. [Google Scholar] [CrossRef] [PubMed]
  14. Miwa, K.; Aibara, I.; Fujiwara, T. Arabidopsis thaliana BOR4 is upregulated under high boron conditions and confers tolerance to high boron. Soil Sci. Plant Nutr. 2014, 60, 349–355. [Google Scholar] [CrossRef]
  15. Khan, M.K.; Pandey, A.; Hamurcu, M.; Gezgin, S.; Athar, T.; Rajput, V.D.; Gupta, O.P.; Minkina, T. Insight into the Prospects for Nanotechnology in Wheat Biofortification. Biology 2021, 10, 1123. [Google Scholar] [CrossRef] [PubMed]
  16. Paull, J.G.; Cartwright, B.; Rathjen, A.J. Responses of wheat and barley genotypes to toxic concentrations of soil boron. Euphytica 1988, 39, 137–144. [Google Scholar] [CrossRef]
  17. Cartwright, B.; Zarcinas, B.; Mayfield, A. Toxic concentrations of boron in a red-brown earth at Gladstone, South Australia. Soil Res. 1984, 22, 261–272. [Google Scholar] [CrossRef]
  18. Yau, S.-k.; Nachit, M.M.; Ryan, J. Variation in boron-toxicity tolerance in a durum wheat core collection. In Boron in Soils and Plants, Proceedings of the International Symposium on Boron in Soils and Plants held at Chiang Mai, Thailand, 7–11 September 1997; Bell, R.W., Rerkasem, B., Eds.; Springer: Dordrecht, The Netherlands, 1997; pp. 117–120. [Google Scholar]
  19. Paull, J.; Nable, R.; Rathjen, A. Physiological and genetic control of the tolerance of wheat to high concentrations of boron and implications for plant breeding. Plant Soil 1992, 146, 251–260. [Google Scholar] [CrossRef]
  20. Paull, J.G. Genetic Studies on the Tolerance of Wheat to High Concentrations of Boron. Ph.D. Thesis, University of Adelaide, Adelaide, Australia, 1990. [Google Scholar]
  21. Moody, D.B.; Rathjen, A.J.; Cartwright, B. Yield evaluation of a gene for boron tolerance using backcross-derived lines. In Proceedings of the Genetic Aspects of Plant Mineral Nutrition: The Fourth International Symposium on Genetic Aspects of Plant Mineral Nutrition, Canberra, Australia, 30 September–4 October 1991; Randall, P.J., Delhaize, E., Richards, R.A., Munns, R., Eds.; Springer: Dordrecht, The Netherlands, 1993; pp. 363–366. [Google Scholar]
  22. Yau, S.K.; Ryan, J. Boron Toxicity Tolerance in Crops: A Viable Alternative to Soil Amelioration. Crop Sci. 2008, 48, 854. [Google Scholar] [CrossRef] [Green Version]
  23. Nable, R.O.; Bañuelos, G.S.; Paull, J.G. Boron toxicity. Plant Soil 1997, 193, 181–198. [Google Scholar] [CrossRef]
  24. Nable, R.O. Resistance to boron toxicity amongst several barley and wheat cultivars: A preliminary examination of the resistance mechanism. Plant Soil 1988, 112, 45–52. [Google Scholar] [CrossRef]
  25. Furlani, Â.M.C.; Carvalho, C.P.; Freitas, J.G.d.; Verdial, M.F. Wheat cultivar tolerance to boron deficiency and toxicity in nutrient solution. Sci. Agric. 2003, 60, 359–370. [Google Scholar] [CrossRef]
  26. Torun, A.A.; Yazici, A.; Erdem, H.; Çakmak, İ. Genotypic variation in tolerance to boron toxicity in 70 durum wheat genotypes. Turk. J. Agric. For. 2006, 30, 49–58. [Google Scholar]
  27. Yau, S.; Nachit, M.; Ryan, J.; Hamblin, J. Phenotypic variation in boron-toxicity tolerance at seedling stage in durum wheat (Triticum durum). Euphytica 1995, 83, 185–191. [Google Scholar] [CrossRef]
  28. Hua, T.; Zhang, R.; Sun, H.; Liu, C. Alleviation of boron toxicity in plants: Mechanisms and approaches. Crit. Rev. Environ. Sci. Technol. 2020, 51, 2975–3015. [Google Scholar] [CrossRef]
  29. Reid, R. Can we really increase yields by making crop plants tolerant to boron toxicity? Plant Sci. 2010, 178, 9–11. [Google Scholar] [CrossRef]
  30. Zaharieva, M.; Ayana, N.G.; Hakimi, A.A.; Misra, S.C.; Monneveux, P. Cultivated emmer wheat (Triticum dicoccon Schrank), an old crop with promising future: A review. Genet. Resour. Crop Evol. 2010, 57, 937–962. [Google Scholar] [CrossRef]
  31. Ozkan, H.; Brandolini, A.; Schäfer-Pregl, R.; Salamini, F. AFLP analysis of a collection of tetraploid wheats indicates the origin of emmer and hard wheat domestication in southeast Turkey. Mol. Biol. Evol. 2002, 19, 1797–1801. [Google Scholar] [CrossRef] [Green Version]
  32. Luo, M.C.; Yang, Z.L.; You, F.M.; Kawahara, T.; Waines, J.G.; Dvorak, J. The structure of wild and domesticated emmer wheat populations, gene flow between them, and the site of emmer domestication. Theor. Appl. Genet. 2007, 114, 947–959. [Google Scholar] [CrossRef]
  33. Kayıhan, C.; Öz, M.T.; Eyidoğan, F.; Yücel, M.; Öktem, H.A. Physiological, Biochemical, and Transcriptomic Responses to Boron Toxicity in Leaf and Root Tissues of Contrasting Wheat Cultivars. Plant Mol. Biol. Report. 2017, 35, 97–109. [Google Scholar] [CrossRef]
  34. Zhang, J.; Wang, J.; Jiang, W.; Liu, J.; Yang, S.; Gai, J.; Li, Y. Identification and Analysis of NaHCO3 Stress Responsive Genes in Wild Soybean (Glycine soja) Roots by RNA-seq. Front. Plant Sci. 2016, 7, 1842. [Google Scholar] [CrossRef] [Green Version]
  35. Mahboobi, H.; Yucel, M.; Öktem, H.A. Cell wall uronic acid concentrations of resistant and sensitive cultivars of wheat and barley under boron toxicity. J. Plant Nutr. 2001, 24, 1965–1973. [Google Scholar] [CrossRef]
  36. Pallotta, M.; Schnurbusch, T.; Hayes, J.; Hay, A.; Baumann, U.; Paull, J.; Langridge, P.; Sutton, T. Molecular basis of adaptation to high soil boron in wheat landraces and elite cultivars. Nature 2014, 514, 88–91. [Google Scholar] [CrossRef]
  37. Anders, S.; Huber, W. Differential expression analysis for sequence count data. Genome Biol. 2010, 11, R106. [Google Scholar] [CrossRef] [PubMed] [Green Version]
  38. Li, Q.; Zaim, S.R.; Aberasturi, D.; Berghout, J.; Li, H.; Kenost, C.; Zhang, H.H.; Lussier, Y.A. iDEG: A singlesubject method for assessing gene differential expression from two transcriptomes of an individual. bioRxiv 2018. [Google Scholar] [CrossRef] [Green Version]
  39. Livak, K.J.; Schmittgen, T.D. Analysis of relative gene expression data using real-time quantitative PCR and the 2(-Delta Delta C(T)) Method. Methods 2001, 25, 402–408. [Google Scholar] [CrossRef] [PubMed]
  40. Schnurbusch, T.; Langridge, P.; Sutton, T. The Bo1-specific PCR marker AWW5L7 is predictive of boron tolerance status in a range of exotic durum and bread wheats. Genome 2008, 51, 963–971. [Google Scholar] [CrossRef]
  41. Metwally, A.; El-Shazoly, R.; Hamada, A.M. Effect of boron on growth criteria of some wheat cultivars. J. Biol. Earth Sci. 2012, 2, B1–B9. [Google Scholar]
  42. Coskun, Y.; Olgunsoy, P.; Karatas, N.; Bulut, F.; Yarar, F. Mannitol application alleviates boron toxicity in wheat seedlings. Commun. Soil Sci. Plant Anal. 2014, 45, 944–952. [Google Scholar] [CrossRef]
  43. Amirbakhtiar, N.; Ismaili, A.; Ghaffari, M.R.; Mirdar Mansuri, R.; Sanjari, S.; Shobbar, Z.S. Transcriptome analysis of bread wheat leaves in response to salt stress. PLoS ONE 2021, 16, e0254189. [Google Scholar] [CrossRef]
  44. Cooper, R. Re-discovering ancient wheat varieties as functional foods. J. Tradit. Complement. Med. 2015, 5, 138–143. [Google Scholar] [CrossRef] [Green Version]
  45. Khan, M.K.; Arifuzzaman, M.; Pandey, A.; Turin, M.T.S.; Hamurcu, M.; Athar, T.; Masuda, M.S.; Gokmen Yilmaz, F.; Topal, A.; Gezgin, S. Chapter 21—Advancement in mitigating the effects of boron stress in wheat. In Abiotic Stresses in Wheat; Khan, M.K., Pandey, A., Hamurcu, M., Gupta, O.P., Gezgin, S., Eds.; Academic Press: Cambridge, MA, USA, 2023; pp. 329–338. [Google Scholar]
  46. Nejad, S.G.; Savaghebi, G.; Farahbakhsh, M.; Amiri, R.M.; Rezaei, H. Tolerance of some wheat varieties to boron toxicity. Cereal Res. Commun. 2015, 43, 384–393. [Google Scholar] [CrossRef] [Green Version]
  47. Schnurbusch, T.; Collins, N.C.; Eastwood, R.F.; Sutton, T.; Jefferies, S.P.; Langridge, P. Fine mapping and targeted SNP survey using rice-wheat gene colinearity in the region of the Bo1 boron toxicity tolerance locus of bread wheat. Theor. Appl. Genet. 2007, 115, 451–461. [Google Scholar] [CrossRef]
  48. Kalayci, M.; Alkan, A.; Cakmak, I.; Bayramoğlu, O.; Yilmaz, A.; Aydin, M.; Ozbek, V.; Ekiz, H.; Ozberisoy, F. Studies on differential response of wheat cultivars to boron toxicity. Euphytica 1998, 100, 123–129. [Google Scholar] [CrossRef]
  49. Ozturk, S.E.; Goktay, M.; Has, C.; Babaoglu, M.; Allmer, J.; Doganlar, S.; Frary, A. Boron Hyperaccumulation Mechanisms in Puccinellia distans as Revealed by Transcriptomic Analysis. bioRxiv 2017. [Google Scholar] [CrossRef] [Green Version]
  50. Wang, H.; Wang, H.; Shao, H.; Tang, X. Recent Advances in Utilizing Transcription Factors to Improve Plant Abiotic Stress Tolerance by Transgenic Technology. Front. Plant Sci. 2016, 7, 67. [Google Scholar] [CrossRef] [PubMed] [Green Version]
  51. Dietz, K.-J.; Vogel, M.O.; Viehhauser, A. AP2/EREBP transcription factors are part of gene regulatory networks and integrate metabolic, hormonal and environmental signals in stress acclimation and retrograde signalling. Protoplasma 2010, 245, 3–14. [Google Scholar] [CrossRef] [PubMed]
  52. Xie, Z.; Nolan, T.M.; Jiang, H.; Yin, Y. AP2/ERF Transcription Factor Regulatory Networks in Hormone and Abiotic Stress Responses in Arabidopsis. Front. Plant Sci. 2019, 10, 228. [Google Scholar] [CrossRef] [PubMed] [Green Version]
  53. Tombuloglu, H.; Kekec, G.; Sakcali, M.S.; Unver, T. Transcriptome-wide identification of R2R3-MYB transcription factors in barley with their boron responsive expression analysis. Mol. Genet. Genom. MGG 2013, 288, 141–155. [Google Scholar] [CrossRef] [PubMed]
  54. Nozawa, A.; Takano, J.; Kobayashi, M.; von Wirén, N.; Fujiwara, T. Roles of BOR1, DUR3, and FPS1 in boron transport and tolerance in Saccharomyces cerevisiae. FEMS Microbiol. Lett. 2006, 262, 216–222. [Google Scholar] [CrossRef] [Green Version]
  55. Nuruzzaman, M.; Sharoni, A.M.; Kikuchi, S. Roles of NAC transcription factors in the regulation of biotic and abiotic stress responses in plants. Front. Microbiol. 2013, 4, 248. [Google Scholar] [CrossRef] [Green Version]
  56. Öz, M.T.; Yilmaz, R.; Eyidoğan, F.; Graaff, L.D.; Yücel, M.; Öktem, H.A. Microarray Analysis of Late Response to Boron Toxicity in Barley (Hordeum vulgare L.) Leaves. Turk. J. Agric. For. 2009, 33, 191–202. [Google Scholar] [CrossRef]
  57. Ochiai, K.; Shimizu, A.; Okumoto, Y.; Fujiwara, T.; Matoh, T. Suppression of a NAC-like transcription factor gene improves boron-toxicity tolerance in rice. Plant Physiol. 2011, 156, 1457–1463. [Google Scholar] [CrossRef] [Green Version]
  58. Liu, C.; Xu, X.; Kan, J.; Ming Cheng, Z.; Chang, Y.; Lin, J.; Li, H. Genome-wide analysis of the C3H zinc finger family reveals its functions in salt stress responses of Pyrus betulaefolia. PeerJ 2020, 8, e9328. [Google Scholar] [CrossRef] [PubMed]
  59. Liu, F.; Xu, Y.; Han, G.; Zhou, L.; Ali, A.; Zhu, S.; Li, X. Molecular Evolution and Genetic Variation of G2-Like Transcription Factor Genes in Maize. PLoS ONE 2016, 11, e0161763. [Google Scholar] [CrossRef] [PubMed] [Green Version]
  60. Peng, X.; Wu, Q.; Teng, L.; Tang, F.; Pi, Z.; Shen, S. Transcriptional regulation of the paper mulberry under cold stress as revealed by a comprehensive analysis of transcription factors. BMC Plant Biol. 2015, 15, 108. [Google Scholar] [CrossRef] [PubMed] [Green Version]
  61. Wu, R.; Guo, L.; Wang, R.; Zhang, Q.; Yao, H. Genome-Wide Identification and Characterization of G2-Like Transcription Factor Genes in Moso Bamboo (Phyllostachys edulis). Molecules 2022, 27, 5491. [Google Scholar] [CrossRef] [PubMed]
  62. Wang, Z.-y.; Zhao, S.; Liu, J.-F.; Zhao, H.-y.; Sun, X.-y.; Wu, T.-r.; Pei, T.; Wang, Y.; Liu, Q.-F.; Yang, H.-H.; et al. Genome-wide identification of Tomato Golden 2-Like transcription factors and abiotic stress related members screening. BMC Plant Biol. 2022, 22, 82. [Google Scholar] [CrossRef] [PubMed]
  63. Kumari, P.; Kakkar, M.; Gahlaut, V.; Jaiswal, V.; Kumar, S. Multifarious roles of GRAS transcription factors in plants. Preprints 2021, 2021030066. [Google Scholar]
  64. Chen, Y.; Tai, S.; Wang, D.; Ding, A.; Sun, T.; Wang, W.; Sun, Y. Homology-based analysis of the GRAS gene family in tobacco. Genet. Mol. Res. 2015, 14, 15188–15200. [Google Scholar] [CrossRef]
  65. Öztürk, S.E.; Göktay, M.; Has, C.; Babaoğlu, M.; Allmer, J.; Doğanlar, S.; Frary, A. Transcriptomic analysis of boron hyperaccumulation mechanisms in Puccinellia distans. Chemosphere 2018, 199, 390–401. [Google Scholar] [CrossRef]
  66. Miwa, K.; Fujiwara, T. Boron transport in plants: Co-ordinated regulation of transporters. Ann. Bot. 2010, 105, 1103–1108. [Google Scholar] [CrossRef] [Green Version]
  67. Kayihan, C.; Aksoy, E.; Mutlu, S.N. Boron toxicity induces sulfate transporters at transcriptional level in Arabidopsis thaliana. Turk. J. Bot. 2023, 47, 1–22. [Google Scholar] [CrossRef]
  68. Padmanabhan, P.; Babaoglu, M.; Terry, N. A comparative transcriptomic analysis of the extremely boron tolerant plant Puccinellia distans with the moderately boron tolerant Gypsophila arrostil. Plant Cell Rep. 2012, 31, 1407–1413. [Google Scholar] [CrossRef] [PubMed]
  69. Pommerrenig, B.; Diehn, T.A.; Bienert, G.P. Metalloido-porins: Essentiality of Nodulin 26-like intrinsic proteins in metalloid transport. Plant Sci. 2015, 238, 212–227. [Google Scholar] [CrossRef] [PubMed] [Green Version]
  70. Macho-Rivero, M.A.; Herrera-Rodríguez, M.B.; Brejcha, R.; Schäffner, A.R.; Tanaka, N.; Fujiwara, T.; González-Fontes, A.; Camacho-Cristóbal, J.J. Boron toxicity reduces water transport from root to shoot in Arabidopsis plants. Evidence for a reduced transpiration rate and expression of major PIP aquaporin genes. Plant Cell Physiol. 2018, 59, 841–849. [Google Scholar] [CrossRef]
  71. Martinez-Cuenca, M.-R.; Martinez-Alcantara, B.; Quinones, A.; Ruiz, M.; Iglesias, D.J.; Primo-Millo, E.; Forner-Giner, M.A. Physiological and molecular responses to excess boron in Citrus macrophylla W. PLoS ONE 2015, 10, e0134372. [Google Scholar] [CrossRef]
  72. Kumar, S.; Pandey, A.K. Chemistry and biological activities of flavonoids: An overview. Sci. World J. 2013, 2013, 162750. [Google Scholar] [CrossRef] [Green Version]
  73. Martinoia, E.; Maeshima, M.; Neuhaus, H.E. Vacuolar transporters and their essential role in plant metabolism. J. Exp. Bot. 2007, 58, 83–102. [Google Scholar] [CrossRef]
  74. Roytrakul, S.; Verpoorte, R. Role of vacuolar transporter proteins in plant secondary metabolism: Catharanthus roseus cell culture. Phytochem. Rev. 2007, 6, 383–396. [Google Scholar] [CrossRef] [Green Version]
  75. Yıldırım, K.; Uylaş, S. Genome-wide transcriptome profiling of black poplar (Populus nigra L.) under boron toxicity revealed candidate genes responsible in boron uptake, transport and detoxification. Plant Physiol. Biochem. 2016, 109, 146–155. [Google Scholar] [CrossRef]
  76. Fu, Y.; Zhang, H.; Mandal, S.N.; Wang, C.; Chen, C.; Ji, W. Quantitative proteomics reveals the central changes of wheat in response to powdery mildew. J. Proteom. 2016, 130, 108–119. [Google Scholar] [CrossRef]
  77. Fan, Y.; Chen, J.; Wang, Z.; Tan, T.; Li, S.; Li, J.; Wang, B.; Zhang, J.; Cheng, Y.; Wu, X. Soybean (Glycine max L. Merr.) seedlings response to shading: Leaf structure, photosynthesis and proteomic analysis. BMC Plant Biol. 2019, 19, 1–12. [Google Scholar] [CrossRef] [PubMed] [Green Version]
  78. Horton, P.; Ruban, A.; Walters, R. Regulation of light harvesting in green plants. Annu. Rev. Plant. Biol. 1996, 47, 655–684. [Google Scholar] [CrossRef] [PubMed]
  79. Li, Q.; Zheng, Q.; Shen, W.; Cram, D.; Fowler, D.B.; Wei, Y.; Zou, J. Understanding the biochemical basis of temperature-induced lipid pathway adjustments in plants. Plant Cell 2015, 27, 86–103. [Google Scholar] [CrossRef] [PubMed] [Green Version]
  80. Arefian, M.; Vessal, S.; Malekzadeh-Shafaroudi, S.; Siddique, K.H.; Bagheri, A. Comparative proteomics and gene expression analyses revealed responsive proteins and mechanisms for salt tolerance in chickpea genotypes. BMC Plant Biol. 2019, 19, 300. [Google Scholar] [CrossRef] [Green Version]
  81. Lopes, K.L.; Rodrigues, R.A.O.; Silva, M.C.; Braga, W.G.S.; Silva-Filho, M.C. The Zinc-Finger Thylakoid-Membrane Protein FIP Is Involved With Abiotic Stress Response in Arabidopsis thaliana. Front. Plant Sci. 2018, 9, 504. [Google Scholar] [CrossRef] [Green Version]
  82. Seo, K.-I.; Lee, J.-H.; Nezames, C.D.; Zhong, S.; Song, E.; Byun, M.-O.; Deng, X.W. ABD1 Is an Arabidopsis DCAF Substrate Receptor for CUL4-DDB1–Based E3 Ligases That Acts as a Negative Regulator of Abscisic Acid Signaling. Plant Cell 2014, 26, 695–711. [Google Scholar] [CrossRef] [Green Version]
  83. Zhang, H.; Yang, Y.; Wang, C.; Liu, M.; Li, H.; Fu, Y.; Wang, Y.; Nie, Y.; Liu, X.; Ji, W. Large-scale transcriptome comparison reveals distinct gene activations in wheat responding to stripe rust and powdery mildew. BMC Genom. 2014, 15, 898. [Google Scholar] [CrossRef] [Green Version]
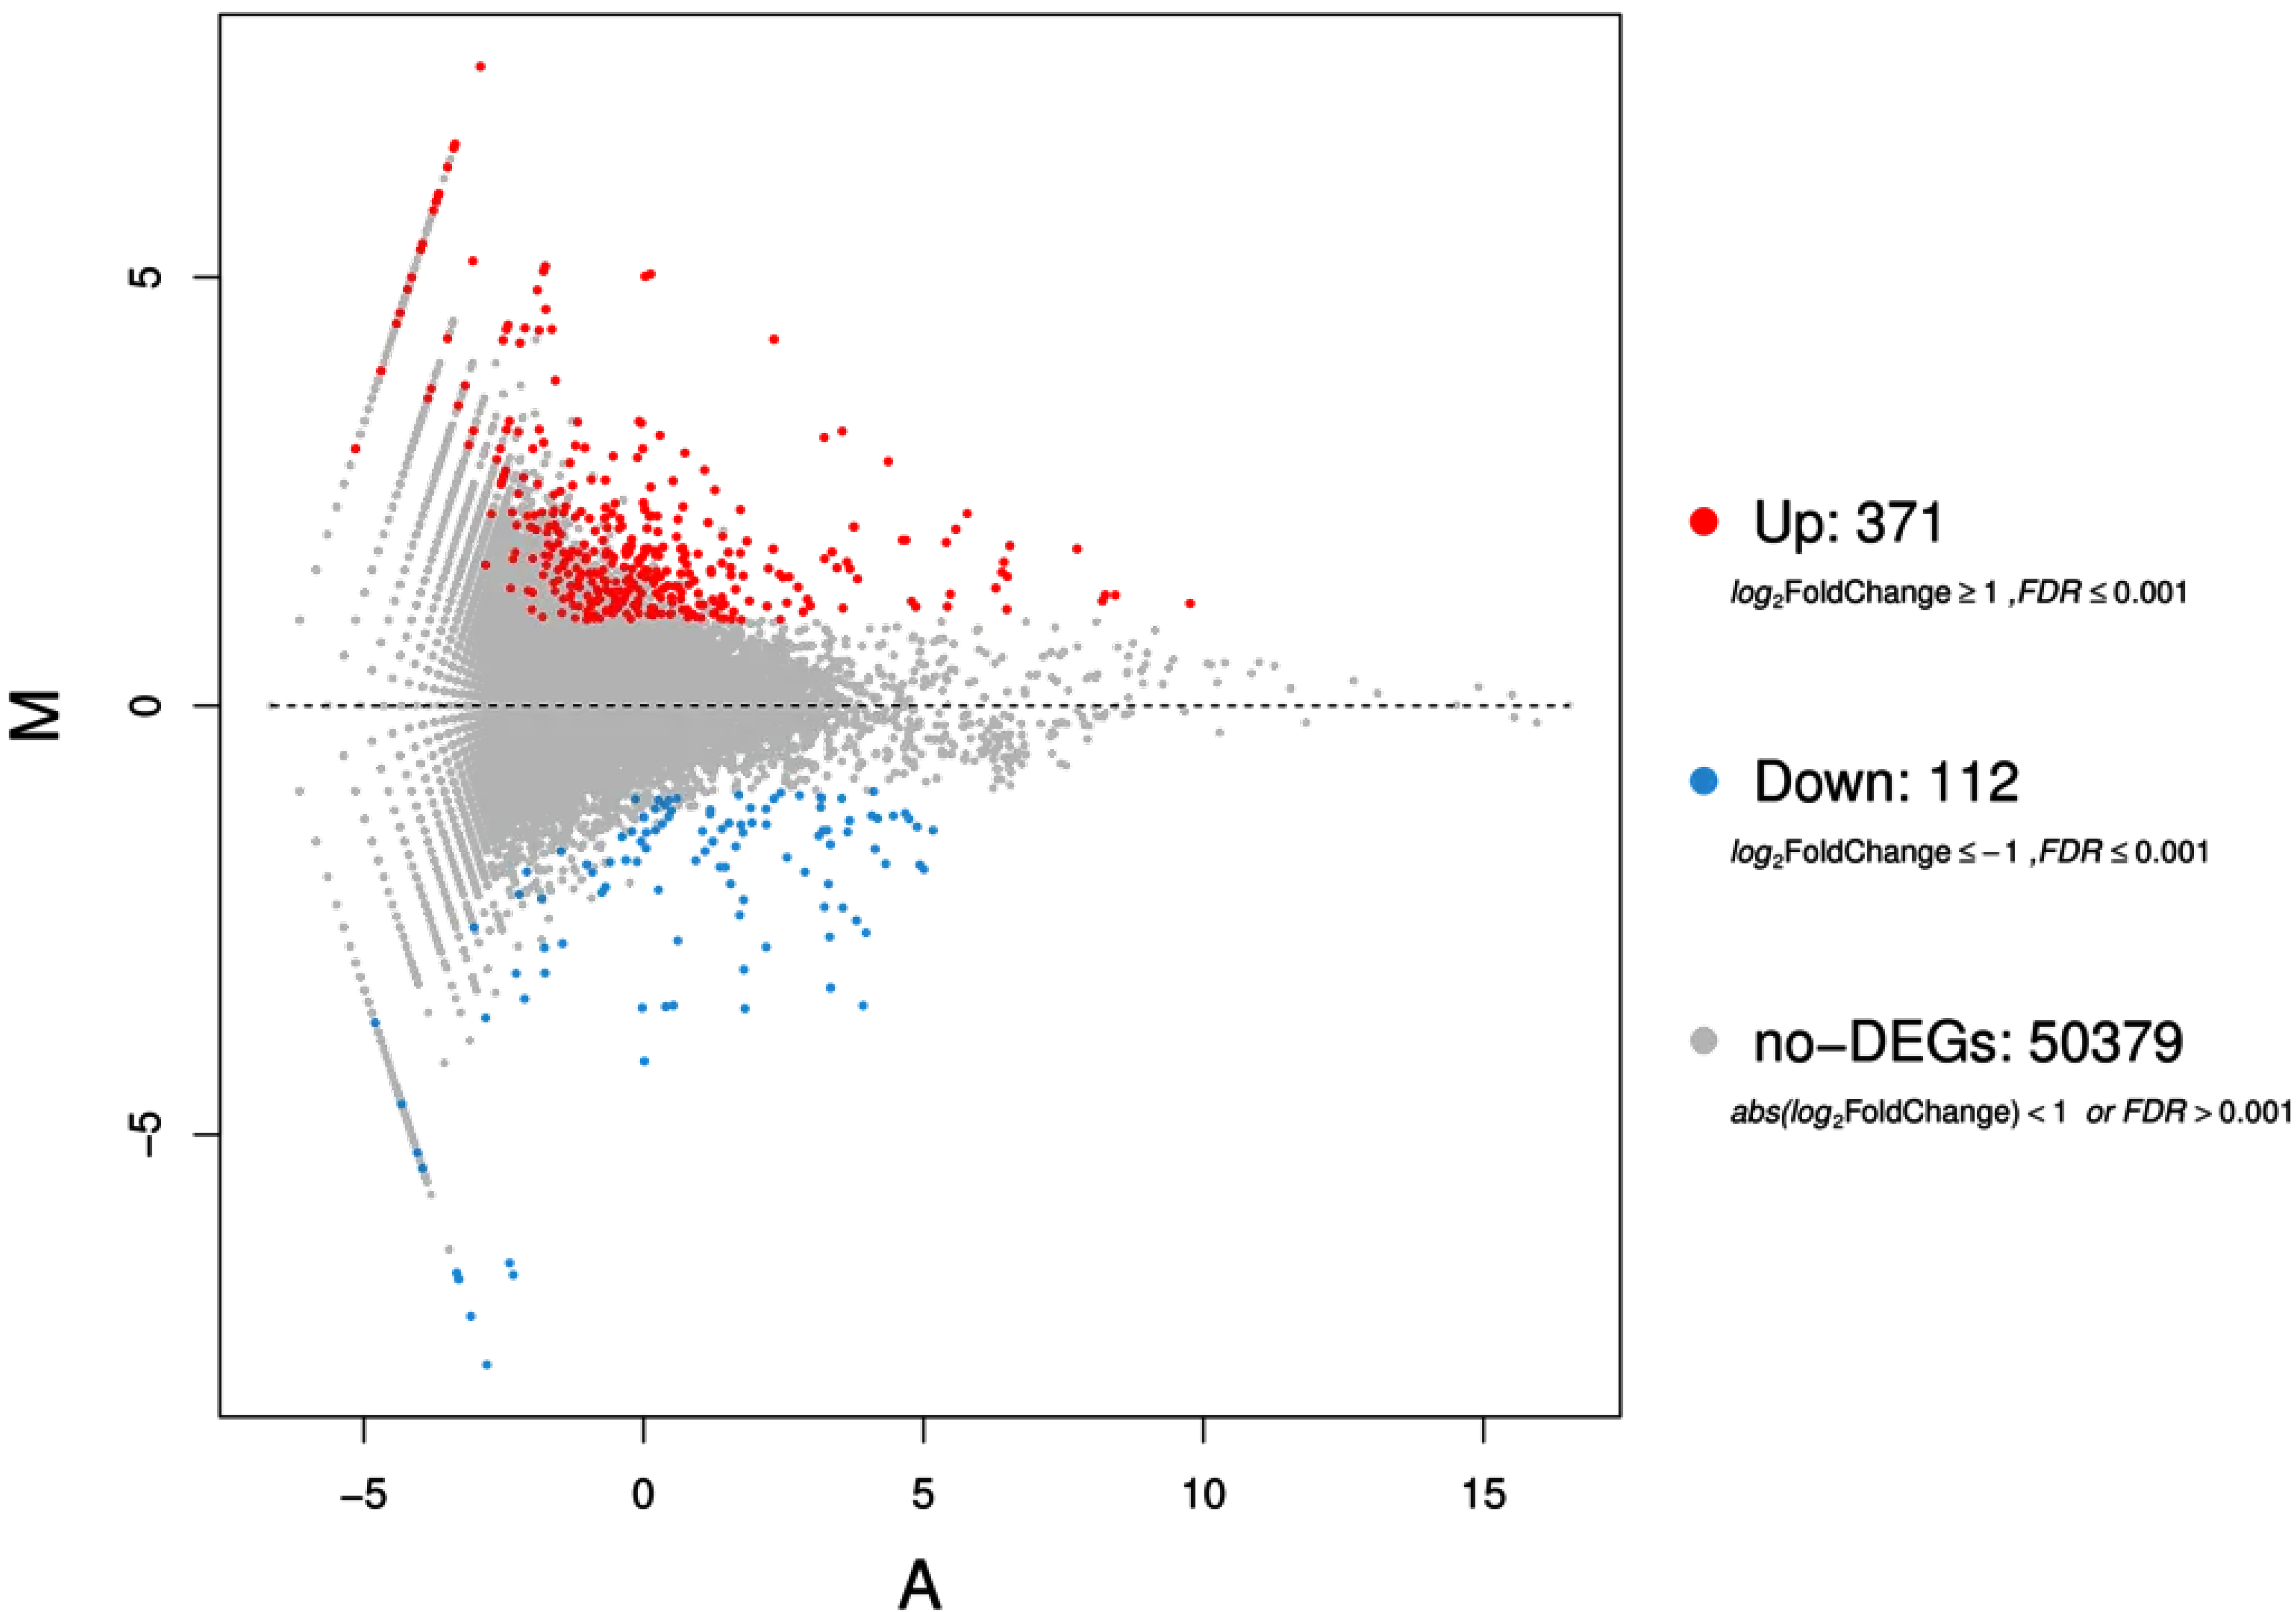
Figure 1. MA plot showing genes differentially expressed (blue and red dots) in high-B (TB 10 mM)-treated shoots of the T. dicoccum (Td) genotype PI94655 compared to 3.1 μM B (control) treatment. Y axis (M) and X axis (A) denote log2 transformed fold change and log2 transformed mean expression level, respectively.
Agronomy 13 00631 g001
Figure 2. Figure shows gene ontology classification of genes differentially expressed in high-B (TB 10 mM)-treated shoots of the T. dicoccum (Td) genotype PI94655 compared to 3.1 μM B (control) treatment. While the gene ontology term is denoted by Y axis, the X axis denotes the number of DEG in the biological process, cellular component, and molecular function.
Agronomy 13 00631 g002
Figure 3. KEGG pathway functional enrichment of genes differentially expressed in high-B (TB 10 mM)-treated shoots of the T. dicoccum (Td) genotype, PI94655 compared to 3.1 μM B (control) treatment. While the enrichment factor is presented on the X axis, the pathway name is shown on the Y axis. The lower (blue) q-value denotes the more significant enrichment, while the higher (white) q-value denotes the less significant enrichment. Point size shows the number of DEGs.
Agronomy 13 00631 g003
Figure 4. Abundance of transcription factors in transcription factor families in highly toxic B (TB 10 mM)-treated shoots of the T. dicoccum (Td) genotype, PI94655 compared to control (3.1 μM B) treatment.
Agronomy 13 00631 g004
Figure 5. Relative expression of TdG1 (TraesCS3B02G001500), TdG2 (TraesCS3B02G252900), TdG3 (TraesCS3B02G191500) and TdG4 (TraesCS3B02G388100) of high-B (TB 10 mM)-treated shoots of the T. dicoccum (Td) genotype, PI94655 compared to 3.1 μM B (control) treatment in relation to the reference gene, TaGAP. The values are provided as average expression of three individual replicates with standard error mean normalized to control.
Agronomy 13 00631 g005
Table 1. Details of the differentially expressed genes (DEGs) of T. dicoccum shoots chosen from RNA sequencing results for RT-qPCR confirmation and the designed primers.
Gene CodeSelected GeneAnnotated Gene Informationlog2 Fold Change
RNA seq
Primer TypeSequence (5’->3’)
TdG1TraesCS3B02G001500PREDICTED: Triticum dicoccoides swi5-dependent recombination DNA repair protein 1 homolog (LOC119274246), mRNA10.68Forward primerCCACTGTAAACGGCGCTAGA
Reverse primerGGATCGGTTGGGGTTGCTTT
TdG2TraesCS3B02G252900PREDICTED: Triticum dicoccoides ATP-dependent zinc metalloprotease FTSH 9, chloroplastic/mitochondrial (LOC119276292), mRNA14.69Forward primerGCTGAGAAGTGCATCACGCT
Reverse primerGTTTCCTTTAAACAATGGCGAGGCA
TdG3TraesCS3B02G191500PREDICTED: Triticum dicoccoides DDB1- and CUL4-associated factor 13-like (LOC119275595), mRNA8.69Forward primerCTTGCAAACCTTGGACAGCG
Reverse primerACAGCGATTGATTGACGGAGG
TdG4TraesCS3B02G388100PREDICTED: Triticum dicoccoides UDP-glucuronic acid decarboxylase 1-like (LOC119277519), mRNA13.04Forward primerGCCGCGTGGTTAGCAATTTT
Reverse primerGCCATCAATCCAGCAACCAG
Table 2. Percentage changes in the physiological parameters of the Triticum dicoccum genotype PI94655 and check cultivar Bolal 2973 grown in high-B (10 mM B) conditions as compared to control.
AccessionsPI94655Bolal 2973
Traits/SpeciesTriticum turgidum subsp. dicoccumTriticum aestivum subsp. aestivum
Root Length−2−50
Shoot Length4−38
Root Fresh Weight3−108
Shoot Fresh Weight−7−30
Root Dry Weight10−53
Shoot Dry Weight160
Table 3. Quality estimation results of sequencing data of shoots of T. dicoccum (Td) grown in high-B (10 mM B) conditions as compared to control (3.1 μM B), and the statistics of reference genome alignment.
Parameters/SampleTd_ControlTd_TB_
Treatment
Parameters/SampleTd_ControlTd_TB_
Treatment
Total Clean Reads (M)76.9275.27Uniquely Gene Mapping Ratio (%)51.2848.54
Total Clean Bases (Gb)7.697.53Total Gene Number43,85244,921
Clean Reads Q20 (%)97.4397.42Known Gene Number42,22743,309
Clean Reads Q30 (%)90.3990.30Novel Gene Number16251612
Total Genome Mapping Ratio (%)14.6916.68Total Transcript Number49,47151,449
Uniquely Genome Mapping Ratio (%)4.845.50Known Transcript Number43,45845,256
Total Gene Mapping Ratio (%)87.6085.93Novel Transcript Number60136193
Table 4. Significant 15 KEGG pathways based on genes differentially expressed in high-B (TB 10 mM)-treated shoots of the T. dicoccum (Td) genotype, PI94655 compared to 3.1 μM B (control) treatment.
PathwayPathway IDNo. of Genes Annotated in this PathwayLevel 1Level 2
Metabolic pathwaysko01100172MetabolismGlobal and overview maps
Biosynthesis of secondary metabolitesko0111062MetabolismGlobal and overview maps
Oxidative phosphorylationko0019032MetabolismEnergy metabolism
Photosynthesis—antenna proteinsko0019621MetabolismEnergy metabolism
Ribosomeko0301019Genetic Information ProcessingTranslation
RNA transportko0301319Genetic Information ProcessingTranslation
mRNA surveillance pathwayko0301518Genetic Information ProcessingTranslation
RNA polymeraseko0302017Genetic Information ProcessingTranscription
Starch and sucrose metabolismko0050017MetabolismCarbohydrate metabolism
Phenylpropanoid biosynthesisko0094016MetabolismBiosynthesis of other secondary metabolites
Disclaimer/Publisher’s Note: The statements, opinions and data contained in all publications are solely those of the individual author(s) and contributor(s) and not of MDPI and/or the editor(s). MDPI and/or the editor(s) disclaim responsibility for any injury to people or property resulting from any ideas, methods, instructions or products referred to in the content.