Abstract
The balance between vegetative and reproductive growth is the central objective in the cotton production system, which is associated with cotton maturity and yield. In China, manual topping (MT) has been performed many years prior to or during the flowering period to inhibit vegetative growth and enhance reproductive growth. MT is gradually being replaced by chemical topping (CT) with mepiquat chloride (MC, 180 g ha−1, 98% soluble powder) due to labor shortages and increasing labor cost. To determine whether CT influences cotton maturity and yield relative to MT, we carried out field experiments at four locations in the Yellow River Valley of China during 2018–2020. The results showed that CT did not alter the boll age, and although it produced taller and slender spatial boll distribution under several environments, it had little effect on the accumulation of boll fraction (the number of bolls in a given period divided by total boll number) over time at the end of blooming across locations. As a result, there were no significant differences between MT and CT in boll opening percentage in the late season. CT did not influence yield or yield components, except under severe drought. Therefore, CT with MC (180 g/ha, 98% soluble powder) during the flowering period will not compromise the maturity or yield of cotton in the Yellow River Valley of China. Similar outcomes would be achieved in other areas with similar ecological conditions and social conditions that require an alternative to extensive manual labor.
1. Introduction
Cotton has an indeterminate growth habit in which both vegetative and reproductive growth occur at the same time. Too small a vegetative structure on the plant results in reduced yield potential, and too much vegetative development compromises fruit set and yield. Accordingly, the central objective in a cotton production system is to provide a well-balanced level of development between the vegetative structure and the crop’s fruit, hence the vegetative/reproductive balance [1].
In addition, a well-balanced vegetative/reproductive growth will result in earliness. In general, when boll set is continuous over time, the plant stops producing new fruit due to demand on the assimilate supply by the developing fruit, leaving none for the initiation of new fruiting sites [2]. However, in good growing conditions (moderate temperatures, good soil moisture, and adequate fertility), cotton can maintain the production of new fruit for an extended time. As a result, not all cotton fruit is mature at harvest time, thus leading to late maturity. Harvesting a mature crop is essential for maximizing yield, crop quality, and economic return [3].
Many production strategies and management decisions are usually made to balance vegetative/reproductive growth. Mepiquat chloride (MC) is an anti-gibberellin growth retardant that reduces plant cell enlargement to control rank growth by reducing stem elongation at newly formed internodes, and thus helps balance vegetative and reproductive growth [4,5,6]. In addition, because of the shorter growing seasons in China (about 2500 DD60s vs about 2600 DD60s in the cotton belt of the US) and thus less concern about regrowth caused by manual topping (MT), the manual removal of the top of the main stem (i.e., MT) during the bloom period is the traditional method of transitioning cotton from vegetative to reproductive growth [7]. However, due to recent shortages and the high cost of labor, MT in China is being replaced by an extra MC application in addition to the conventional multiple application of MC simultaneously with MT, which is known as chemical topping (CT) [5,8,9].
Many studies have shown that MC applications can hasten cotton maturity by enhancing retention of early buds and bolls, as well as reducing boll age [10,11,12,13,14]. However, whether CT with an extra MC application (in addition to regular multiple MC applications) during flowering would affect cotton maturity compared with MT (also experiencing regular multiple MC application) remains unclear. Theoretically, a common effect of MT and CT is the inhibition of vegetative growth of cotton plants. However, MT can eliminate the apical dominance immediately and stop the formation of new nodes, whereas CT only weakens the apical dominance gradually, possibly allowing plants to produce more fruiting branches, and the vegetative growth may be more vigorous than that under MT in some periods. Thus, we hypothesized that CT may delay maturity relative to MT.
Plant mapping of fruit locations by main-stem node and sympodial fruiting position within the plant canopy is an important approach to estimating crop maturity [14,15]. Usually, bolls in the lower fruiting branches and inner fruiting nodes have more heat resource to mature [16]. Therefore, the more bolls in these parts, the more likely the plant matures early.
Few studies have investigated the effects of CT on boll distribution and cotton maturity. Zhang et al. [14] showed that there were no significant differences between CT and MT in the N50 values (the node at which 50% of the total yield is derived) and pre-frost boll opening rate, but CT enhanced earliness by smaller N90 values. Li et al. [17] reported that CT enhanced maturity better than MT, characterized by higher percentage of boll opening in late September and higher ratio of yield at first harvest to total yield. According to Dai et al. [18], there were few differences in earliness (the percentage of the first two harvests to total harvest) between MT and CT regardless of plant density and ecological conditions. These contrasting reports suggest no certainty on the effects of CT on cotton maturity. In addition, the methods adopted in these previous studies to measure cotton maturity were not comprehensive. Most of them focused on end-of-season maturity and ignored the boll maturation period or accumulation of boll fraction over time. For studies involving use of defoliants [19,20], the ratio of first or first two harvests to total yield was likely influenced by the interaction between defoliants and CT.
In this study, a multiple-site field experiment was performed in the Yellow River region of China during 2018–2020. The boll age (boll maturation period), spatial boll distribution, boll accumulation by cohorts (each cohort containing individual bolls of nearly the same age) [21], and open boll percentage at defoliation were used to compare cotton maturity under MT and CT. The effects of CT on cotton yield were also investigated. The results would improve our understanding of the role and how to more efficiently use CT for the field management of cotton.
2. Materials and Methods
2.1. Location and Cultivar
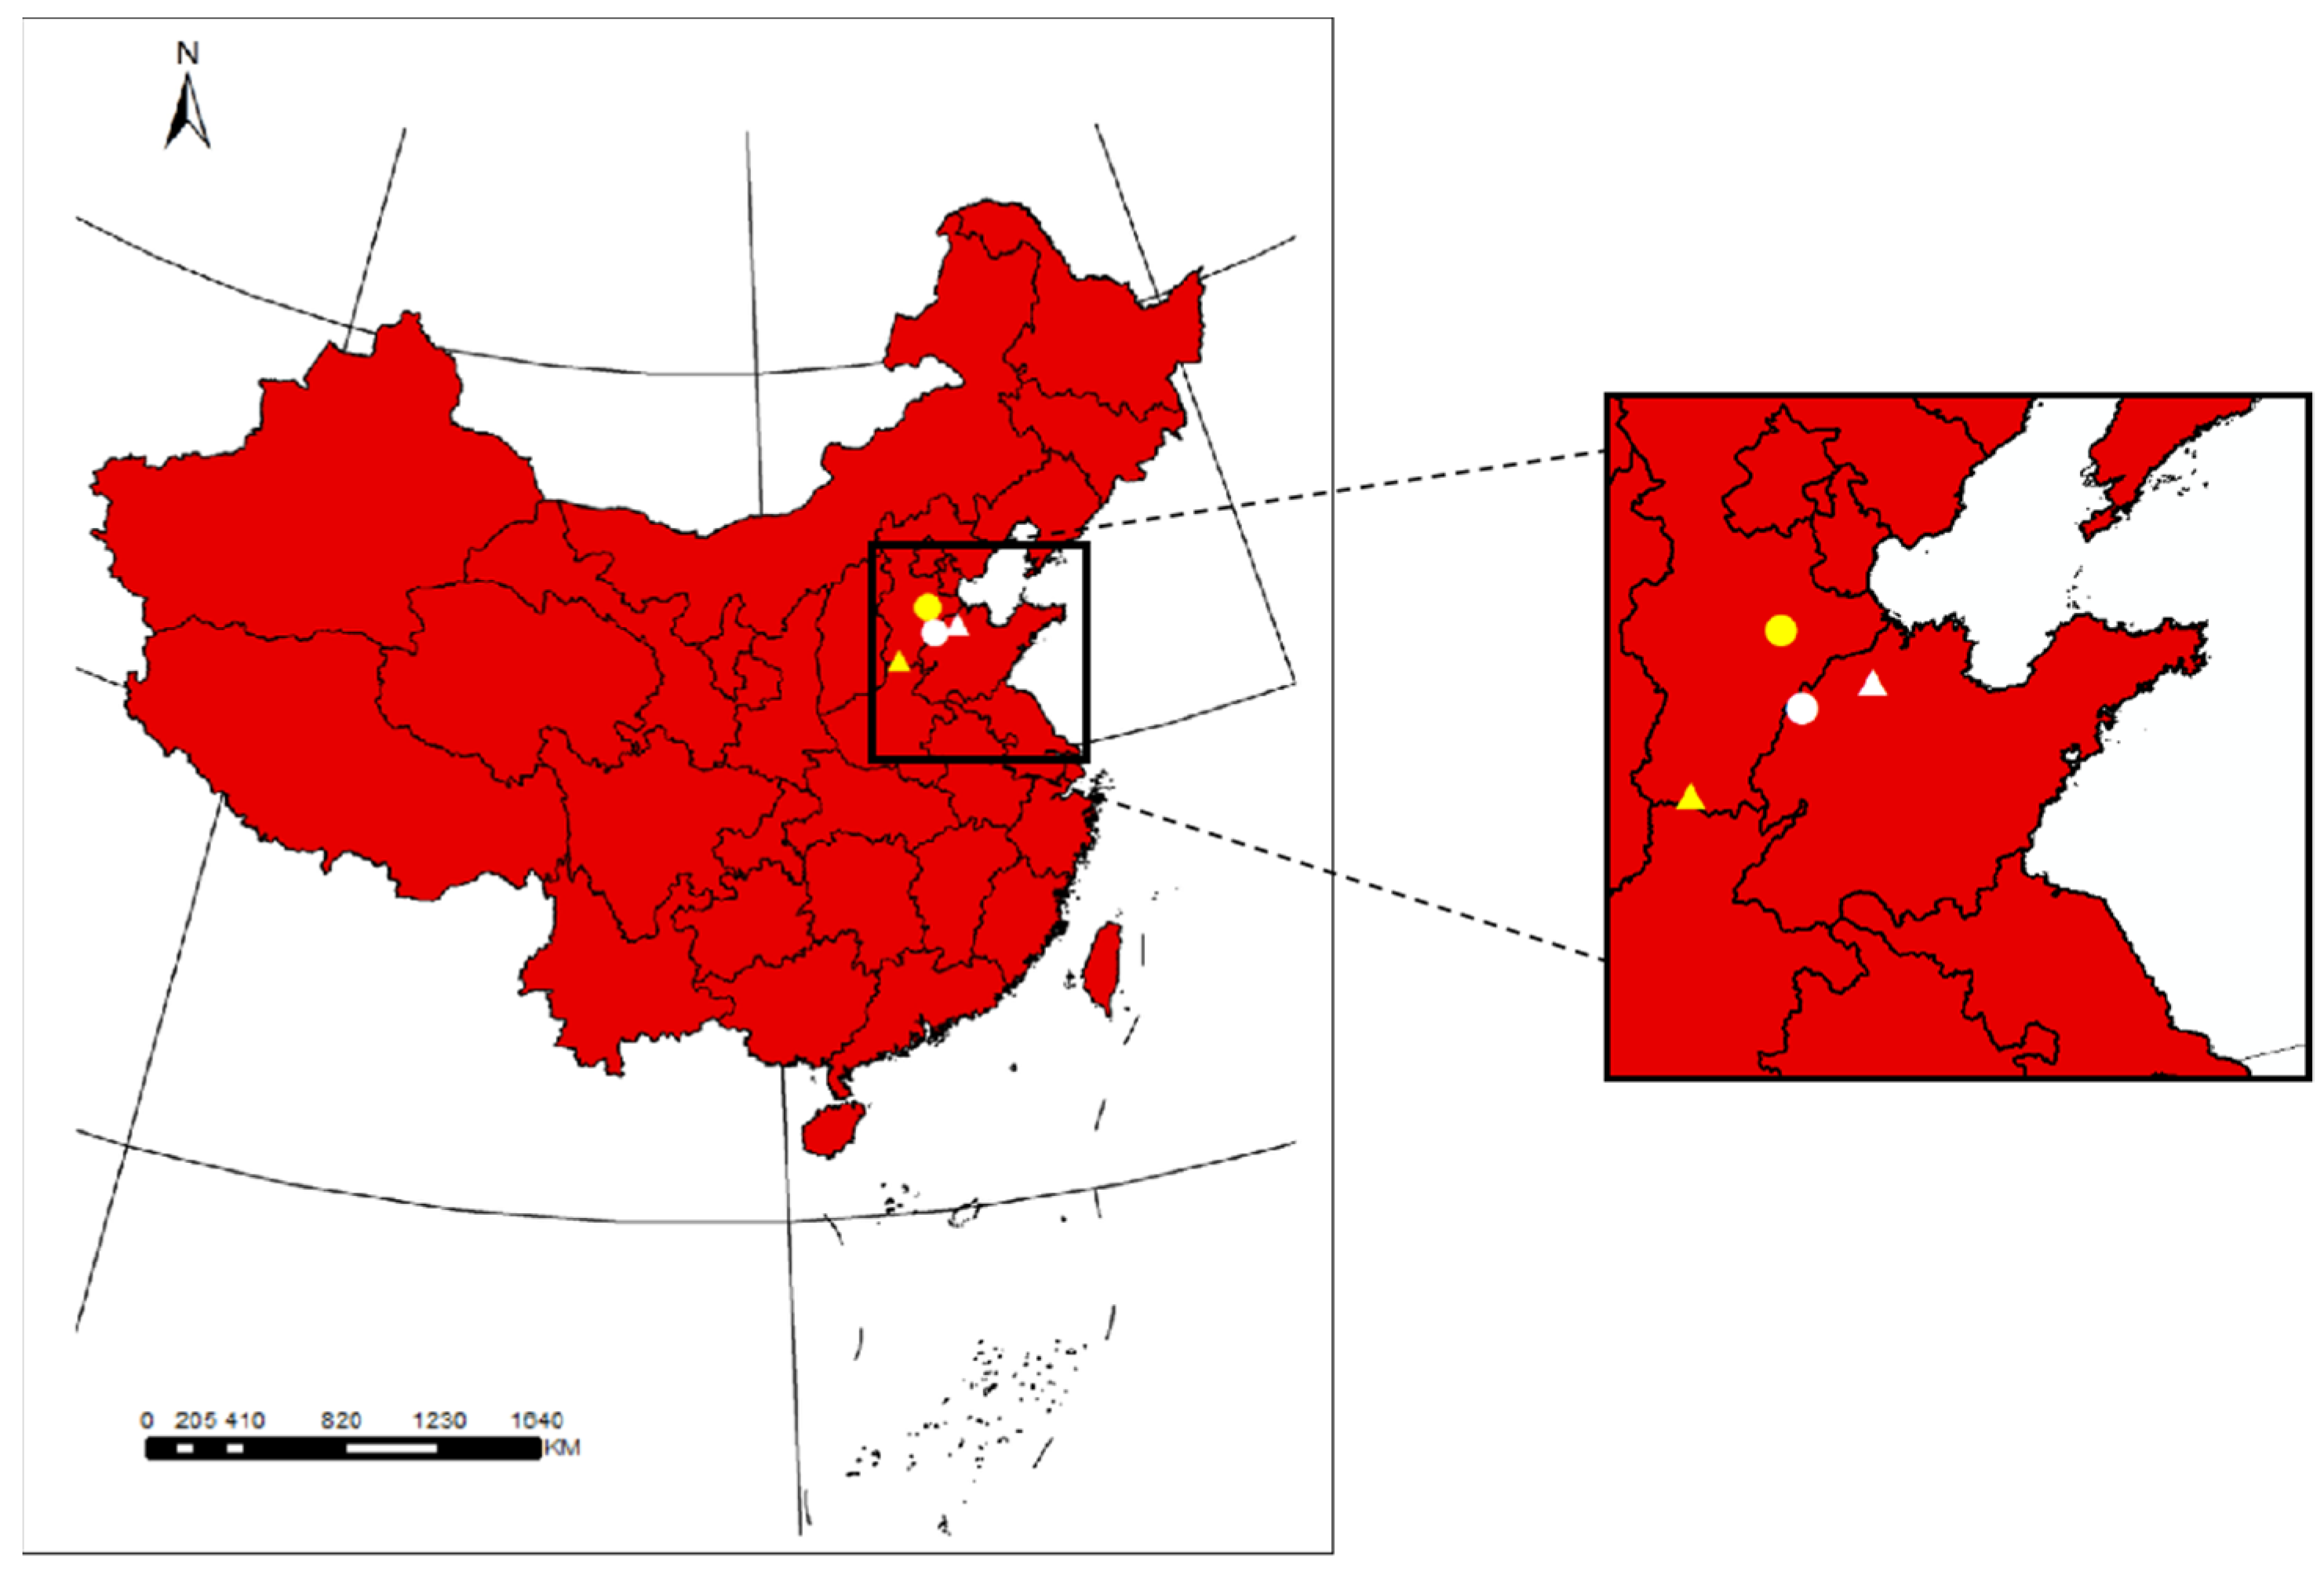
The experiments were conducted at four locations (Figure 1) in the Yellow River region of China during the growing seasons of 2018–2020. These were Hejian (38°27′09.76″ N, 116°06′20.26″ E) and Handan (36°37′55.88″ N, 114°32′44.27″ E) in Hebei Province and Dezhou (37°26′27.06″ N, 116°22′4.27″ E) and Binzhou (37°46′45.81″ N, 117°37′42.37″ E) in Shandong Province. In 2018, the cultivar Xinkang 4 (developed by Hebei Cottonseed Engineering Technology Research Center, Hejian, Hebei Province) and Han 853 (developed by Handan Academy of Agricultural Sciences, Handan, Hebei Province) were used in Hejian and Handan, respectively, and SCRC 37 (developed by Cotton Research Center, Shandong Academy of Agricultural Sciences, Jinan, Shandong Province) was used in both Dezhou and Binzhou. Guoxin18-4 and Guoxin 26 (both developed by Hebei Cottonseed Engineering Technology Research Center, Hejian, Hebei Province) were used for all locations in 2019 and 2020. The major agronomic practices for cotton production in these locations are shown in Table 1.

Figure 1.
Location of the experiment sites. Yellow point and yellow triangle represent Hejian and Handan, Hebei Province; white point and white triangle represent Dezhou and Binzhou, Shandong Province.

Table 1.
Major agronomic practices for cotton production in the study locations.
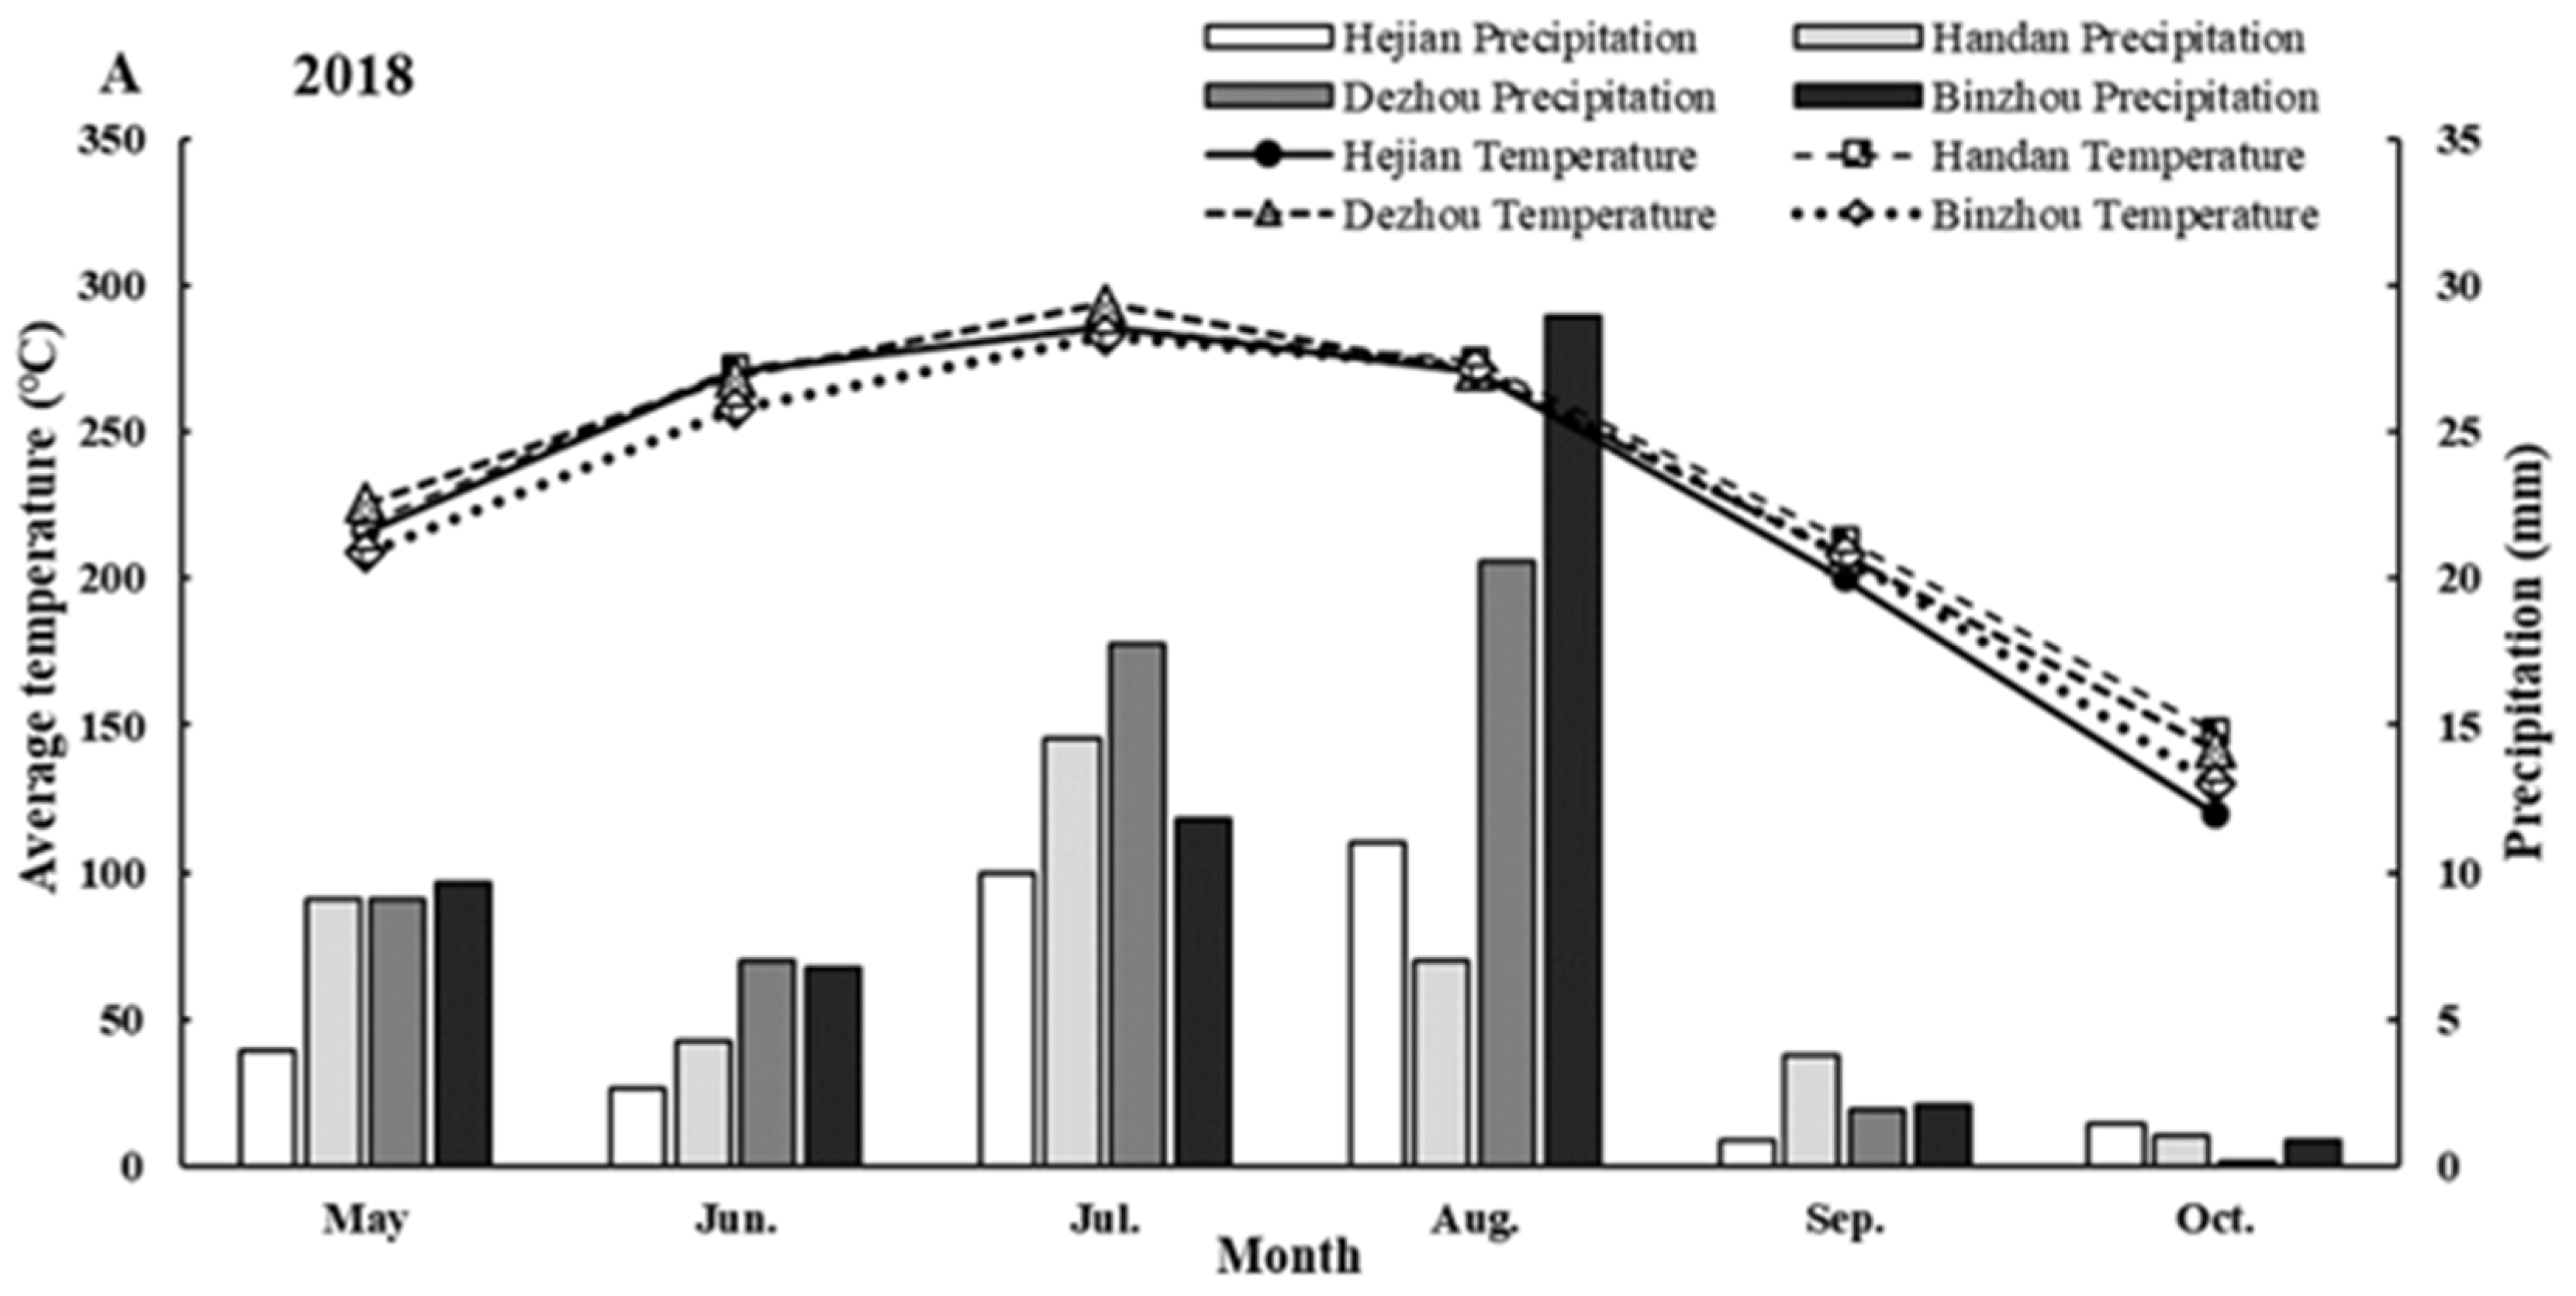
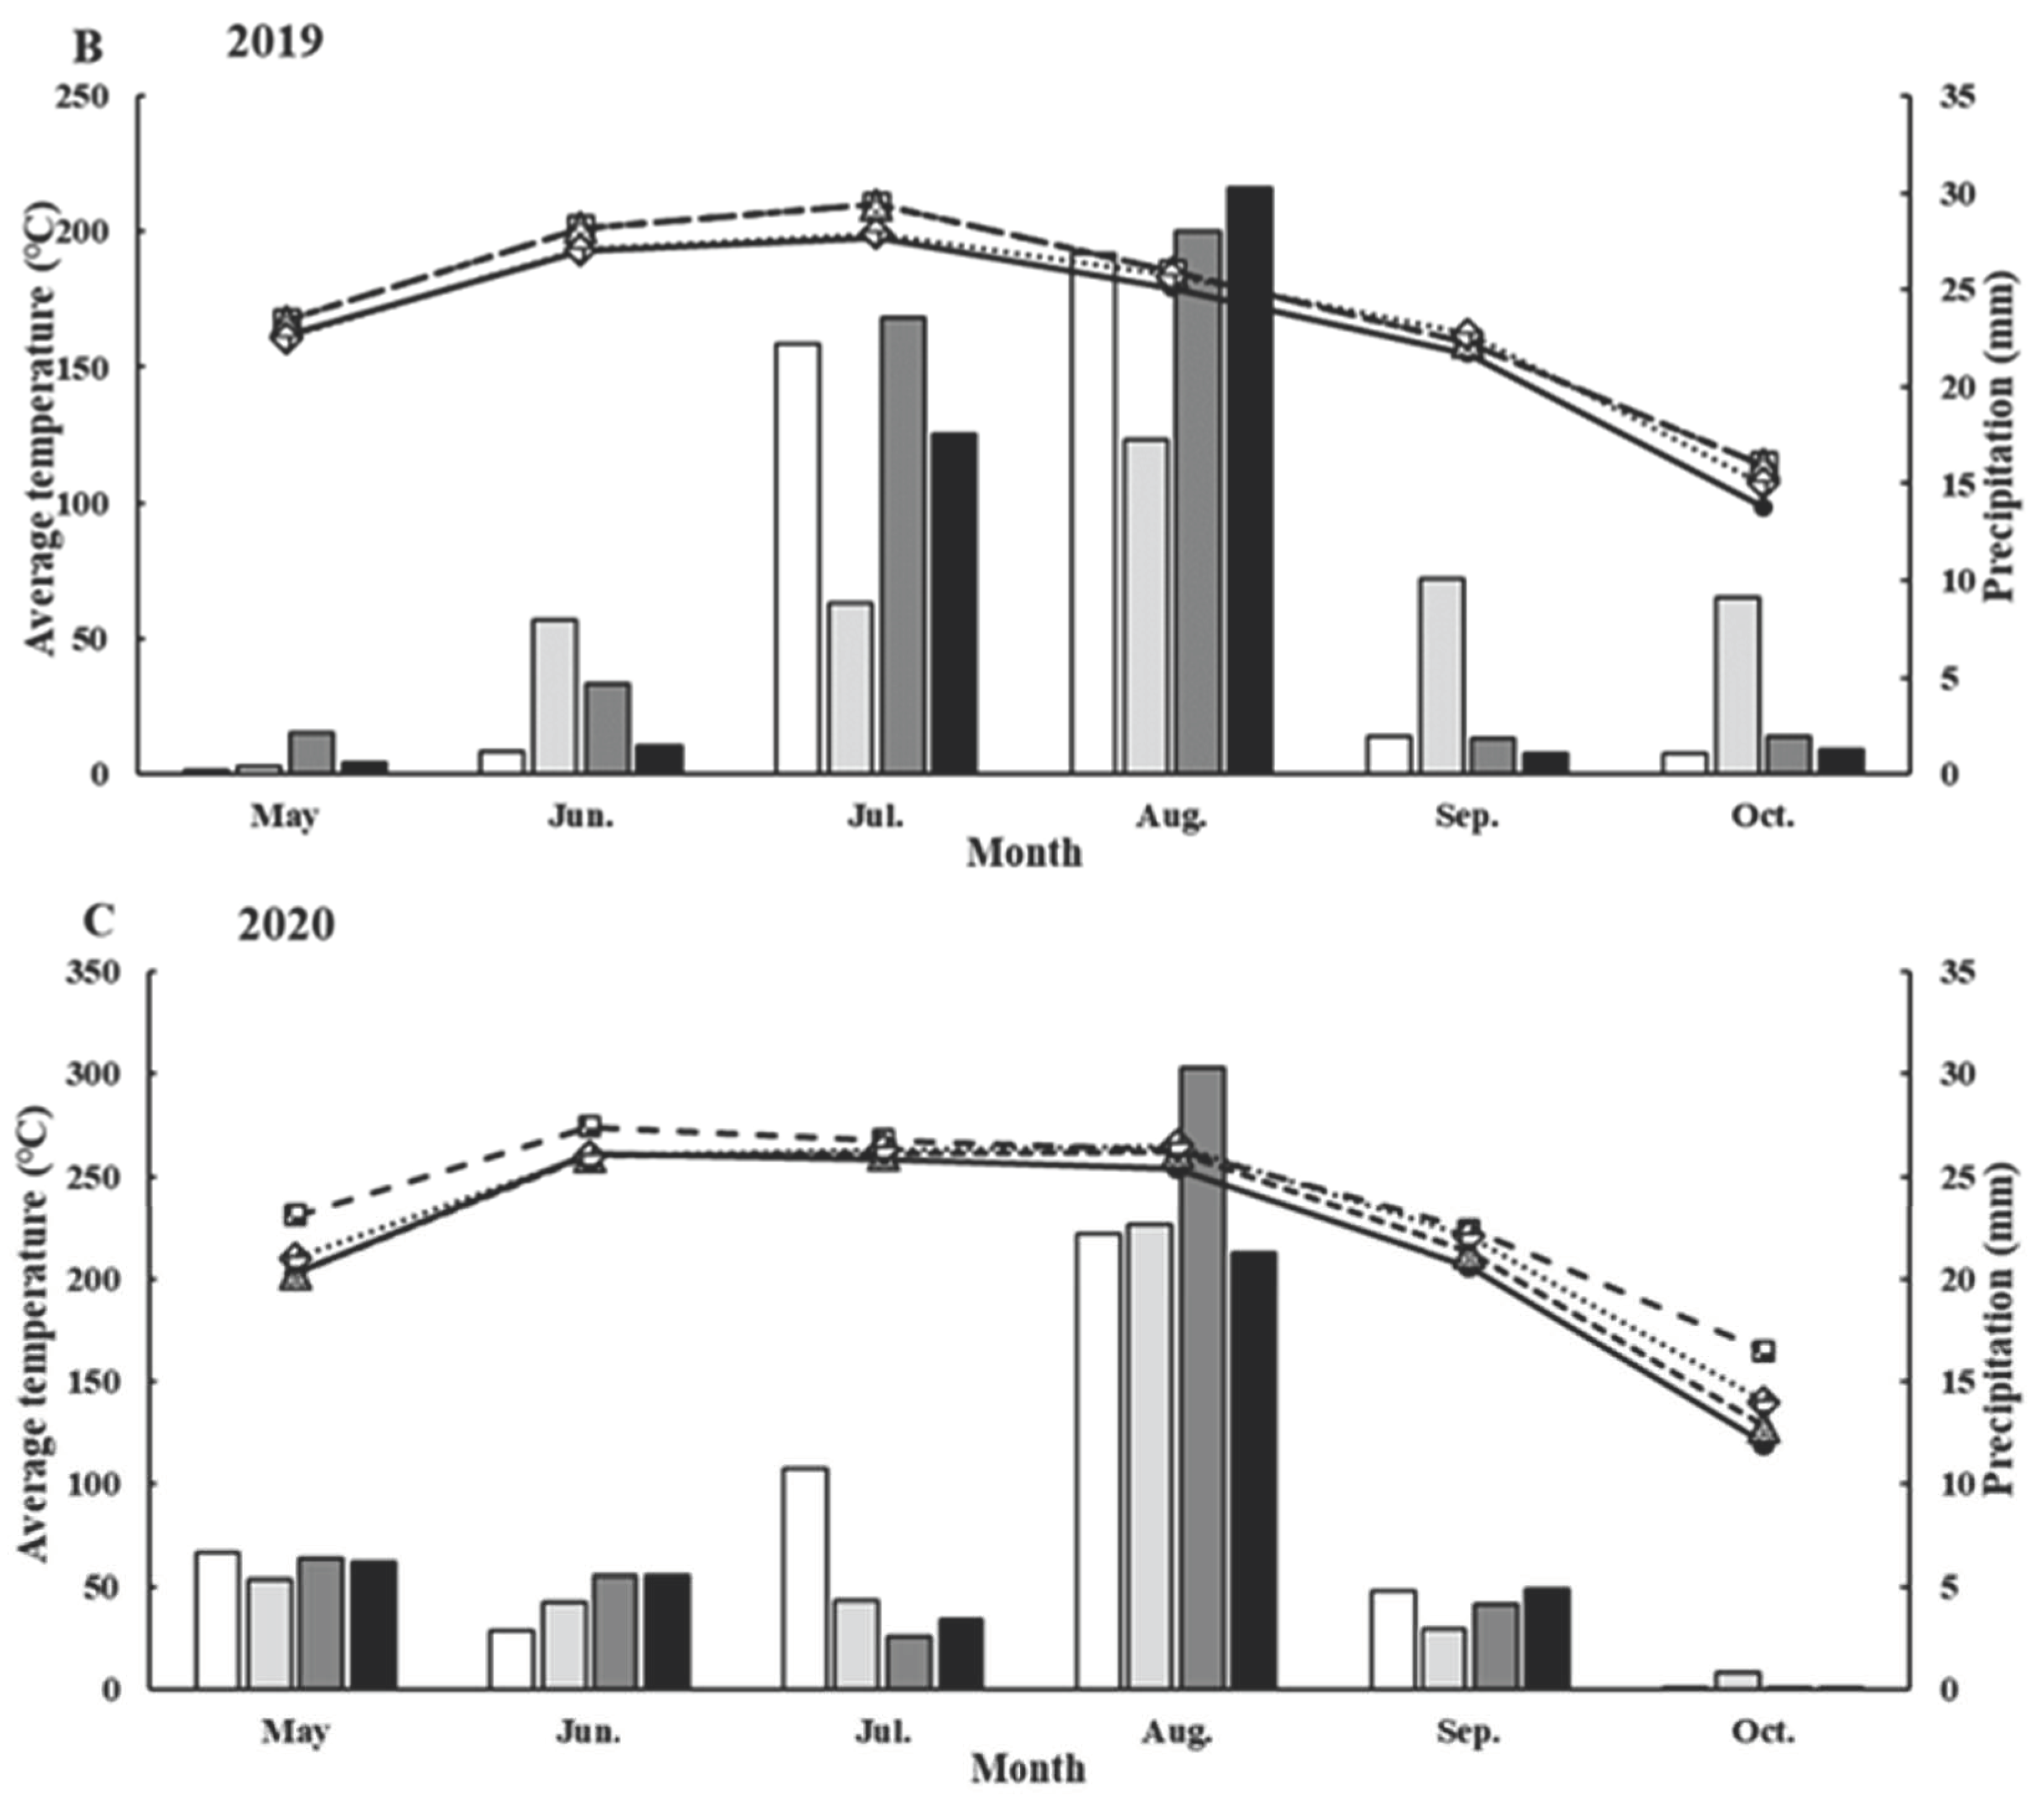
The monthly average temperature and cumulative rainfall during the cotton growing season at each location are shown in Figure 2. Hejian was always cooler than other sites in September and October. There was an unusually rainy August in Binzhou and Dezhou, but an extremely dry August in Handan in 2018. In 2020, there was much less precipitation in July (<50 mm) except in Hejian (107.9 mm), but heavy rains in August (>210 mm) across locations. In addition, Hejian witnessed a cooler July and August besides September and October than the other three sites in 2020.

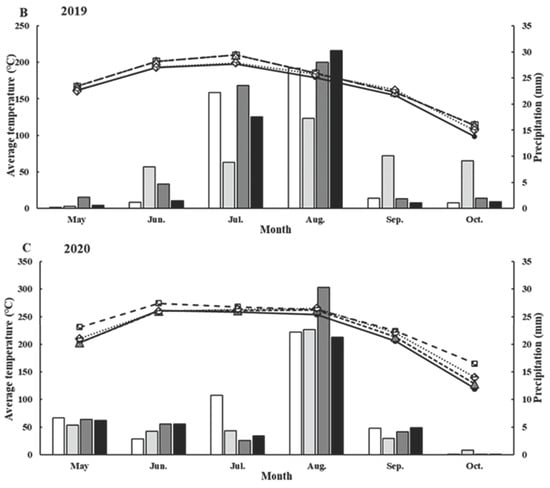
Figure 2.
Monthly average temperature and cumulative precipitation during the cotton growing seasons in 2018 (A), 2019 (B), 2020 (C).
2.2. Experimental Design and Field Management
A randomized block design with three replications was used in this study. The experiment consisted of two treatments: manual topping (MT) and chemical topping (CT). The MT timing followed local tradition (Table 1), which is generally based on two rules: the newly formed squares do not have enough heat for maturation or the number of fruiting branches has met expectation. CT was performed by applying 180 g/ha mepiquat chloride (MC, 98% soluble powder) at the same time as MT. The rates were determined by prior experiments and local practices [19].
Individual plots were 6–9 m long and comprised 6–8 rows, spaced 76 cm apart (except in Handan in 2018). The cotton was seeded from April 24 through May 9 (Table 1). The plant density and nitrogen (N) rates applied at each location are shown in Table 1. The overgrowth during season was controlled by multiple MC application (Table 1) according to local weather and environments. Plants were pruned of vegetative branches on June 20 and July 15 in Handan, and on June 14 and July 10 in Dezhou in 2018. In 2019, plants were pruned of vegetative branches on June 10 only in Dezhou. Pruning was not done in 2020. The management of weeds, diseases and insects followed local practices.
2.3. Measurement
2.3.1. Boll Age
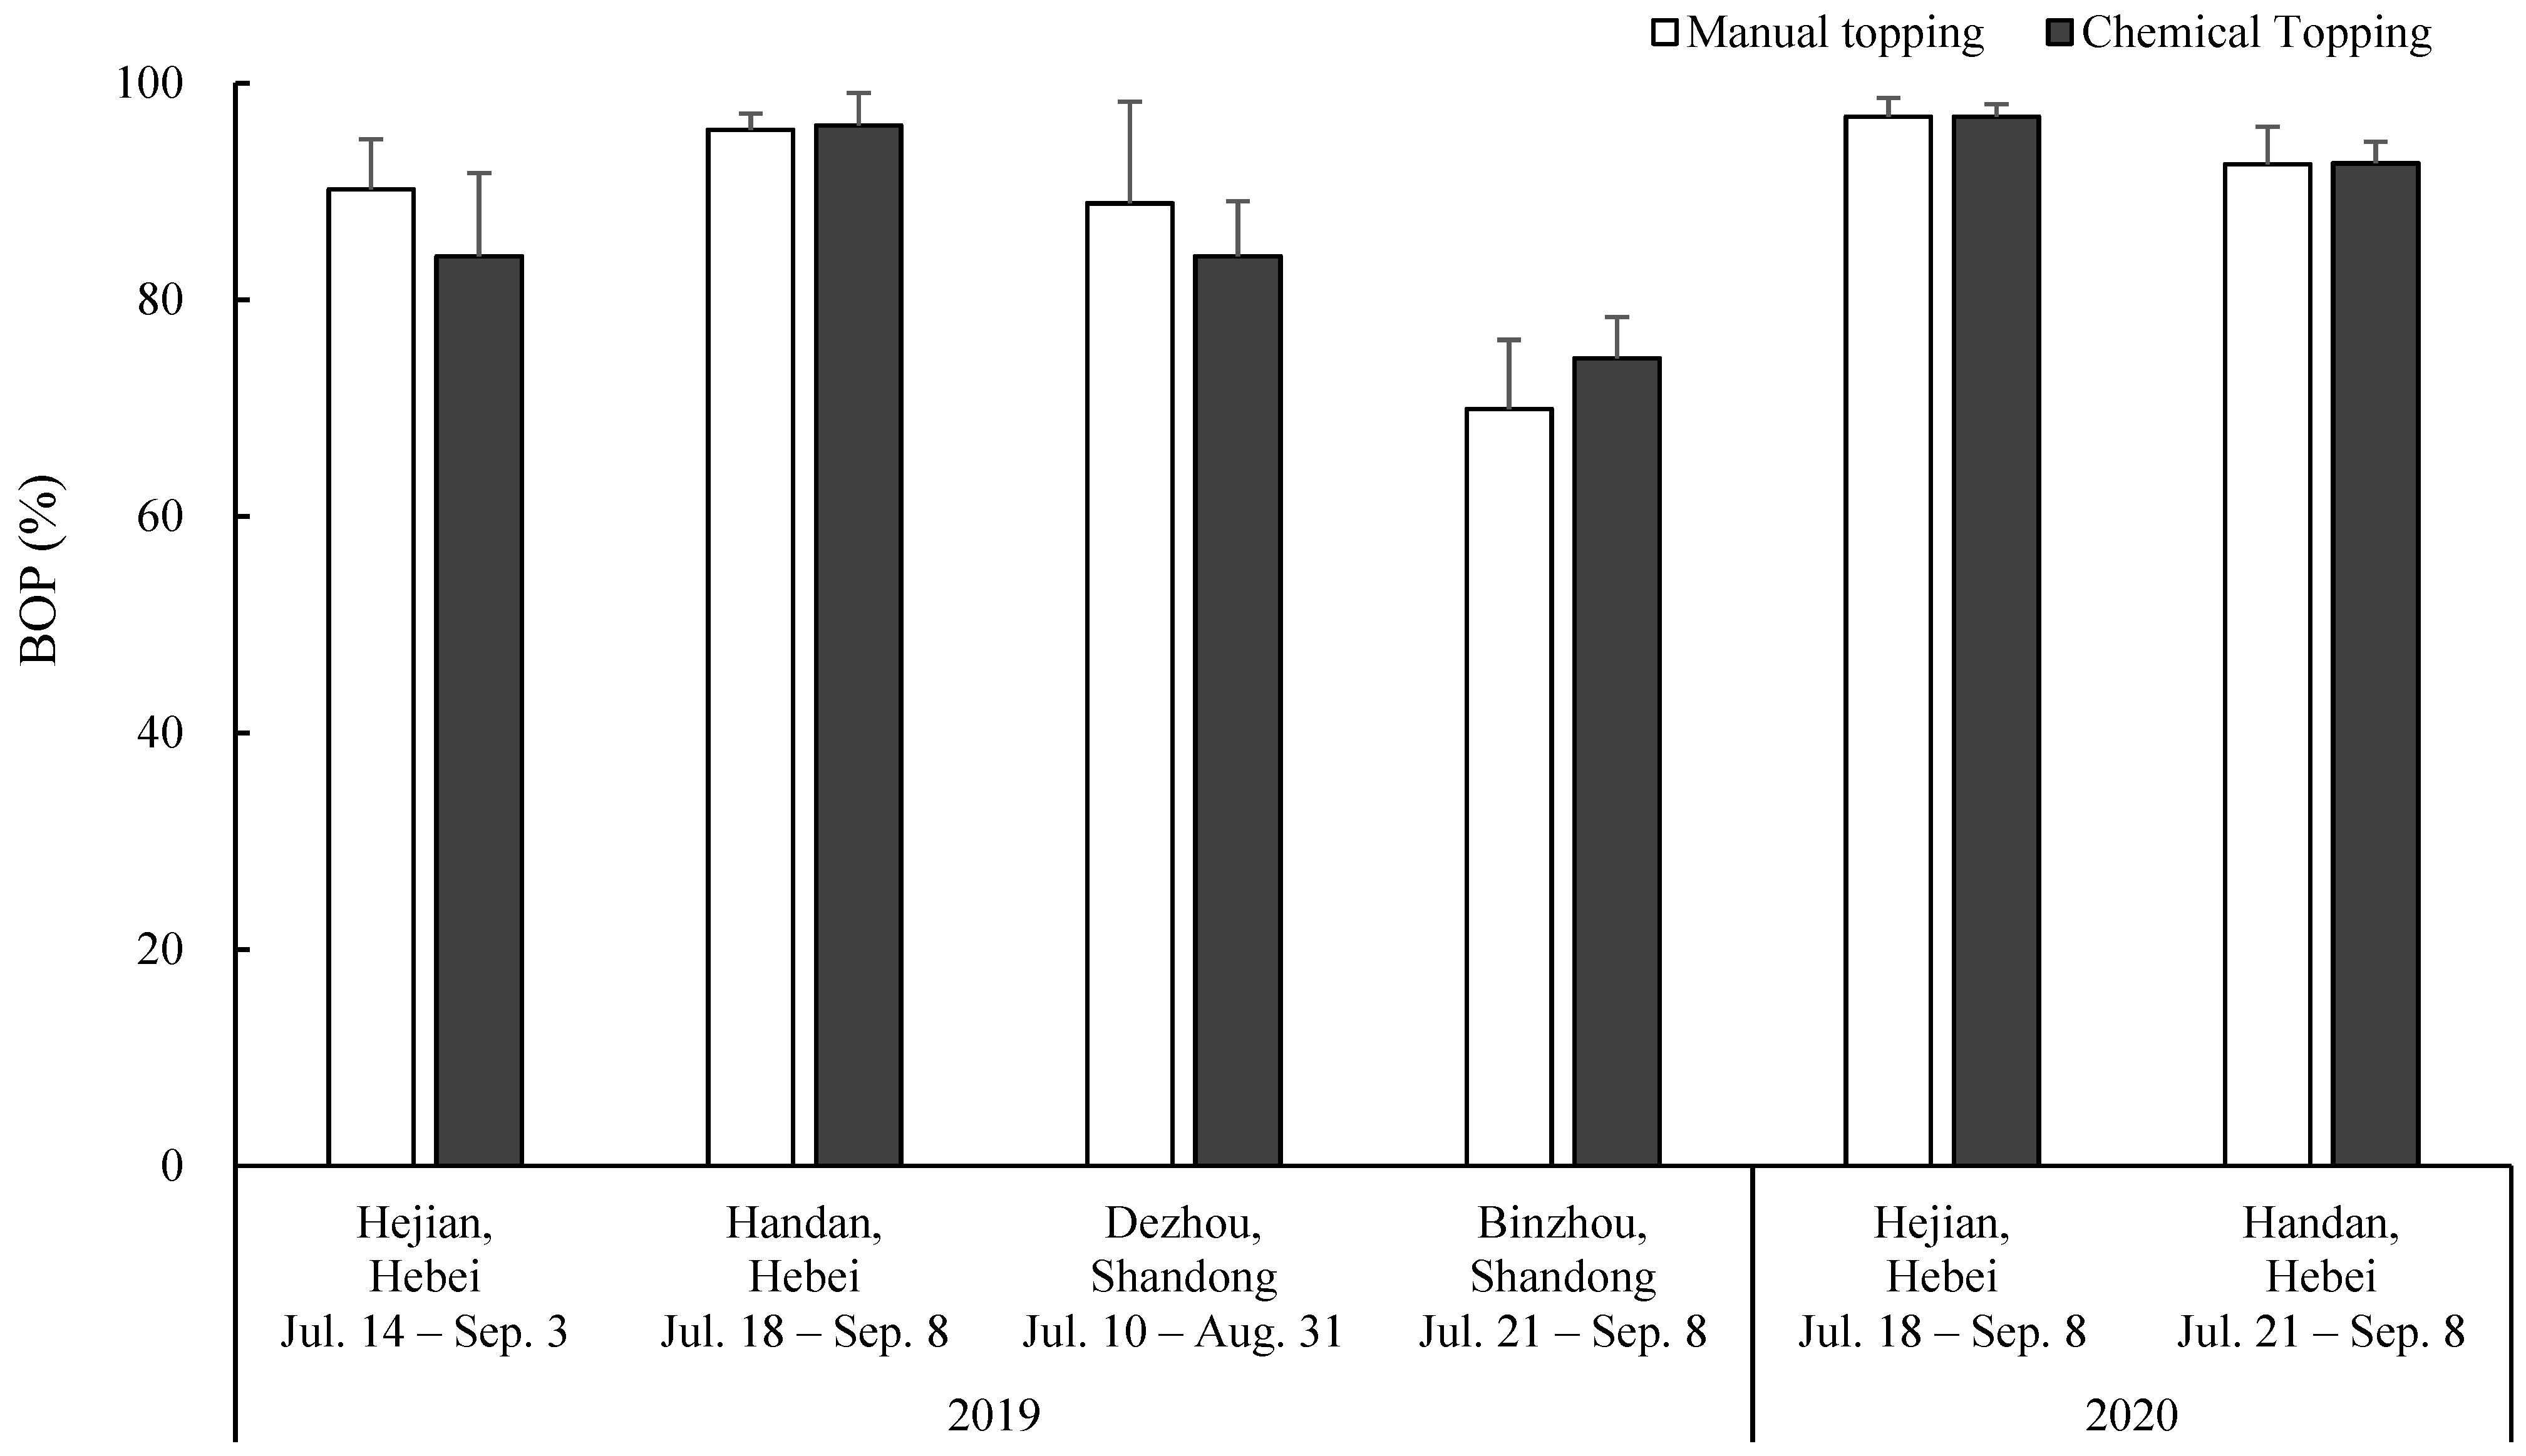
The white flowers at the 1st and 2nd fruiting sites on middle fruiting branches were tagged in mid-July, 2019 and 2020. Around 50 days later, we counted the total and open tagged bolls to calculate boll opening percentage (BOP): higher BOP means lower boll age.
2.3.2. Plant Mapping
Five or ten uniform plants per plot were selected to perform plant mapping. Few bolls arise from vegetative branches, but usually the proportion of these bolls to total yield is low [22,23]. Therefore, plant mapping only covered the harvestable fruit by fruiting sites on reproductive branches.
2.3.3. Boll Accumulation over Cohorts
Flowers are formed on adjacent nodes up the plant every 2 to 3 days, and on adjacent sympodial positions every 4 to 6 days [24]. Based on both vertical and horizontal flowering intervals, the first-position fruit may occur simultaneously with second-position fruit that are two nodes lower and third-position fruit that are four nodes lower, and so on. These appear at the same time and constitute a cohort. In this study, we grouped bolls according to cohorts, and boll fraction was accumulated over it: higher accumulation over a given cohort indicates an earlier maturity.
2.3.4. Boll Opening Percentage (BOP) before Defoliation in September
The timing of defoliation using 50% thidiazuron·ethephon suspension concentrate (TDZ•ETH) is shown in Table 1. Before TDZ•ETH application, the number of total (NTB) and open bolls (NOB) were counted. Then, the percentage of boll opening was calculated: boll opening percentage (BOP, %) = NOB × 100%/NTB.
2.3.5. Yield and Yield Components
In late October or early November, fifteen plants with uniform growth were selected per plot to determine boll number and boll weight. In addition, 50 random bolls per plot were sampled to determine lint percentage. All plants in the central three rows of each plot were harvested to evaluate seed cotton yield.
2.4. Data Analysis
Microsoft Excel 2016 (Microsoft Corp, Albuquerque, NM, USA) was used for data organization. Because the varieties used at each location were different in 2018, a t-test was performed to compare the effects of MT and CT on boll age, boll opening percentage (BOP) in mid- or late September, cotton seed yield and yield components per location at p ≤ 0.05. The general linear model procedure in R Core Team (2022) was used for analysis of variance (ANOVA) of the data for 2019 and 2020 when the same variety was used across locations, and the least significant difference (LSD) was used to separate treatment means at the 5% level of probability.
Contour maps of boll distribution and box plots of boll accumulation by cohort were drawn using Sigma Plot 10.0 (Systat Software Inc., San Jose, CA, USA) and R Core Team (2022), respectively.
3. Results
3.1. Boll Age
Boll age indicates the period from white flower to boll opening. A short boll age enhances cotton earliness. In this study, a BOP around 50 days after blooming was used to indirectly estimate the boll age. A higher BOP suggests a younger boll. As shown in Figure 3, there were no significant differences in BOP between MT and CT for bolls set in mid-July (prior to or after peak bloom) regardless of year and location, indicating that CT did not influence the boll age.
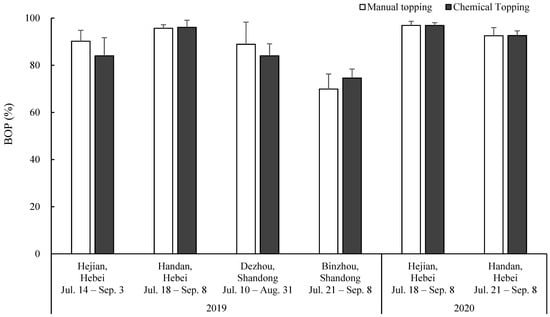
Figure 3.
Effect of topping treatments on the opening percentage of tagged bolls (BOP). The young bolls were tagged on the first day of bloom in July, and BOP was determined after about 50 days in September; t-tests were used to compare the means for manual topping and chemical topping at the 0.05 probability level.
3.2. Spatial Distribution of Bolls
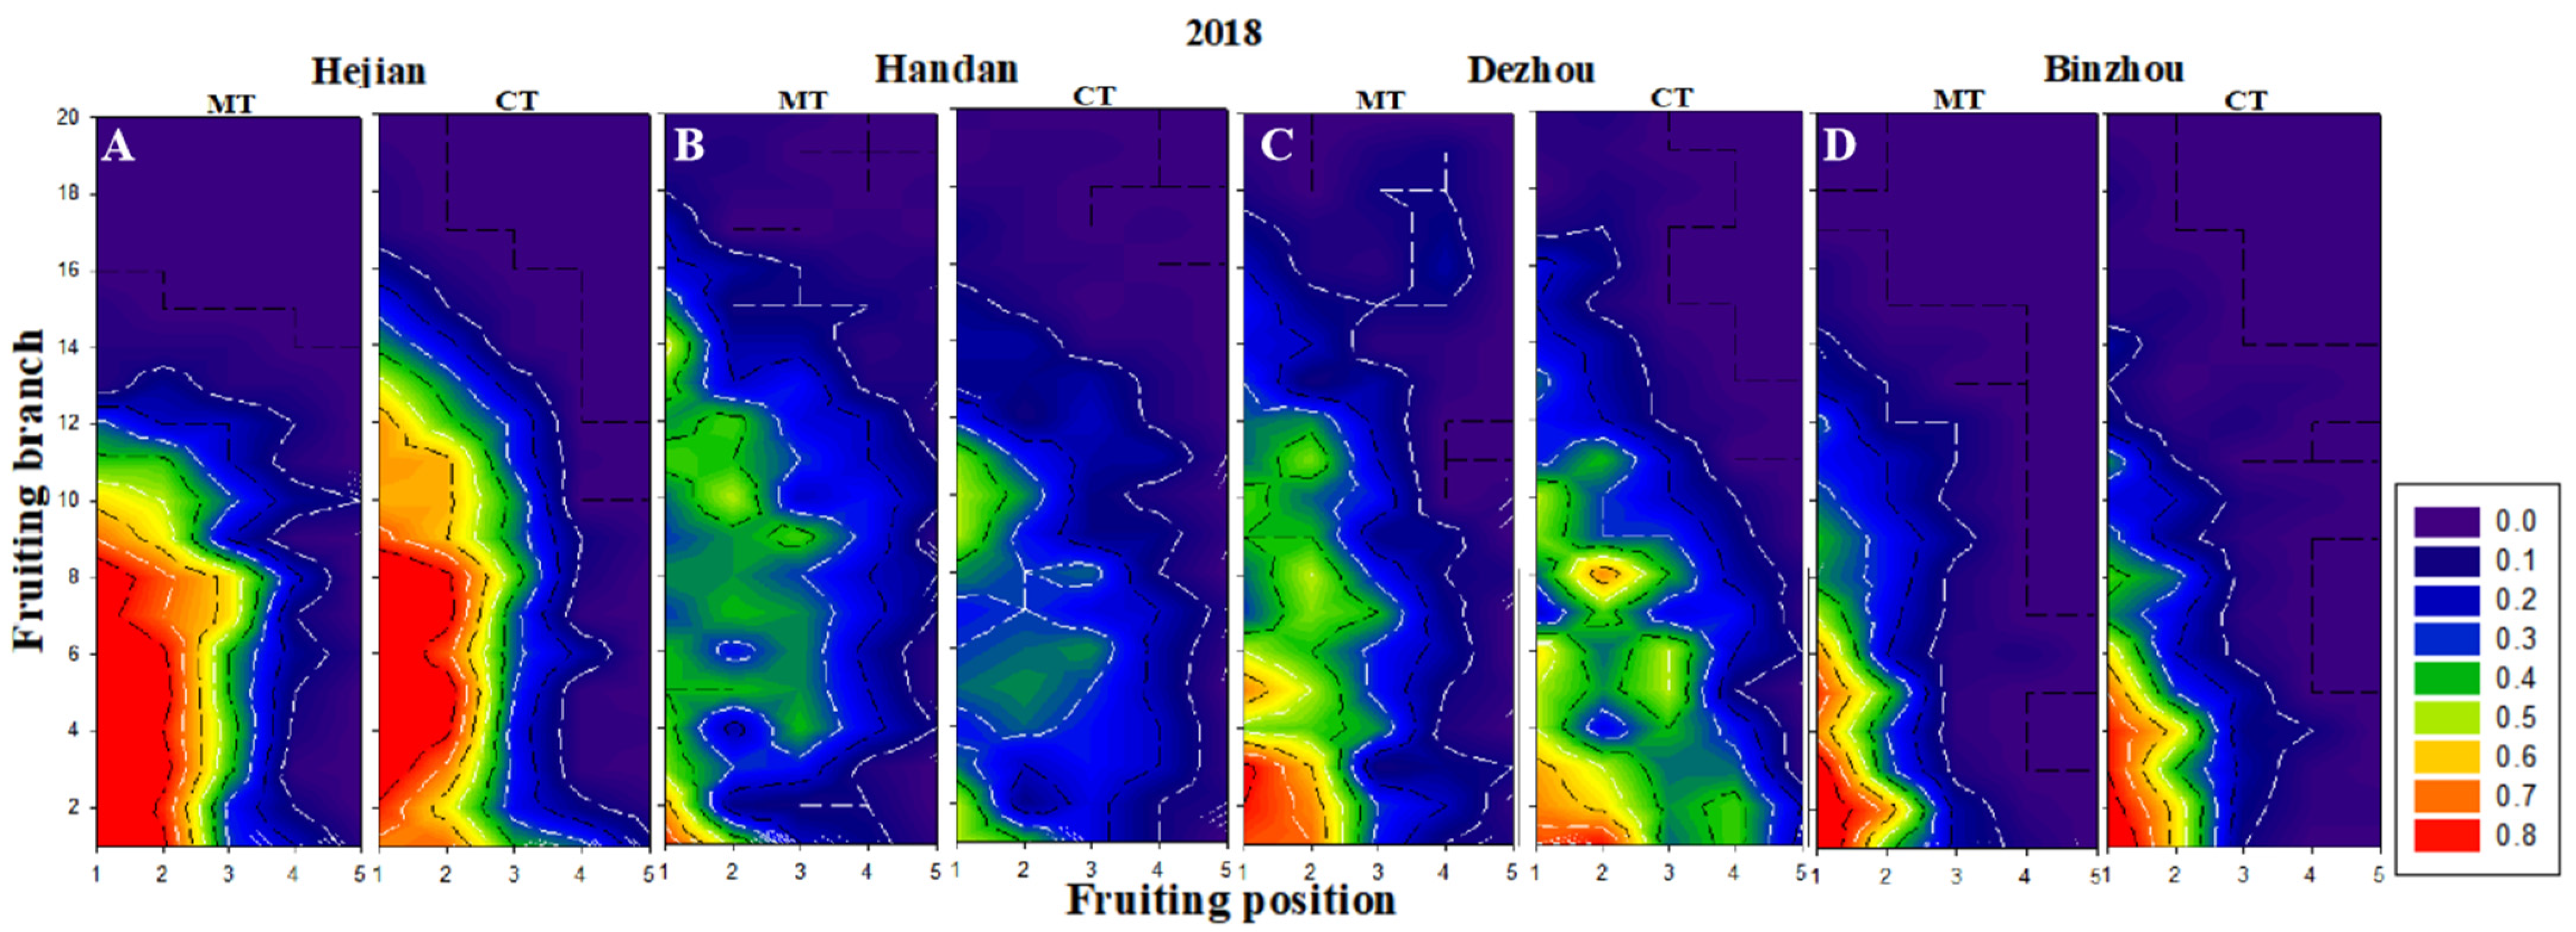
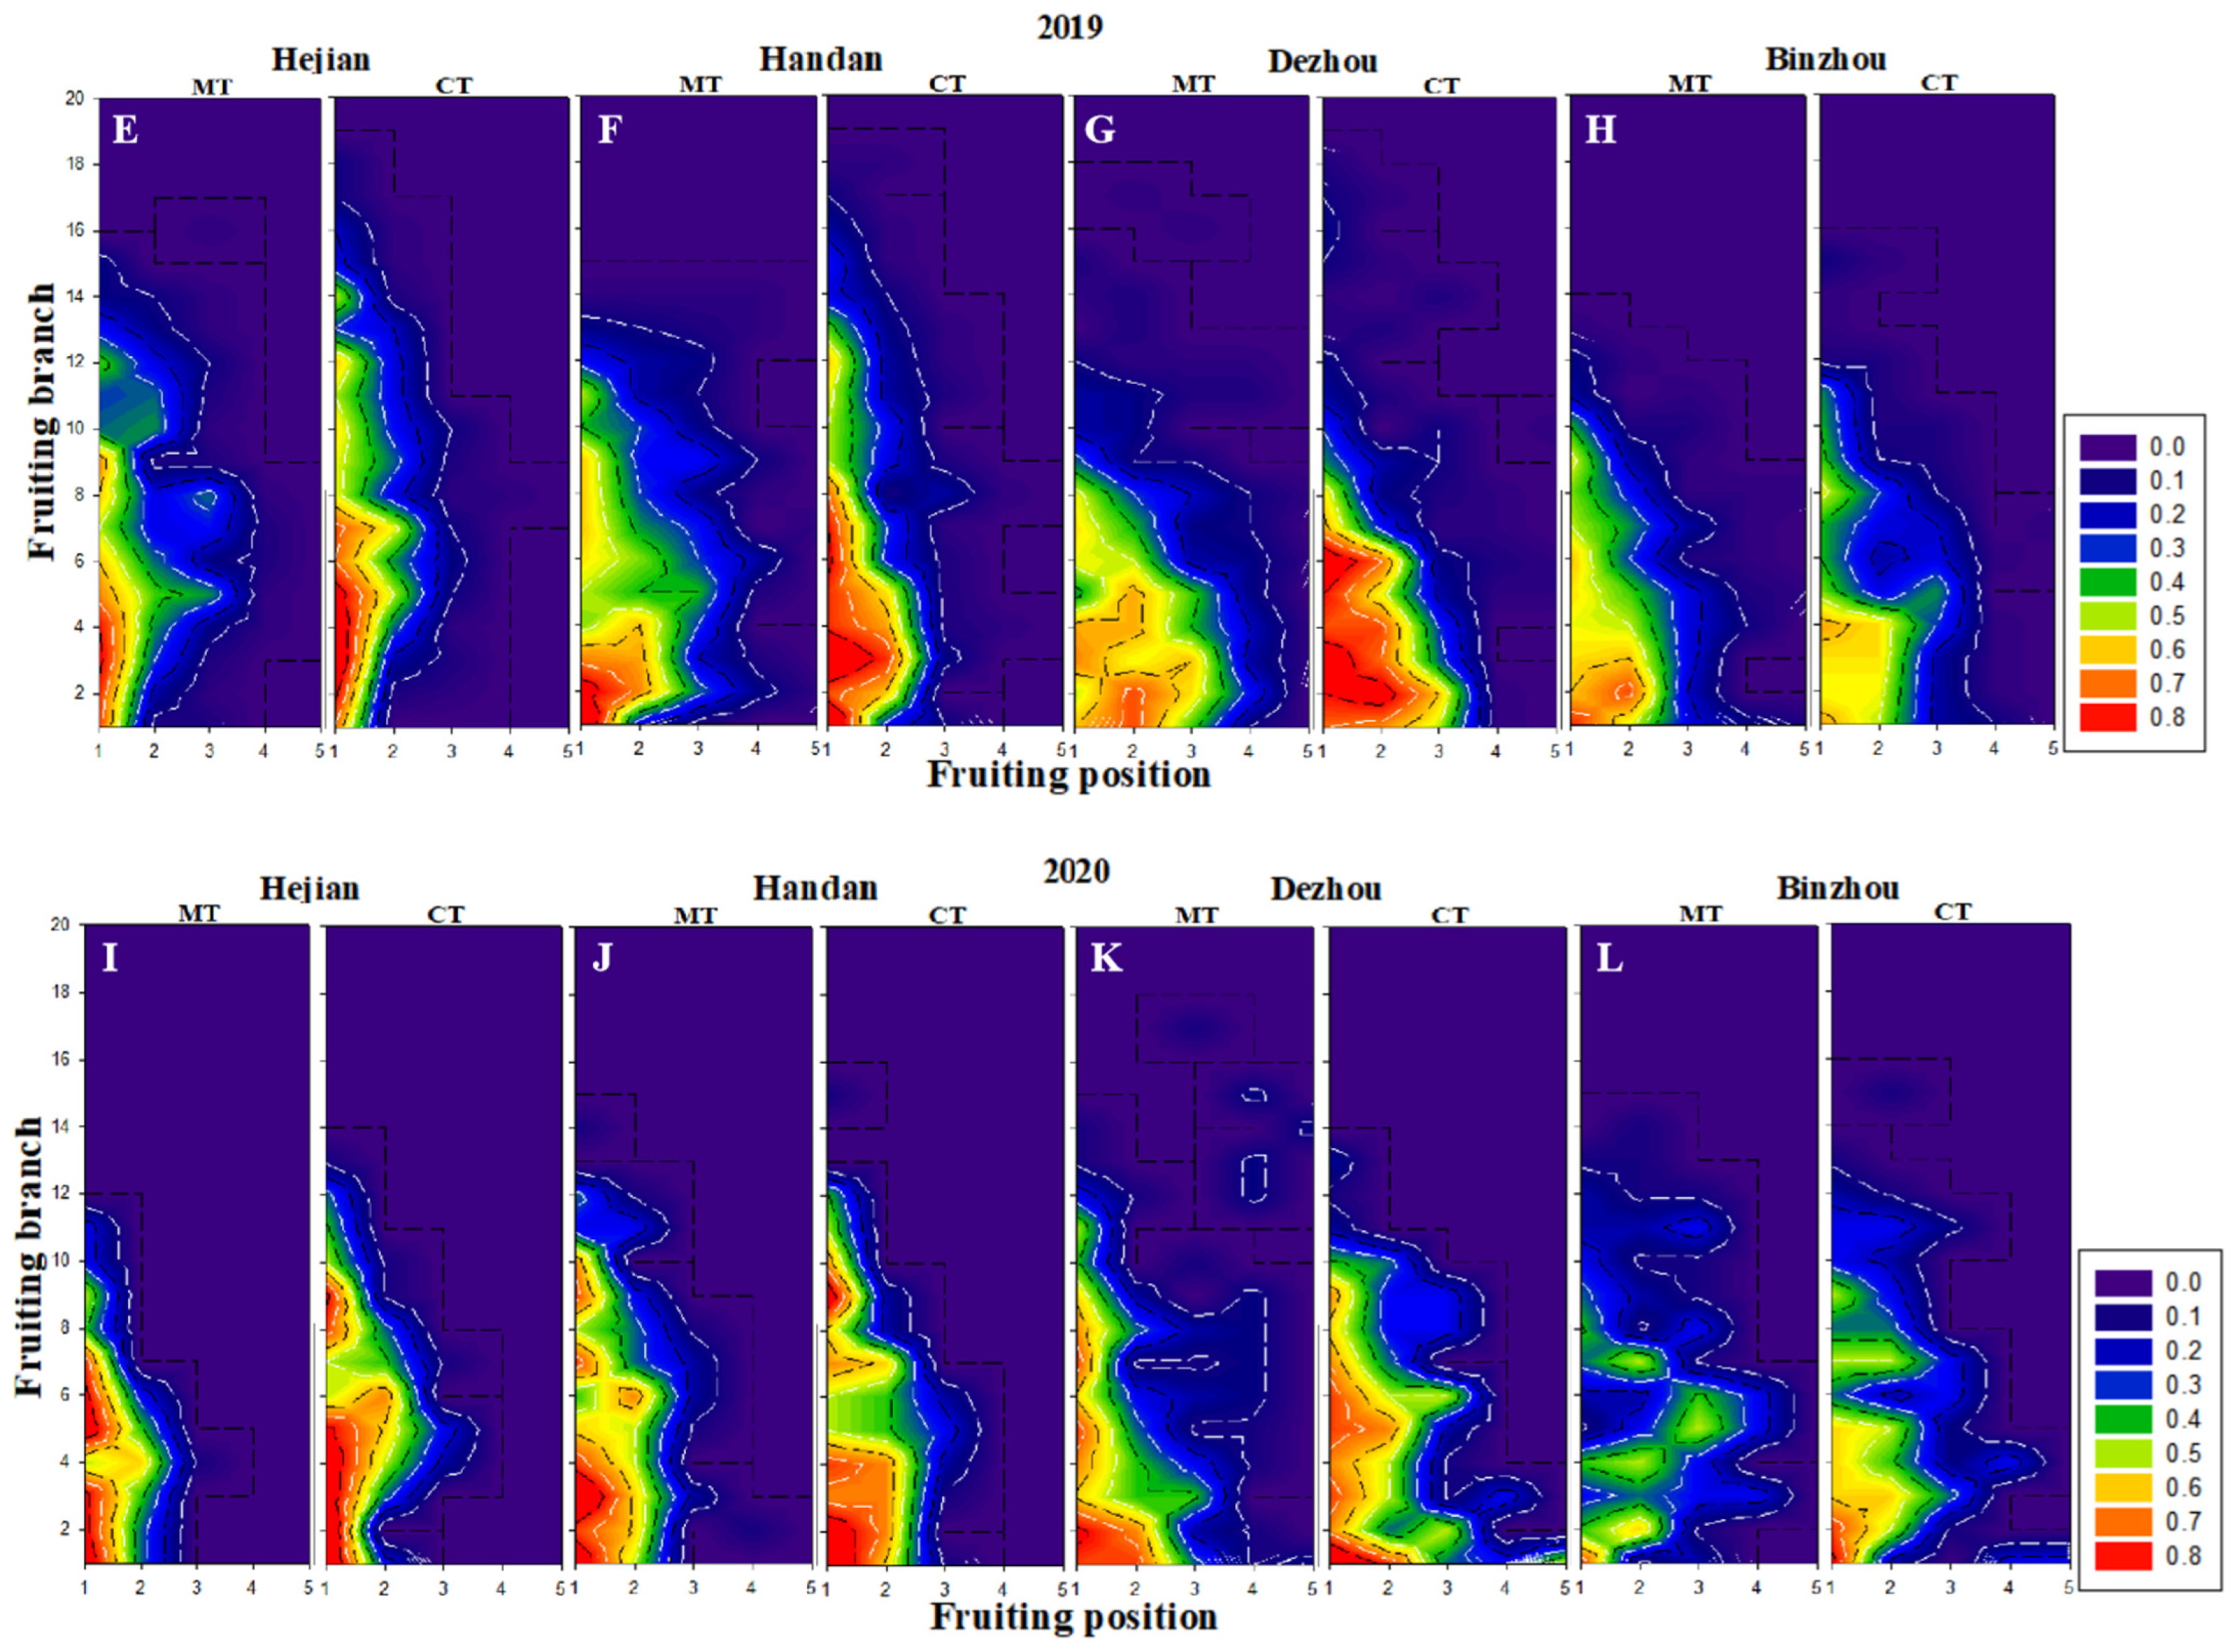
The boll distribution varied greatly with years and locations (Figure 4), suggesting the effects of environment, genotype and management on it. In most cases, CT had no or only slight effects on boll distribution (Figure 4). However, it produced taller but slenderer boll distribution than MT in Hejian in 2018 (Figure 4A) and in Hejian and Handan in 2019 (Figure 4I,J), indicating fewer bolls at outer parts of lower and middle fruiting branches, but more bolls at upper parts of plants.
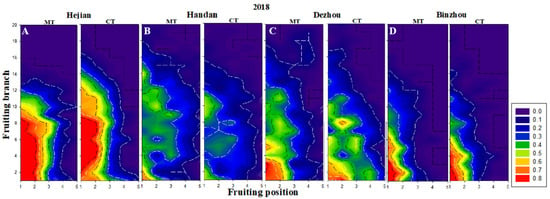
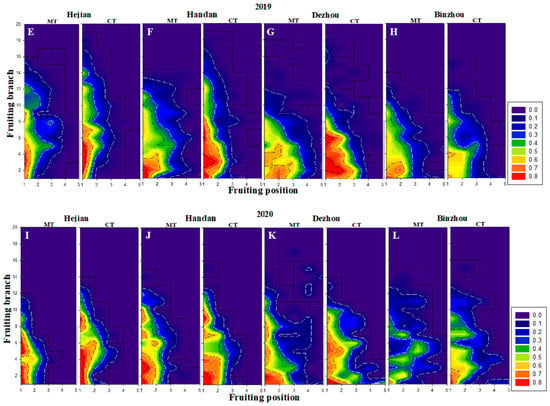
Figure 4.
Effect of topping treatments during flowering on distribution of cotton bolls. MT and CT indicate manual topping and chemical topping, respectively. Hejian (A,E,I) and Handan (B,F,J) are in Hebei Province; Dezhou (C,G,K) and Binzhou (D,H,L) are in Shandong Province.
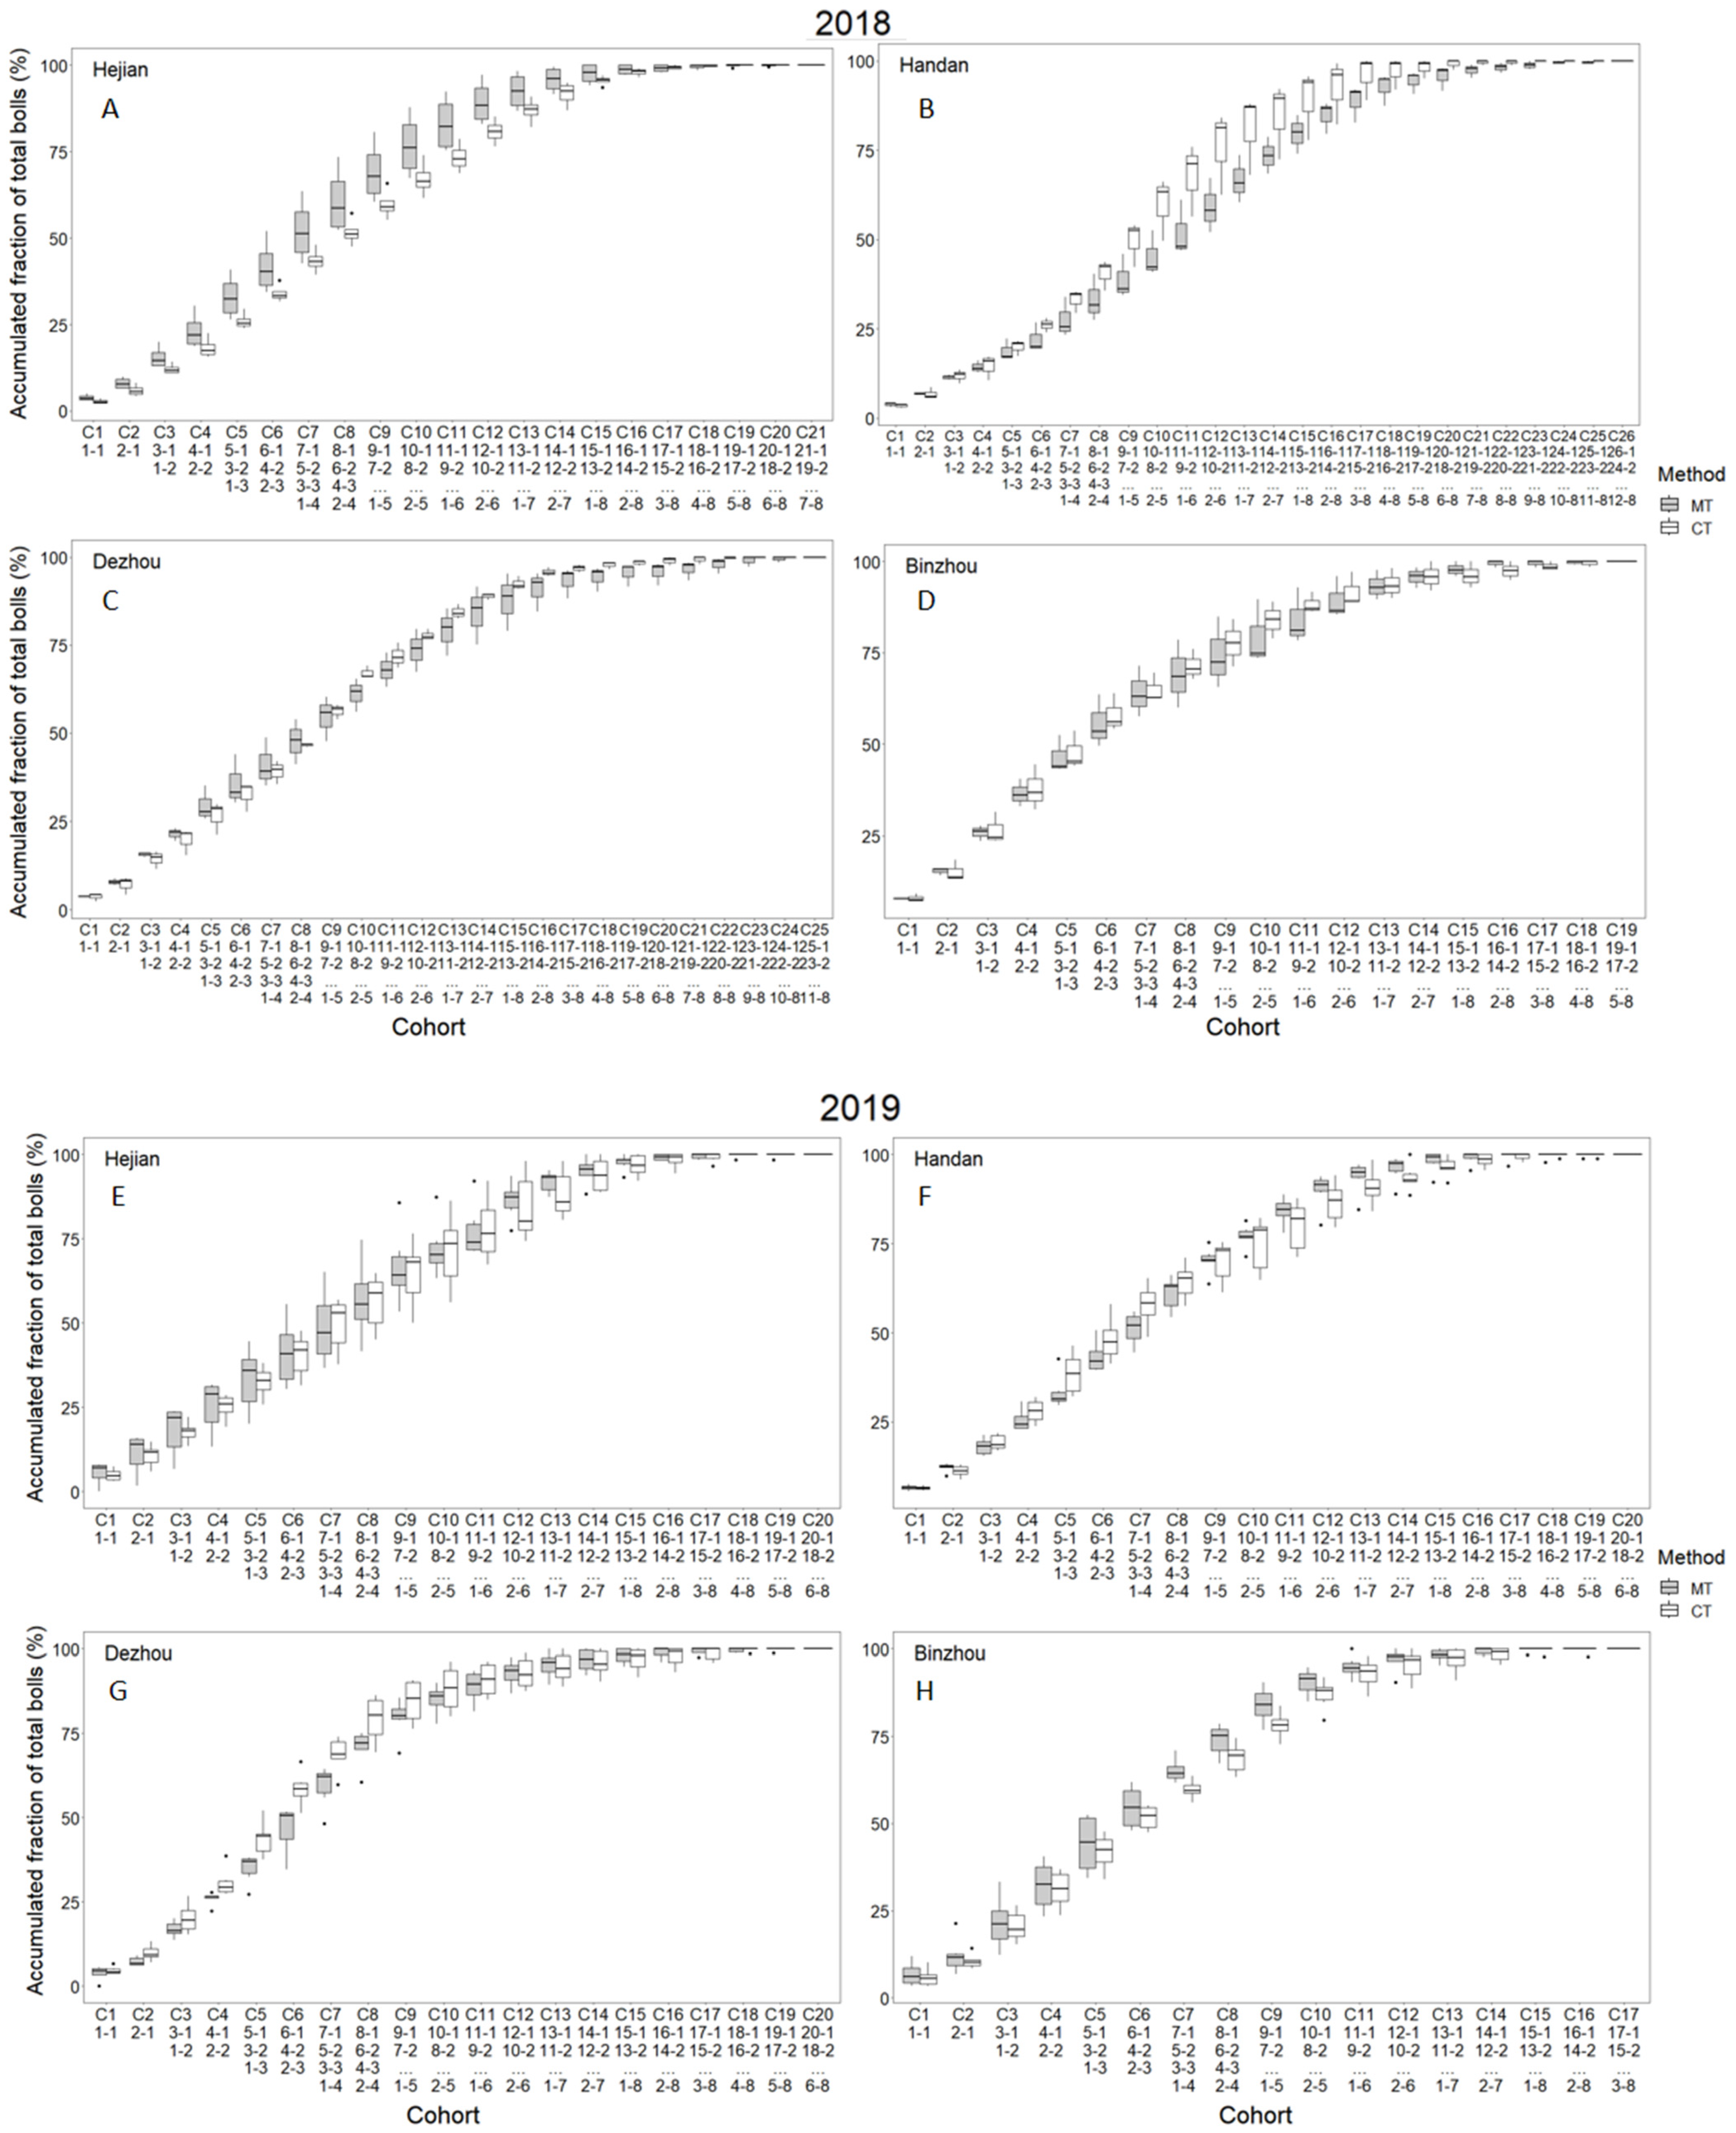
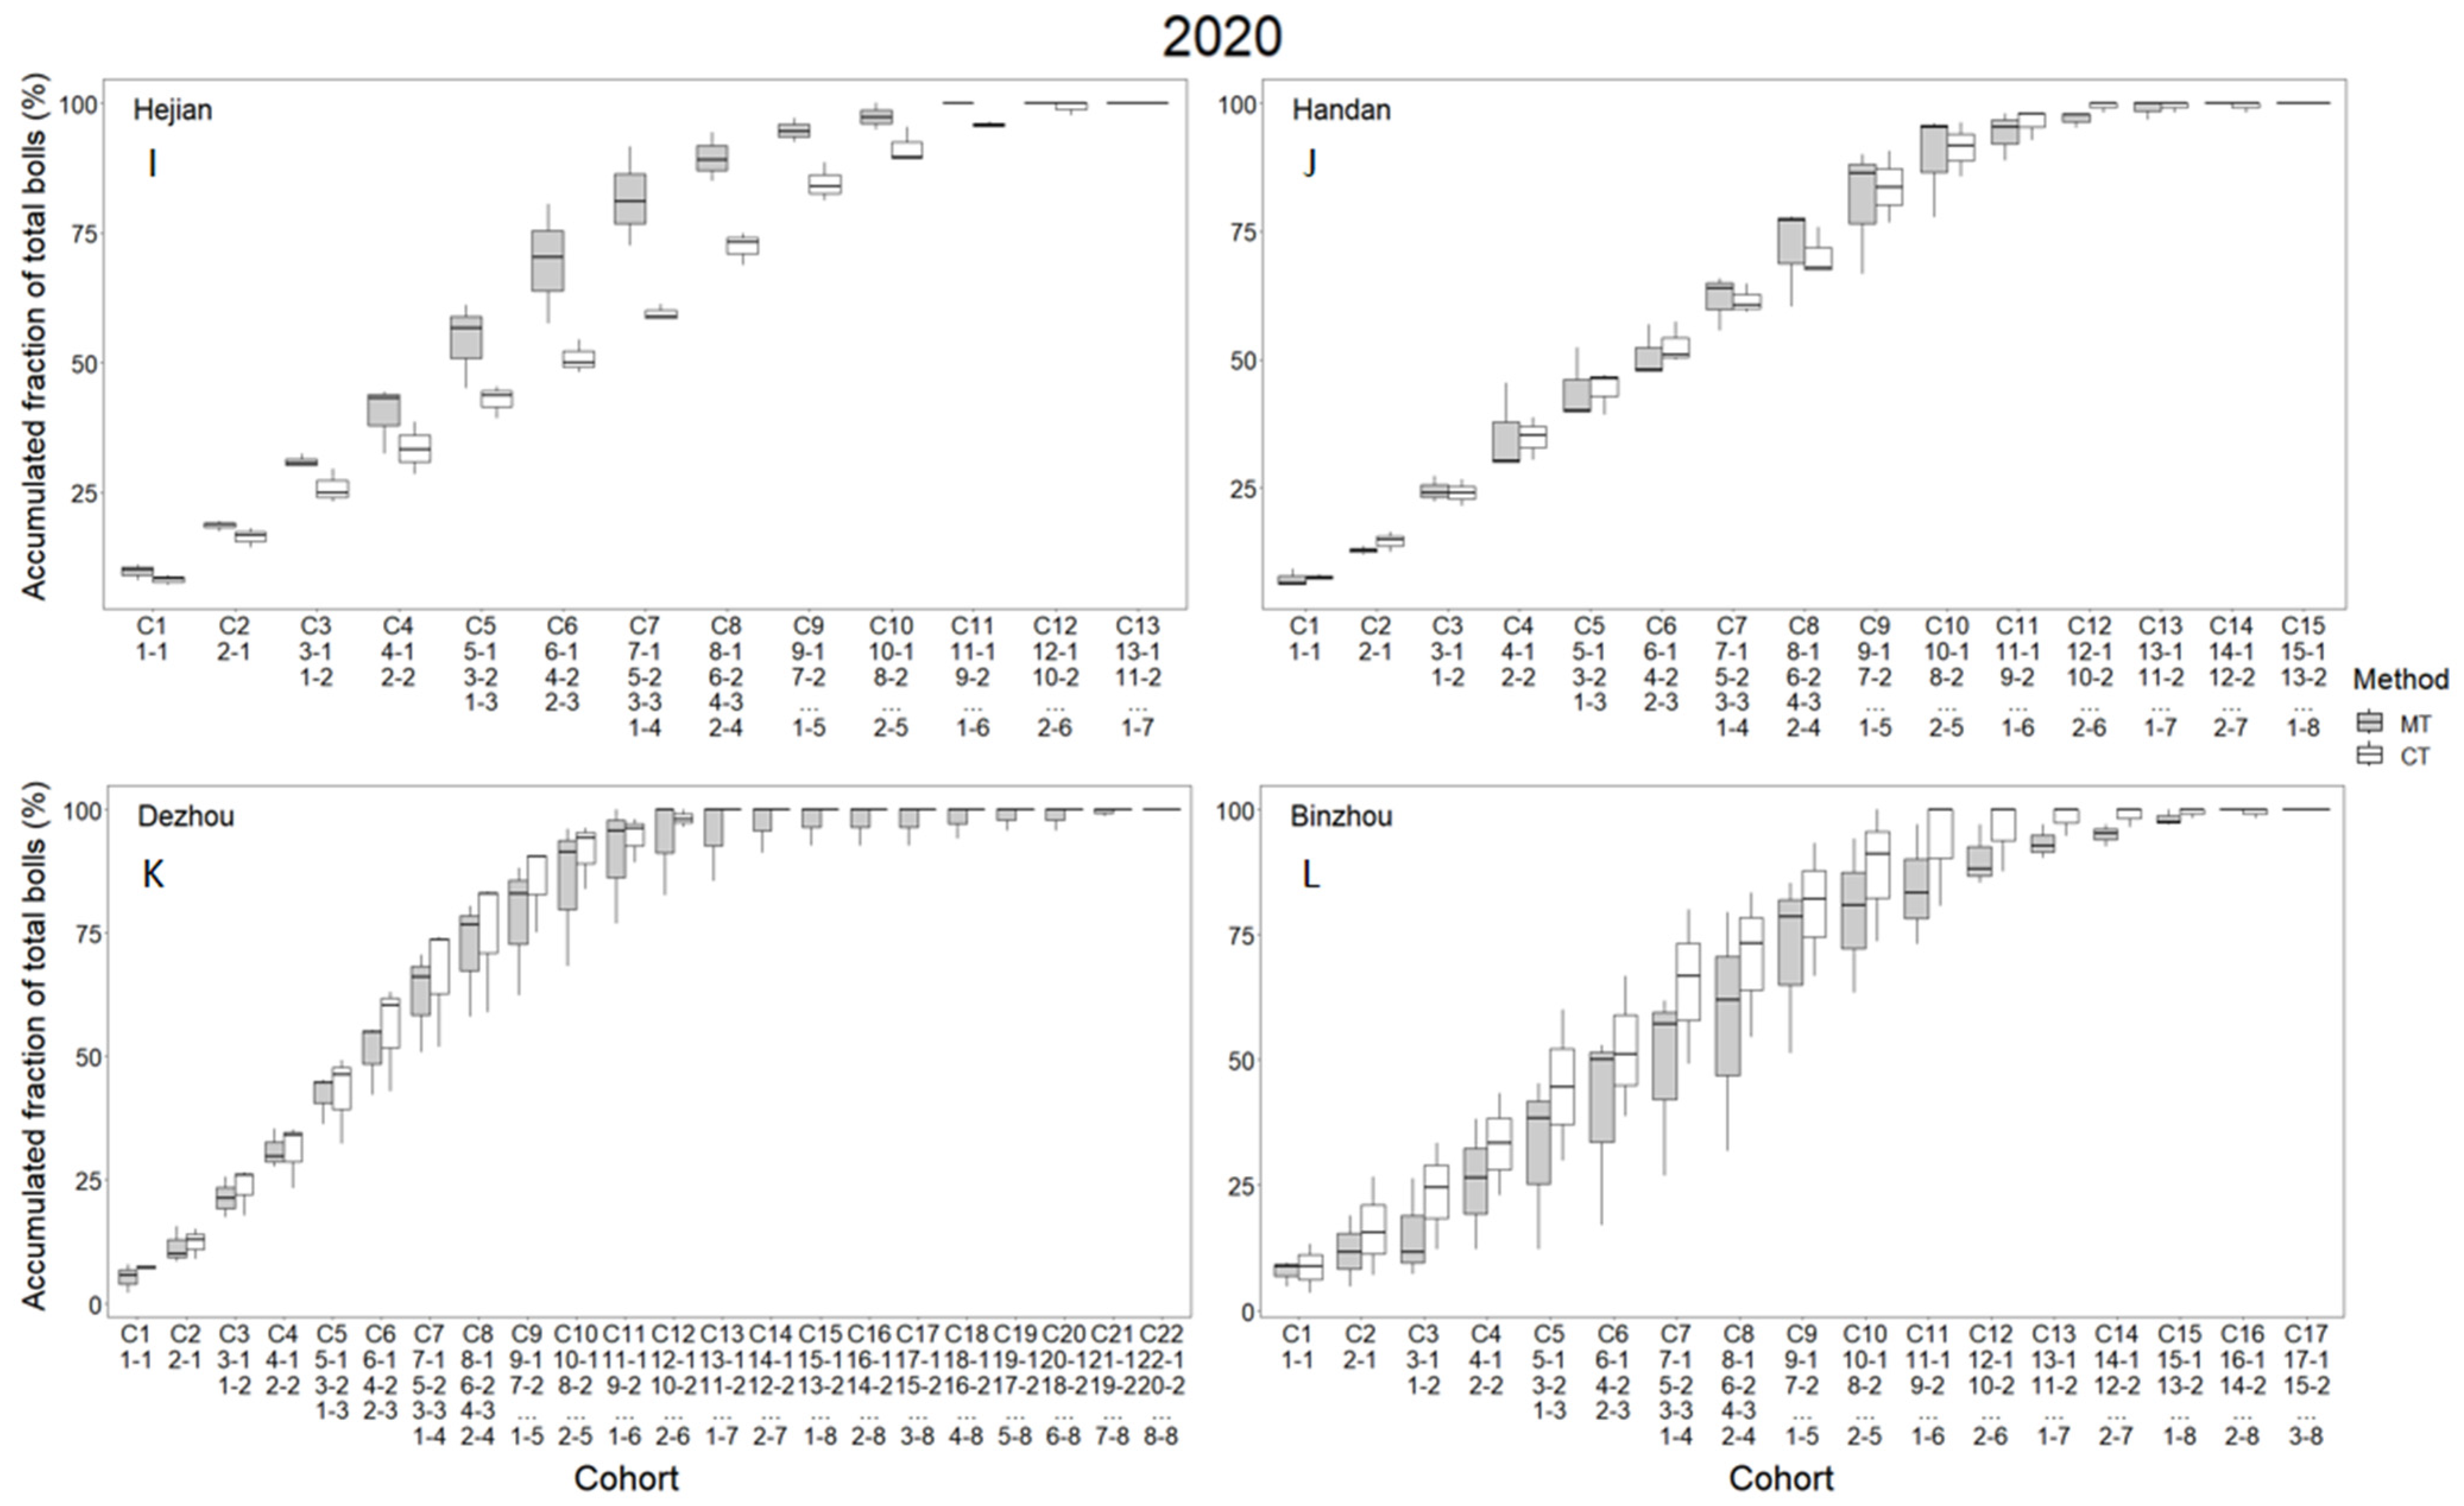
3.3. Accumulated Fraction of Bolls by Bloom Cohort
Cotton fruit at different positions may bloom and thus probably mature at the same time. These fruit could be grouped into a cohort. For estimating maturity, the total boll accumulation by cohort would be more useful than that by main-stem node, because the fruit derived from the same node can bloom and mature at different times.
Each cohort was numbered based on the number of fruiting branches where its first fruiting site was sorted into the cohort. Similarly to the boll distribution, the accumulation of bolls by cohort was comparable between CT and MT under almost all situations (Figure 5), suggesting similar maturity in terms of boll formation. However, there was an obvious difference in 2020 between CT and MT in Hejian, where CT accumulated bolls more slowly than MT from the 3rd to the 10th cohort (Figure 5I).
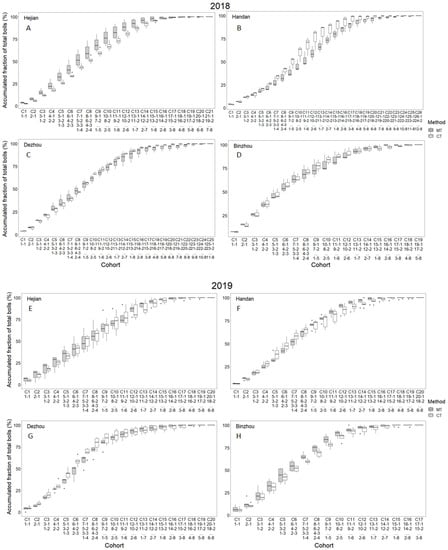
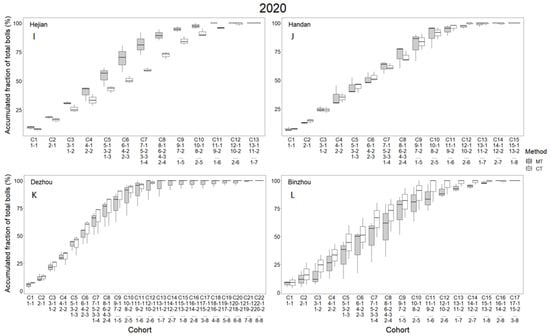
Figure 5.
Effect of topping treatments during flowering on accumulated boll fraction by cohort (C) at Hejian (A,E,I) and Handan (B,F,J), Hebei Province, and Dezhou (C,G,K) and Binzhou (D,H,L), Shandong Province in 2018 (A–D), 2019 (E–H) and 2020 (I–L). Each cohort includes fruiting sites blooming simultaneously. 1-1 means the first fruiting position on the first fruiting branch, and so on. MT and CT indicate manual topping and chemical topping, respectively.
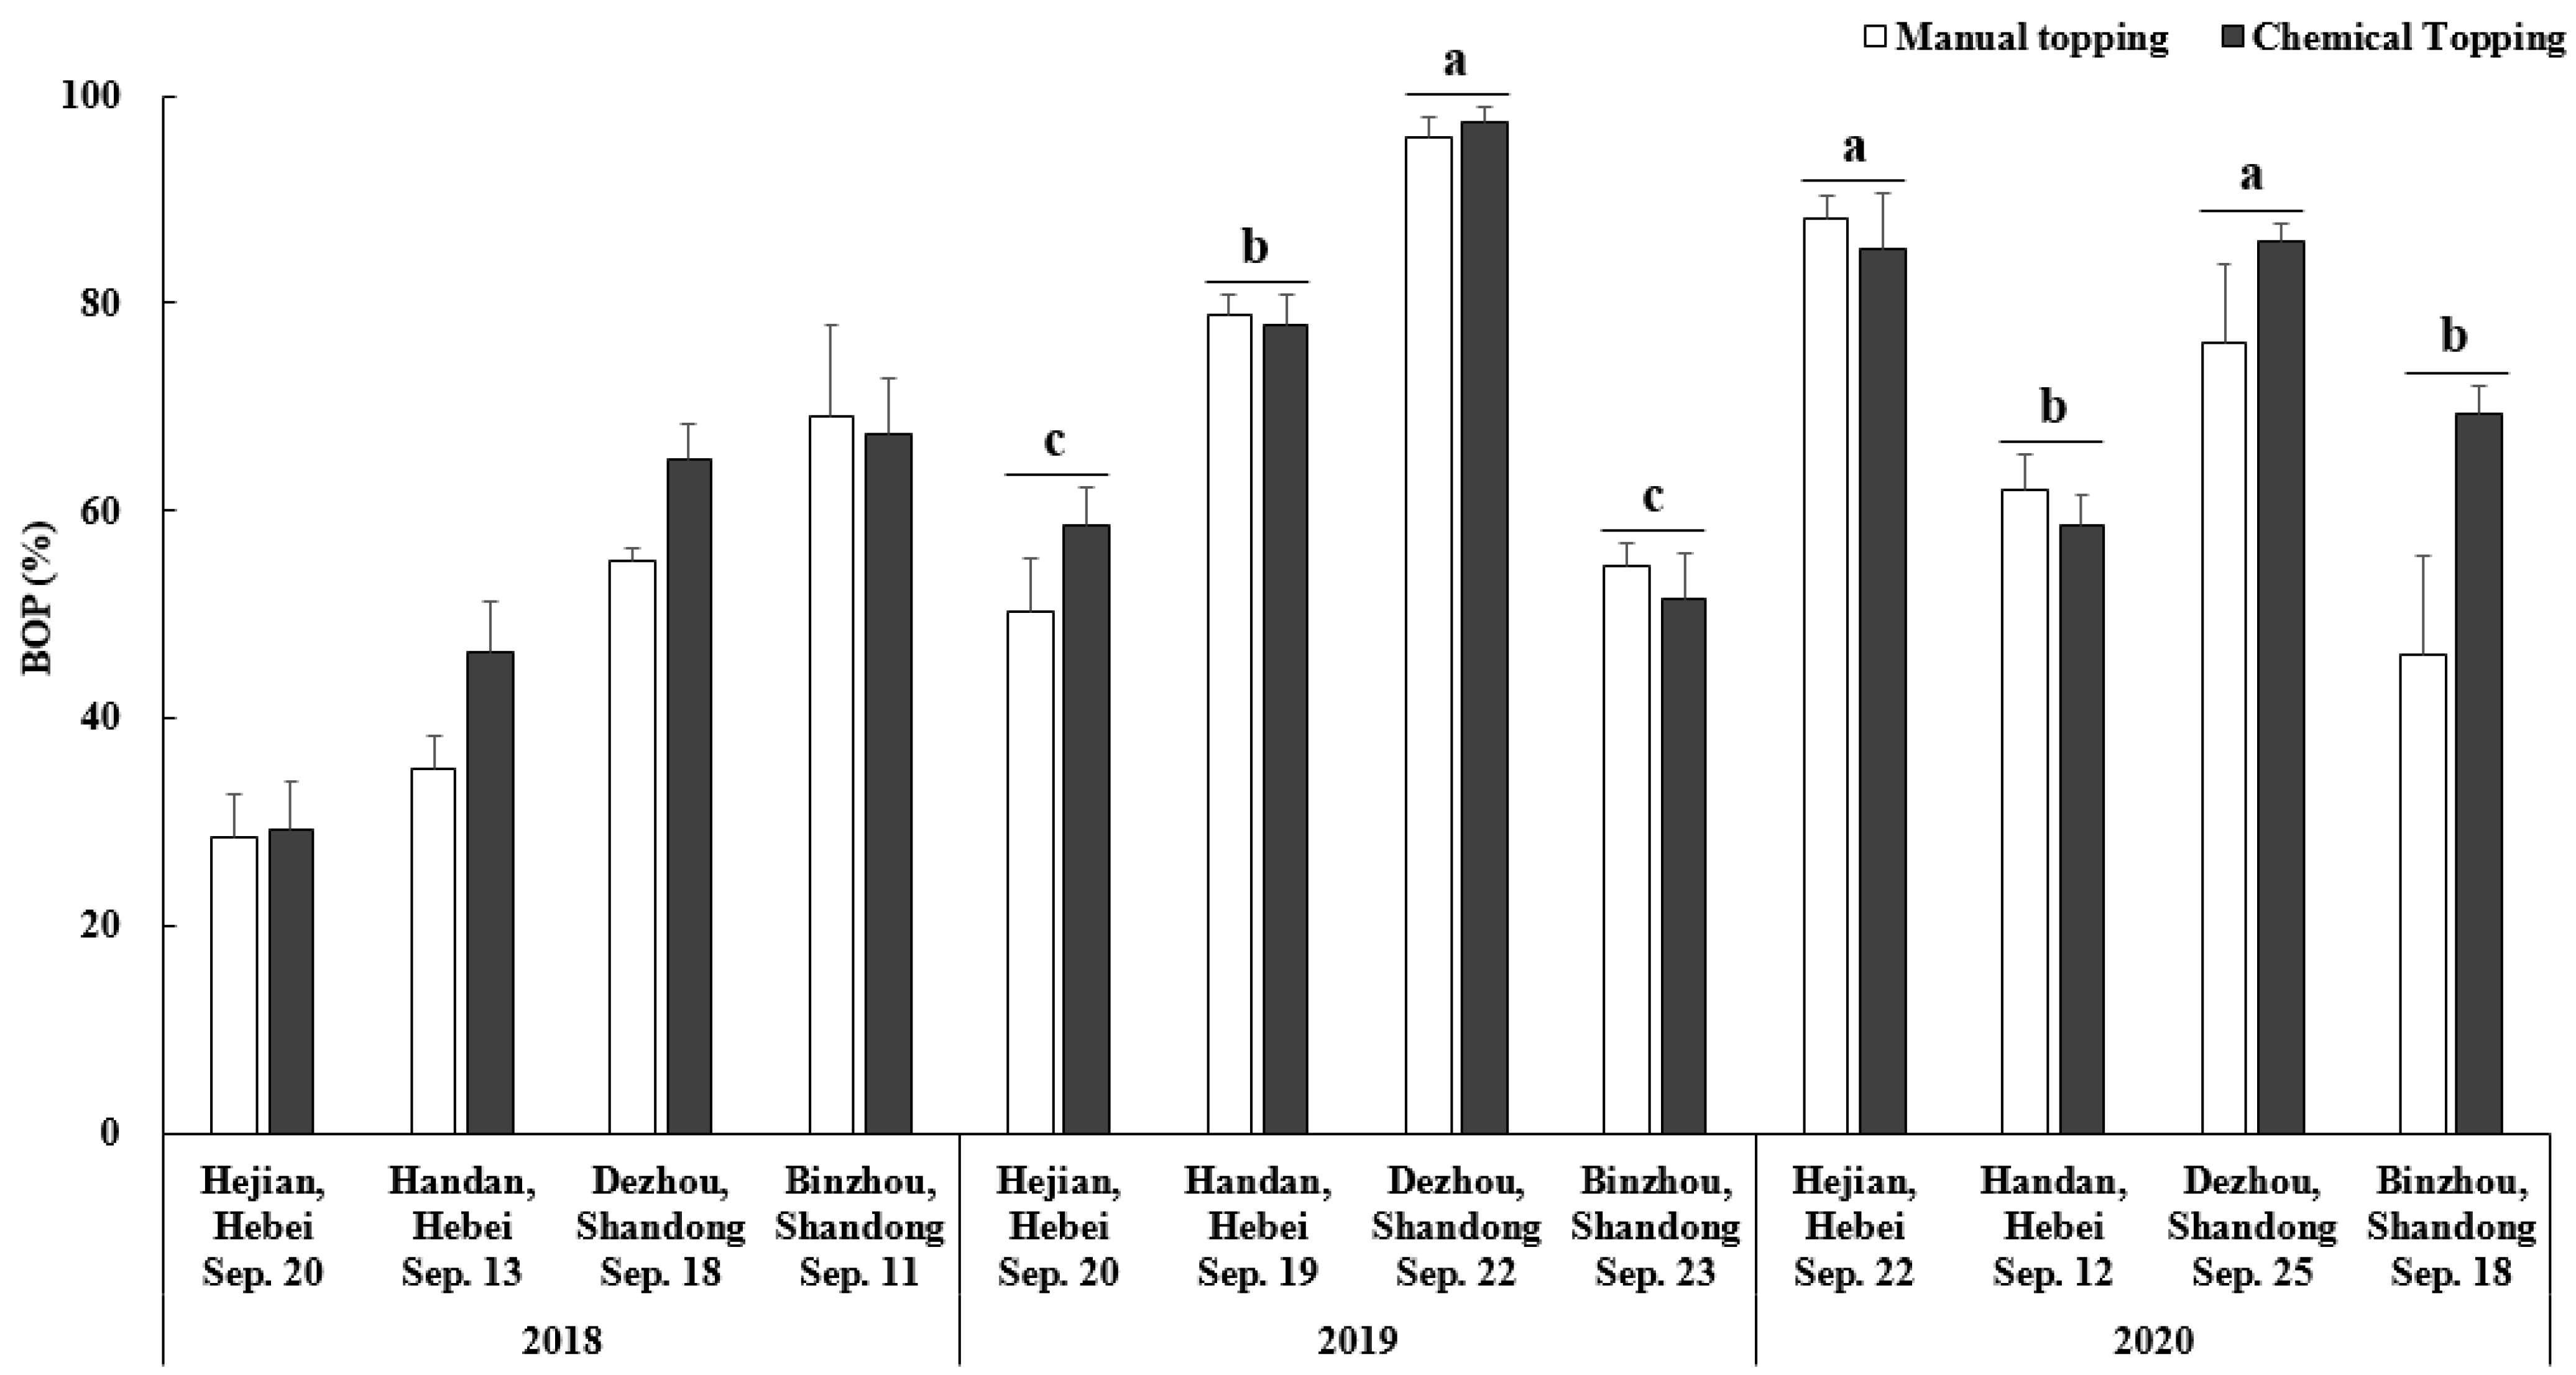
3.4. Boll Opening Percentage at Defoliation
There were great variations in BOP (from around 30% to 95%) prior to defoliation (in mid- or late September) among years and locations (Figure 5), which could be attributed to climate, variety, and management practices. According to ANOVA, these were significant between locations. BOP in Dezhou was always higher than in other locations. Despite the wide range of BOP, there were no significant differences between CT and MT, suggesting CT did not affect end-of-season maturity.
3.5. Yield and Yield Components
In 2018, CT did not influence seed cotton yield, except in Handan, where it caused significantly less boll and yield reductions (Table 2). In addition, CT better increased the boll density than MT in Dezhou in 2018, but there was no significant difference in actual seed cotton yield (Table 2). Since the same varieties were used in 2019 (Guoxin18-4) and 2020 (Guoxin 26), ANOVA was performed for the two years. There were significant differences in yield and its components among locations. CT, however, did not influence the yield-related parameters (Table 3). In addition, there were no significant interactions between location and topping treatment.
Table 2.
Effect of manual (MT) and chemical topping (CT) on seed cotton yield and yield components in 2018 *.
Table 3.
Effect of manual (MT) and chemical topping (CT) on seed cotton yield, and yield components in 2019 and 2020 *.
4. Discussion
4.1. Boll Distribution, Accumulation, and Maturity Varied Greatly with Environment and Management Practices
As expected, boll distribution and cotton maturity differed extensively among years and locations. Compared with 2018 and 2019, the spatial scale of boll distribution was narrower in 2020 (Figure 4). The reasons may lie in the much lower precipitation in July and excessive precipitation in August 2020 (Figure 2), which caused bolls to concentrate on lower and middle fruiting branches, concurrent with a strong fruit abscission on upper fruiting branches. Consequently, the number of cohorts was lowest in 2020, except in Dezhou (Figure 5I–L).
Averaged across years, Dezhou had a higher cohort number (i.e., wider boll distribution) than other locations, which could be attributed to its higher soil fertility (the previous crop being a vegetable patch) and sparser population (Table 1) that resulted in more robust plants. For Binzhou, which is near the Bohai Sea (with only about 90 km distance from the sea), the number of cohorts was the lowest in 2018 and 2019, possibly due to the inhibition of plant growth by soil salinity.
The BOP in the late season in Hejian varied greatly among the years. It reached 85% on 22 September 2020, but only 28% on 20 September 2018 and 50% on 20 September 2019. This was associated with the severe fruit shedding on upper sympodial branches in 2020 compared with 2018 and 2019. In addition, Dezhou showed the highest BOP (96%) in late September 2019, also accompanied by complete fruit shedding on upper parts of plants, caused by the outbreak of bollworms in August and failure in chemical control.
4.2. Chemical Topping Did Not Affect Cotton Maturity Compared with Manual Topping
Regular multiple MC application (Table 1) was performed to control excessive growth in both chemical topping (CT) and manual topping (MT) plots, and the frequencies and rates were determined based on precipitation and plant growth. That is to say, CT uses an extra MC application (in addition to regular multiple MC application) to replace manual removal of plant apex. Some studies have shown that CT created a more compact plant type than MT [8,9], and thus improved the ventilation and light distribution within the canopy, which could enhance the opening of bolls and result in earliness [14,25,26]. In our previous study, we found that the late CT (seven days later than MT, near the physiological cutout, when the nodes above white flower are equal to 5.0) may delay maturity (characterized by BOP in late season) compared with early (at peak bloom) or middle CT (seven days later than peak bloom, at the same time as MT), and a high MC (98% soluble powder) rate (270 g ha–1) used to execute CT may delay maturity than low (90 g ha–1) or medium (180 g ha–1) rates [19]. In this study, we further estimated how middle CT with medium MC rate affect cotton maturity that is measured during the season and at the end of the season based on data collected from four locations during 2018–2020. Firstly, we determined if CT alters the boll maturation period, but found no significant differences between CT and MT across the six environments (four in 2019 and two in 2020). Secondly, the spatial distribution and temporal accumulation of bolls were examined. Among 12 environments (three years × four sites), the difference in spatial boll distribution was observed only under three environments (Hejian in 2018 and 2019 and Handan in 2019), where CT produced taller but slender boll distribution by fruit positions than MT (Figure 4A,E,F). However, there were few differences in accumulated boll fraction by cohort (i.e., temporal distribution) between CT and MT under these three environments (Figure 5A,E,F). That was because the inner bolls on the upper part and outer bolls on the lower part may appear simultaneously. As a result, CT showed comparable BOP with MT in the late season, irrespective of year and location (Figure 6). Briefly, we provided comprehensive and definite evidence that CT performed at the same time as MT with medium MC rate (180 g ha–1) did not influence cotton maturity, which negates the assumption of late maturity. Dai et al. (2022) also found that CT did not affect cotton maturity compared with MT [18].

Figure 6.
Effect of topping treatments during flowering period on boll opening percentage (BOP) in mid- or late September; t-tests were used to compare the means of manual topping and chemical topping at the 0.05 probability level. Different letters indicate significant differences among locations within the year according to least significant difference at the 0.05 probability level.
In addition, there was a clear difference in boll accumulation by cohort between CT and MT at Hejian in 2020 (Figure 5I), where CT showed lower accumulated boll fraction than MT from the 3rd to 11th cohort, which was mainly associated with the abscission at the first fruit site on the 5th–7th sympodium of CT-treated plants (Figure 4I). However, CT had the same accumulated boll fraction as MT at the 12th and 13th cohorts. This was because CT produced more bolls than MT at the first fruit sites of the 8th–10th fruiting branches, at the second fruit site of the 6th–8th fruiting branches, and the third fruit site of the 4th–5th fruiting branches (Figure 4I). Therefore, CT did not significantly influence the BOP on 22 September 2020 (Figure 6).
4.3. Chemical Topping Did Not Alter Yield Unless under Drought Stress
The data for 2018 were analyzed separately at each location due to the different varieties used. CT did not affect seed cotton yield at three of the four locations, and only reduced yield in Handan. From the climatic data, the precipitation in August 2018 in Handan was only 70.0 mm, much less than the local average for this month (119.8 mm). It is well established that cotton yield responds negatively to MC application under drought condition [27,28]. Therefore, it appears that CT with MC caused an over control of cotton plants in Handan in 2018, thereby reducing boll retention and yield.
In 2019 and 2020, there were significant variations in yield among locations, which was ascribed to the differences in environments and management practices. However, CT did not affect yield or yield components, and no interactions between topping treatment and location were found (Table 3). The yield results for the three years at the four sites (except in Handan in 2018) were in agreement with most reports on CT treatment in cotton [4,17,18].
5. Conclusions
In this study, we examined the effects of chemical topping (CT) with mepiquat chloride (MC) on cotton maturity based on boll age, spatial boll distribution, accumulation of boll fraction by cohort, and boll opening percentage in the late season, with manual topping (MT) as control. The yield and yield components were also compared between CT and MT. The results suggest that CT did not influence cotton maturity or yield (except under drought), even if there were considerable differences among years and locations. Therefore, CT with MC (around 180 g/ha) performed during flowering like MT would be safe for cotton production in terms of maturity and yield. The results will be applicable to the areas with similar ecological conditions and social problems that urgently need to replace extensive manual labors by chemical practices, such as in the Yellow River Valley of China.
Author Contributions
Visualization, H.Q. and C.X.; conceptualization: X.T. and Z.L. (Zhaohu Li); data curation, H.Q., C.X., M.D. and X.T.; formal analysis, C.X. and X.T.; investigation, H.Q., W.Z., D.X., Z.L. (Zhengying Lu), R.S. and G.W.; project administration, Z.L. (Zhaohu Li); resources, W.Z., D.X., Z.L. (Zhengying Lu), R.S., G.W. and M.D.; supervision, M.D., X.T. and Z.L. (Zhaohu Li); writing—original draft, H.Q. and C.X.; writing—review and editing, A.E.E. and X.T. All authors have read and agreed to the published version of the manuscript.
Funding
This work was supported by the China Agriculture Research System (CARS-15-16).
Data Availability Statement
Data are contained within the article.
Acknowledgments
We thank Du Meng, Liao Bao-peng, Wei Ze-xin, Tan Zhi-xin, Wang Yu-kun, Xie Liu-wei and An Yang-yang of China Agricultural University for their assistance in data analysis.
Conflicts of Interest
The authors declare that they have no conflicts of interest.
References
- Norton, E.R.; Silvertooth, J.C.; Galadima, A. Residual soil nitrogen evaluations in irrigated soils of the desert southwest. In Proceedings of the Beltwide Cotton Conferences, New Orleans, Louisiana, 9–12 January 2007; Volume 2245, pp. 1–9. [Google Scholar]
- Hearn, A. OZCOT: A simulation model for cotton crop management. Agric. Syst. 1994, 44, 257–299. [Google Scholar] [CrossRef]
- Gwathmey, C.O.; Bange, M.P.; Brodrick, R. Cotton crop maturity: A compendium of measures and predictors. Field Crop. Res. 2016, 191, 41–53. [Google Scholar] [CrossRef]
- Chalise, D.P.; Snider, J.L.; Hand, L.C.; Roberts, P.; Vellidis, G.; Ermanis, A.; Collins, G.D.; Lacerda, L.N.; Cohen, Y.; Pokhrel, A.; et al. Cultivar, irrigation management, and mepiquat chloride strategy: Effects on cotton growth, maturity, yield, and fiber quality. Field Crop. Res. 2022, 286, 108633. [Google Scholar] [CrossRef]
- Liang, F.-B.; Yang, C.-X.; Sui, L.-L.; Xu, S.-Z.; Yao, H.-S.; Zhang, W.-F. Flumetralin and dimethyl piperidinium chloride alter light distribution in cotton canopies by optimizing the spatial configuration of leaves and bolls. J. Integr. Agric. 2020, 19, 1777–1788. [Google Scholar] [CrossRef]
- Rademacher, W. Plant Growth Regulators: Backgrounds and Uses in Plant Production. J. Plant Growth Regul. 2015, 34, 845–872. [Google Scholar] [CrossRef]
- Dong, H.; Li, W.; Li, Z.; Wei, T.; Zhang, D. Review on utilization of vegetative branches of cotton plants. Cotton Sci. 2003, 15, 313–317. [Google Scholar]
- Li, F.; Xi, W.; Wang, X.; Du, M.; Zhou, C.; Yin, X.; Xu, D.; Lu, H.; Tian, X.; Li, Z. Cotton chemical topping with mepiquat chloride application in the north of Yellow River valley of China. Sci. Agric. Sin. 2016, 49, 2497–2510. [Google Scholar]
- Zhao, Q.; Zhou, C.; Zhang, J.; Li, S.; Yun, Y.; Tian, X. Effect of chemical detopping on the canopy and yield of cotton (Gossypium hirsutum) in south Xinjiang. Cotton Sci. 2011, 23, 329–333. [Google Scholar]
- Liao, B.; Ren, X.; Du, M.; Eneji, A.E.; Tian, X.; Li, Z. Multiple applications of mepiquat chloride enhanced development of plant-wide fruits from square initiation to boll opening in cotton. Crop Sci. 2021, 61, 2733–2744. [Google Scholar] [CrossRef]
- He, Z.; Li, P.; Xi, H.; Li, Z.; Bai, L. The using and development of DPC chemical controlling technique in cotton culture. J. China Agric. Univ. 1991, 17, 58–63. [Google Scholar]
- Cook, D.R.; Kennedy, C.W. Early Flower Bud Loss and Mepiquat Chloride Effects on Cotton Yield Distribution. Crop Sci. 2000, 40, 1678–1684. [Google Scholar] [CrossRef]
- He, Z.; Min, X.; Li, P.; Xi, H. Study on effects of DPC on endogenous hormone levels and the development of cotton bolls. Acta Agron. Sin. 1990, 16, 252–258. [Google Scholar]
- Zhang, J.; Han, Y.; Li, Y.; Li, X.; Wang, G.; Wang, Z.; Du, W.; Feng, L. Inhibition of apical dominance affects boll spatial distribution, yield and fiber quality of field-grown cotton. Ind. Crop. Prod. 2021, 173, 114098. [Google Scholar] [CrossRef]
- Schaefer, C.; Nichols, B.; Collins, G.; Whitaker, J.; Bednarz, C.; Main, C.; Ritchie, G. Cotton Maturity Determination through Vertical Mapping. Crop Sci. 2016, 57, 62–70. [Google Scholar] [CrossRef]
- Gwathmey, C.O.; Clement, J.D. Alteration of cotton source–sink relations with plant population density and mepiquat chloride. Field Crop. Res. 2010, 116, 101–107. [Google Scholar] [CrossRef]
- Li, F.; Du, M.; Xu, D.; Chen, J.; Tian, X.; Li, Z. Effects of chemical topping with fortified mepiquat chloride on cotton growth, yield and maturity under different plant densities and nitrogen rates in the Yellow River valley region of China. J. China Agric. Univ. 2018, 23, 10–22. [Google Scholar]
- Dai, J.; Tian, L.; Zhang, Y.; Zhang, D.; Xu, S.; Cui, Z.; Li, Z.; Li, W.; Zhan, L.; Li, C.; et al. Plant topping effects on growth, yield, and earliness of field-grown cotton as mediated by plant density and ecological conditions. Field Crop. Res. 2022, 275, 108337. [Google Scholar] [CrossRef]
- Qi, H.-K.; DU, M.-W.; Meng, L.; Xie, L.-W.; Egrinya, E.A.; Xu, D.-Y.; Tian, X.-L.; Li, Z.-H. Cotton maturity and responses to harvest aids following chemical topping with mepiquat chloride during bloom period. J. Integr. Agric. 2022, 21, 2577–2587. [Google Scholar] [CrossRef]
- Reddy, A.R.; Reddy, K.R.; Hodges, H.F. Mepiquat chloride (PIX)-induced changes in photosynthesis and growth of cotton. Plant Growth Regul. 1996, 20, 179–183. [Google Scholar] [CrossRef]
- Stewart, S.D.; Sterling, W.L. Dynamics and Impact of Cotton Fruit Abscission and Survival. Environ. Èntomol. 1988, 4, 629–635. [Google Scholar] [CrossRef]
- Bednarz, C.W.; Bridges, D.C.; Brown, S.M. Analysis of Cotton Yield Stability Across Population Densities. Agron. J. 2000, 92, 128–135. [Google Scholar] [CrossRef]
- Kerby, T.A.; Buxton, D.R. Competition Between Adjacent Fruiting Forms in Cotton. Agron. J. 1981, 73, 867–871. [Google Scholar] [CrossRef]
- Bednarz, C.W.; Shurley, W.D.; Anthony, W.S.; Nichols, R.L. Yield, Quality, and Profitability of Cotton Produced at Varying Plant Densities. Agron. J. 2005, 97, 235–240. [Google Scholar] [CrossRef]
- Qi, H.; Wang, S.; Xu, D.; Lu, Z.; Zhao, W.; Hao, Y.; Zhang, X.; Li, W.; Han, H.; Wang, J.; et al. Cotton chemical topping by applying DPC in different cotton-growing regions. Cotton Sci. 2020, 32, 425–437. [Google Scholar]
- Mao, L.; Zhang, L.; Zhao, X.; Liu, S.; van der Werf, W.; Zhang, S.; Spiertz, H.; Li, Z. Crop growth, light utilization and yield of relay intercropped cotton as affected by plant density and a plant growth regulator. Field Crop. Res. 2014, 155, 67–76. [Google Scholar] [CrossRef]
- He, Z.; Xi, H.; Yang, B.; Li, P.; Han, B. The key to get good yield of cotton by inducing the response to DPC towards a planned direction and in planned strength. J. China Agric. Univ. 1984, 10, 19–28. [Google Scholar]
- York, A.C. Cotton Cultivar Response to Mepiquat Chloride1. Agron. J. 1983, 75, 663–667. [Google Scholar] [CrossRef]
Disclaimer/Publisher’s Note: The statements, opinions and data contained in all publications are solely those of the individual author(s) and contributor(s) and not of MDPI and/or the editor(s). MDPI and/or the editor(s) disclaim responsibility for any injury to people or property resulting from any ideas, methods, instructions or products referred to in the content. |
© 2023 by the authors. Licensee MDPI, Basel, Switzerland. This article is an open access article distributed under the terms and conditions of the Creative Commons Attribution (CC BY) license (https://creativecommons.org/licenses/by/4.0/).