Abstract
Soybean (Glycine max L.) is a high value crop that has been used as a forage since the early 1900s in the southern U.S. (e.g., Mississippi, Alabama, Georgia, South Carolina, and Florida). Renewed interest has increased the use of soybean as a viable and economical high protein alternative to forage growers in the southern region. The objective of this study was to determine herbage mass (HM) and nutritive value of forage soybean managed under two row spacing (36 and 72 cm) and three stubble heights (10, 15, and 20 cm). Five cultivars were used ‘Stonewall’, ‘Laredo’, ‘Tower of Leaves’, Asgrow® ‘AG64X8’, and Asgrow® ‘AG79X9’ and sown at two locations (Shorter and Headland, AL). Forage was harvested in July and August during both years and HM was determined. Crude protein (CP) and fiber fractions were determined using near-infrared spectroscopy. Years and location did vary, but overall, Stonewall had the greatest (p < 0.026) HM (1706 kg DM ha−1) with a high nutritive value (124 g CP kg−1, 449 g NDF kg−1, and 372 g ADF kg−1). Laredo had the lowest HM (1169 kg DM ha−1; p < 0.025). The 10 cm stubble height resulted in increased HM (1898 kg DM ha−1; p < 0.0001) but decreased nutritive value (149 g CP kg−1; 331 g ADF kg−1; 413 g NDF kg−1; p = 0.001) compared to 20 cm (179, 282, and 375 g kg−1 for CP, ADF, and NDF, respectively). Row spacing did not consistently influence either HM or nutritive values. Due to its relatively good nutritive value and HM, forage soybean should be considered as a monoculture or in a mixed sward with other warm-season annual forages for inclusion in forage-based livestock diets.
1. Introduction
Forage legumes are important feed sources for livestock production. One of the most common livestock protein sources is alfalfa (Medicago sativa L.) due to its high nutritive value and high forage production [1,2,3]. In the southern U.S., decreased acreage of alfalfa relative to other regions of the U.S. elevates feeding costs because locally produced alfalfa is not readily available. Another popular legume used is rhizoma perennial peanut (Arachis glabrata B.) which is a perennial warm-season legume. It is well adapted to the Gulf Coast Region and is widely adapted in Florida and the southern regions of Georgia and Alabama [1]. However, its adoption among producers has been slow due to difficulties in establishment [4]. Recently, research efforts have focused on identifying alternative high-quality forage legumes to improve the availability of feed sources for livestock producers in regions of low-alfalfa production.
One viable alternative is forage-type soybean (Glycine max L.) which is an annual warm-season legume with high forage nutritive value and production [5]. Soybean was an important forage crop in the region until around the 1930s [6] and had been regaining acreage in the U.S. with the release of new forge-type cultivars [5,7]. Soybean cultivars have an average herbage mass (HM) of 9.3 and 7.6 Mg ha−1 for forage- and grain-type cultivars, respectively [5]. Previous studies reported similar neutral detergent fiber (NDF) and acid detergent fiber (ADF) concentrations across the grain- and forage-type cultivars ranging from 348 to 571 g kg−1 and 283 to 492 g kg−1, respectively, and crude protein (CP) concentration ranges from 122 to 180 g kg−1 [5,7]. This is similar to reported values of fiber characteristics, digestibility, and CP for alfalfa and rhizoma perennial peanut [8,9,10,11,12].
Soybean seed yield has been shown to increase when planted at 19 cm row widths [13], while fields had similar soybean HM accumulation. Other studies have reported that HM increased under narrower row spacings (≤25 cm) [4,5,7]. However, these studies have reported conflicting results on the effects of row spacing on forage nutritive value. Seiter et al. [5] observed greater nutritive value at an 18 cm row spacing compared to a 36 cm spacing. However, Sheaffer et al. [7] and Hintz et al. [6] reported no row spacing effects on forage nutritive value. Seiter et al. [3] also reported taller plants when using a wider row spacing. Other research has shown that harvesting soybeans for hay reduces forage yield by 38% compared to soybeans grazed at higher forage height [14]. Understanding the appropriate establishment and defoliation guidelines for soybean may enhance its potential application among forage growers in the southern U.S. The objective of this study was to determine the HM and nutritive value of five soybean cultivars managed under two-row spacings (36 and 72 cm) and three stubble heights (10, 15, and 20 cm) at two locations in Alabama. The hypothesis was that higher stubble height and narrower row spacing will provide greater HM production regardless of location but would not affect soybean nutritive value.
2. Materials and Methods
2.1. Experimental Site Description
A two-year, small-plot study was conducted at two locations, the E.V. Smith Research Center (EVREC) in Shorter, AL (32°25′28” N, 85°53′26” W), and the Wiregrass Research and Extension Center (WREC) in Headland, AL (31°21’23.7” N, 85°19’11.7” W). At EVREC, the predominant soils are classified as Marvyn loamy sand (fine-loamy, kaolinitic, thermic Typic Kanhapludults). At WREC, soils are classified as Dothan fine sandy loam (fine-loamy, kaolinitic, thermic Plinthic Kandiudults). At both sites and in both years, corn (Zea mays L.) was the previous commodity crop grown. Weather data were collected on-site through Agricultural Weather Information Service, Inc. (Auburn, Alabama) stations located at each research station and are presented below in Figure 1 and Figure 2.
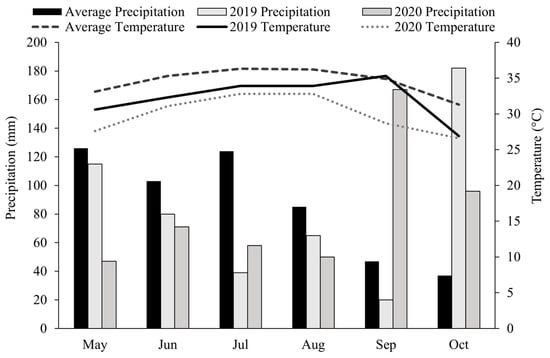
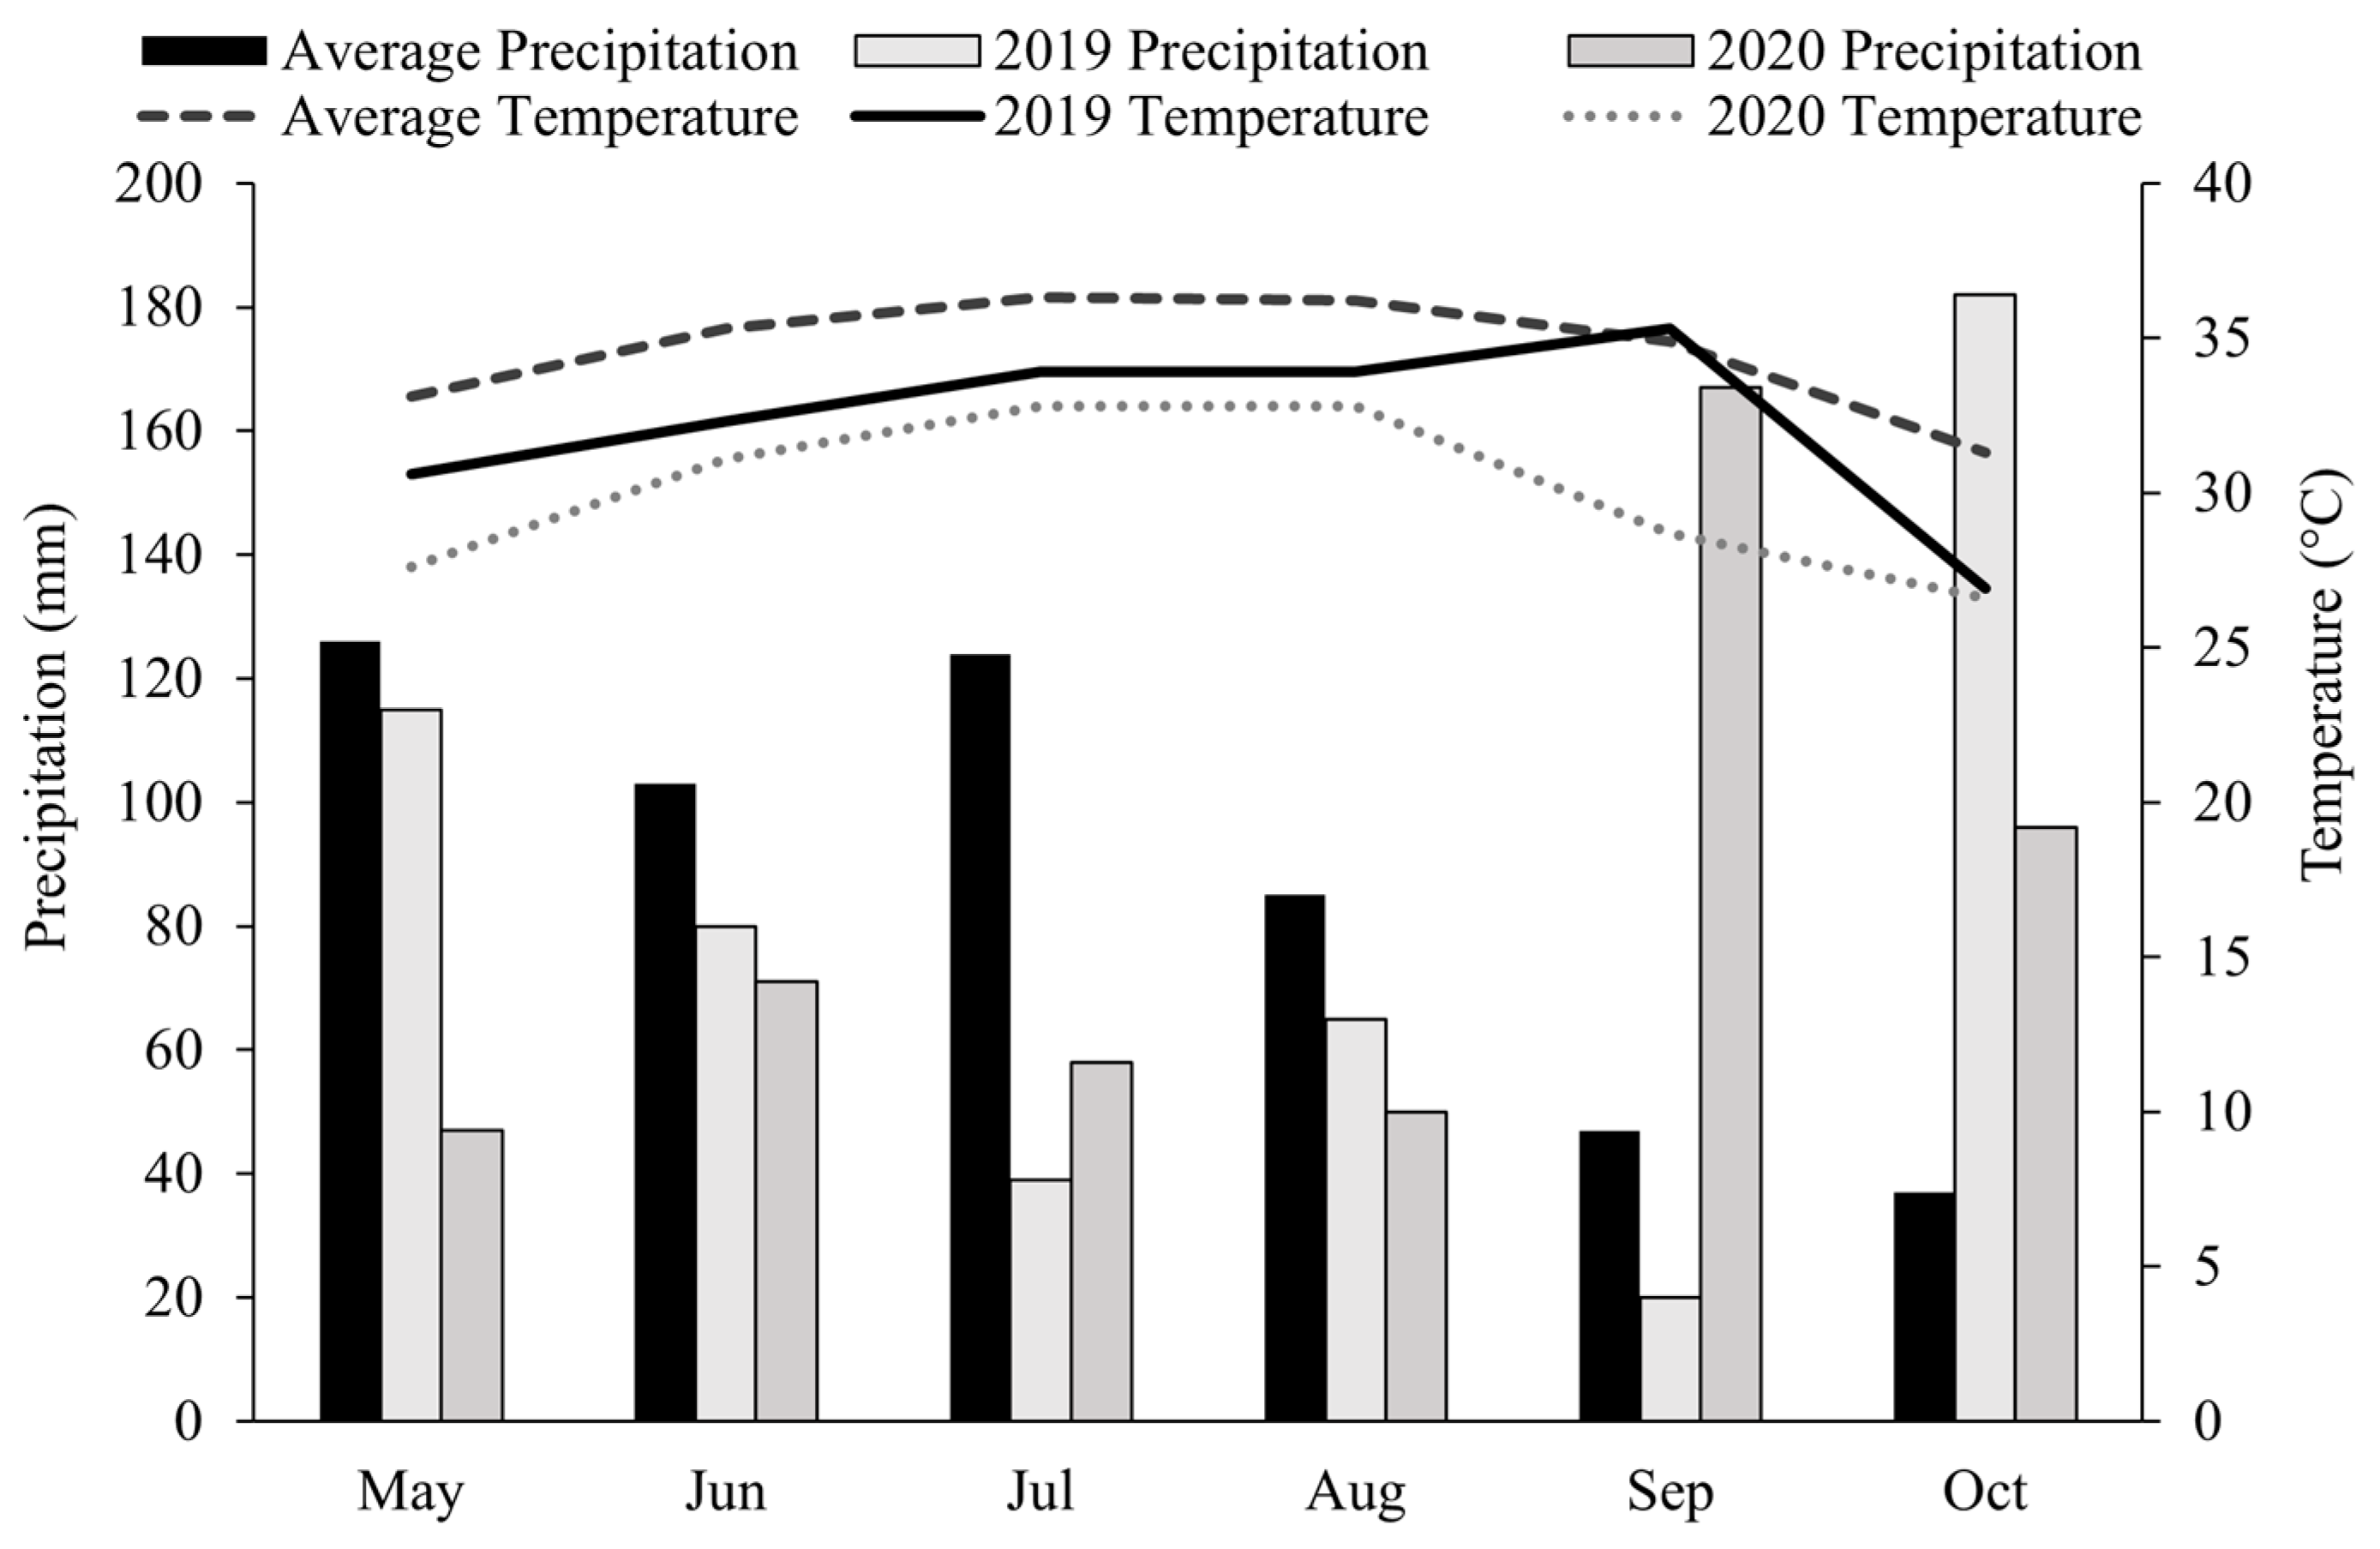
Figure 1.
Monthly weather data at Shorter, AL during the 2-year study period (2019 and 2020) and the 8-year average. Bars indicate cumulative monthly rainfall; lines indicate monthly average daily temperature.
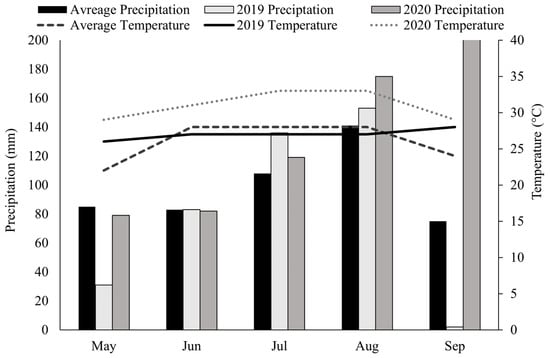
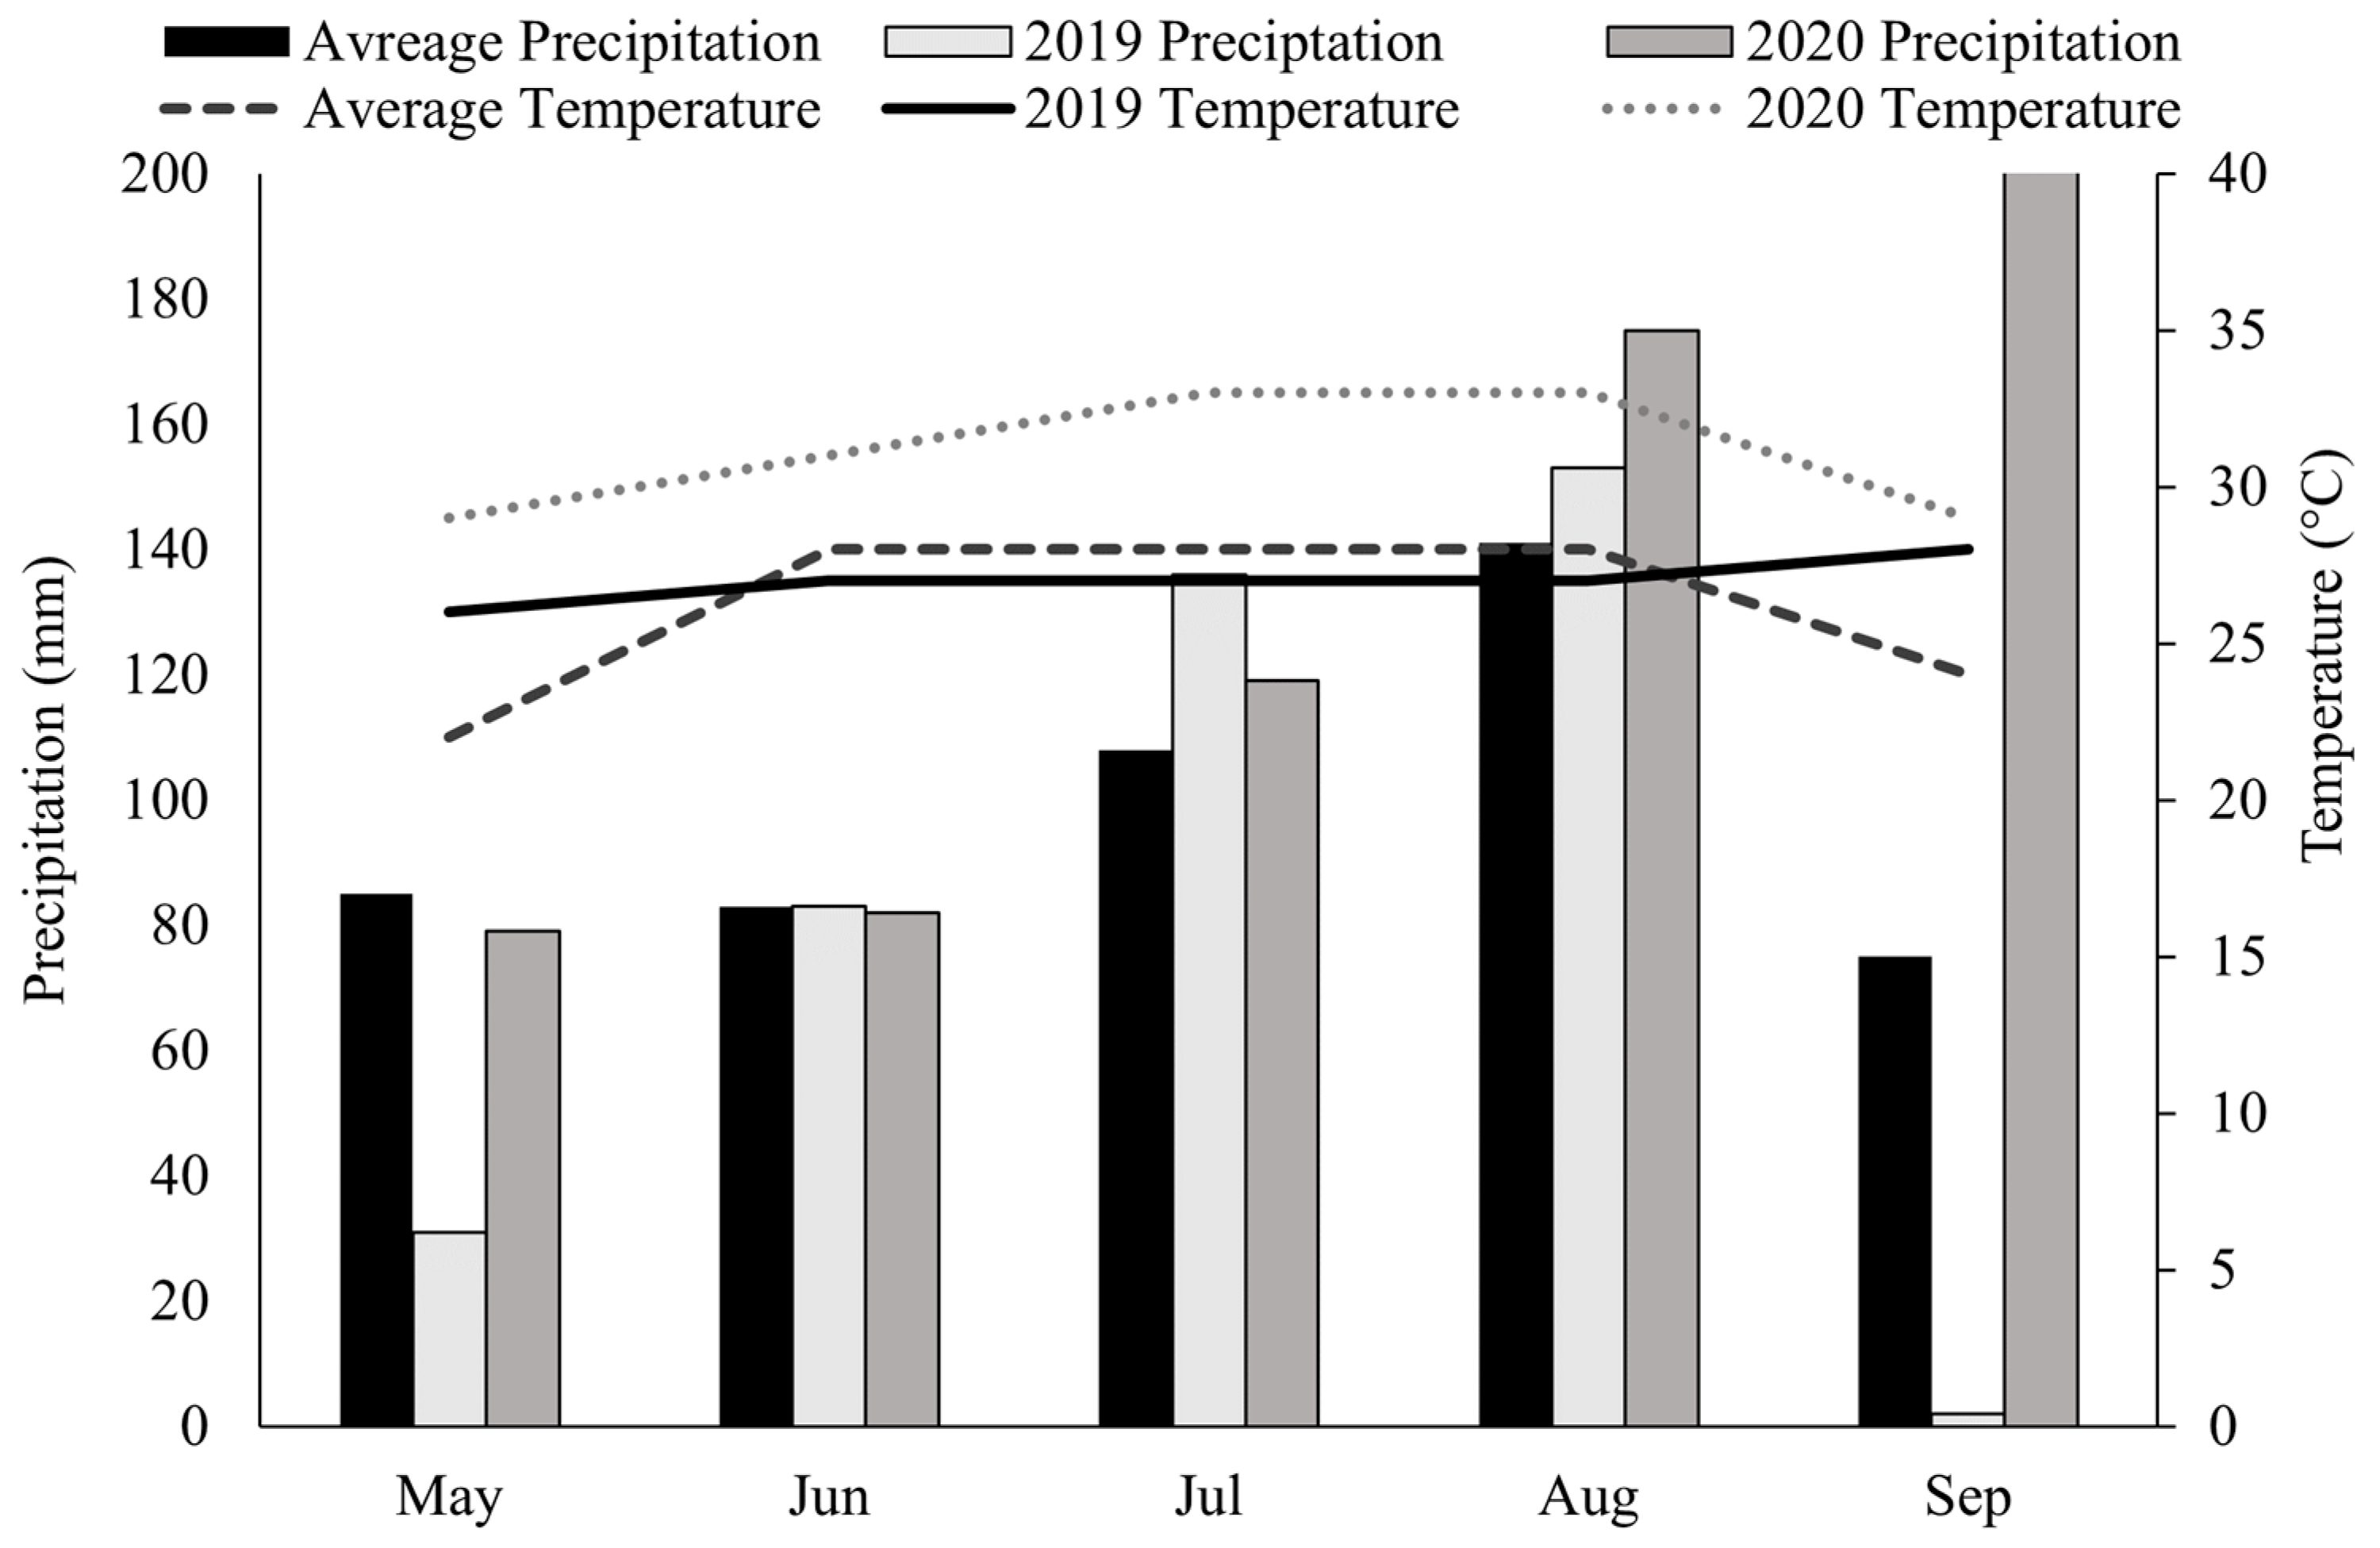
Figure 2.
Monthly weather data at Headland, AL during the 2-year study period (2019 and 2020) and the 10-year average. Bars indicate cumulative monthly rainfall; lines indicate monthly average daily temperature.
2.2. Treatments and Experimental Design
Treatments consisted of five soybean cultivars [‘Stonewall’ (PI 531068), ‘Laredo’ (PI 438495), ‘Tower of Leaves’, ‘AG64X8′, and ‘AG79X9′] managed under three stubble heights (10, 15, and 20 cm) and planted at two-row spacings (36 and 72 cm) at two locations (EVREC and WREC). There was a total of 120 experimental units (9 m2 each) per location, and plots were arranged in a randomized complete block design with a 5 × 3 × 2 × 2 factorial arrangement and four replicates. Laredo, Tower of Leaves, and Stonewall are forage-type soybeans, while AG64X8 and AG79X9 are grain-type soybeans [15,16,17]. All treatments represent commonly used soybean cultivars for the southern U.S. In terms of maturity, Laredo and AG64X8 are classified as VI soybean (AgSeed Select, Bayer Global seeds, and Traits, St. Louis, MO, USA) and Stonewall and AG79X9 are VII soybean [16,17], while Tower of Leaves is described as a later maturing cultivar [16].
In Year 1 (2019), plots were planted on 21 May and 17 May at EVREC and WREC, respectively. In Year 2 (2020), plots were planted on 15 June and 3 June at EVREC and WREC, respectively. At planting, seeds were sown using a grain drill at a rate of 66 kg pure live seed (PLS) ha−1. Every other seed opening was covered in the 72 cm row spacing treatment to provide a larger row width. At EVREC, plots were fertilized with 17.6 kg N ha−1 in Year 1 and with no N added in Year 2. In both years, P, K, and lime were added according to soil test results to achieve the recommended values for soybean (57–73 kg P ha−1, 136–179 kg K ha−1, and soil pH of 6.5 [18]). Based on the soil test report, no N, P, K, or lime was used at the WREC site either year, as values were within the recommended ranges of soil pH, P, and K for soybean [18].
Plots were harvested at 25 to 50% bloom. In Year 1, plots were harvested on 12 July and 8 August at EVREC and WREC locations, respectively. Only at EVREC, there was significant regrowth to warrant a second harvest which occurred on 12 September (62 d regrowth period) in Year 1. During Year 2, plots were harvested on 11 August and 28 July at EVREC and WREC locations, respectively. Only regrowth at WREC warranted a second harvest which occurred on 2 September (36 d regrowth period). At both locations, a Lawn Genie forage harvester (Mathews Company, Crystal Lakes, IL, USA) was used to harvest plots.
2.3. Response Variables
Leaf area index (LAI) was determined prior to the first harvest at each location by taking three measurements randomly per plot below the canopy using a Li-Cor LAI-2200C plant canopy analyzer (LI-COR Biosciences, Lincoln, NE, USA). On each sampling day, LAI measurements were conducted between 0900 and 1000.
Forage mass was determined by harvesting the whole plot and weighing each fresh sample in the field using hanging scales. A subsample was collected from each plot and a fresh weight was taken. Subsamples were dried at 55 °C in a forced air oven for 72 h and weighed for dry matter (DM) determination. Following drying, samples were ground to pass a 1 mm screen using a Wiley Mill (Thomas Scientific, Philadelphia, PA, USA) before laboratory analysis. Samples were analyzed by near-infrared spectroscopy (NIR) analysis using National Forage Testing Association equations [19] at the Auburn University Soil and Forage Testing Laboratory (Auburn, Alabama). Each year, ten percent of samples were randomly selected for wet chemistry analysis to validate NIR results.
Samples selected for wet chemistry analysis were analyzed for DM, NDF, ADF, and CP at the Auburn University Animal Nutrition Laboratory (Auburn, AL, USA). During both years, the Van Soest et al. [20] method was used to determine NDF and ADF concentrations in an ANKOM 2000® (Ankom Technology Corporation, Fairport, NY, USA). Nitrogen concentration was determined by Micro-Kjeldahl digestion [21] and laboratory DM was determined by procedures of the AOAC [21] by drying samples overnight in a 105 °C oven. Nitrogen concentration was then multiplied by 6.25 to determine CP concentration. Digestible energy (DE) was determined by DE (Mcal/kg) = 4.22 − (0.11 × ADF) + (0.0332 × CP) + (0.00112 × ADF × ADF). Total digestible nutrients (TDN) were determined as TDN = (DE/4.409) × 100 [22,23].
2.4. In Vitro Dry Matter Digestibility
For in vitro dry matter digestibility (IVDMD) concentration determination, feces were collected from four mature mares (mean 526 kg body weight and 13 years of age) housed at the Auburn University Horse Center (Auburn, Alabama). All experimental procedures involving animals were conducted in accordance with the Auburn University Institutional Animal Care and Use Committee (IACUC) protocol 2019-3627. Animals had ad libitum access to mixed-species pasture and were fed different proportions of Nutrena® Proelite Performance concentrate depending on their specific nutritional needs (0.1–0.5 kg d−1). Immediately after feces collection, feces were placed in an air-tight container and placed in a 39 °C water bath for transportation to the Auburn University Animal Nutrition Laboratory. Feces were immediately homogenized, and a 400 g composite sample was blended with 1600 mL buffer solution. The buffer solution was made according to the Weller and Pilgrim method [24]. The forage samples were analyzed using a Daisy II® incubator system (ANKOM Technology Corporation, Fairport, NY, USA) according to the Lattimer et al. [25] method.
2.5. Statistical Methods
Data were analyzed using PROC MIXED of SAS version 9.4 (SAS Institute, Cary, NC, USA). Forage mass was summed across harvests to provide a total annual HM, and nutritive value responses were reported as the average across harvests. Cultivar, row spacing, stubble height, year, and location were considered fixed effects, block was considered a random effect, and harvest date was considered a repeated measure. Due to a large number of samples and the lack of statistical differences between row spacings and sites, IVDMD was only performed on samples from the first harvest at one location (EVREC) each year and at one-row spacing (36 cm). For IVDMD, cultivar and stubble height were fixed effects, and block was considered a random effect. Mean separations were performed using Fisher-Protected LSMeans with a significance level set at p ≤ 0.05 for all effects and interactions.
3. Results
A combined ANOVA across all effects resulted in both location and year producing significant main effects, which resulted in multiple significant interactions. Therefore, each year and individual location were analyzed separately to highlight the treatment effects of row spacing, cultivar, and stubble height (Table 1 and Table 2).

Table 1.
Main effects and interactions for herbage mass and nutritive value responses of soybean for 2 years (2019 and 2020) at E.V. Smith Research Center in Shorter, AL.
Table 2.
Main effects and interactions for herbage mass and nutritive value responses of soybean across 2 years (2019 and 2020) at the Wiregrass Research and Extension Center in Headland, AL.
3.1. E.V. Smith Research and Extension Center
In Year 1, there was an effect of row spacing on LAI, DE, ADF, NDF, and TDN at EVREC (Table 1). However, no cultivar × row spacing interaction was observed. The greatest LAI, ADF, and NDF occurred in the 72 cm row spacing, while the 36 cm row spacing produced the greatest DE and TDN (Table 3). There was no effect of row spacing on HM and CP. Stubble height affected all measured traits except LAI; however, no cultivar × stubble interaction was seen (Table 1). Forage mass was greater, and CP was least in the 10 cm stubble height, while there were no differences in those two parameters between the 15 and 20 cm stubble heights (Table 3). The 20 cm stubble height produced the greatest DE and TDN, while the 15 cm stubble height also had greater DE and TDN than the 10 cm stubble height. The greatest ADF was seen in plots harvested at 10 cm, while the 15 cm stubble height also resulted in greater ADF than the 20 cm height. There was greater NDF in the 10 and 15 cm stubble heights than in the 20 cm stubble height. Cultivar differences were observed in HM and CP. AG64X8 and Stonewall had greater HM than Laredo, and Stonewall also had greater HM than AG79X9. Stonewall, AG64X8, and AG79X9 had greater CP than Laredo, and AG64X8 and AG79X9 also had greater CP than Tower of Leaves. There were no differences in HM of Tower of Leaves with any other cultivar.
Table 3.
Herbage mass and nutritive value of soybean across two years (2019 and 2020) at the E.V. Smith Research and Extension Center in Shorter, AL.
In Year 2, there was no influence of row spacing on any parameter tested (HM, LAI, CP, DE, ADF, NDF, and TDN; Table 3). The 10 cm stubble height produced the greatest HM, ADF, and NDF and the least CP, DE, and TDN. There were no differences between the 15 and 20 cm stubble heights for any parameter. There was no effect of stubble height on LAI. For cultivar differences, Laredo had the least HM and Tower of Leaves had the greatest. Stonewall and AG64X8 had greater HM than AG79X9. The greatest LAI was observed in Laredo, while the least was in Tower of Leaves. Stonewall had lesser LAI than AG64X8 and AG79X9. Stonewall had the least CP, and there were no differences in CP between the other cultivars.
Both stubble height and cultivar affected IVDMD (Table 4); however, no cultivar × stubble height interaction was observed (p = 0.097). Plots harvested to 10 cm had the least IVDMD, while those harvested to 20 cm had the greatest. Stonewall, AG64X8, and AG79X9 had the greatest IVDMD, while Tower of Leaves had the least and Laredo was intermediary.
Table 4.
Effects of soybean stubble height and cultivar on in vitro dry matter digestibility (IVDMD) across 2 years (2019 and 2020) at the E.V. Smith Research and Extension Center in Shorter, AL.
3.2. Wiregrass Research and Extension Center
In Year 1, there was an influence of row spacing on HM at WREC (Table 2). The greatest HM was produced from the 72 cm row spacing (Table 5). There was no effect of row spacing on LAI, CP, DE, ADF, NDF, and TDN. Stubble height affected HM, CP, DE, and TDN. Forage mass was greatest in the 10 cm stubble height and least in the 20 cm stubble height. The 10 cm stubble height resulted in the least CP, DE, and TDN. There were no differences between the 15 and 20 cm stubble heights for those parameters. Herbage mass, DE, ADF, NDF, and TDN were affected by cultivar. Stonewall had greater HM than AG64X8, AG79X9, and Laredo, and Tower of Leaves was also greater than AG79X9 and Laredo. Stonewall had the greatest DE and TDN, while there were no differences between the other cultivars. Stonewall had the least ADF and AG64X8 also had less ADF than Tower of Leaves. Stonewall had lesser NDF than all other cultivars, and there were no differences between other cultivars.
Table 5.
Herbage mass and nutritive value of soybean across two years (2019 and 2020) at the Wiregrass Research and Extension Center in Headland, AL.
In Year 2, row spacing influenced LAI, CP, DE, NDF, and TDN (Table 5). The 36 cm row spacing produced the least LAI, CP, DE, and TDN, while the 72 cm row spacing produced the least NDF. There was an effect of stubble height on HM, CP, DE, ADF, and TDN. Herbage mass was greatest in the 10 cm stubble height and least in the 20 cm stubble height. The 10 cm stubble height produced the least CP, DE, and TDN, and the greatest ADF. There were no differences between the 15 and 20 cm stubble heights for those parameters. All response variables were influenced by the cultivar. Laredo had the least HM. Tower of Leaves was greater than AGS79X9 and AG64X8; Stonewall was greater than AG79X9. While HMs were less, both AG64X8 and AG79X9 had greater LAI than Laredo, Stonewall, and Tower of Leaves. Laredo and AG64X8 had the greatest CP and AG79X9 also had greater CP than Tower of Leaves. Tower of Leaves had the least DE and TDN, and Stonewall also had lesser DE and TDN than Laredo and AG64X8. Tower of Leaves had greater ADF than all other varieties, while Tower of Leaves and Laredo had the greatest NDF.
4. Discussion
The greatest total annual HM seen in the current study was 2449 kg DM ha−1, which was observed in Tower of Leaves at WREC in Year 2. Previously reported HM in alfalfa has ranged from 7700 to 12,600 kg DM ha−1, and HM in perennial peanut has been reported to range from 3450 to 4330 kg DM ha−1 during the establishment year and 5200 to 10,600 kg DM ha−1 for subsequent years [9,11,26]. Differences in HM between locations and years are likely associated with variations in weather conditions, soil type, weed pressure, and planting date. A later planting at EVREC in Year 2 resulted in a 17% decrease in HM compared to Year 1. At WREC, low early-season precipitation combined with elevated weed pressure (approximately 60% cover based on visual rating) resulted in an 82% lower HM in Year 1 compared to Year 2. The greatest HM was harvested at WREC in Year 2, where over half of the plots were able to be harvested twice during the growing season. In the current study, soybean plots did not consistently provide sufficient regrowth to warrant forage harvesting more than once per growing season. Soybean may provide a “short season” crop option for forage growers in the southern region of the U.S. Another useful option for soybean is during years of hay shortage and poor soybean grain performance. Soybean crops which have been planted for grain may potentially be harvested for hay, to provide an “emergency” forage option and recoup some of the losses which would have incurred from a poor grain harvest. Soybean may be a viable forage option in the southern U.S. when considering its moderate HM and nutritive value characteristics. Potential on-farm application of soybean may serve as planting for a hay crop or as an alternative harvest strategy for when grain harvests are not looking promising.
In the current study, HM increase was associated with the 72 cm row spacings at WREC in Year 1, but no differences between row spacings occurred in other years or at EVREC. This differs from previous studies, where Wax and Pendleton [27] and Seiter et al. [5] observed greater HM at narrower row spacings when using grain- and forage-type soybean cultivars grown in Illinois or New Hampshire, respectively. Potential differences between HM responses due to row spacings may be due to a much broader range of row spacings used in the previous studies compared to the current study. Greater HM was associated with the 10 cm stubble height due to more plant material being harvested and the overall lack of regrowth after the first harvest.
The forage cultivars, Stonewall and Tower of Leaves, had 15% greater annual HM than the grain cultivars AG79X9 and AG64X8. Laredo is thought to be the oldest soybean cultivar still in use, dating back to as early as 1915 [15]. Laredo’s average HM production was lower than all other varieties (1169 vs. 1590 kg ha−1). Laredo was slower to germinate than the other cultivars during Year 1 and, therefore, had a poor stand at the time of harvest which further reduced the observed HM. There did not appear to be an effect of cultivar maturity ratings on HM which is likely due to the narrow range of maturity ratings tested in the current study.
The HM harvested in the current study was greater than those reported for other forage soybean cultivars grown in the southern Great Plains [28]. Annual HM was similar to the HM observed for forage soybean cultivars previously studied throughout Alabama [29] and less than forage soybean cultivars grown in Wisconsin at 20 and 76 cm row spacings [6]. Sturkie [29] also found greater HM for Laredo than the current study (4088 and 3283 kg ha−1 for Central and South Alabama, respectively). Differences among the current study and previous studies may potentially be attributed to different soybean cultivars used, as well as differences in climatic conditions among locations. Additionally, maturity at the time of harvest and differences in seeding rates could be a contributing factor in differences in HM.
High LAI did not always correlate with a high HM and vice versa. This may be influenced by the growth habits of the soybean at different locations and years, as well as possible weed presence. These results potentially demonstrate that LAI is not a good indicator of yield in forage soybean. Weber et al. [30] reported an effect of row spacing on LAI of a forage-type soybean grown in the midwestern U.S. In contrast to the current study, Weber et al. [30] found greater LAI was associated with narrower row spacings, whereas the current study had greater LAI in wider row spacings. Differences observed between studies may be associated with the wider range of row spacings used in the previous study compared to the current study (13–102 cm vs. 36–72 cm, respectively), as LAI has been shown to be a function of soybean HM until a particular LAI has been reached [27]. The current study also had lower LAI values than Weber et al. [30], which reported a mean LAI of 4.9 when grain-type soybean was planted at a 51 cm row spacing. There did not appear to be a consistent influence of cultivar on LAI.
Differences in nutritive value responses between locations and years may have been due to factors influencing plant maturity at the time of harvest, including planting date, harvest dates, and the number of harvests, as well as weather conditions and weed pressure. Decreased forage nutritive value during Year 2 at EVREC may have been due to increased forage maturity due to harvesting a month later as a result of the later planting date. Increased CP at EVREC in Year 2 may have also been associated with increased pod biomass and more mature forage. Nutritive value at WREC was slightly less during Year 2 than Year 1 due to greater forage maturity resulting in greater fiber fractions. A possible explanation for this is the contribution of the second harvest in Year 2, which may have resulted in less leaf biomass as the soybean were nearing the end of their growing season.
There was an inconsistent influence from row spacing on nutritive value responses. Row spacing produced opposite responses in nutritive values at EVREC in Year 1 and WREC in Year 2, while it did not affect EVREC in Year 2 or WREC in Year 1. This makes it difficult to determine the influence of row spacing on nutritive value responses. A study conducted by Hintz et al. [6] found no influence of row spacing on nutritive value. Seiter et al. [5], however, did find an effect of row spacing on nutritive value responses. The authors attributed this to an increased stem diameter in wider-spaced rows and observed this in 18 and 36 cm row spacings. It could be hypothesized that a smaller row spacing would have put the plants in separate rows in much closer proximity to each than 36 or 72 cm row spacings did, which may cause differences in observed nutritive value between studies.
Stubble height influenced nutritive value responses at all locations and years. Decreased nutritive value with decreasing stubble heights is likely the result of an increased stem fraction at the shorter stubble heights as compared to the taller heights, increasing overall fiber fractions within the harvested forage. Row spacing had an inconsistent influence on the parameters tested. Future trials to evaluate narrower row spacings, comparable to other annual forage plantings, may provide additional information on forage performance. Stubble height had an inverse relationship with HM, but forage nutritive value was reduced with decreased stubble heights. Forage growers likely need to balance HM with forage quality when deciding on an appropriate stubble height. The 15 cm stubble height appeared to be the best compromise of HM and nutritive value and is likely the ideal cutting height. Due to inconsistencies observed in the current study and the previous literature, further research needs to be done to find the ideal row spacing for forage soybean. Defoliation of soybean under grazing or clipping may produce different responses in forage regrowth; therefore, grazing evaluations should be conducted in the future to determine the promise of soybean in these systems. Because soybean is likely a one-harvest hay crop, additional work should determine appropriate planting date windows and harvest maturity which optimize forage mass and nutritive value.
Maturity rating did not appear to influence nutritive value responses; however, there were some consistent responses of CP and IVDMD among cultivars. Cultivar type appeared to affect CP and IVDMD, where grain cultivars often had a higher CP and IVDMD than forage cultivars. This effect was more pronounced at the EVREC location than WREC, where increased pod biomass likely contributed to greater CP and altered IVDMD response.
Concentrations of CP and ADF by cultivar were intermediate to previously reported values, while NDF was on the lower end of previously observed ranges [6,7]. Soybean nutritive value responses in these studies were likely influenced by plant maturity. Therefore, these differences may be partially attributable to differences in planting dates and maturity at the time of harvest between studies. Concentrations of IVDMD in the current study were greater than those reported in a previous study by Acikgoz et al. [31] on forage soybean cultivars grown in Turkey. This may be attributable to differences in cultivars used; however, it is likely largely due to the previous study using sheep in vivo digestibility, while the current study used an in vitro batch culture fermentation using equine fecal inoculum. The current study is likely the first study to report DE and TDN for horses using soybean. Although the lowest DE and TDN was observed in Tower of Leaves at WREC during Year 2, all soybean cultivars evaluated maintained quality to satisfy the DE requirements of horses with varying maintenance energy requirements when fed at levels below 2% of body weight, and horses in moderate exercise when fed at 2.4% of body weight [22]. These values are also adequate to meet the TDN requirements of a pregnant, dry beef cow during late gestation [23], which demonstrate the potential use of soybean in livestock diets as an alternative forage in the southern region.
5. Conclusions
Soybean appears to be a viable alternative to alfalfa and perennial peanut in livestock production systems. Forage mass observed in soybean was lower than previous reports for the other two species; however, nutritive value responses were similar. Soybean is likely best used as a hay crop in rotation with cool-season annual forages such as small grains or as an emergency summer annual forage when perennial forage crops are not viable.
Author Contributions
Conceptualization, S.L.D. and S.J.T.; methodology, S.L.D. and M.K.M.; validation, L.S.S., C.H. and J.K.; formal analysis, S.J.T. and R.C.C.; data curation, S.J.T. and R.C.C.; writing—original draft preparation, S.J.T., L.S.S. and S.L.D.; writing—review and editing, M.K.M., J.K. and C.H.; supervision, S.L.D.; project administration, S.L.D. and S.J.T.; funding acquisition, S.L.D. All authors have read and agreed to the published version of the manuscript.
Funding
This research was funded by the USDA-NIRA Hatch Project ALA 013-1-18019.
Institutional Review Board Statement
All experimental procedures involving animals were conducted in accordance with the Auburn University Institutional Animal Care and Use Committee (IACUC) protocol 2019-3627.
Data Availability Statement
The data supporting reported results are available on request from the corresponding author.
Acknowledgments
A special thank you to Chris Parker, Shawn Scott, Madison Cole, Sarah Shoup, Mary Sullins, and Megan Griffin for field and laboratory assistance throughout the study. We would also like to acknowledge the late Tom Devine, who provided in-kind support and valuable knowledge for the development of this project.
Conflicts of Interest
The authors declare no conflict of interest.
References
- Flores, A. Perennial Peanut for Quality Pasture and Hay. Agri. Res. 2008, 56, 16–17. [Google Scholar]
- Ren, L.; Bennett, J.A.; Coulman, B.; Jushan, L.; Biligetu, B. Forage yield trend of alfalfa cultivars in the Canadian prairies and its relation to environmental factos and harvest management. Grass Forage Sci. 2021, 76, 390–399. [Google Scholar] [CrossRef]
- Bhattarai, S.; Biswas, D.; Fu, Y.-B.; Biligetu, B. Morphological, Physiological, and Genetic Responses to Salt Stress in Alfalfa: A Review. Agronomy 2020, 10, 577. [Google Scholar] [CrossRef]
- Williams, M.J. Planting date and preplant tillage effects on emergence and survival of rhizoma perennial peanut. Crop. Sci. 1993, 33, 132–136. [Google Scholar] [CrossRef]
- Seiter, S.; Altemose, C.E.; Davis, M.H. Forage soybean yield and quality responses to plant density and row distance. Agron. J. 2004, 96, 966–970. [Google Scholar] [CrossRef]
- Hintz, R.W.; Albrecht, K.A.; Oplinger, E.S. Yield and quality of soybean forage as affected by cultivar and management practices. Agron. J. 1992, 84, 795–798. [Google Scholar] [CrossRef]
- Sheaffer, C.C.; Orf, J.H.; Devine, T.E.; Jewett, J.G. Yield and quality of forage soybean. Agron. J. 2001, 93, 99–106. [Google Scholar] [CrossRef]
- Hoveland, C.S.; Hill, N.S.; Lowrey, R.S.; Fales, S.L.; McCormick, M.E.; Smith, A.E. Steer performance on birdsfoot trefoil and alfalfa pasture in Central Georgia. J. Prod. Agri. 1988, 1, 343–346. [Google Scholar] [CrossRef]
- Terrill, T.H.; Gelaye, S.; Mahotiere, S.; Amoah, E.A.; Miller, S.; Gates, R.N.; Windham, W.R. Rhizoma peanut and alfalfa productivity and nutrient composition in Central Georgia. Agron. J. 1996, 88, 485–488. [Google Scholar] [CrossRef]
- Hernández Garay, A.; Sollenberger, L.E.; Staples, C.R.; Pedreira, C.G.S. ‘Florigraze’ and ‘Arbrook’ rhizoma peanut as pasture for growing Holstein heifers. Crop. Sci. 2004, 44, 1355–1360. [Google Scholar] [CrossRef]
- Mullenix, M.K.; Sollenberger, L.E.; Wallau, M.O.; Blount, A.R.; Vendramini, J.M.B.; Silveira, M.L. Herbage accumulation, nutritive value, and persistence responses of rhizoma peanut cultivars and germplasm to grazing management. Crop. Sci. 2016, 56, 907–915. [Google Scholar] [CrossRef]
- Valencia, E.; Sotomayor-Rios, A.; Torres-Cardona, S. Establishment and effect of cutting interval on yield and nutritive value of rhizoma perennial peanut in northwestern Puerto Rico. J. Agri. Univ. Puerto Rico 1997, 81, 19–30. [Google Scholar]
- Cox, W.J.; Cherney, J.H. Growth and yield responses of soybean to row spacing and seeding rate. Agron. J. 2011, 103, 123–128. [Google Scholar] [CrossRef]
- MacKnown, C.T.; Heitholt, J.J.; Rao, S.C. Agronomic feasibility of a continuous double crop of winter wheat and soybean forage in the Southern Great Plains. Crop Sci. 2006, 47, 1652–1660. [Google Scholar] [CrossRef]
- Laredo Forage Soybean: The Oldest Variety of Soybean Still in Production. Available online: https://www.foragesoybeans.com/templates/__custom/pdfs/Laredo_Soybeans.pdf. (accessed on 15 February 2020).
- Mailhot, D.J.; Dunn, D.G.; Jordan, H., Jr. Georgia 2018 Soybean, Sorghum Grain and Silage, and Summer Annual Forages Performance Tests. 2018. Available online: https://secure.caes.uga.edu/extension/publications/files/pdf/AP%20103-10_1.PDF (accessed on 15 February 2020).
- Weaver, D.B.; Rodriguez-Kabana, R.; Boerma, H.R. Registration of ‘Stonewall’ soybean. Crop. Sci. 1989, 29, 1329. [Google Scholar] [CrossRef]
- Nutrient Recommendations for Alabama Row Crops. Available online: www.aces.edu/wp-content/uploads/2020/06/AlabamaRowCropsPDF_final.pdf (accessed on 26 March 2021).
- Undersander, D.; Mertens, D.R.; Thiex, N. Forage analyses procedures. Natl. Forage Test. Assoc. 1993, 402, 333–7485. Available online: https://Extension.wisc.edu/forage/files/2014/01/NFTA-Forage-Analysis-Procedures.pdf (accessed on 21 March 2020).
- Van Soest, P.J.; Robertson, J.B.; Lewis, B.A. Methods for Dietary Fiber, Neutral detergent fiber, and nonstarch polysaccharides in relation to animal nutrition. J. Dairy Sci. 1991, 74, 3583–3597. [Google Scholar] [CrossRef] [PubMed]
- AOAC. Protein (Crude) Determination in Animal Feed: Copper Catalyst Kjeldahl Method 984.13, 15th ed.; Official Methods of Analysis of AOAC International: Gaitherburg, MD, USA, 1990. [Google Scholar]
- National Research Council. Nutrient Requirements of Horses, 6th ed.; The National Academies Press: Washington, DC, USA, 2007. [Google Scholar]
- National Academies of Sciences, Engineering, and Medicine. Nutrient Requirements of Beef Cattle, 8th ed.; The National Academies Press: Washington, DC, USA, 2016. [Google Scholar]
- Weller, R.A.; Pilgrim, A.F. Passage of protozoa and volatile fatty acids from the rumen of the sheep and from a continuous in vitro fermentation system. Brit. J. Nutri. 1974, 32, 341–351. [Google Scholar] [CrossRef]
- Lattimer, J.M.; Cooper, S.R.; Freeman, D.W.; Lalman, D.L. Effect of yeast culture on in vitro fermentation of a high-concentrate or high-fiber diet using equine fecal inoculum in a Daisy II incubator. J. Anim. Sci. 2007, 85, 2484–2489. [Google Scholar] [CrossRef]
- Mays, D.A.; Evans, E.M. Autumn cutting effects on alfalfa yield and persistence in Alabama. Agron. J. 1973, 65, 290–292. [Google Scholar] [CrossRef]
- Wax, L.M.; Pendleton, J.W. Effect of row spacing on weed control in soybeans. Weed Sci. 1968, 16, 462–465. [Google Scholar] [CrossRef]
- Rao, S.C.; Mayeux, H.S.; Northup, B.K. Performance of forage soybean in the southern Great Plains. Crop. Sci. 2005, 45, 1973–1977. [Google Scholar] [CrossRef]
- Sturkie, D.G. Soybeans (Leaflet No. 2); Alabama Agriculture Experiment Station: Auburn, AL, USA, 1937. [Google Scholar]
- Weber, C.R.; Shibles, R.M.; Byth, D.E. Effect of plant population and row spacing on soybean development and production. Agron. J. 1966, 58, 99–102. [Google Scholar] [CrossRef]
- Acikgoz, E.; Sincik, M.; Oz, M.; Albayrak, S.; Wietgrefe, G.; Turan, Z.; Goksoy, A.; Bilgili, U.; Karasu, A.; Tongel, O.; et al. Forage soybean performance in Mediterranean environments. Field Crop. Res. 2007, 103, 239–247. [Google Scholar] [CrossRef]
Disclaimer/Publisher’s Note: The statements, opinions and data contained in all publications are solely those of the individual author(s) and contributor(s) and not of MDPI and/or the editor(s). MDPI and/or the editor(s) disclaim responsibility for any injury to people or property resulting from any ideas, methods, instructions or products referred to in the content. |
© 2023 by the authors. Licensee MDPI, Basel, Switzerland. This article is an open access article distributed under the terms and conditions of the Creative Commons Attribution (CC BY) license (https://creativecommons.org/licenses/by/4.0/).