Abstract
Biofuels play an important role in the reduction of greenhouse gas emissions, but their production results in greenhouse gases such as nitrous oxide (N2O), mainly from nitrogen (N) fertilization. Brassica carinata (carinata) is an unexplored winter crop in the world’s main cropping areas, with multiple applications (cover crop, jet biofuel, and animal feed, among others). We analyzed a set of on-farm fertilization experiments (2016–2018) in southern South America using quantile regression to establish a baseline for both seed yield (YSEED) and the different components of nitrogen-use efficiency (NUE). Maximum YSEED for the 50th and 90th percentiles ranged from 2.5 to 3.5 Mg ha−1, with a N availability of 150–160 kg ha−1 (soil + fertilization). The NUE ranged from 3 to 13 kg seed per kg of N available. Carinata, in the absence of other limiting factors, had a high N uptake (NUPT) capacity (1.0 to 1.5 kg ha−1 NUPT per kg ha−1 N available [soil + fertilization]). The explored N fertilization rates had no significant influence on oil concentrations (455 to 517 g kg−1) and protein concentrations (192 to 253 g kg−1). The region has a high potential for carinata production, with a high capacity to take up available N.
1. Introduction
In a globalized commodity and energy market with global climate change driven by greenhouse gas (GHG) emissions, new crops in different regions are being explored for their mitigation potential through bioenergy production. This represents an opportunity for the agricultural sector. However, the sector also accounts for about 14% of anthropogenic GHG emissions [1], and it is responsible for 85% of global nitrous oxide (N2O) emissions, mainly from soils (due to nitrification and denitrification processes) [2,3,4]. N2O is a GHG with a global warming potential (GWP) approximately 265–310 times higher than that of CO2. Crop field management (nitrogen fertilizer, crop rotation, tillage, etc.) contributes between 42 and 80% to the total emissions from biofuel feedstock production [5], mainly in the form of N2O emissions, depending on the nitrogen (N) fertilization rate [2,6]. The use of N fertilizers is an essential input to obtain high grain yields from annual crops [7]. However, excessive N application increases potential N2O emissions [1,6]. This tradeoff between sustainable grain and high-quality production and a cascade of environmental concerns has identified higher N use efficiency (NUE) as an essential requirement for bioenergy production based on annual industrial crops [8].
Brassica carinata A. Brown (carinata), known as “Ethiopian Mustard” or “Abyssinian Mustard” [9], is an unexplored winter crop in the world’s main cropping areas, introduced mainly for its oil quality (high proportion of erucic acid, 40–45%) for biofuel production and other industrial applications (e.g., plastics, lubricants, paints, and animal feed) [10,11,12,13,14]. The main regions where carinata research is ongoing are Canada (in the Palliser Triangle of Alberta and Saskatchewan) [15], and the southern region of the USA (Florida, Georgia, Alabama, Tennessee, and Texas) [16]. The average seed yield (YSEED) for these regions ranged from 2500 kg ha−1 [17] to 3500 kg ha−1 [18,19]. The nitrogen fertilization rate affects both carinata YSEED and oil yield (YOIL) [9,18], and it varies between years, zones, and countries [18,20]. In Canada, no optimum N fertilization rate has been found between 0 and 200 kg N ha−1, suggesting that, for this group of trials, higher doses should be added to find a rate at which yields would maximize or begin to plateau [20], whereas in the southern region of the USA, the maximum YSEED was achieved with 102 kg N ha−1 [18]. (In both zones, YSEED ranged between 1700 and 3000 kg ha−1.) The high efficiency of soil N uptake has been highlighted [18,20], which could be an advantage in terms of N2O emissions (less residual N) [21]. Carinata oil concentrations (OC) ranged from 315 to 485 g kg−1, while protein concentrations (PC) ranged from 240 to 360 g kg−1 and, similar to other oilseed crops, carinata had a negative relationship between OC and PC [9,17,20,22], although this relationship depended on the variety [19].
Nitrogen-use efficiency (NUE: YSEED per unit of total N available; NTOTAL = N fertilizer [NFERT] + soil N [NSOIL]) and agronomic efficiency (AEN) ([ΔYSEED] per unit of NFERT [ΔNFERT]) [7] decrease when the NTOTAL increases. NUE values for Brassica crops (B. juncea, B. rapa, and B. napus) range between 14 and 21 kg YSEED/kg NTOTAL, and AEN ranges between 6 and 26 kg YSEED/kg NFERT. Variations in both parameters depend mainly on soil-mineralized N supply, YSEED, and rainfall [20]. Plants respond to total N supply (NTOTAL), which includes both NSOIL and NFERT [23]. On-farm experiments may have different NTOTAL levels due to the local conditions of climate, soil, rotation, and management, thus generating important differences in NUE even though the same species may have been used [24]. To consider soil and plant processes, NUE can be split into two components: (1) N-uptake efficiency (NEUPT), defined as the increment in N uptake (NUPT) by crop per unit of increment in NTOTAL, and (2) N-utilization efficiency (NEUTI), defined as the crop capacity to increment biomass per unit of NUPT [25].
As a new crop in an extensive agricultural system, carinata lacks a N fertilization recommendation, and only a few papers have addressed its nutrient-efficiency parameters. A minimum of S fertilizer could be needed for optimal YSEED and NUE, as it has been reported for wheat [26], maize [27], and oilseed rape (B. napus, B. rapa, B. campestris, and B. juncea) [28]. A N fertilization strategy requires baselines for nutrient-use efficiency components. In the global context, where there is a debate about agricultural contributions to GHG emissions (particularly N2O) and the mitigation potential achievable through bioenergy production, it is important to not only optimize yields, but also to establish benchmark values for the nutrient-use efficiency of biofuel crops. Increasing the proportion of total N inputs that are removed via seeds or biomass could reduce the amount of reactive N in agricultural soils, thus potentially reducing GHG emissions [8]. The main objective of this study was to determine a baseline for NUE and its components under differential N supplies in soils from the agroclimatic zone of southern South America, using a database covering 3 years of on-farm fertilization experiments (2016–2018).
2. Materials and Methods
2.1. Data Collection, Experiments, and Crop Management
The study area is located in the northwestern part of Uruguay. Seven on-farm experiments were conducted during 3 carinata growing seasons: 2016, 2017, and 2018 (three experiments in the first year and two experiments per year in the second and third years). Each site was carefully selected from commercial fields located within a maximum range of 50 km from the Dr. M.A. Cassinoni Experimental Station (32°23′8.12″ S 58°3′47.61″ W; 61 m above sea level), ensuring similar soil and weather conditions. The soils were set to Typic Argiudolls (USDA Soil Taxonomy), which is considered prime agricultural land in this region (25–50 cm superficial layer [A], with 4.6 to 5.2% of organic matter and 24 to 33% of clay, and a pH between 5.8 and 6.0). Trials were conducted on commercial carinata crops, managed under local farmers’ practices, with sowings between 15 May and 15 June at a row spacing of 0.19 m, except for one site in 2018 which was sown at a row spacing of 0.38 m. The harvest was carried out between 28 October and 17 November. All sites were under continuous no-till cropping systems, but with different cropping intensities and crop sequences. The N doses were compared under a nonlimiting supply of P and K. The latter was ensured by applying 46 kg ha−1 of P2O5 (as triple superphosphate) and 60 kg ha−1 of K2O at the sowing date. In all cases, areas with a low emergence rate were avoided, and the genotype used was Avanza 641 (Nuseed), which was the only commercially available genotype in the region at the time of the experiment.
Treatments were a combination of N and S fertilization rates and application times (BBCH 12 and BBCH 30), which resulted in a total of eight treatments, including a control treatment with no N or S fertilization (Table 1). In this study, the application timing was not analyzed. Treatments were established in a randomized complete-block design with three replications. Each plot was 4 m wide and 10 m long. A combination of urea (46-0-0/0) and ammonium sulfate (21-0-0-24) was used as the N and S sources. In all of the cases, fertilizer was broadcast before a rain event. The phenological stages assessed were two true leaves unfolded (BBCH 12), stem elongation begins (BBCH 30), full flowering (BBCH 65), and harvest maturity.

Table 1.
Nitrogen and sulfur fertilization rate by carinata phenological stage.
Composite soil samples were taken by blocks at the beginning of the experiment at two depths (0–0.2 m and 0.2–0.4 m). Samples were dried at 40 °C for 48 h in a fan-forced dehydrator, and then nitrate (N-NO3) [29] and ammonium (N-NH4) content [30] were determined. Aboveground biomass was sampled manually in central rows at harvest maturity (2 m of two adjacent central rows). For the latter, biomass was split into seed and residue. The number of plants harvested was recorded. Aboveground biomass was oven-dried at 60 °C for 72 h. Aboveground dry matter accumulation at harvest (total aboveground biomass: ABTOTAL) and seed yield (YSEED) were expressed per hectare.
OC was determined using a nuclear magnetic resonance spectrometer (Oxford 4000 NMR, Oxford Analytical Instruments Ltd., Abingdon, UK). YOIL was estimated by multiplying YSEED by OC. The harvest index (HI) was estimated as the ratio between YSEED and ABTOTAL at harvest. N concentrations and the total amounts of N uptake were measured in aboveground biomass at harvest (seeds and residues). Each sample was ground and sieved through a 0.1 mm mesh. Aboveground biomass N (g kg−1) and S (g kg−1) concentration were measured using the micro-Kjeldahl method [31]. Total PC was calculated from seed N concentration (g kg−1) by multiplying the empirical factor 6.25 (based on the assumption that the average grain protein content is about 16% N per unit of weight) [32]. N uptake for each treatment was estimated by multiplying aboveground dry matter by nutrient concentration. Total nitrogen uptake (NUPT) at harvest was calculated as the sum of the amounts of nutrients in the ABTOTAL, i.e., residue and seeds.
2.2. Nutrient-Use Efficiency Indices
We estimated NUE parameters by considering the total N supply [25] (NTOTAL = NSOIL + NFERT). NSOIL (kg ha−1) was calculated based on the extractable nitrate (N-NO3−) and ammonium (N-NH4) using soil-sample bulk density, which was estimated from soil texture and soil organic matter [33]. NUE was estimated as YSEED per unit of NTOTAL available (Equation (1)). NUE comprises two main components: (i) N-uptake efficiency (NEUPT), which is the NUPT by crop per unit of NTOTAL (Equation (2)), and (ii) N-utilization efficiency (NEUTI), which is the increase in YSEED per unit of increase in NUPT at maturity (Equation (3)) [25]. In addition, we extended the calculation of NEUTI with two components due to their importance in yield, seed nutrition, and industrial quality: (i) NSEED (g kg−1) and (ii) nitrogen harvest index (NHI) (Equation (4)) [24,34,35,36]. In the second instance, for a more agronomic point of view, we calculated agronomic efficiency (AEN) and apparent N-use (AppNU) [7,37], taking into account only the N fertilized rate (Equations (5)and (6)).
NUE = YSEED/NTOTAL
NEUPT = NUPT/NTOTAL
NEUTI = YSEED/NUPT
NHI = NSEED/(NSEED + N in straw)
AEN = (YSEED/FERT−YSEED/UNFERTILIZER)/NFERT
AppNU = (NUPT_FERT − NUPT_UNFERTILIZED/NFERT) ∗ 100
2.3. Data Analysis
Data was analyzed using generalized linear modeling (GLM) and conditional quantile functions at the 10th, 50th, and 90th percentiles using the quantreg package [38] on the basis of a procedure reported in [39]. Univariate and multivariate models were fitted to evaluate the relationship between the dependent variables (e.g., ABTOTAL, YSEED, NEUTI, and NHI) and the independent variables (e.g., NTOTAL and NUPT), using the nlraa package of R [40,41,42]. Different models were evaluated, including linear quantile regression, linear-plateau, exponential, exponential-plateau, and quadratic-plateau [43] for the 10th, 50th, and 90th percentiles. While the 50th percentile represents the median response, we define the 90th percentile as the benchmark to the maximum of NUE components, and the 10th percentile as NUE limited by factors other than N.
After the quantile regression analysis, goodness-of-fit tests were performed as pseudo-R2, in addition to confidence intervals for each parameter of the models built by bootstrapping [39]. The pseudo-R2 (Rpseud) metric is a local measure of goodness-of-fit at a particular quantile, obtained through weighted deviations from the model of interest, with a model in which only the intercept appears (null model). The presence of unbalanced treatments (different amounts of combinations between factor levels) prevented us from investigating the interactions between N and S. However, as N rates increased, S rates were also increased as a way to prevent S deficiencies. Due to the limited amount of data for each treatment, the quantile regression models were fitted without fitting different models for different treatments, but they visually showed different treatments. Finally, a model was selected based on Rpseud, the distribution of the errors, and the Akaike information criterion (AIC), the latter of which was chosen for the lowest values. Analyses were carried out in R version 1.4.1106 [44].
2.4. Climate Characterization
In the period between the planting and harvesting of the crops in the 2016, 2017, and 2018 seasons, rainfall was 16, 85, and 3% higher, respectively, than the baseline (2002–2015). For the same period, the average temperature was 1 °C and 2 °C below the baseline (2002–2015) for 2016 and 2018, respectively, whereas during 2017, the growing season was 2 °C warmer, particularly during the vegetative period, which shortened the cycle during this phase. In the critical period for YSEED determination (September and October) [45], rainfall in the 2016 and 2017 growing seasons was 35% below the baseline, whereas in 2017, it was 12% above the baseline (Figure 1). The average temperatures for the 2017 and 2018 growing seasons during the critical period for YSEED determination were similar to the baseline (18 °C), whereas in the 2016 growing season, it was 1 °C below the baseline. According to these measurements, and despite the differences between years, all of the growing seasons presented an adequate combination of rainfall and temperature for carinata growth. Between August 20 and the end of October, the period in which flowering and an important part of the critical period of yield determination occurred, the minimum temperature was below 0 °C at only 2 times during 2016, which indicates that frosts were not important during the period of our study.
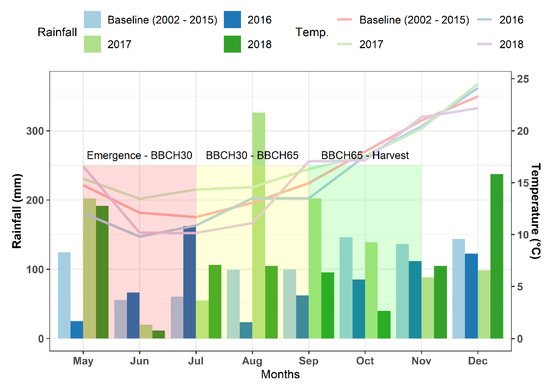
Figure 1.
Total monthly rainfall and average monthly temperatures for the 2016, 2017, and 2018 seasons in relation to the baseline (2002–2015). BBCH30: Beginning of stem elongation of rosette growth; BBCH65: Full flowering: 50% of flowers opened.
3. Results
3.1. Crop Productivity
YSEED ranged from 4.2 Mg ha−1 (Max) to 0.6 Mg ha−1 (Min), with a mean of 2.3 Mg ha−1, and ABTOTAL ranged from 16.7 Mg ha−1 (Max) to 4.3 Mg ha−1 (Min), with a mean of 9.7 Mg ha−1 (Table 2). The OC ranged from 556 g kg−1 (Max) to 438 g kg−1 (Min), with a mean of 488 g kg−1. The PC ranged from 324 g kg−1 (Max) to 186 g kg−1 (Min), with a mean of 224 g kg−1 (Table 2).
Table 2.
Seed yield (YSEED), total aboveground biomass (ABTOTAL), harvest index (HI), protein concentration (PC), and oil concentration (OC) for all of the sites and years evaluated. Mean, standard deviation (SD), maximum (Max) and minimum (Min) values are presented.
3.2. Nitrogen-Use Efficiency
Adequate N (and S) nutrition increased YSEED, reaching a maximum of 2.5 and 3.5 Mg ha−1 YSEED for the 50th and 90th percentiles, respectively (Figure 2a,b, Table S1). Maximum YSEED levels were reached at about 150–160 kg ha−1 of NTOTAL, corresponding to 90–100 kg ha−1 NFERT for the 50th and 90th percentiles (Figure 2a,b, xs in fitted models 1 and 2, Tables S2 and S3). The highest YSEED percentile (90th percentile) was approximately between 1.0 and 1.5 Mg ha−1 above the median (50th percentile), indicating the importance of other factors not associated with N (and S) availability. There was a linear response for the entire supply range of NTOTAL and NFERT in the 10th percentile, indicating that N nutrition can overcome some of the non-N limiting factors (Figure 2a,b, fitted models 1 and 2, Tables S2 and S3). The mean YSEED of the control treatment was 1.5 Mg ha−1 (SD: 0.49 Mg ha−1), indicating the high environmental potential of the region (soil + climate). NUE and AEN (b in fitted models 1 and 2, Tables S2 and S3) ranged between 3 and 13 kg ha−1 YSEED per kg ha−1 NTOTAL available, whereas the 50th percentile presented an intermediate range between 10–12 kg ha−1 YSEED per kg ha−1 NTOTAL. NUE and AEN showed little variation for all percentiles (b parameter). Only the 10th percentile presented a linear response to increases in N availability (NTOTAL and NFERT), with a constant NUE and AEN for the N supply range explored.
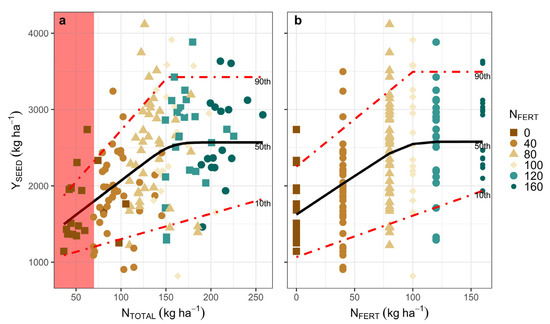
Figure 2.
Quantile regression models fitted to different percentiles relating YSEED in response to NTOTAL (a) and NFERT rate (b). Each data point is a plot on a farm with fertilization treatment. Red zones represent the NSOIL supply in unfertilized plots (control).
3.3. Nitrogen Uptake Efficiency
NEUPT (kg−1 kg−1) decreases with an increase in NTOTAL supply, following the Law of Diminishing Returns (Figure 3a). A similar effect was seen in AppNU (%) for the entire range of NFERT explored (Figure 3b). However, NEUPT and AppNU presented high variability (Figure 3a,b). Carinata presented high NUPT capacity for the entire range of N supply explored (both NTOTAL and NFERT), particularly in the 50th and 90th percentiles (Figure 3a,b). NEUPT was high (1.0 to 1.5 kg ha−1 NUPT per kg ha−1 NTOTAL) for the range of 100 to 150 kg ha−1 NTOTAL, and in the absence of other limiting factors (50th and 90th percentiles) (Figure 3a, fitted model 3, Tables S2 and S3). When considering only the fertilizer effect (NFERT), AppNU (%) was approximately 50% (50th percentile) for all of the NFERT rates explored (Figure 3b, fitted model 4, Tables S2 and S3). However, in the absence of other limiting factors (90th percentile), AppNU (%) was between 80 and 90% of NFERT.
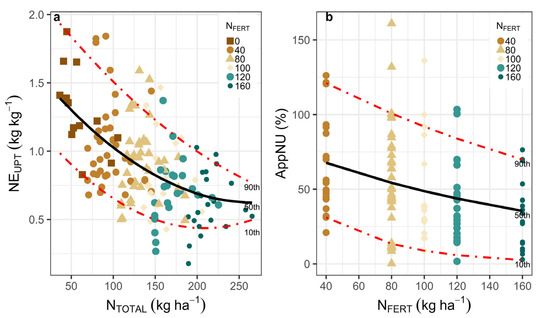
Figure 3.
Quantile regression models fitted to different percentiles relating NEUPT (kg kg−1) in response to NTOTAL (a) and AppNU (%) in response of NFERT (b). Each data point is a plot on a farm with fertilization treatment.
3.4. Nitrogen-Utilization Efficiency
Maximum YSEED was reached at about 160–180 kg ha−1 of NUPT, more than 3 times higher than at low NUPT (Figure 4a, xs in fitted model 5, Tables S2 and S3). At these NUPT values (160–180 kg ha−1), YSEED reached between 3.2 to 3.6 Mg ha−1 for the 50th and 90th percentiles, respectively (Figure 4a). NEUTI ranged between 13 kg YSEED per kg of NUPT (10th percentile) and 16 kg YSEED per kg of NUPT (50th and 90th percentiles), showing slight variations between percentiles (b in the adjusted model 5, Tables S2 and S3). Considering NEUTI as the result of the relationship between two variables (NSEED and NHI), a higher proportion of plant N in the seed is associated with a higher NEUTI, while a higher concentration of N in the seed is associated with a lower NEUTI.
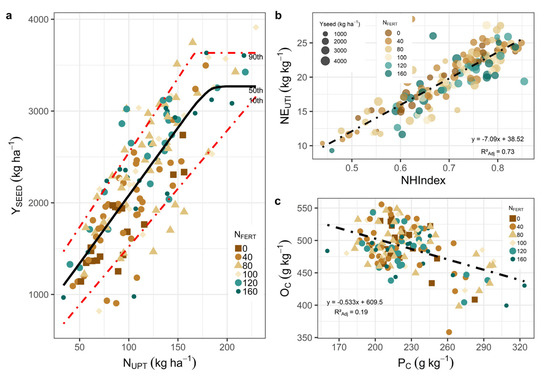
Figure 4.
Quantile regression models fitted to different percentiles relating NUPT (kg ha−1) to YSEED (kg ha−1) (a), relationship between NHI and NEUTI (b), and relationship between PC and OC (c). Each data point is a plot on a farm with fertilization treatment.
We observed that NEUTI increased approximately 7 kg kg−1 for each unit of increase in NHI (p < 0.001) (Figure 4b), with a low association between NHI and YSEED (R2ADJ = 0.02). The relationship between PC and OC was linear and negative (Figure 4c), where OC decreased, 0.53 g kg−1 per unit of PC increased (p < 0.001), but the data showed a high variability in OC, mainly in the range of PC values between 170 and 250 g kg−1 (Figure 4c). For the NFERT range explored, no statistically significant relationship was found with either OC or PC.
4. Discussion
4.1. Productive Characterization: Comparison with Other Regions of the World
Our results showed that in on-farm experiments, average YSEED (2.3 Mg ha−1 +/- 0.6 SD, including control treatments) (Table 2) was equal to or higher than that found in other carinata-producing areas (USA, Canada, Europe, and Ethiopia) [11,12,22,46,47], which is consistent with recent reports on semi-commercial conditions in the region [48]. In the agroclimatic context of Uruguay, the maximum seed yield was 4.2 Mg ha−1 (Table 2), achieving 3.3 Mg ha−1 in the 90th percentile, which is higher than the values reported elsewhere [9,11,49,50,51]. ABTOTAL ranged between 5–16 Mg ha−1, with an average of 10 Mg ha−1 (Table 2), similar to the values reported for high productivity regions such as Minnesota, USA (14 Mg ha−1) under spring sowing [12], and Florida, USA (7 Mg ha−1) with fall sowing [52]. HI had a mean value of 0.23 (0.41–0.08) (Table 2), with minimums lower than those reported for Minnesota (0.28 to 0.37) and Florida (0.30 to 0.34) [12,52]. However, HI is expected to be a parameter with low variation (SD = 0.03, Table 2) in the absence of frost during grain filling [37,53] or with excessive growth and lodging [13], as was the case with the Site “Las Cumbres II” (the only site sown at 0.38 cm row spacing) (Table 2). The mean OC of 488 (SD = 16 g kg−1) (Table 2) and PC of 224 g kg−1 (SD = 15 g kg−1) (Table 2) were higher than in other carinata-producing regions of the world [51]. This implies that, in addition to the higher yield achieved, the production per unit of area of oil and protein is also higher than in other regions (1122 kg oil ha−1 and 500 kg protein ha−1), but it could be even higher if future management practices or improved genetics increase the harvest index.
4.2. Nitrogen-Use Efficiency
Carinata responded to N availability (NTOTAL and NFERT) in agreement with reports from other sites [17,46,52]. To reach maximum YSEED (2.5 to 3.5 Mg ha−1 at the 50th and 90th percentiles, respectively) (Figure 2a,b), an uptake of 150–160 kg ha−1 NTOTAL at harvest was necessary in these experiments. As NSOIL available at the beginning of the experiment was only about 60 kg ha−1 (Figure 2a), N fertilization was a critical component for optimizing the yield in local systems. NFERT rates that maximize YSEED (90–100 kg ha−1 NFERT) were lower or similar to those reported in other locations [9,17,49,51]. However, the attainable YSEED (90th percentile) was higher for our agroecological zone. NUE and AEN varied between 3–13 kg ha−1 YSEED per kg ha−1 NTOTAL (NFERT) available, in concordance with the ranges reported for the USA and Canadian prairies [20,52]. The b parameter (NUE and AEN) for the 50th and 90th percentiles did not differ until the maximum YSEED was reached. This suggests that, in the presence of nutrient (N)-limited YSEED, NUE and AEN remain constant with increasing available N.
However, the parameter a was different for the same percentiles, which suggests the existence of other limiting conditions (non-N or S), implying a higher requirement of N for the same maximum YSEED. At the 10th percentile, both the a and b parameters were statistically different in relation to the other percentiles. A specific study is necessary to determine the cause of low YSEED in this percentile (e.g., soil degradation). Considering the typical parameters of the fitted models (a, b, and xs in Table S3), it becomes evident that a higher YSEED does not necessarily lead to an improvement in NUE. Therefore, it is necessary to identify the factors (e.g., management practices, cropping systems, or breeding) that alter parameters b (higher EUN) and xs (reduced optimum N), and not only their asymptote (parameter a, maximum YSEED).
4.3. Nitrogen Uptake Efficiency
As with other grain crops, NEUPT and AppNU decreased with an increased N supply (NTOTAL and NFERT) (Figure 3a,b, respectively) [24,54]. However, there was great variability in NEUPT and AppNU, likely as a result of different combinations of crop rotations, previous crops, soil conditions, agronomic management, and climatic conditions, which could not be identified using our dataset.
Different NSOIL availabilities resulted in different NTOTAL, even when the same rate of NFERT was used [24]. Therefore, the crop growth rate could have been affected, resulting in changes in NEUPT and AppNU [55]. In the absence of other limitations (50th and 90th percentiles), NTOTAL uptake was above 0.5 kg kg−1 (with maximum values above 1 kg kg−1) for NEUPT and 50% (with maximum values above 100%) for AppNU [22,52]. High N uptake efficiency may be partially explained by N mineralization during the crop cycle (that being ≈30 +/− 3 kg N ha−1 if we only consider the mean difference between NSOIL at the beginning of the experiment and the NUPT of the control treatment), an input that was not considered since only the N available at the beginning of each experiment was considered for the calculations [56]. If we consider this contribution, NEUPT would be 20% lower, but it would still have high values.
The results of our on-farm experiments are in agreement with field and greenhouse experiments in Florida, USA [18]. Carinata has been shown to be efficient in NTOTAL uptake (as a “soil N scavenger”), regardless of soil supply [18]. NEUPT and AppNU were higher than the values reported for on-farm canola [37,57]. NEUPT and AppNU were similar to the values reported by on-farm experiments carried out in our agroecological zone (25–70%) in wheat (Triticum aestivum) (Santa Fe, Argentina) [26]. In our case, the N surplus, considering the fraction of N not absorbed by the crop and N in crop residues, averaged 50 +/− 4 kg N ha−1, an amount that would not scale the N2O emissions [21] even if we did not consider that, in our production systems, another crop would be sown immediately after the harvest of this crop [58,59,60]. Based on our results and previous studies in different regions, it is possible to conclude that carinata could be a useful biofuel feedstock with a low contribution to GHG emissions (N2O emissions) [5,6], with high N uptake, and leaving little N surplus in the soil [21].
4.4. Nitrogen-Utilization Efficiency, Efficiency Components, and Seed Quality
The NUPT range (160–180 kg N ha−1) that maximized YSEED (50th and 90th percentiles) was slightly higher than that reported in North America (USA and Canada) (80–160 kg N ha−1) [18,20]. This may be explained by the higher ABTOTAL accumulated at harvest as compared to other studies (5–16 Mg ha−1) [12,61]. Long-term studies are necessary to determine the impact of “N leakage” that the inclusion of carinata in rotations could have, both in economic and environmental terms, as reported for the southern USA and Canada [20,52]. NEUTI levels found in our on-farm trials (13–16 kg of YSEED per kg−1 NUPT) were in a higher range than those values reported for a greenhouse experiment in Florida, USA (6–9 kg of YSEED per kg−1 NUPT) [52] and for winter and spring oilseed rape in the UK (8–12 kg of YSEED per kg−1 NUPT) [62]. Lower NEUTI values were also found for canola in Australia (≈12.5 kg of YSEED per kg−1 NUPT) [63,64]. In comparison with wheat (a common winter crop in our region), carinata has a lower NEUTI [26]. However, carinata grain, due its oil content, has a higher glucose equivalent than wheat grain in terms of the glucose required for synthesis [65,66]. NEUTI was directly related to NHI and inversely related to NSEED, similar to what has been reported for other crops (e.g., maize) (Figure 4b) [34,35]. We found no clear relationship between NHI (R2ADJ = 0.02) and NSEED (R2ADJ = 0.01) and YSEED (in the explored range of YSEED). These results are contrary to those reported for both cereals (wheat) [67] and brassicas (Brassica napus L.) [68].
The explored NFERT rates did not have a significant influence on the oil or protein concentrations (p > 0.001), unlike that which was reported for the USA (North Florida), Canada (Saskatchewan and Alberta) and northern India [51]. A linear and negative relationship between OC and PC (b = −0.533) (Figure 4c) implied a change of greater magnitude in the protein yield than in the oil yield. However, there was a wide variability between the plots, especially in the range of 170 to 224 g kg−1 PC. Therefore, a greater knowledge of the factors that regulate the concentration and final content of oil and protein in carinata seeds is necessary, for example, climatic conditions during grain filling (water stress, temperature, and supplies of NSOIL and NFERT), genetic factors (varieties vs. hybrids) and management factors (sowing dates).
5. Conclusions
Our work, based on a detailed statistical analysis, allowed us to characterize our agroclimatic zone in the worldwide context of carinata-producing regions, and it provides the first estimation of optimal fertilization rates (90 to 100 kg N ha−1) that maximize YSEED while not compromising NUE. Maximum YSEED ranged from 2.5 to 3.5 Mg ha−1, a significantly high value, considering the current reports and the fact that many management practices must be adjusted. NEUPT was above 0.5 kg kg−1 (with maximum values above 1 kg kg−1) and 50% (with maximum values above 100%) for AppNU, high values that are fundamental to minimizing the residual N and its potential loss by denitrification as GHGs. We reported high OC values and a low association with YSEED, which determines that yield increases are linearly associated with increases in the amount of oil harvested. According to our data, the central region of South America could be a carinata-producing area with high yield potential and high seed quality without compromising the environmental benefit of biofuels.
Supplementary Materials
The following supporting information can be downloaded at: https://www.mdpi.com/article/10.3390/agronomy13020412/s1, Table S1. Nitrogen use efficiency and variability of Brassica carinata A. Braun, constructed from averages for each site per year; Table S2. Summary of goodness-of-fit tests for different efficiency parameters based on the log-likelihood ratio and respective chi-squared tests, and pseudo-R2 measures *; Table S3. Quantile regression models and parameters fitted relating variables of interest for the 10th, 50th and 90th percentile. Values between parentheses are 95% confidence intervals estimated by bootstrap resampling.
Author Contributions
Conceptualization, S.B. and S.R.M.; formal analysis, S.B.; funding acquisition, S.R.M.; investigation, S.R.M.; project administration, S.R.M.; writing—original draft preparation, S.B.; writing—review and editing, O.R.E. and S.R.M. All authors have read and agreed to the published version of the manuscript.
Funding
This research was funded by the company UPM Biofuels.
Data Availability Statement
Not applicable.
Acknowledgments
The contributions of Darío Fros and Federico Dominguez were essential for the fieldwork. The information collected was part of the final degree work of Renzo Galeano, Francisco Terzaghi, Nicolás Borrone, Marcelo Rodríguez, Francisco Della Santa, Juan Uhlig, and Ignacio Vivo.
Conflicts of Interest
The authors declare no conflict of interest.
References
- Del Grosso, S.J.; Ojima, D.S.; Parton, W.J.; Stehfest, E.; Heistemann, M.; DeAngelo, B.; Rose, S. Global Scale DAYCENT Model Analysis of Greenhouse Gas Emissions and Mitigation Strategies for Cropped Soils. Glob. Planet. Chang. 2009, 67, 44–50. [Google Scholar] [CrossRef]
- Crutzen, P.J.; Mosier, A.R.; Smith, K.A.; Winiwarter, W. N2O Release from Agro-Biofuel Production Negates Global Warming Reduction by Replacing Fossil Fuels. Atmos. Chem. Phys. 2008, 8, 389–395. [Google Scholar] [CrossRef]
- Del Grosso, S.; Parton, W.; Stohlgren, T.; Zheng, D.; Bachelet, D.; Prince, S.; Hibbard, K.; Olson, R. Global Potential Net Primary Production Predicted from Vegetation Class, Precipitation, and Temperature. Ecology 2008, 89, 2117–2126. [Google Scholar] [CrossRef]
- Cameron, K.C.; Di, H.J.; Moir, J.L. Nitrogen Losses from the Soil/Plant System: A Review. Ann. Appl. Biol. 2013, 162, 145–173. [Google Scholar] [CrossRef]
- Adler, P.R.; Del Grosso, S.J.; Parton, W.J. Life-Cycle Assessment of Net Greenhouse-Gas Flux for Bioenergy Cropping Systems. Ecol. Appl. 2007, 17, 675–691. [Google Scholar] [CrossRef]
- Ogle, S.M.; McCarl, B.A.; Baker, J.; Del Grosso, S.J.; Adler, P.R.; Paustian, K.; Parton, W.J. Managing the Nitrogen Cycle to Reduce Greenhouse Gas Emissions from Crop Production and Biofuel Expansion. Mitig. Adapt. Strateg. Glob. Chang. 2016, 21, 1197–1212. [Google Scholar] [CrossRef]
- Dobermann, A.R. Nitrogen Use Efficiency—State of the Art. Agron. Hortic. Fac. Publ. 2005, 316, 17. [Google Scholar]
- Cassman, K.G.; Dobermann, A.; Walters, D.T. Agroecosystems, Nitrogen-Use Efficiency, and Nitrogen Management. Ambio 2002, 31, 132–140. [Google Scholar] [CrossRef]
- Hossain, Z.; Johnson, E.N.; Blackshaw, R.E.; Liu, K.; Kapiniak, A.; Gampe, C.; Molnar, L.; Luan, L.; Poppy, L.; Gan, Y. Agronomic Responses of Brassica Carinata to Herbicide, Seeding Rate, and Nitrogen on the Northern Great Plains. Crop Sci. 2018, 58, 2633–2643. [Google Scholar] [CrossRef]
- Bouaid, A.; Diaz, Y.; Martinez, M.; Aracil, J. Pilot Plant Studies of Biodiesel Production Using Brassica Carinata as Raw Material. Catal. Today 2005, 106, 193–196. [Google Scholar] [CrossRef]
- Cardone, M.; Mazzoncini, M.; Menini, S.; Rocco, V.; Senatore, A.; Seggiani, M.; Vitolo, S. Brassica Carinata as an Alternative Oil Crop for the Production of Biodiesel in Italy: Agronomic Evaluation, Fuel Production by Transesterification and Characterization. Biomass Bioenergy 2003, 25, 623–636. [Google Scholar] [CrossRef]
- Gesch, R.W.; Isbell, T.A.; Oblath, E.A.; Allen, B.L.; Archer, D.W.; Brown, J.; Hatfield, J.L.; Jabro, J.D.; Kiniry, J.R.; Long, D.S.; et al. Comparison of Several Brassica Species in the North Central U.S. for Potential Jet Fuel Feedstock. Ind. Crops Prod. 2015, 75, 2–7. [Google Scholar] [CrossRef]
- Hossain, Z.; Johnson, E.N.; Wang, L.; Blackshaw, R.E.; Gan, Y. Comparative Analysis of Oil and Protein Content and Seed Yield of Five Brassicaceae Oilseeds on the Canadian Prairie. Ind. Crops Prod. 2019, 136, 77–86. [Google Scholar] [CrossRef]
- Xin, H.; Yu, P. Rumen Degradation, Intestinal and Total Digestion Characteristics and Metabolizable Protein Supply of Carinata Meal (a Non-Conventional Feed Resource) in Comparison with Canola Meal. Anim. Feed Sci. Technol. 2014, 191, 106–110. [Google Scholar] [CrossRef]
- Marillia, E.F.; Francis, T.; Falk, K.C.; Smith, M.; Taylor, D.C. Palliser’s Promise: Brassica Carinata, An Emerging Western Canadian Crop for Delivery of New Bio-Industrial Oil Feedstocks. Biocatal. Agric. Biotechnol. 2014, 3, 65–74. [Google Scholar] [CrossRef]
- Seepaul, R.; Small, I.M.; Mulvaney, M.J.; George, S.; Leon, R.G.; Geller, D.; Wright, D.L. Carinata, the Sustainable Crop for a Bio-Based Economy: 2018–2019 Production Recommendations for the Southeastern United States. University of Florida, IFAS Ext. 2019, 1–12. Available online: https://sparc-cap.org/wp-content/uploads/2020/06/2018-19-Production-Guide.pdf (accessed on 15 December 2022).
- Pan, X.; Caldwell, C.D.; Falk, K.C.; Lada, R. The Effect of Cultivar, Seeding Rate and Applied Nitrogen on Brassica Carinata Seed Yield and Quality in Contrasting Environments. Can. J. Plant Sci. 2012, 92, 961–971. [Google Scholar] [CrossRef]
- Seepaul, R.; Marois, J.; Small, I.M.; George, S.; Wright, D.L. Carinata Dry Matter Accumulation and Nutrient Uptake Responses to Nitrogen Fertilization. Agron. J. 2019, 111, 2038–2046. [Google Scholar] [CrossRef]
- Zanetti, F.; Vamerali, T.; Mosca, G. Yield and Oil Variability in Modern Varieties of High-Erucic Winter Oilseed Rape (Brassica napus L. Var. Oleifera) and Ethiopian Mustard (Brassica Carinata A. Braun) under Reduced Agricultural Inputs. Ind. Crops Prod. 2009, 30, 265–270. [Google Scholar] [CrossRef]
- Johnson, E.N.; Malhi, S.S.; Hall, L.M.; Phelps, S. Effects of Nitrogen Fertilizer Application on Seed Yield, N Uptake, N Use Efficiency, and Seed Quality of Brassica Carinata. Can. J. Plant Sci. 2013, 93, 1073–1081. [Google Scholar] [CrossRef]
- van Groenigen, J.W.; Velthof, G.L.; Oenema, O.; Van Groenigen, K.J.; Van Kessel, C. Towards an Agronomic Assessment of N2O Emissions: A Case Study for Arable Crops. Eur. J. Soil Sci. 2010, 61, 903–913. [Google Scholar] [CrossRef]
- Mulvaney, M.J.; Leon, R.G.; Seepaul, R.; Wright, D.L.; Hoffman, T.L. Brassica Carinata Seeding Rate and Row Spacing Effects on Morphology, Yield, and Oil. Agron. J. 2019, 111, 528–535. [Google Scholar] [CrossRef]
- Hirel, B.; Le Gouis, J.; Ney, B.; Gallais, A. The Challenge of Improving Nitrogen Use Efficiency in Crop Plants: Towards a More Central Role for Genetic Variability and Quantitative Genetics within Integrated Approaches. J. Exp. Bot. 2007, 58, 2369–2387. [Google Scholar] [CrossRef]
- Lemaire, G.; Ciampitti, I. Crop Mass and n Status as Prerequisite Covariables for Unraveling Nitrogen Use Efficiency across Genotype-by-Environment-by-Management Scenarios: A Review. Plants 2020, 9, 1309. [Google Scholar] [CrossRef]
- Moll, R.H.; Kamprath, E.J.; Jackson, W.A. Analysis and Interpretation of Factors Which Contribute to Efficiency of Nitrogen Utilization 1. Agron. J. 1982, 74, 562–564. [Google Scholar] [CrossRef]
- Salvagiotti, F.; Castellarín, J.M.; Miralles, D.J.; Pedrol, H.M. Sulfur Fertilization Improves Nitrogen Use Efficiency in Wheat by Increasing Nitrogen Uptake. Field Crops Res. 2009, 113, 170–177. [Google Scholar] [CrossRef]
- Carciochi, W.D.; Sadras, V.O.; Pagani, A.; Ciampitti, I.A. Co-Limitation and Stoichiometry Capture the Interacting Effects of Nitrogen and Sulfur on Maize Yield and Nutrient Use Efficiency. Eur. J. Agron. 2020, 113, 125973. [Google Scholar] [CrossRef]
- Grant, C.A.; Mahli, S.S.; Karamanos, R.E. Sulfur Management for Rapeseed. Field Crops Res. 2012, 128, 119–128. [Google Scholar] [CrossRef]
- Gelderman, R.H.; Beegle, D. Nitrate-Nitrogen. In Recommended Chemical Soil Test Procedures for the North Central Region. North Central Reg. Res. Publ. 2011, 221, 73. [Google Scholar]
- Rhine, E.D.; Mulvaney, R.L.; Pratt, E.J.; Sims, G.K. Improving the Berthelot Reaction for Determining Ammonium in Soil Extracts and Water. Soil Sci. Soc. Am. J. 1998, 62, 473–480. [Google Scholar] [CrossRef]
- Nelson, D.W.; Sommers, L.E. Determination of Total Nitrogen in Plant Material 1. Agron. J. 1973, 65, 109–112. [Google Scholar] [CrossRef]
- FAO (Organizacion de las Naciones Unidas para la Alimentación y la Agricultura). Food Energy—Methods of Analysis and Conversion Factors; Fao Food And Nutrition Paper 77; FAO: Rome, Italy, 2003. [Google Scholar]
- Saxton, K.E.; Rawls, W.J. Soil Water Characteristic Estimates by Texture and Organic Matter for Hydrologic Solutions. Soil Sci. Soc. Am. J. 2006, 70, 1569–1578. [Google Scholar] [CrossRef]
- Caviglia, O.P.; Melchiori, R.J.M.; Sadras, V.O. Nitrogen Utilization Efficiency in Maize as Affected by Hybrid and N Rate in Late-Sown Crops. Field Crops Res. 2014, 168, 27–37. [Google Scholar] [CrossRef]
- Ciampitti, I.A.; Vyn, T.J. Physiological Perspectives of Changes over Time in Maize Yield Dependency on Nitrogen Uptake and Associated Nitrogen Efficiencies: A Review. Field Crops Res. 2012, 133, 48–67. [Google Scholar] [CrossRef]
- Sadras, V.O. The N:P Stoichiometry of Cereal, Grain Legume and Oilseed Crops. Field Crops Res. 2006, 95, 13–29. [Google Scholar] [CrossRef]
- Rathke, G.W.; Behrens, T.; Diepenbrock, W. Integrated Nitrogen Management Strategies to Improve Seed Yield, Oil Content and Nitrogen Efficiency of Winter Oilseed Rape (Brassica napus L.): A Review. Agric. Ecosyst. Environ. 2006, 117, 80–108. [Google Scholar] [CrossRef]
- Koenker, R. Quantile Regression; Cambridge University Press: Cambridge, UK, 2005. [Google Scholar] [CrossRef]
- Rotundo, J.L.; Cipriotti, P.A. Biological Limits on Nitrogen Use for Plant Photosynthesis: A Quantitative Revision Comparing Cultivated and Wild Species. New Phytol. 2017, 214, 120–131. [Google Scholar] [CrossRef]
- Yin, X.; Goudriaan, J.; Lantinga, E.A.; Vos, J.; Spiertz, H.J. A Flexible Sigmoid Function of Determinate Growth. Ann. Bot. 2003, 91, 361–371. [Google Scholar] [CrossRef]
- Archontoulis, S.V.; Miguez, F.E. Nonlinear Regression Models and Applications in Agricultural Research. Agron. J. 2015, 107, 786–798. [Google Scholar] [CrossRef]
- Oddi, F.J.; Miguez, F.E.; Ghermandi, L.; Bianchi, L.O.; Garibaldi, L.A. A Nonlinear Mixed-Effects Modeling Approach for Ecological Data: Using Temporal Dynamics of Vegetation Moisture as an Example. Ecol. Evol. 2019, 9, 10225–10240. [Google Scholar] [CrossRef]
- Archontoulis, S.V.; Miguez, F.E.; Moore, K.J. A Methodology and an Optimization Tool to Calibrate Phenology of Short-Day Species Included in the APSIM PLANT Model: Application to Soybean. Environ. Model. Softw. 2014, 62, 465–477. [Google Scholar] [CrossRef]
- Andy Bunn, M.K. A Language and Environment for Statistical Computing; R Foundation for Statistical Computing: Vienna, Austria, 2017; Volume 10, pp. 11–18. ISBN 3-900051-07-0. [Google Scholar]
- Kirkegaard, J.A.; Lilley, J.M.; Brill, R.D.; Ware, A.H.; Walela, C.K. The Critical Period for Yield and Quality Determination in Canola (Brassica napus L.). Field Crops Res. 2018, 222, 180–188. [Google Scholar] [CrossRef]
- Alberti, P.; Osborne, S.; Mathew, F.; Ali, S.; Sieverding, H.; Kumar, S.; Nleya, T. Nitrogen Requirements of Ethiopian Mustard for Biofuel Feedstock in South Dakota. Agron. J. 2019, 111, 1304–1311. [Google Scholar] [CrossRef]
- Tadesse, T.; Yeshealem, B.; Assefa, A.; Liben, M. Influence of Seed Rate and Leaf Topping on Seed Yield, Oil Content and Economic Returns of Ethiopian Mustard (Brassica Carinata). Pakistan J. Agric. Sci. 2012, 49, 237–242. [Google Scholar]
- Mazzilli, S.R.; Barrios, P.G.; Ernst, O.R. Use of Sludge from Pulp Mills in Extensive Crops: An Assessment at a Semi-Commercial Scale in Central South America. Agrosyst. Geosci. Environ. 2022, 5, 1–14. [Google Scholar] [CrossRef]
- Bhattarai, D.; Kumar, S.; Nleya, T. Nitrogen and Sulfur Fertilizers Effects on Growth and Yield of Brassica Carinata in South Dakota. Agron. J. 2021, 113, 1945–1960. [Google Scholar] [CrossRef]
- Gesch, R.W.; Long, D.S.; Palmquist, D.; Allen, B.L.; Archer, D.W.; Brown, J.; Davis, J.B.; Hatfield, J.L.; Jabro, J.D.; Kiniry, J.R.; et al. Agronomic Performance of Brassicaceae Oilseeds in Multiple Environments Across the Western USA. Bioenergy Res. 2019, 12, 509–523. [Google Scholar] [CrossRef]
- Seepaul, R.; Kumar, S.; Iboyi, J.E.; Bashyal, M.; Stansly, T.L.; Bennett, R.; Boote, K.J.; Mulvaney, M.J.; Small, I.M.; George, S.; et al. Brassica Carinata: Biology and Agronomy as a Biofuel Crop. GCB Bioenergy 2021, 13, 582–599. [Google Scholar] [CrossRef]
- Seepaul, R.; Small, I.M.; Marois, J.; George, S.; Wright, D.L. Brassica Carinata and Brassica napus Growth, Nitrogen Use, Seed, and Oil Productivity Constrained by Post-Bolting Nitrogen Deficiency. Crop Sci. 2019, 59, 2720–2732. [Google Scholar] [CrossRef]
- Betti, G.; Edwards, T.; Biddulph, B.; Davies, S.; Van Burgel, A.; Hall, D.; Turner, C. Reduced frost damage on crops after strategic deep tillage—evidence from field experiments in western australia. In Proceedings of the 2019 Australian Agronomy Conference, Wagga Wagga, Australia, 25–29 August 2019; pp. 1–4. [Google Scholar]
- Milroy, S.P.; Wang, P.; Sadras, V.O. Defining Upper Limits of Nitrogen Uptake and Nitrogen Use Efficiency of Potato in Response to Crop N Supply. Field Crops Res. 2019, 239, 38–46. [Google Scholar] [CrossRef]
- Gastal, F.; Lemaire, G. N Uptake and Distribution in Crops: An Agronomical and Ecophysiological Perspective. J. Exp. Bot. 2002, 53, 789–799. [Google Scholar] [CrossRef]
- Vigil, M.F.; Eghball, B.; Cabrera, M.L.; Jakubowski, B.R.; Davis, J.G. Accounting for Seasonal Nitrogen Mineralization: An Overview. J. Soil Water Conserv. 2002, 57, 17. [Google Scholar]
- Rathke, G.W.; Christen, O.; Diepenbrock, W. Effects of Nitrogen Source and Rate on Productivity and Quality of Winter Oilseed Rape (Brassica napus L.) Grown in Different Crop Rotations. Field Crops Res. 2005, 94, 103–113. [Google Scholar] [CrossRef]
- Mazzilli, S.R.; Ernst, O.R.; de Mello, V.P.; Pérez, C.A. Yield Losses on Wheat Crops Associated to the Previous Winter Crop: Impact of Agronomic Practices Based on on-Farm Analysis. Eur. J. Agron. 2016, 75, 99–104. [Google Scholar] [CrossRef]
- Ernst, O.R.; Kemanian, A.R.; Mazzilli, S.R.; Cadenazzi, M.; Dogliotti, S. Depressed Attainable Wheat Yields under Continuous Annual No-till Agriculture Suggest Declining Soil Productivity. Field Crops Res. 2016, 186, 107–116. [Google Scholar] [CrossRef]
- Rizzo, G.; Mazzilli, S.R.; Ernst, O.; Baethgen, W.E.; Berger, A.G.; Investigaci, I.N. De Season-Specific Management Strategies for Rainfed Soybean in the South American Pampas Based on a Seasonal Precipitation Forecast. Agric. Syst. 2022, 196, 103331. [Google Scholar] [CrossRef]
- Kumar, S.; Seepaul, R.; Small, I.M.; George, S.; O’brien, G.K.; Marois, J.J.; Wright, D.L. Interactive Effects of Nitrogen and Sulfur Nutrition on Growth, Development, and Physiology of Brassica Carinata a. Braun and Brassica napus L. Sustainability 2021, 13, 7355. [Google Scholar] [CrossRef]
- Sylvester-Bradley, R.; Kindred, D.R. Analysing Nitrogen Responses of Cereals to Prioritize Routes to the Improvement of Nitrogen Use Efficiency. J. Exp. Bot. 2009, 60, 1939–1951. [Google Scholar] [CrossRef]
- Norton, R.M. Nitrogen Management to Optimise Canola Production in Australia. Crop. Pasture Sci. 2016, 67, 419–438. [Google Scholar] [CrossRef]
- Riar, A.; Gill, G.; McDonald, G.K. Rate of Nitrogen Rather than Timing of Application Influence Yield and NUE of Canola in South Australian Mediterranean Environments. Agronomy 2020, 10, 1505. [Google Scholar] [CrossRef]
- Andrade, F.H. Analysis of Growth and Yield of Maize, Sunflower and Soybean Grown at Balcarce, Argentina. Field Crops Res. 1995, 41, 1–12. [Google Scholar] [CrossRef]
- De Vries, F.W.T.P.; Brunsting, A.H.M.; Van Laar, H.H. Products, Requirements and Efficiency of Biosynthesis a Quantitative Approach. J. Theor. Biol. 1974, 45, 339–377. [Google Scholar] [CrossRef] [PubMed]
- Acreche, M.M.; Slafer, G.A. Variation of Grain Nitrogen Content in Relation with Grain Yield in Old and Modern Spanish Wheats Grown under a Wide Range of Agronomic Conditions in a Mediterranean Region. J. Agric. Sci. 2009, 147, 657–667. [Google Scholar] [CrossRef]
- Stahl, A.; Friedt, W.; Wittkop, B.; Snowdon, R.J. Complementary Diversity for Nitrogen Uptake and Utilisation Efficiency Reveals Broad Potential for Increased Sustainability of Oilseed Rape Production. Plant Soil 2016, 400, 245–262. [Google Scholar] [CrossRef]


Disclaimer/Publisher’s Note: The statements, opinions and data contained in all publications are solely those of the individual author(s) and contributor(s) and not of MDPI and/or the editor(s). MDPI and/or the editor(s) disclaim responsibility for any injury to people or property resulting from any ideas, methods, instructions or products referred to in the content. |
© 2023 by the authors. Licensee MDPI, Basel, Switzerland. This article is an open access article distributed under the terms and conditions of the Creative Commons Attribution (CC BY) license (https://creativecommons.org/licenses/by/4.0/).