Article

Critical Factors Affecting Water and Nitrogen Losses from Sloping Farmland during the Snowmelt Process

1
State Key Laboratory of Water Resources and Hydropower Engineering Science, Wuhan University, Wuhan 430072, China
2
Liaoning River and Reservoir Management Service Center, Liaoning Hydrological Bureau, Shenyang 110003, China
*
Author to whom correspondence should be addressed.
These authors contributed equally to this work.
Agronomy 2023, 13(2), 350; https://doi.org/10.3390/agronomy13020350
Submission received: 27 December 2022 / Revised: 23 January 2023 / Accepted: 24 January 2023 / Published: 26 January 2023
(This article belongs to the Special Issue Nitrogen Cycle in Farming Systems)

Abstract

:
Water and nitrogen losses from farmland during the snowmelt process play a vital role in water and nitrogen management in cold regions. To explore the mechanisms and factors contributing to water and nitrogen loss from different sloping farmlands during the snowmelt period, field experiments were conducted under two slope treatments (8° and 15°), two soil water content (SWC) treatments, and two snow water equivalent (SWE) (5 mm and 10 mm) treatments in a seasonal freezing agricultural watershed of Northeast China. The results showed that during the snowmelt process, SWE was the most important factor affecting water and nitrogen production through the surface and total runoff of the sloping farmland, followed by the slope. The water and nitrogen yield in the high snow (HS) treatments ranged from 1.76 to 8.15 and 1.65 to 12.62 times higher than those in the low snow (LS) treatments. The generation of nitrogen was advanced compared with that of water induced by the preferential production of nitrogen. A higher slope promoted this preferential production function of nitrogen. Enhanced infiltration combined with the preferential yield of nitrogen resulted in a greatly decreased yield of water and nitrogen in the gentle slope and LS (GS_LS) treatments. These findings are valuable for accurately describing the water and nitrogen cycling in seasonally freezing sloping farmland.

1. Introduction

Nonpoint nitrogen losses from farmland play a vital role in the degeneration of soil and aquatic ecosystems [1,2,3]. Snowmelt is a key factor in driving nitrogen export from farmland in seasonal freezing agricultural watersheds [4,5]. Exploring the critical factors affecting water and nitrogen losses from farmland during the snowmelt process is of great value to the management of water resources and nitrogen application in these regions.
The factors affecting water and nitrogen losses during the snowmelt process can be grouped into factors affecting water and nitrogen sources and sinks and factors affecting their migration paths [6,7,8,9]. For instance, irrigation and autumn rain can increase the soil water content [10,11], and the temperature potential during the freezing period drives this water upward to the surface soil [12]. The higher water content in the frozen soil significantly decreases the soil infiltration capacity and increases the runoff coefficient [8,13]. The amount of snowmelt [14], snowfall/total precipitation ratio [3], occurrence of rain on snow events [15], and temperature rise events during winter can greatly influence the surface water storage form (liquid water, snow or ice) before snowmelt [16], which determines the release quantity and rate of water supplied to water generation. Moreover, the refreezing of snowmelt water can form basal ice below the snow cover [17], which can greatly enhance the snowmelt water yield [18]. The melting of frozen soil changes flow paths and depression storage losses [19] and influences the partitioning of snowmelt water into surface runoff, subsurface runoff, and groundwater [20].
For nitrogen, fertilization during the plant growing season increases the soil nitrogen content. The freezing-thawing processes in late autumn and early winter can affect soil nitrogen content by changing the soil’s physical (aggregate destruction, anaerobic and aerobic environment alternation) [21,22], chemical (salinity, pH) [23], and biological (structure, quantity, diversity, and activity of soil microbial communities) properties [24,25]. Together with the higher atmospheric nitrogen deposition induced by snow accumulation [26], and the reduced nitrogen loss caused by the decreased runoff generation [27], there exists a higher risk of excess nitrogen export during the snowmelt process.
Sloping farmlands exist widely in seasonal freezing regions. These farmlands are mostly cultivated with rain-fed crops, in which the overapplied nitrogen fertilizer easily accumulates in the soil due to the lack of infiltration and runoff generation processes during the fallow period [28]. On the other hand, these sloping farmlands more easily accumulate snow because of wind-drifting snow [29]. As a result, these areas always contribute most of the water and nitrogen export during the snowmelt process because of shorter access to the river and the easily occurring “flushing effect” [4,5]. Many studies have been carried out to study the factors affecting snowmelt-induced water and nitrogen export from sloping fields. For instance, Harms et al. [30] found that the slope aspect had a major influence on soil temperature and moisture, and south-facing slopes produced the earliest snowmelt but yielded the least amount of runoff. Hinckley et al. [31] discovered that snowmelt events that occurred on south-facing slopes quickly transported soil nitrogen into aquatic systems compared with north-facing slopes. Zhao et al. [5] conducted a watershed monitoring experiment in an agricultural watershed and found that nitrogen was mostly flushed into rivers by water from steeper areas (>6°) and lower slope areas (<2°) along the river, which consumed snowmelt water and nitrogen through depression and retention storage. However, these studies were mostly conducted at the watershed or hill scale, and the influencing factors were unmanageable [5,30,31]. Thus, their conclusions were mostly gained from qualitative analysis, lacking quantitative and statistical results [31]. Control experiments researching the water and nitrogen losses from sloping farmland during snowmelt are still rare.
In this study, we hypothesized that slope, soil water content (SWC), and the snow water equivalent (SWE) were the main factors affecting water and nitrogen exports from sloping farmlands during the snowmelt. Additionally, conducted the field experiments that explored the processes of runoff and nitrogen loss on different treatments of these factors, and identified the controlling factors affecting water and nitrogen generation, amount, and division in surface and subsurface runoff.

2. Materials and Methods

2.1. Experimental Site Description

The study site was located in Shuangyang District (43°21′ N, 125°37′ E), Changchun, Jilin Province, China (Figure 1). Shuangyang is dominated by a humid continental climate, with a mean annual temperature of 4.8 °C and precipitation of 624.7 mm, of which 50 mm occurs in the form of snow. The freezing period begins in the middle of November and lasts until early March of the next year. The lowest temperature and deepest soil frozen depth ever recorded were −36.5 °C and 158 cm, respectively. Six soil samples (0–20 cm) were randomly collected on the slope to identify their soil texture. The soil was loam, with 4.18% clay (<0.002 mm), 44.52% silt (0.020–0.002 mm), and 51.31% sand (>0.020 mm). The soil bulk density was measured by the cutting ring method and was 1.41 g·cm−3 on average [32].

2.2. Sloping Farmland Preparation

As shown in Figure 1, the experimental plots were established in the sloping maize land, of which the upper half had an average slope of 15° and the lower half had an average slope of 8°. The whole field was set up with eight plots with an area of 2.4 m × 7.0 m, and a 0.6 m wide path was reserved between each pair of plots as a sidewalk. The experimental plots were surrounded by high-density polyethylene (HDP) film, and each plot was divided into three identical test areas (0.8 m × 7.0 m) using HDP film as replicates in a treatment. The HDP film around and in the plots was placed 30 cm below and above the soil surface to prevent the interaction of the surface or subsurface flow from each test area and plot. At the end of each test area, three ‘L’-shaped stainless steel tanks were embedded in the soil at depths of 0 cm, 5 cm, and 10 cm to collect and measure surface runoff and subsurface flow.

2.3. Experimental Methods

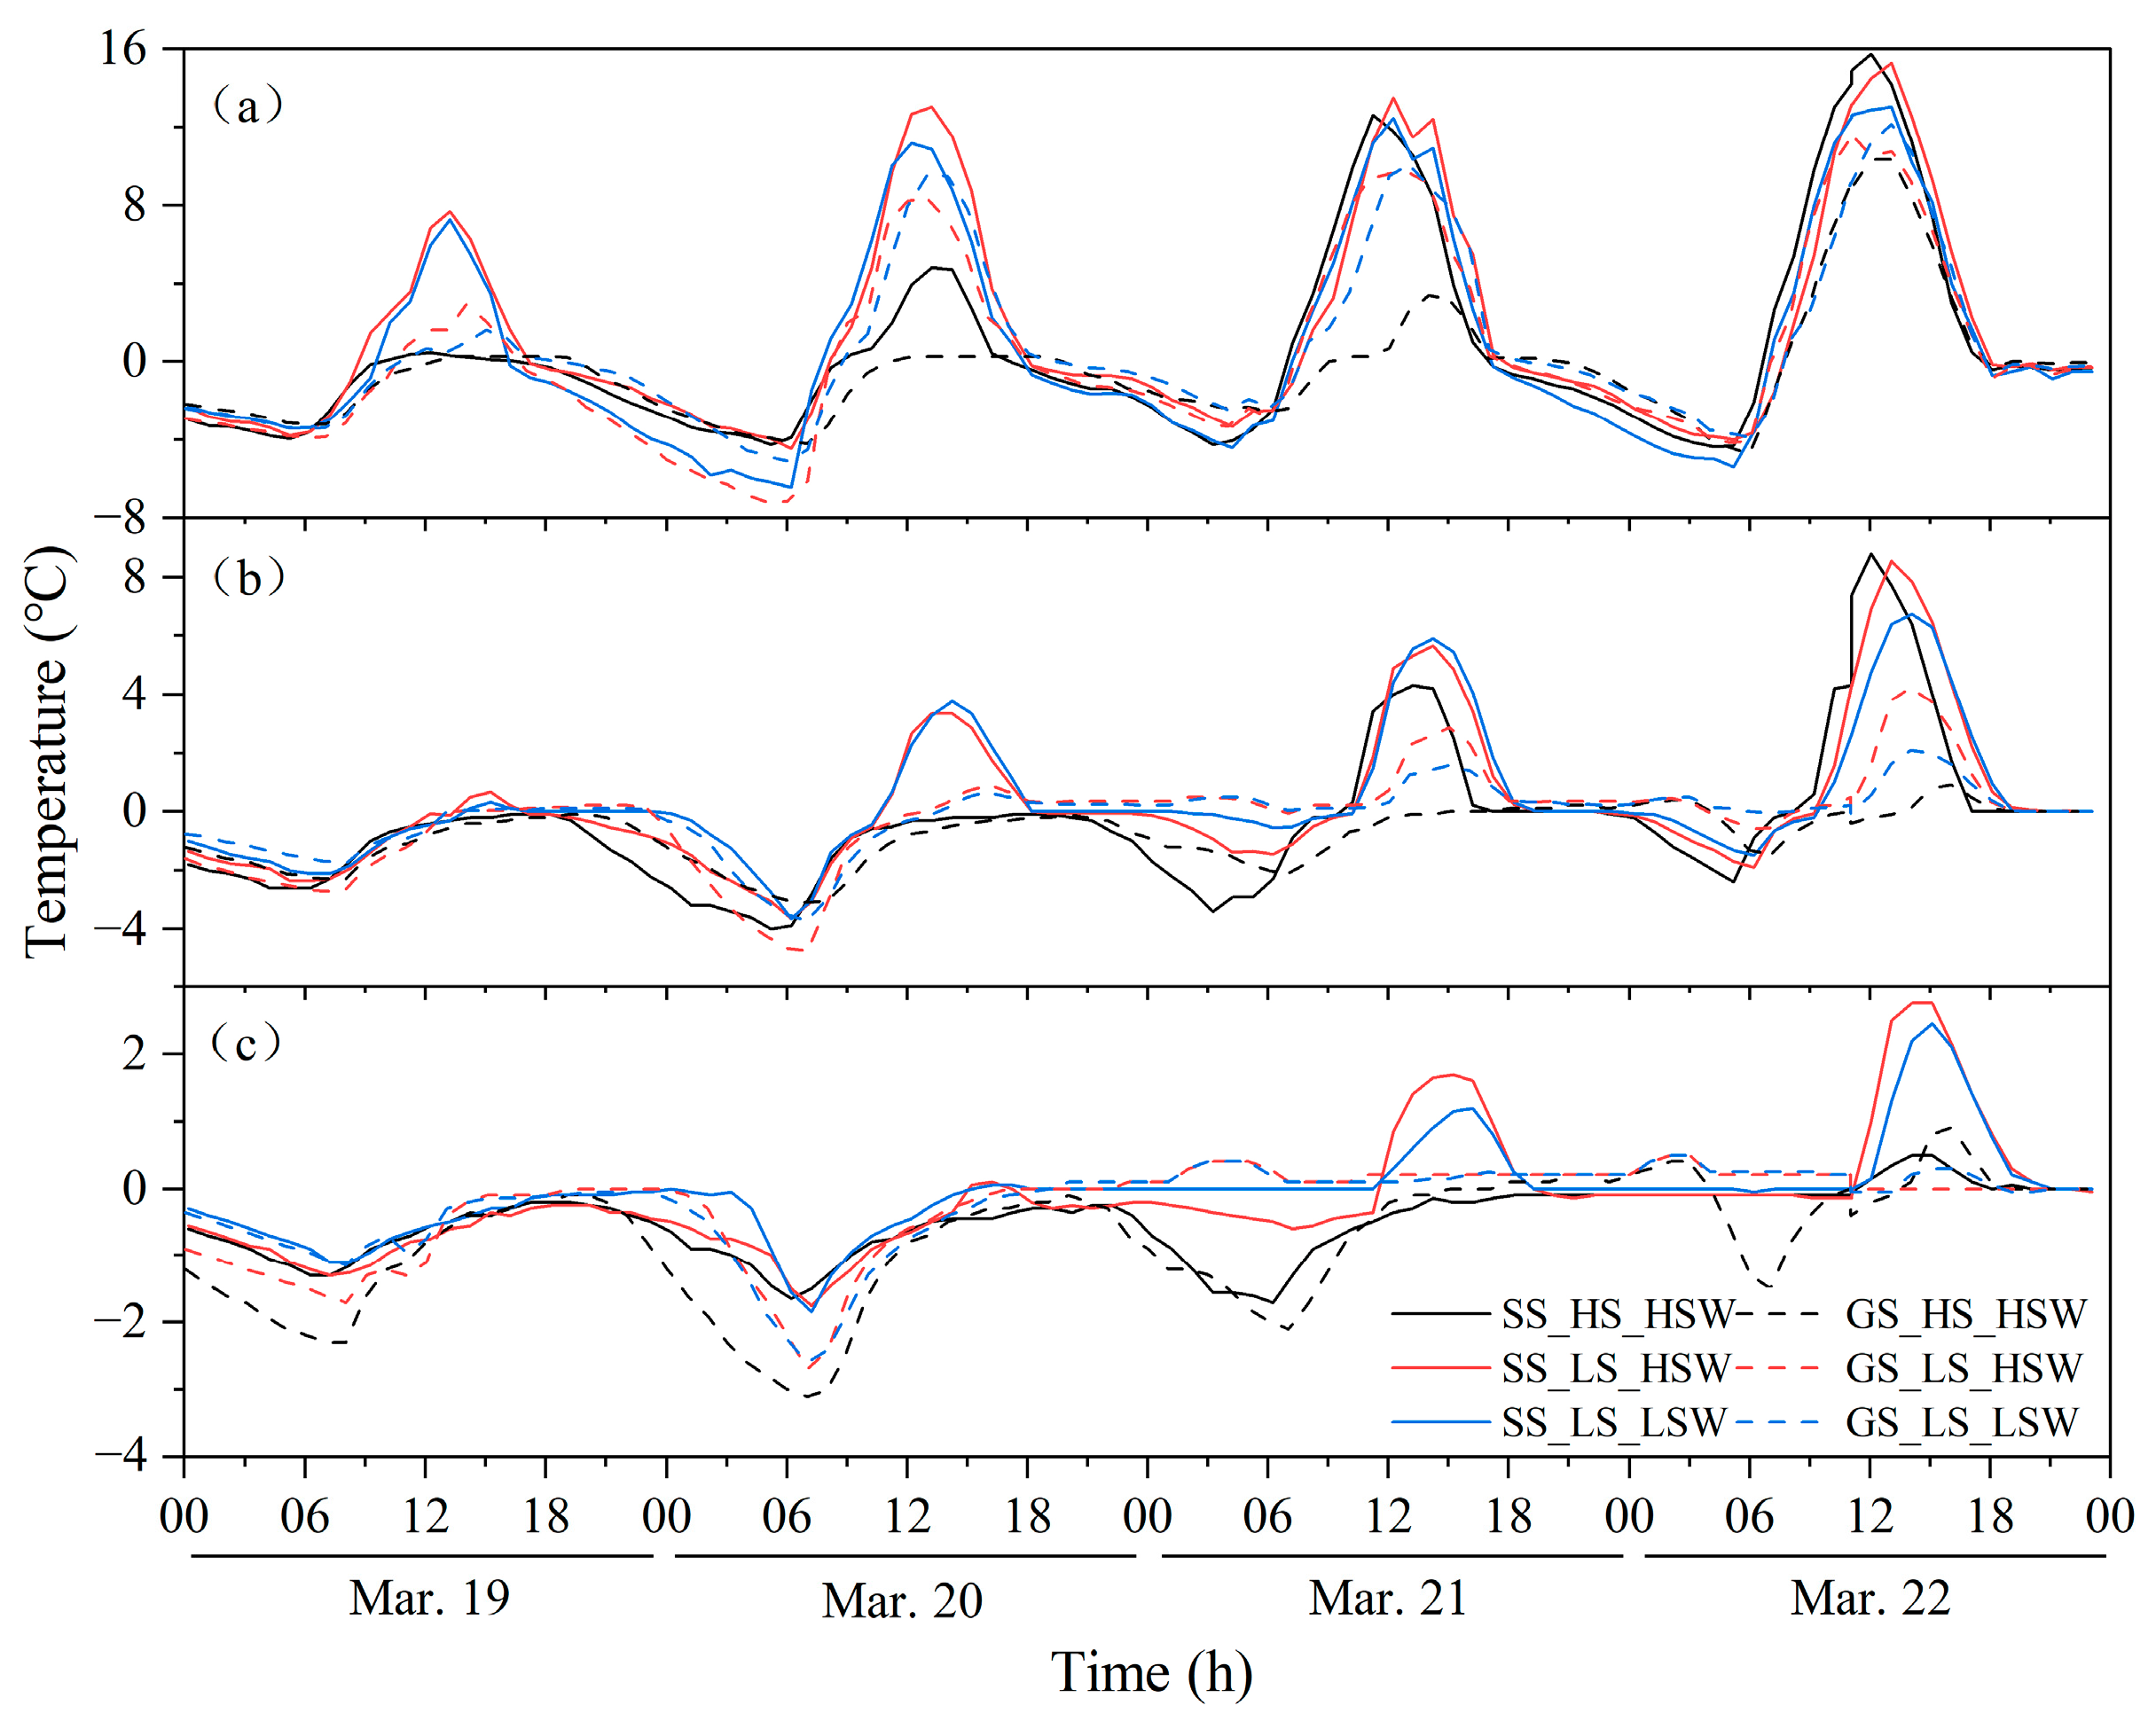
The field experiments were conducted under two slope treatments (8° and 15°), two snow water equivalent (SWE) treatments (5 mm and 10 mm), and two soil water content (SWC) treatments during the snowmelt period of 2022. Before snowmelt, the SWE of the natural snowpack was approximately 5 mm. After measuring the snow density, we increased the SWE of high snow treatments to 10 mm through an artificial snow addition (March 15). To create a differentiated soil water content, we selected a plot on both steep and gentle slopes and covered them with HDP film from October 13 to December 10 to prevent the infiltration of rainfall and snowmelt water during that period and created lower soil water content treatments. In addition, each steep and gentle slope plot was chosen a plot to cover with HDP film at all times to prevent snowmelt water infiltration during the snowmelt period to analyze the relationship between water and nitrogen supply by snowmelt and the yield from sloping farmland runoff. Temperature recorders (WTOT1, Wangyunshan Information Technology, Fujian, China) were buried in each middle test area (upper and lower part) of the experimental plots at depths of 0 cm, 5 cm, and 10 cm to measure the soil temperature (every 1 h). The soil temperature variations at different depths during the snowmelt process are shown in Figure 2. The air temperature was monitored at the Shuangyang weather station located 5.9 km northwest of the experimental plot. Soil samples were collected 5 cm a layer to the depths of 20 cm in each of the two test areas (close to the sidewalk) of the experimental plots before (March 8), and after (March 26) the snowmelt process, three sampling points (upper, middle, and lower) on the slope were chosen for each test area (Figure 1b). In total, six soil sites were sampled for each treatment as replications. These soil samples were collected using a power sampling drill (5 cm diameter), and parts were used to measure soil water content by an oven-drying method [32]. The other parts were extracted with a soil water ratio of 1:5 to measure soil ammonium nitrogen (NH4+-N) and nitrate nitrogen (NO3-N) content. SWE was monitored from 8:30 to 18:00 on each day in intervals from 0.5 to 2 h using a snow drill with a diameter of 5 cm. Every time, three replications of snow were collected in each treatment to measure SWE. Snowmelt water was collected once it was generated, and the sampling time was recorded. The monitoring interval was approximately 10–30 min, and the runoff rate was recorded as the ratio of the water collected in the measuring cup to the interval time. This water was filtered through 0.25 mm membrane filters and frozen in the refrigerator together with the soil extraction until analysis. The NH4+-N and NO3-N concentrations of water and soil extraction were measured using a CleverChem 200 automatic continuous analyzer (DeChem-Tech. GmbH, Hamburg, Germany). These soil and water physical or chemical analyses were performed in the state-key laboratory of water resources and hydropower engineering science at Wuhan University.

2.4. Statistical Analyses

Because there are multicollinear relationships between SWE, the soil water content, and soil nitrogen content, coefficients of principal component regression between them and the runoff, nitrogen yield, and nitrogen concentration, were calculated to identify the major affecting factors. Principal component regression analysis was conducted using SPSS 17 (IBM, New York, NY, America). The figures were prepared using Origin 2021 (Origin Lab, Northampton, MA, America).

3. Results

3.1. Runoff during the Snowmelt Process

As shown in Table 1, the SWE in the high snow (HS) treatments was approximately two times higher than that in the low snow (LS) treatments. The soil water content (SWC) in the gentle slope (GS) treatments was higher than that in the steep slope (SS) treatments, and the SWC in the high soil water (HSW) treatments was significantly higher than that in the low soil water (LSW) treatments. Therefore, our method of creating SWE and slope treatments was effective.
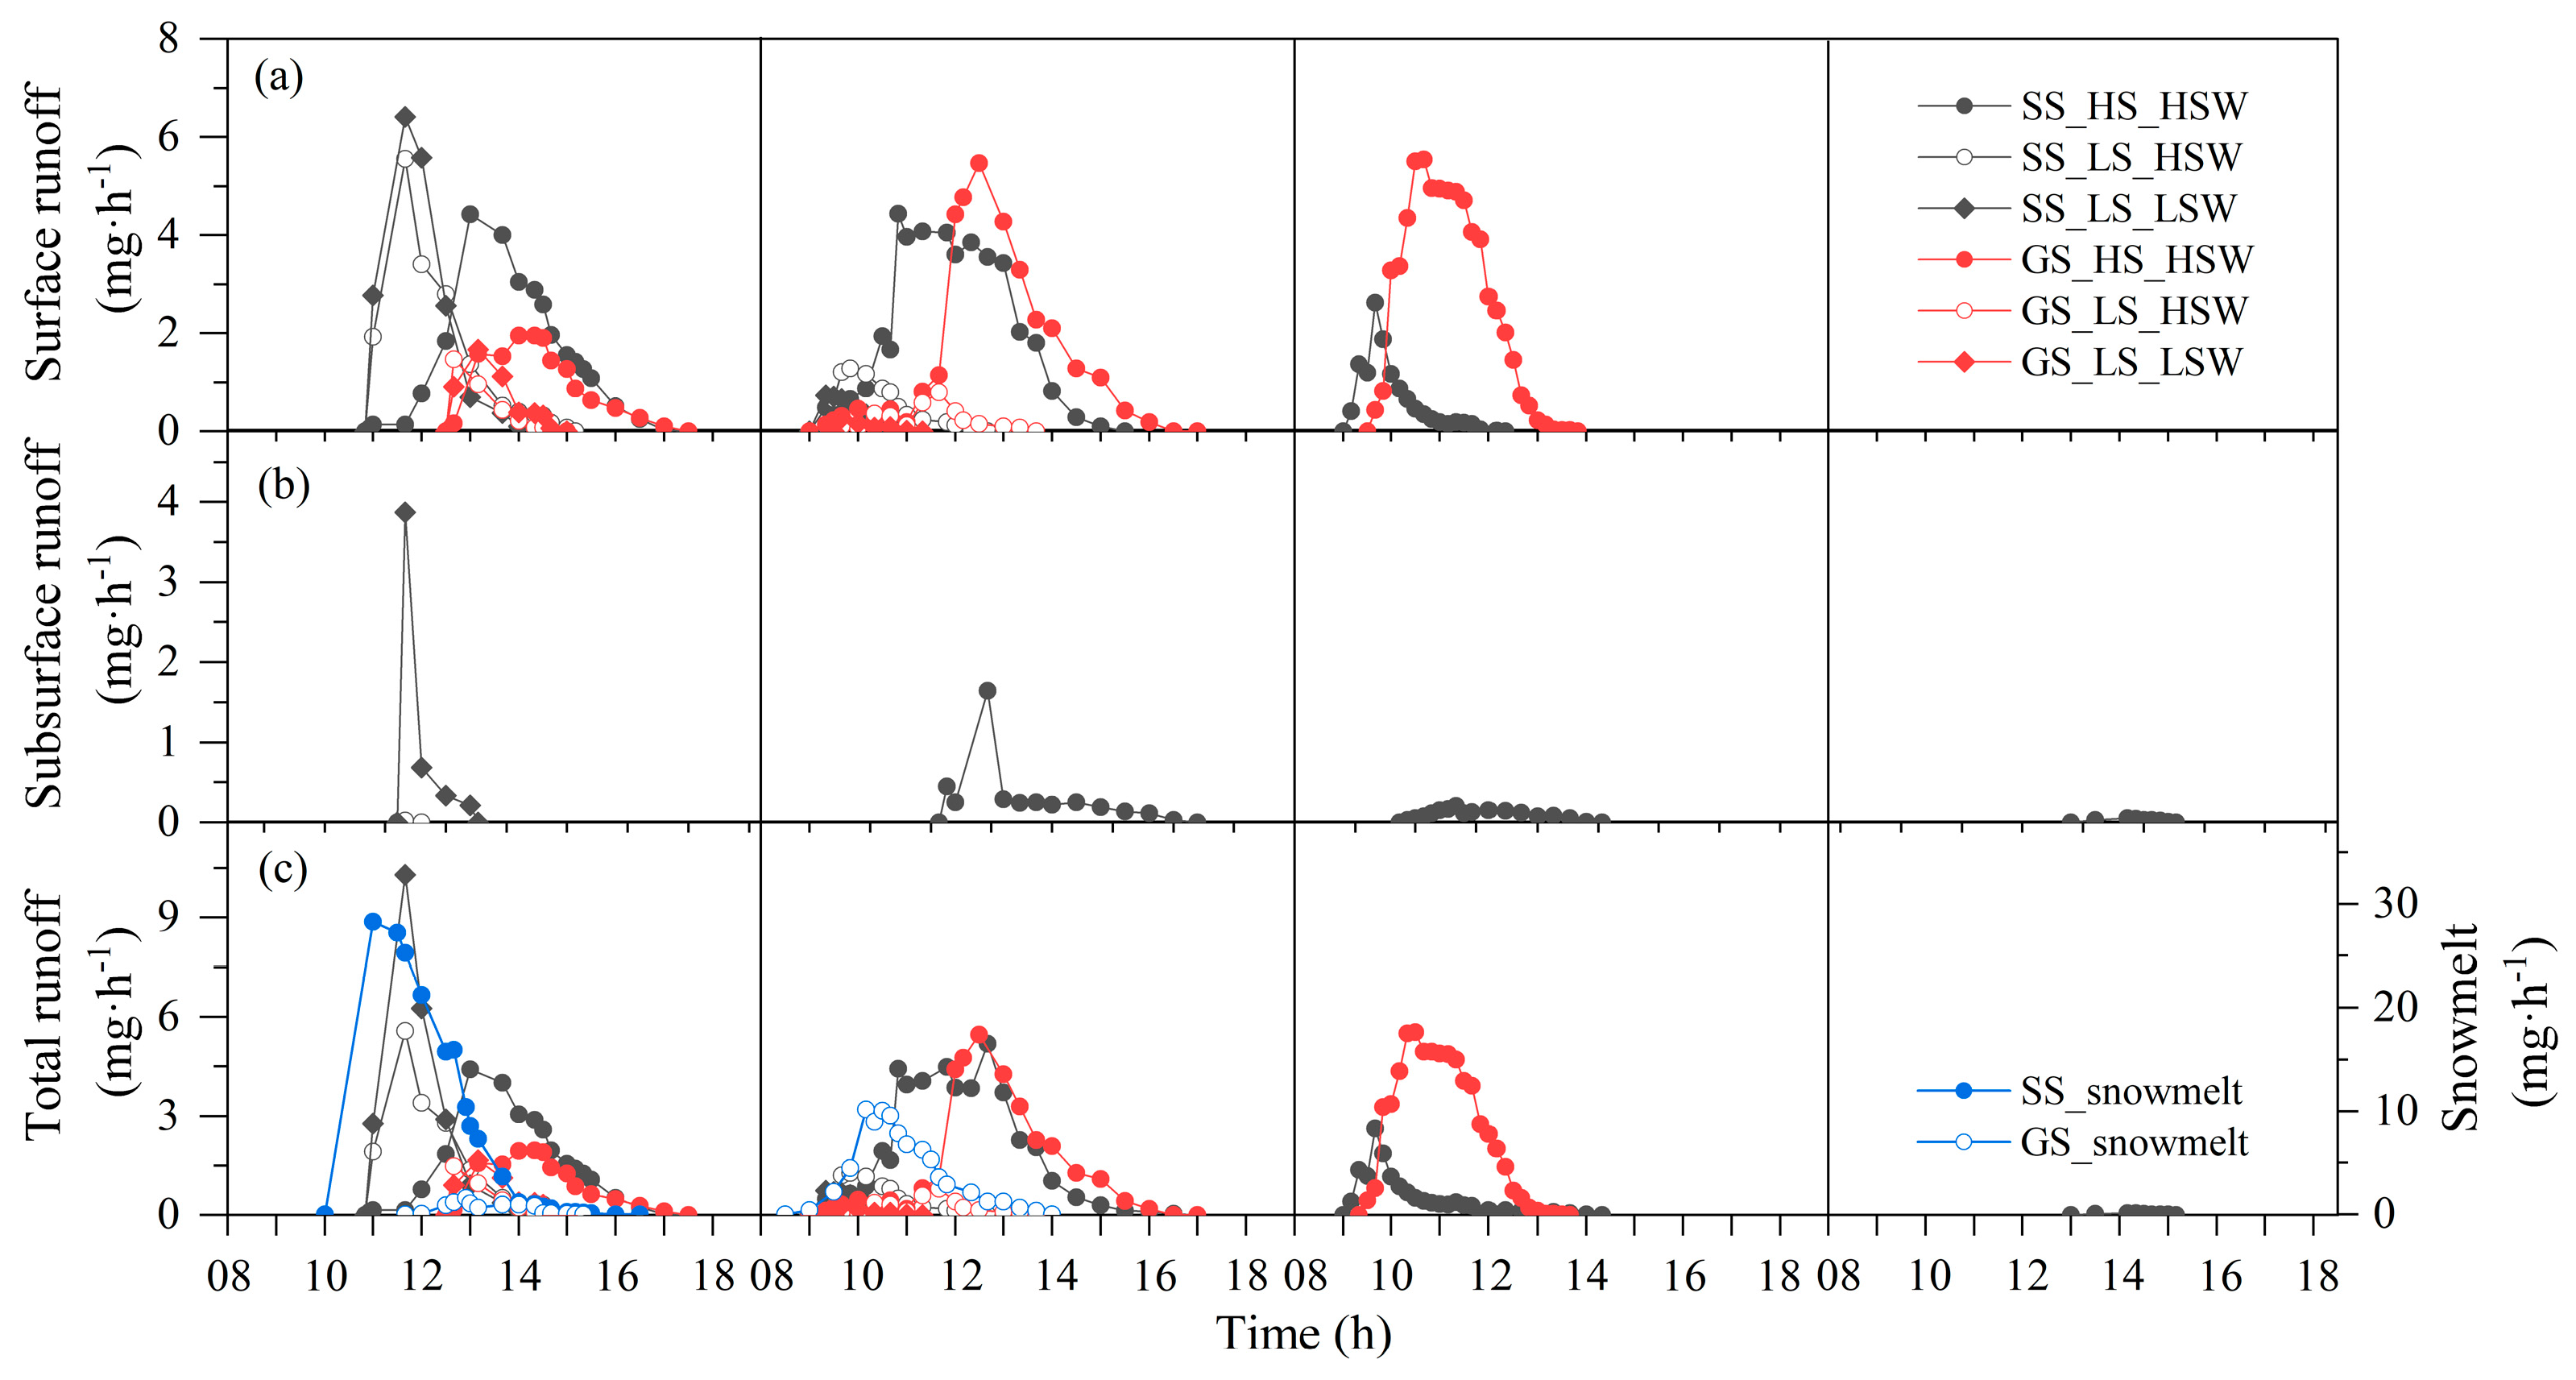
SWE greatly affected water yield through the surface and total runoff (Figure 3). For instance, the water yields of the SS_HS treatments through the surface runoff and total runoff were 1.76 and 2.36 times higher than those of the SS_LS treatments, and the GS_HS treatments were 8.15 times higher than the GS_LS treatments. The snowmelt process lasted between 1 and 2 days in low snow treatments (with or without infiltration), while treatments with artificial snow enhancement lasted 3 days. The generation of the snowmelt water in the SS of non-infiltrated snowmelt treatments was 2.5 h earlier than that of GS, and they peaked at 2.0 h and 0.67 h later, respectively. The generation of the surface runoff from the steep slope farmland was 0.83 h later than that of steep non-infiltrated snowmelt runoff but >2.5 h earlier than that of gentle slope treatments (with or without infiltration). The surface runoff peaked between 0.8 and 1.17 h from a generation for the SS_LS treatments, and between 0.17 and 0.67 h for GS_LS, which were both shorter than those of the HS treatments (SS: 2.17 h; GS: 1.5 h). Furthermore, subsurface flow only occurred in the SS_LS_LSW treatment on the first day, and its generation time was 0.67 h later than that of the surface flow. The runoff started at 9:00 on the second and third days (Mar. 19 and 20) for both the SS and GS treatments but the peak time of the SS treatments was between 0.67 h and 1.5 h earlier than that of the GS treatments, and the generation of subsurface runoff was between 1 and 2.5 h later than that of the surface runoff.
The water yield in the SS_LS treatments was between 4.8 and 6.2 times higher than that of the GS_LS treatments (Table 2). The ratio of runoff to SWE of the SS_LS treatments was 31.8% and 38.2%, which is 5.0 and 5.9 times higher than those of the GS_LS treatments (6.3% and 6.5%) (Figure 4a). The water yield and ratio of the runoff to SWE in the high snow treatments were basically the same (Table 2 and Figure 4a). Most snowmelt waters were generated on the first day on the steep slope, while the proportion of water yield during the later days was higher on the gentle slope. High snow treatment also delayed the generation of snowmelt water. For example, the proportion of runoff generated on the second and third days of snowmelt was between 62% and 89% for the HS treatments and between 2% and 42% for the LS treatments (Table 2). During the snowmelt process, water was mostly generated through surface runoff (Figure 4b), and subsurface runoff only occurred in the SS_LS_LSW and SS_HS_HSW treatments. The proportions of water yield through the subsurface in these two treatments were 17.6% and 9.7%.

3.2. Nitrogen Losses during the Snowmelt Process

As shown in Table 3, the NH4+-N content or concentration in the snow and soil was lower than that of NO3-N before the snowmelt. On average, the NH4+-N and NO3-N contents of the surface soil (0–5 cm) were 1.7 and 1.3 times higher than those in the subsurface soil (5–20 cm). The proportion of NH4+-N to inorganic nitrogen (NH4+-N + NO3-N) was 0.37 in the snow but, on average, between 0.46 and 0.41 in the surface and subsurface soil, respectively.
The variations in NH4+-N and NO3-N yields during the snowmelt process were similar to those during the water generation process. The nitrogen yields of the SS_HS treatments through surface runoff and total runoff were between 1.65 and 3.01 times higher than those of the SS_LS treatments, and those of the GS_HS treatments were between 6.59 and 12.62 times higher than those of the GS_LS treatments. The generation of NH4+-N and NO3-N was advanced compared with that of water (Figure 5 and Figure 6 and Table 4). For instance, on average, the first 10%/30% of the surface runoff water yielded 13.1%/34.7%, 16.8%/41.6%, and 23.9%/51.6% of NH4+-N for SS treatments from Mar. 19 to Mar.21, respectively and yielded 11.1%/31.4%, 14.4%/37.3%, and 10.2%/30.3% of NH4+-N for GS treatments on these days, respectively. The corresponding proportion for NO3-N of the SS treatments was 12.2%/30.4%, 13.7%/34.8, and 16.4%/40.7%, respectively, and 11.4%/31.8%, 14.3%/37.0%, and 12.7%/33.8% for NO3-N of the GS treatments, respectively (Table 4). These rules were also observed in the nitrogen yield through the total runoff. However, the proportion of the nitrogen yield during the first day (Mar. 19) of the snowmelt process for the LS treatments decreased compared with the proportion of water yield, and these decreases were higher for the NO3-N yield (−4% to −6% for NH4+-N, and 0 to −30% for NO3-N) (Table A1 and Table A2). The flow-weighted mean NH4+-N concentration of the snowmelt water (non-infiltration treatments) was higher than that of the surface, subsurface, and total runoff. The flow-weighted mean NO3-N concentration of the snowmelt water was higher than that of the surface and total runoff (except GS_HS_HSW) but lower than that of the subsurface runoff. The flow-weighted mean NH4+-N concentration of subsurface runoff was lower than that of the surface runoff, while NO3-N was higher. Moreover, the flow-weighted mean NH4+-N and NO3-N concentrations of the surface, subsurface, and total runoff were mostly lowest on the first day and increased on the flowing day, which was opposite for the snowmelt water (Table A1 and Table A2).
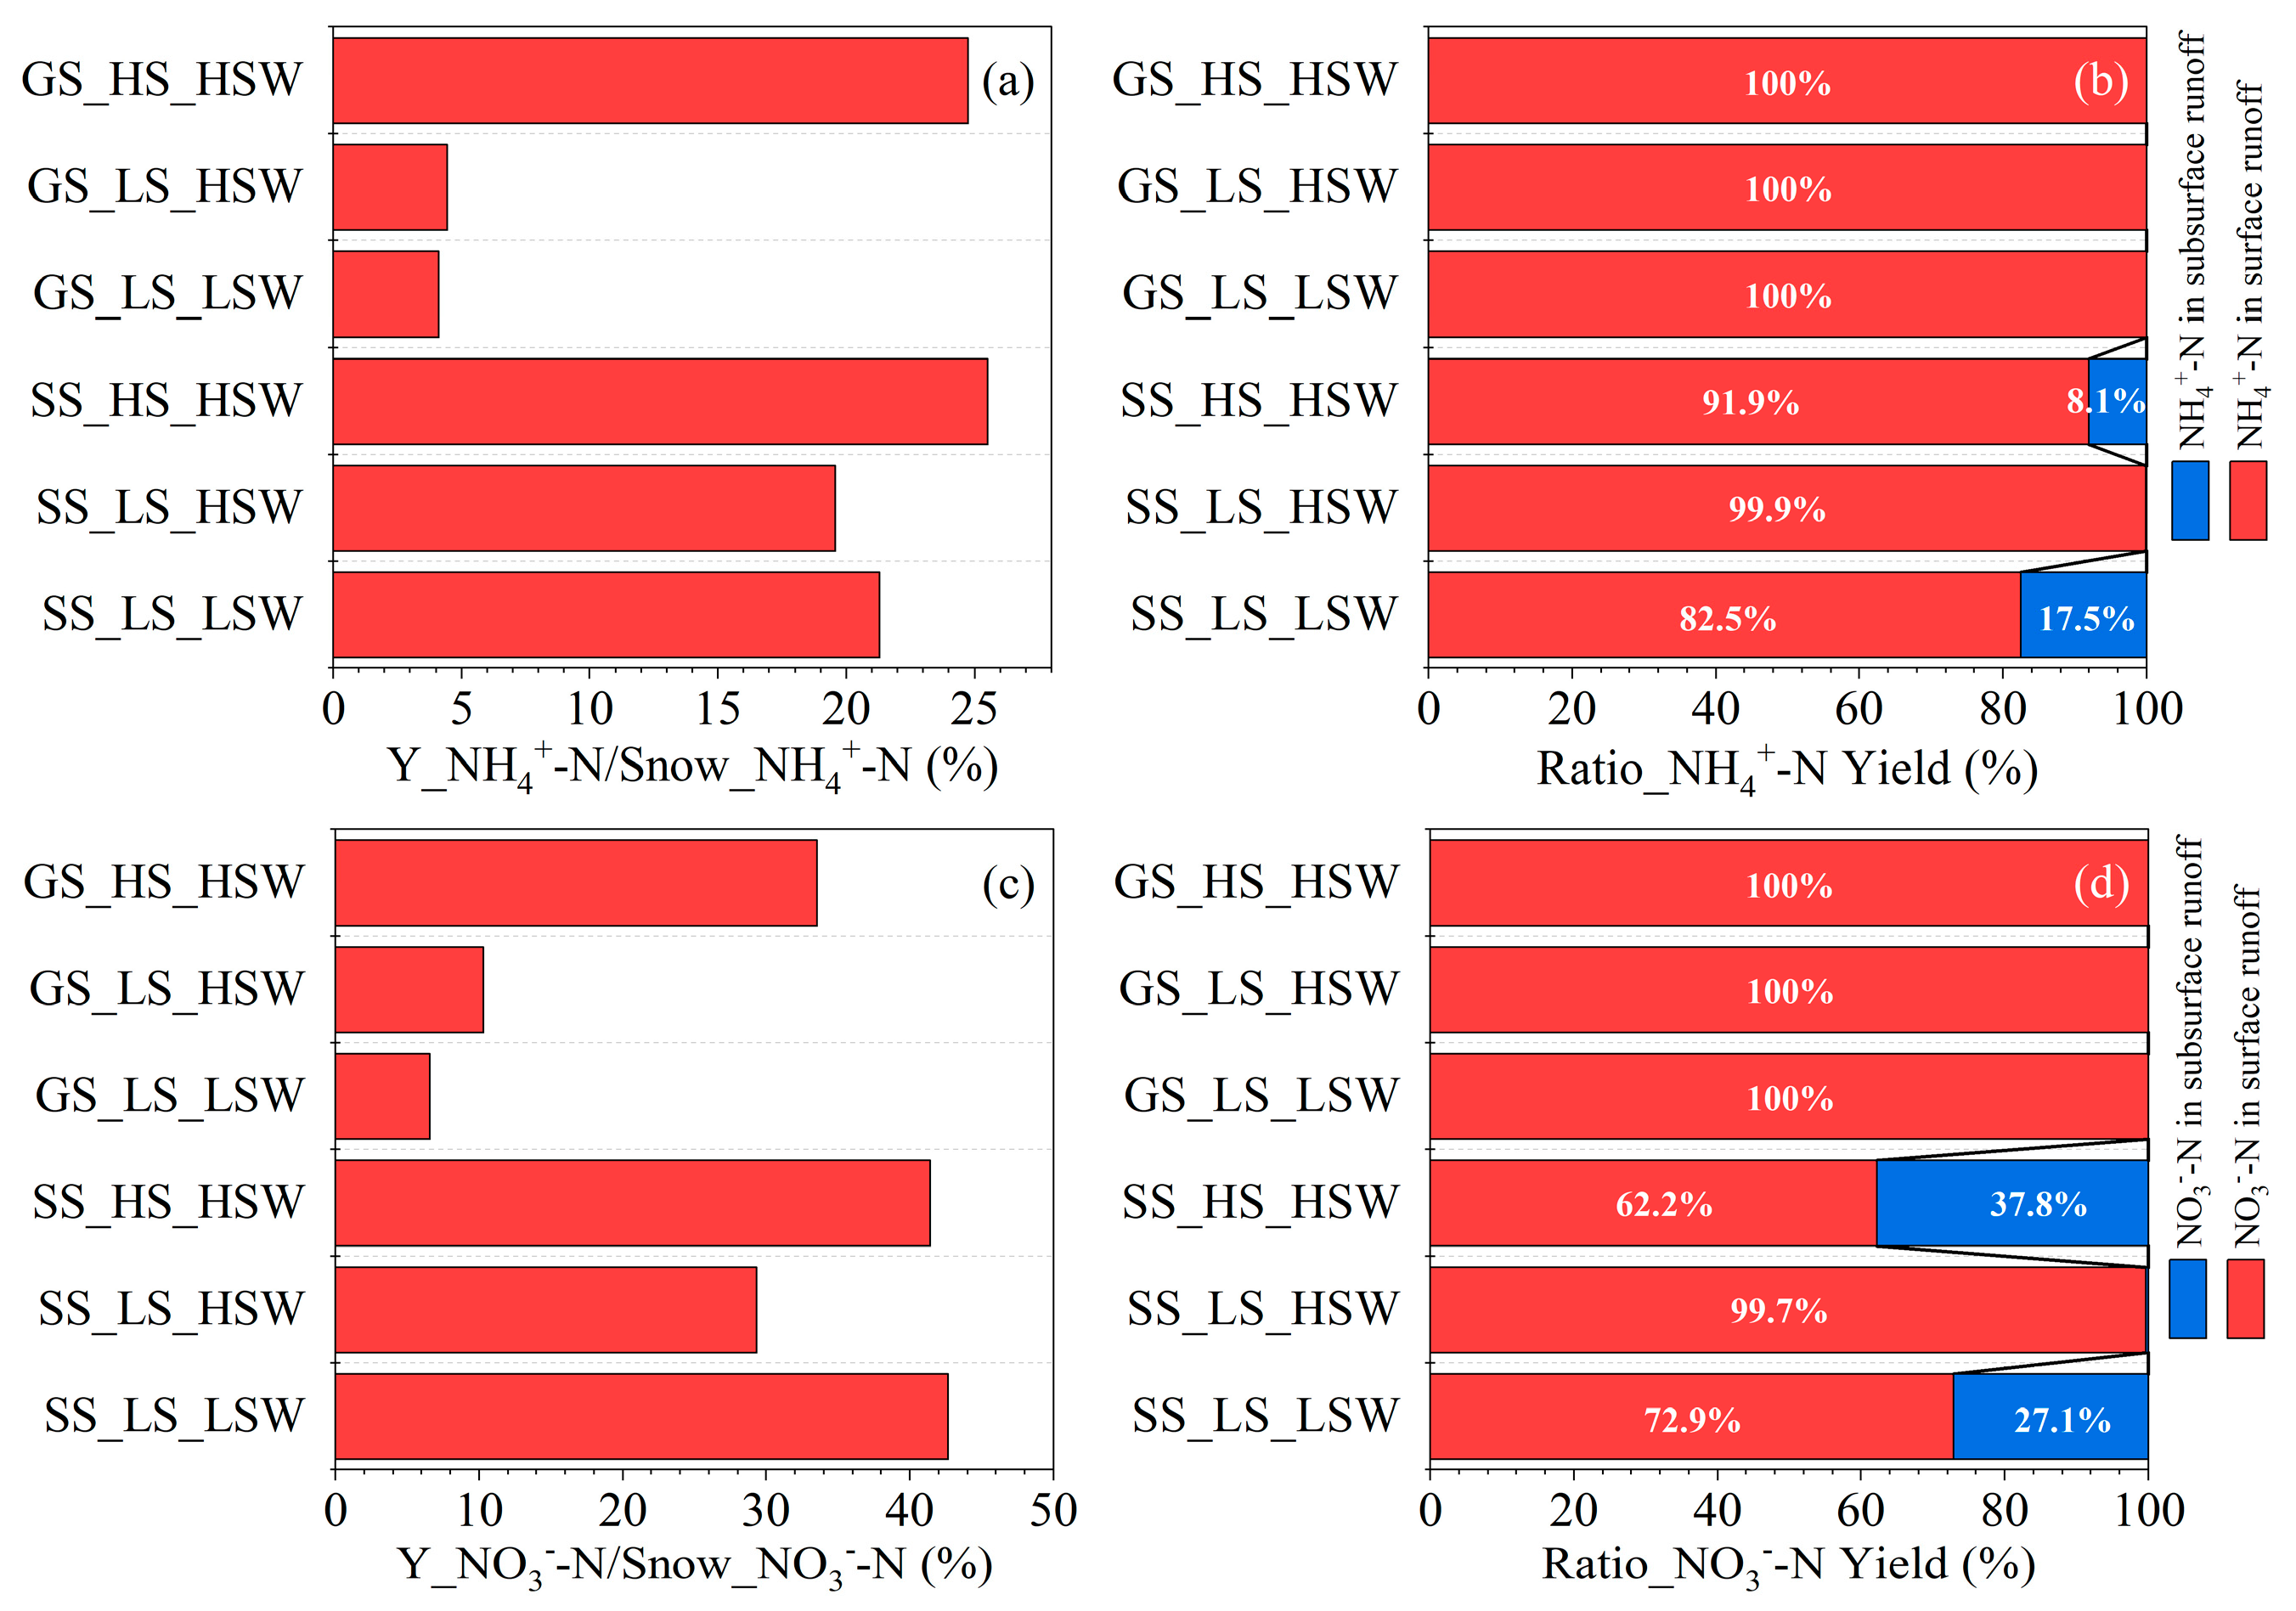
The ratio of the NH4+-N yield for the total runoff to the NH4+-N stored in the snow was, on average, −15.1% lower than that of water (Figure 4a and Figure 7a), and the ratio of the NO3-N yield in the total runoff to the NO3-N stored in the snow decreased by −4.4% compared with that of water (Figure 4a and Figure 7c). The ratio of the nitrogen yield in the total runoff to the nitrogen stored in the snow for the SS_LS treatments was between 2.8 and 6.4 times higher than that of the GS_LS treatments, while the ratio was basically the same in the HS treatments. The proportions of NH4+-N yield through the subsurface runoff in the SS_LS_LSW and SS_HS_HSW treatments were 17.5% and 8.1%, respectively, which is close to those of the water yield. However, the corresponding proportion of the NO3-N yield through subsurface runoff in these two treatments was between 1.5 and 3.9 times higher than that of water (Figure 7b,d).

4. Discussion

4.1. Critical Factors Affecting Snowmelt Water Loss from Sloping Farmland

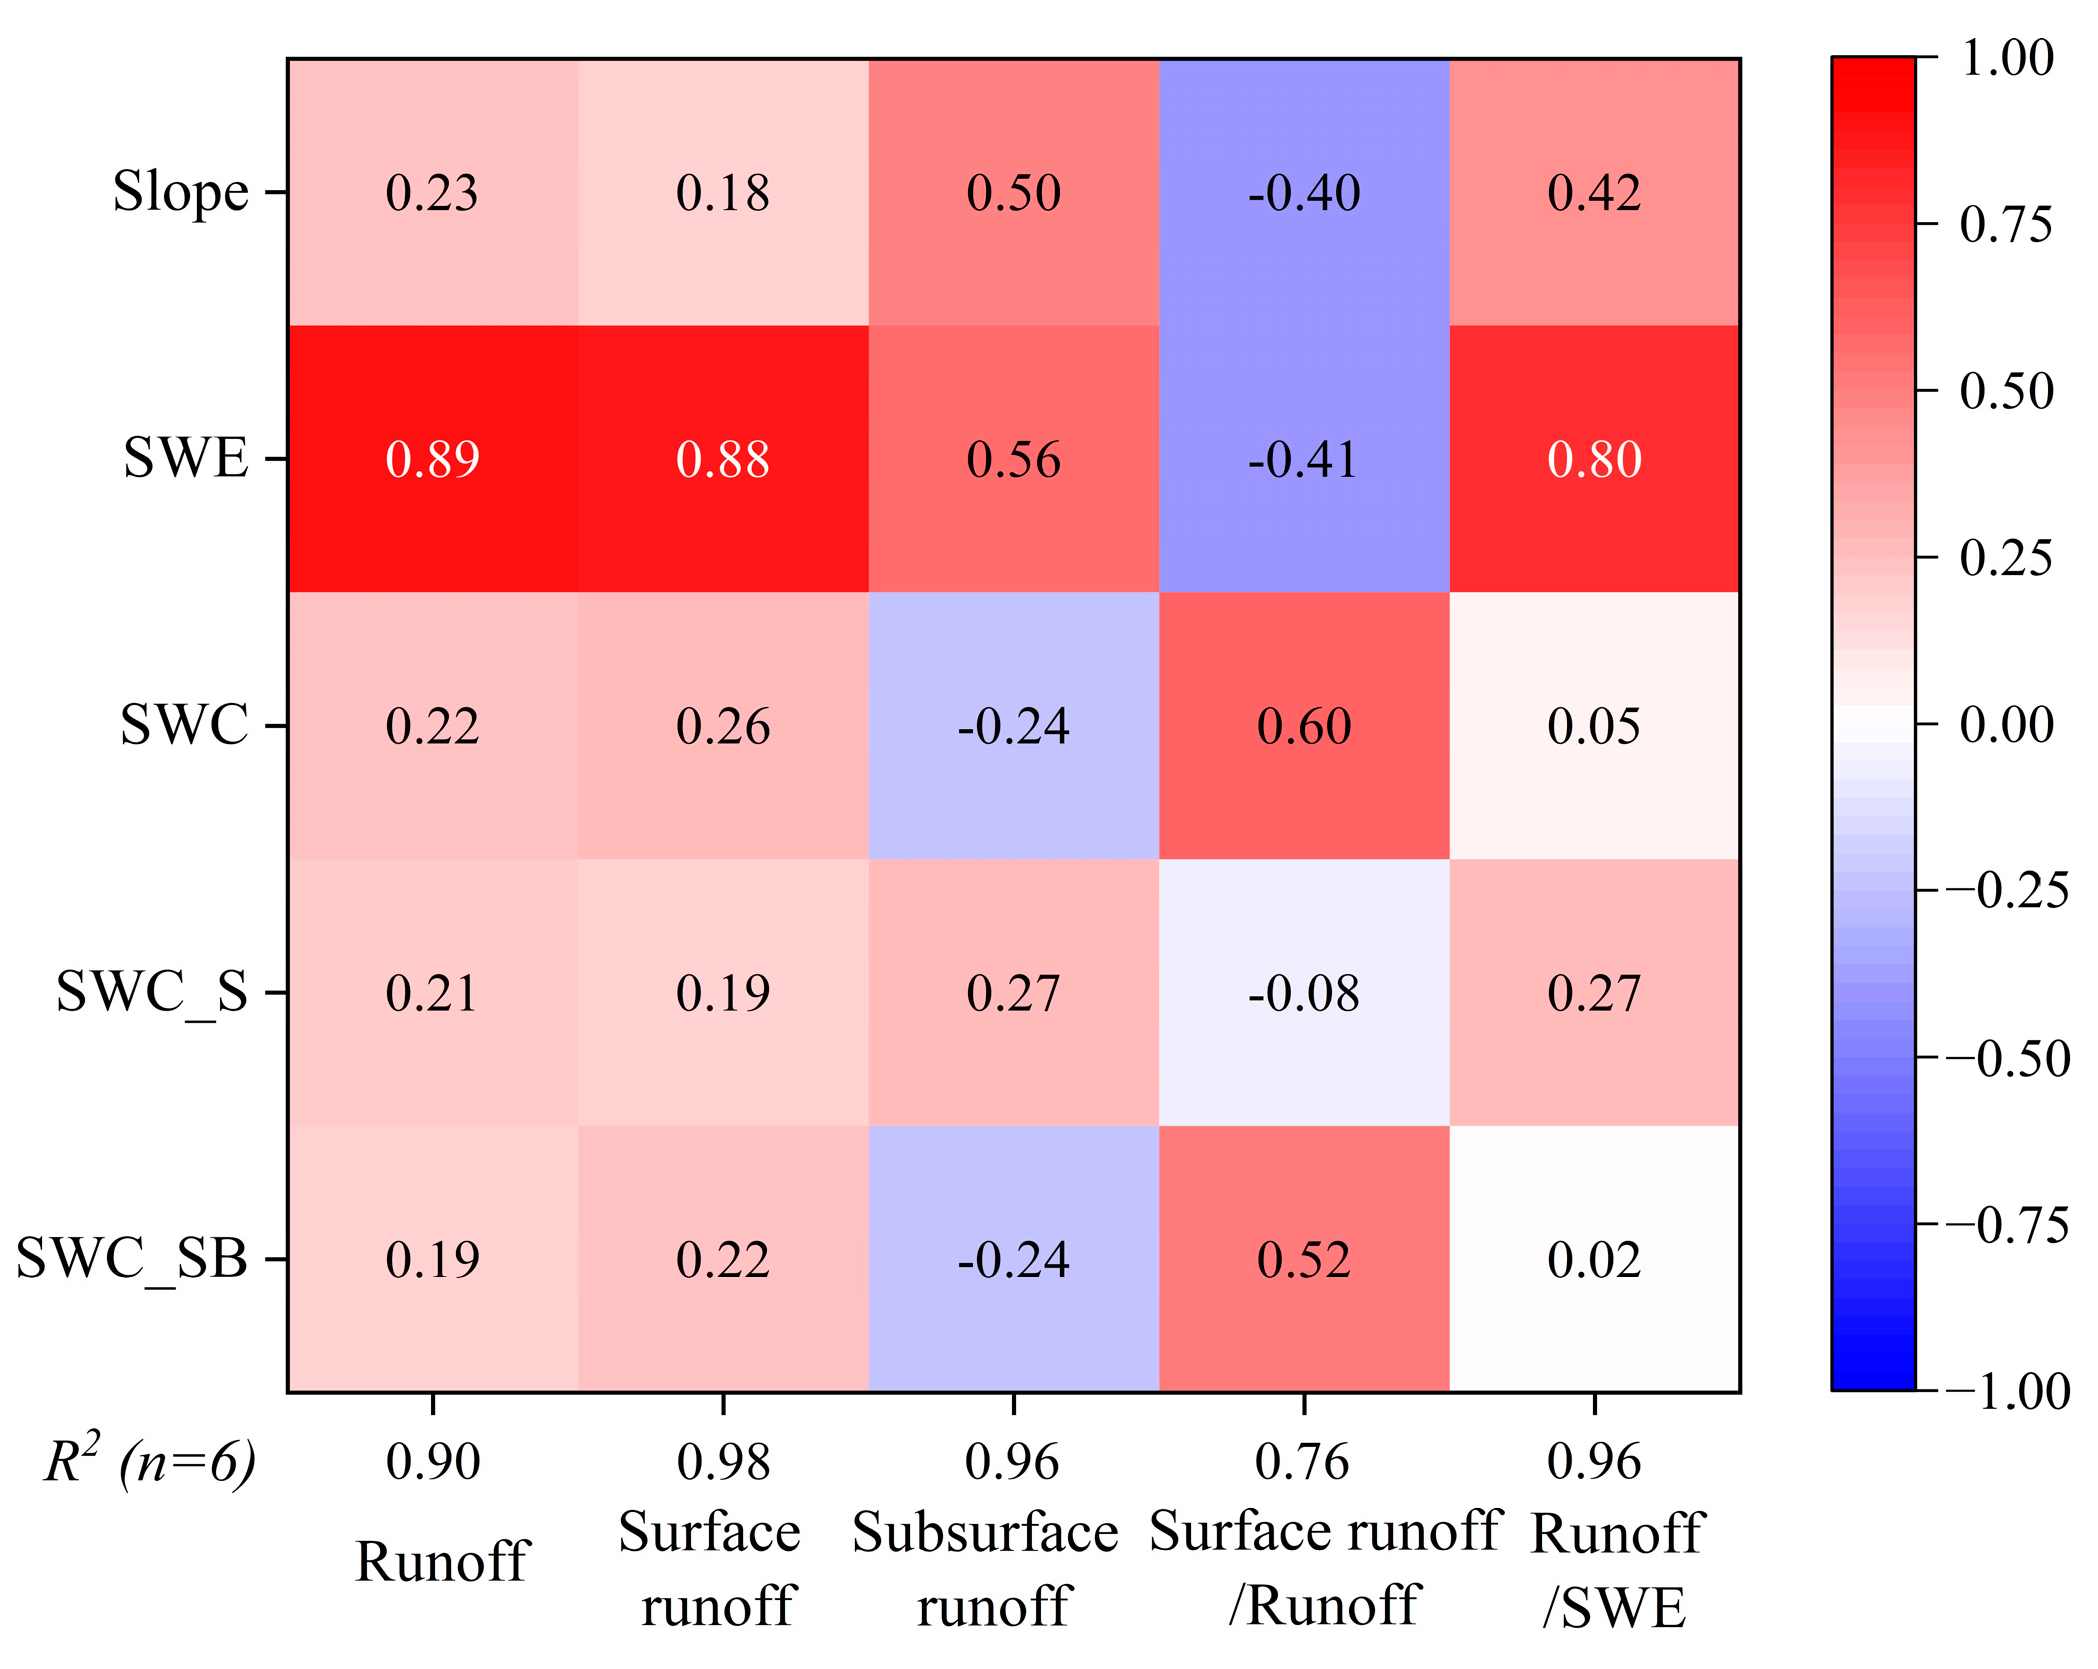
Surface runoff accounted for between 80.4% and 100% of the snowmelt runoff from the sloping farmland (Figure 3b). Therefore, the factors affecting runoff and surface runoff generation from the sloping farmland were similar (Figure 8). SWE was the main factor affecting runoff, surface runoff, subsurface runoff, and the ratio of total runoff to SWE, followed by the slope. A higher snow depth delayed the occurrence of the snowmelt (Figure 3) because snow could retain part of the snowmelt water, which may be refrozen in or below the snowpack and melt on the following days [33]. Therefore, the proportion of snowmelt water generated on the second and third days was much higher in the HS treatments (Table 2). The water yields of the HS treatments through the surface runoff and total runoff were between 1.76 and 8.15 times higher than those of the LS treatments (Table 2). Furthermore, enhanced snow accumulation also greatly increased the ratio of the total runoff to SWE (Figure 4). The reason could be that deeper snow existed for a longer time and provided a better and longer-lasting insulation function (Figure 3) [34,35]. As a result, the soil temperatures of the HS treatments were much lower than those of the LS treatments (Figure 2). This contributed to the maintenance of frozen soil [36,37], which can significantly reduce the infiltration capacity of soil and increase the water yield [20].
A higher slope advanced the generation time of the snowmelt runoff on the first day (Figure 3) and greatly increased the water yield and the ratio of the total runoff to SWE in the LS treatments (between 4.8 and 6.2 times higher) (Figure 4a and Table A1 and Table A2). However, the water yield and ratio of the total runoff to SWE in the HS treatments were similar for both SS and GS treatments, indicating that the slope only displayed a significant influence on runoff when the SWE was sufficiently low. The reason could be that the snowmelt water stayed longer on the GS treatments [38], and a smaller slope was not conducive to the production of the subsurface runoff when the soil was frozen. Therefore, more snowmelt water was lost through infiltration and evaporation, and less water was generated in the gentle slope treatments [5]. This can be verified by the changes in the soil water before and after the snowmelt, as shown in Table 5. The surface soil water content increased from 0.7% to 2.0% in the GS treatments and decreased from 0.3% to 2.8% in the SS treatments, indicating that more snowmelt water was restrained in the soil of the gently sloping farmland. Consequently, the subsurface flow only occurred in the SS treatments (Figure 3).
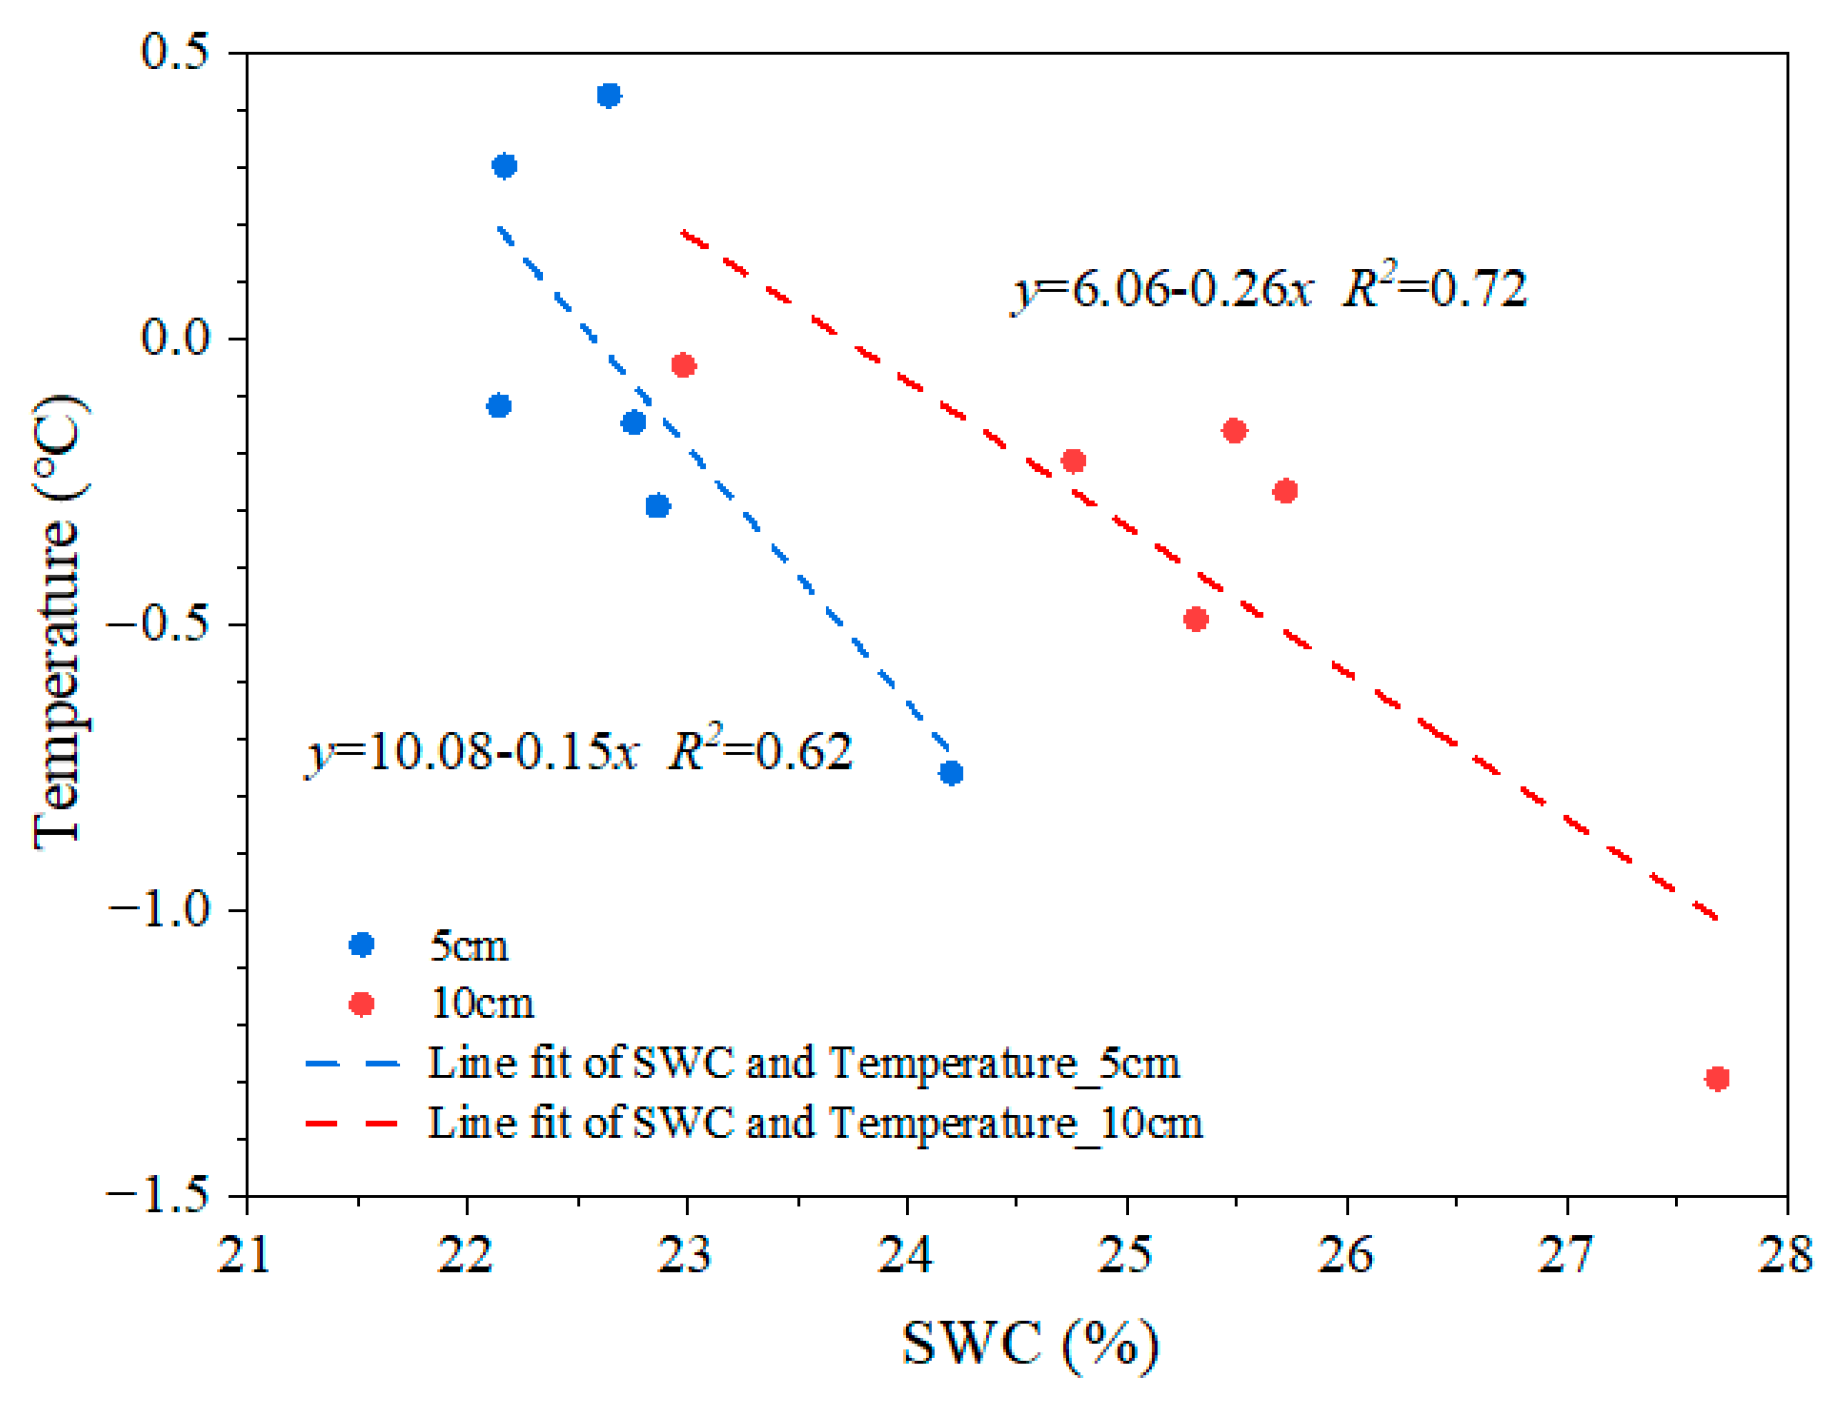
The soil water contents (SWC, SWC_S, and SWC_SB) had a slightly positive effect on the water yield through the total runoff, surface runoff, and the ratio of the total runoff to SWE. SWC and SWC_SB had a negative effect on the water yield through subsurface runoff (Figure 8). The reason was that the water conductivity of the frozen soil was quite low, and an obvious subsurface runoff could only occur in the melted soil [39,40]. Frozen soil with higher SWC required more heat to melt it [41,42], but a higher SWC in the frozen soil also significantly decreased the infiltration of the snowmelt water, which was the main source of heat during the snowmelt process [13,43]. The relationship between the average soil temperature during the snowmelt process and the corresponding SWC before the snowmelt is shown in Figure 9, and we found that the average temperature decreased with increasing SWC, which confirmed our analysis.

4.2. Critical Factors Affecting Nitrogen Losses from Sloping Farmland during Snowmelt

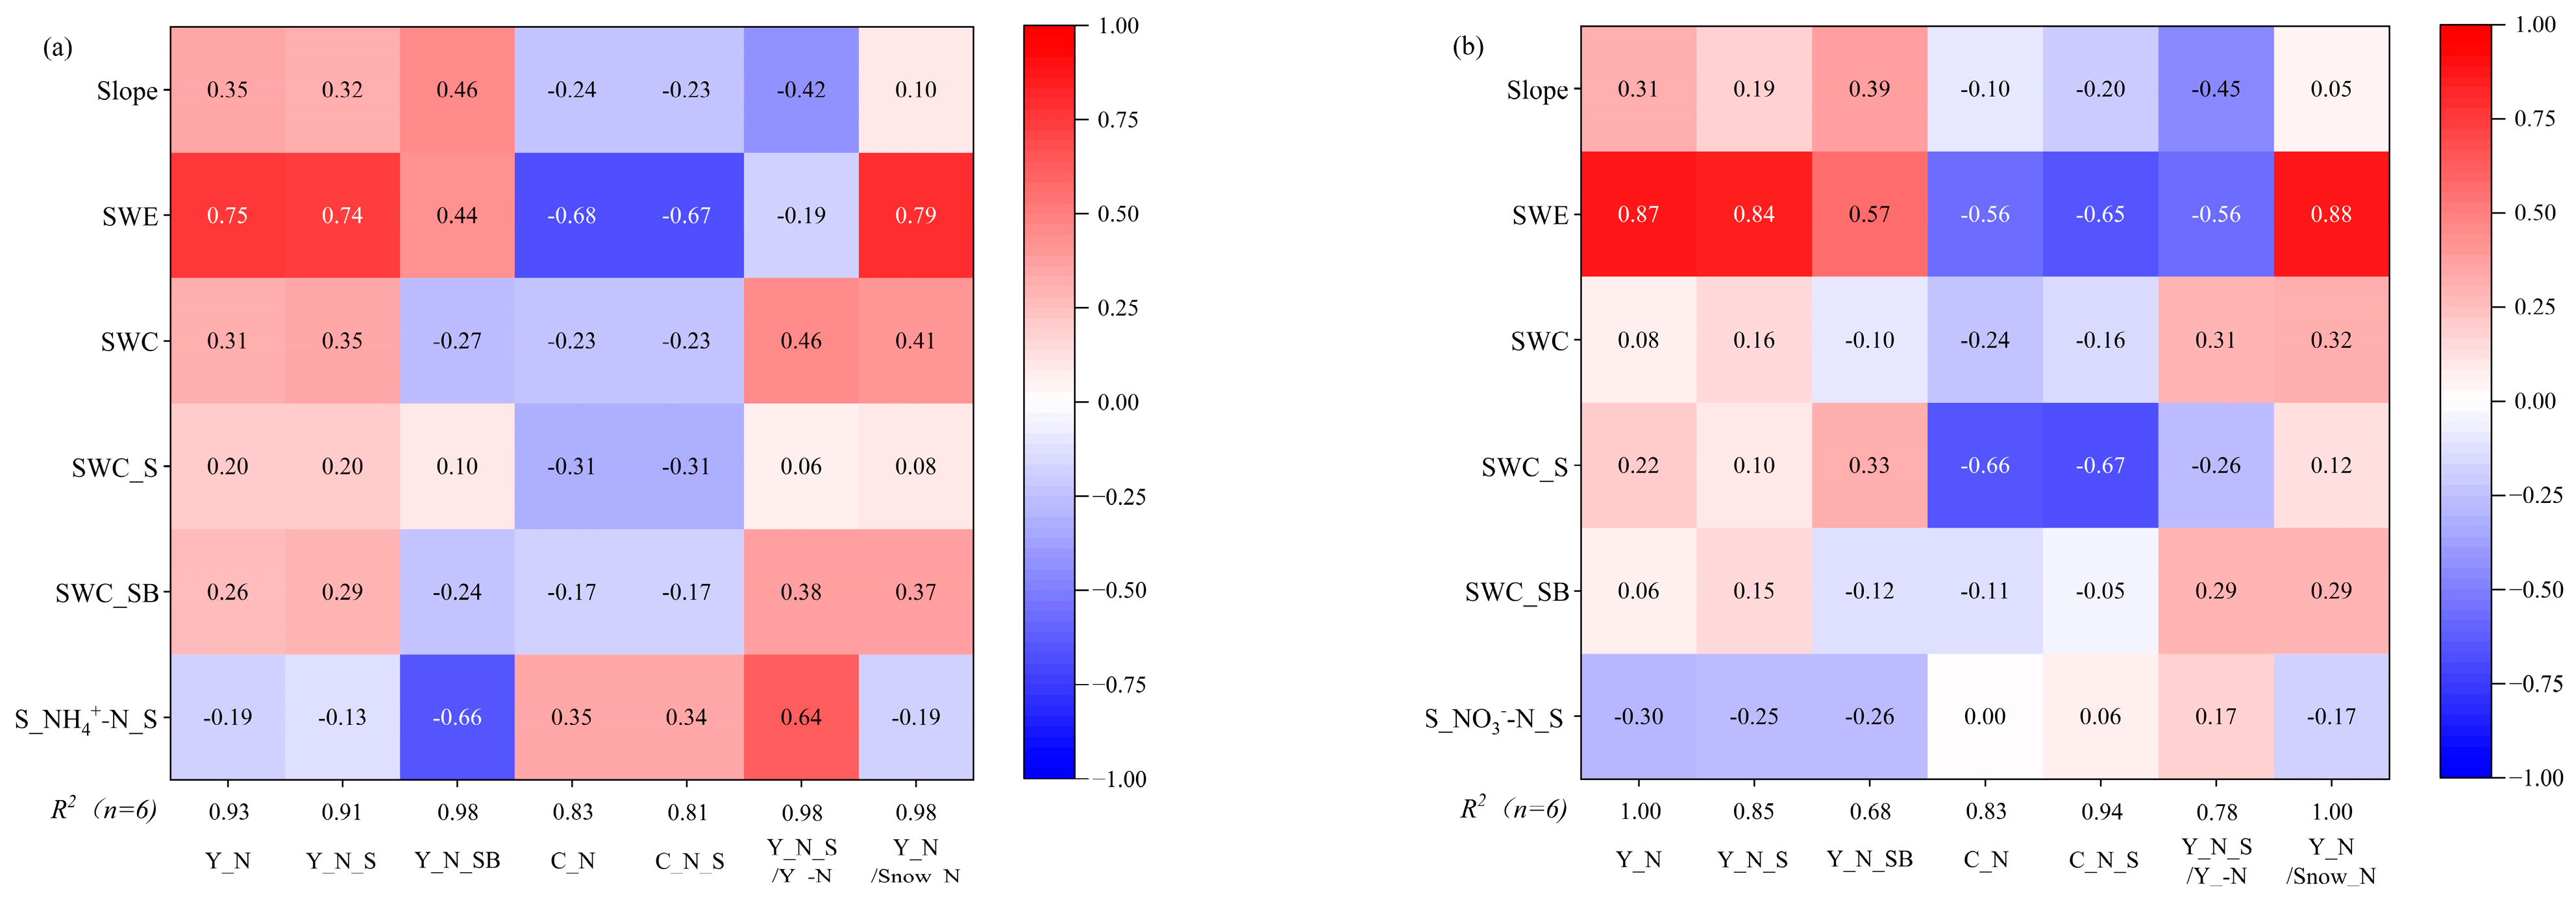
The factors affecting the NH4+-N and NO3-N yield were similar to those affecting the water yield (Figure 10), indicating that the sources and migration paths of water and nitrogen were almost the same during this snowmelt process. However, as observed in Figure 6, the generation of nitrogen was advanced compared with that of water. For instance, on average, 18.0%/42.7% and 11.9%/32.7% and NH4+-N in the surface runoff of the SS and GS treatments were released during the first 10%/30% of the surface runoff, and the corresponding proportions of NO3-N were 14.1%/35.3% and 12.8%/34.2% (Table 4). The reason could be that the changes in temperature, pressure, and humidity caused the snow grains to metamorphose and form crystals [44] and promoted the separation of solutes from the inner lattice of these ice crystals to gather on their surface [45]. This redistribution of ions within the snowpack caused snow fractionation and promoted the ammonium and nitrate ions to be preferentially eluted with the percolating meltwater, which induced an early melt nitrogen pulse [46,47]. The nitrogen yield from the SS was ahead of that from GS during the early snowmelt period, indicating that SS was more conducive to the preferential production of nitrogen during the snowmelt process. Furthermore, the preferential elution effect of nitrogen was more significant in the snowmelt water than in the surface runoff (Table 4), and the ratio of the NH4+-N and NO3-N yield in the total runoff to that stored in the snow was lower compared with that of water (Figure 4 and Figure 7). The reason for this was that the early export of snowmelt with a high nitrogen concentration infiltrated into the soil, and these losses were high in GS. Thus, the ratio of the nitrogen yield in runoff to the nitrogen stored in the snow for the SS_LS treatments was between 2.8 and 6.4 times higher than that of the GS_LS treatments.
Moreover, the flow-weighted mean nitrogen concentration of the surface, subsurface, and total runoff mostly increased from the first day to the flowing days, while it decreased for the snowmelt water (Table A1 and Table A2). This phenomenon can be attributed to the extraction of soil nitrogen by snowmelt water [5]. The longer the snowmelt water was attached to the soil, the more nitrogen it extracted from the soil.
The migration characteristics of ammonium and nitrate ions also affected their export process. The charge of ammonium ions is positive, and that of nitrate ions and soil colloids is negative. Therefore, ammonium ions were easily absorbed by soil during migration, and nitrate ions were easier to move [48,49,50]. As a result, the flow-weighted mean NH4+-N concentration of the subsurface runoff was lower than that of the surface runoff, while NO3-N was higher (Table A1 and Table A2). The proportion of the NH4+-N yield through the total runoff to NH4+-N stored in the snow was much lower than that of NO3-N and water (Figure 4 and Figure 7). Additionally, the NH4+-N content in the snow and soil was lower than that of NO3-N (Table 3). So, the flow-weighted mean concentration and yield of NH4+-N were quite low compared to NO3-N (Table A1 and Table A2).

5. Conclusions

This research found that SWE was the most important factor affecting water and nitrogen production through the surface and total runoff of sloping farmlands during the snowmelt process, followed by the slope. The water and nitrogen yielded through the subsurface runoff were negatively affected by the SWC and SWC_SB. A higher snow depth delayed the occurrence of the snowmelt and enhanced the yields of water and nitrogen. The generation of nitrogen was advanced compared with that of water induced by the preferential production of nitrogen during the snowmelt process. A higher slope promoted the preferential production of nitrogen. This preferential yield function of nitrogen combined with more infiltration resulted in a greatly decreased yield of water and nitrogen in the GS_LS treatments. The flow-weighted mean concentrations and yields of NH4+-N were lower compared with that of NO3—N during the snowmelt process. In summary, the factors controlling water and nitrogen losses from the sloping farmland were similar during the snowmelt period, and the differences in the concentrations and yields of NH4+-N and NO3-N were induced by their migration characteristics and content in the snow and soil. To improve these results, studies with more gradients of slope and SWE are needed.

Author Contributions

Conceptualization, Q.Z. and J.W.; methodology, Q.Z. and C.G.; investigation, Q.Z., C.L., H.Z., Y.L., R.Z. and J.Z.; resources, J.W.; data curation, Q.Z. and J.W.; writing—original draft preparation, Q.Z. and J.W.; writing—review and editing, Q.Z. and C.G.; funding acquisition, J.W. and Q.Z. All authors have read and agreed to the published version of the manuscript.

Funding

This research was jointly supported by the National Key Research and Development Program of China (No. 2021YFD1900804), the National Natural Science Foundation of China (Nos. 52109063), and the Fundamental Research Funds for the Central Universities (No. 2042021kf0052).

Data Availability Statement

The datasets generated during and/or analyzed during the current study are not publicly available due to the confidential nature of the data but are available from the corresponding author upon reasonable request.

Conflicts of Interest

The authors declare no conflict of interest.

Appendix A

Table A1. Ammonium nitrogen (NH4+-N) yield, contribution, and flow weighted mean concentration of different treatments and different dates during the snowmelt process (GS—gentle slope; SS—steep slope; HS—high snow; LS—low snow; HSW—high soil water; LSW—low soil water).
ParameterTreatmentsNH4+-N Flow Weighted Mean NH4+-N Concentration (mg/L)
Yield (mg)R (%)
Mar. 19Mar. 20Mar. 21Mar. 22TotalMar. 19Mar. 20Mar. 21Mar. 22
SnowmeltSS_Snowmelt54.8 ± 11.81000001.9 ± 0.41.9 ± 0.4---
GS_Snowmelt50.0 ± 13.06238001.7 ± 0.22.3 ± 0.21.1 ± 0.2--
Surface runoffSS_HS_HSW24.9 ± 1.94151800.8 ± 0.00.8 ± 0.00.7 ± 0.01.1 ± 0.1-
SS_LS_HSW9.7 ± 3.78218001.0 ± 0.10.9 ± 0.01.9 ± 0.2--
SS_LS_LSW9.3 ± 2.0937000.9 ± 0.10.9 ± 0.12.4 ± 0.3--
GS_HS_HSW26.2 ± 11.517414200.7 ± 0.11.2 ± 0.10.8 ± 0.00.6 ± 0.1-
GS_LS_HSW2.3 ± 1.35446001.2 ± 0.21.0 ± 0.11.5 ± 0.3--
GS_LS_LSW2.1 ± 1.4919001.0 ± 0.11.0 ± 0.02.7 ± 0.0--
Subsurface flowSS_HS_HSW2.2 ± 2.10791830.6 ± 0.1-0.8 ± 0.10.3 ± 0.00.3 ± 0.0
SS_LS_HSW0.0 ± 0.01000000.3 ± 0.00.3 ± 0.0---
SS_LS_LSW2.0 ± 1.41000001.0 ± 0.21.0. ± 0.2---
GS_HS_HSW0---------
GS_LS_HSW0---------
GS_LS_LSW0---------
Total runoffSS_HS_HSW27.0 ± 3.53853900.8 ± 0.0.0.8 ± 0.00.7 ± 0.01.4 ± 0.20.3 ± 0.0
SS_LS_HSW9.7 ± 3.78218001.0 ± 0.10.9 ± 0.01.9 ± 0.2--
SS_LS_LSW11.3 ± 2.9946000.9 ± 0.10.9 ± 0.12.4 ± 0.3--
GS_HS_HSW26.2 ± 11.517414200.7 ± 0.11.2 ± 0.10.8 ± 0.00.6 ± 0.1
GS_LS_HSW2.3 ± 1.35446001.2 ± 0.21.0 ± 0.11.5 ± 0.3--
GS_LS_LSW2.1 ± 1.4919001.0 ± 0.11.0 ± 0.02.7 ± 0.0--
Table A2. Nitrate nitrogen (NO3-N) yield, contribution, and flow weighted mean concentration of different treatments and different dates during the snowmelt process (GS—gentle slope; SS—steep slope; HS—high snow; LS—low snow; HSW—high soil water; LSW—low soil water).
ParameterTreatmentsNO3-NFlow Weighted Mean NO3-N Concentration (mg/L)
Yield (mg)R (%)
Mar. 19Mar. 20Mar. 21Mar. 22TotalMar. 19Mar. 20Mar. 21Mar. 22
SnowmeltSS_Snowmelt88.4 ± 14.31000003.1 ± 0.43.1 ± 0.4---
GS_Snowmelt86.5 ± 23.58020002.9 ± 0.55.2 ± 0.41.0 ± 0.1--
Surface runoffSS_HS_HSW45.5 ± 2.332511701.4 ± 0.11.1 ± 0.11.3 ± 0.14.2 ± 0.5-
SS_LS_HSW24.2 ± 6.46634002.7 ± 0.71.8 ± 0.19.0 ± 0.5--
SS_LS_LSW27.5 ± 8.8955002.6 ± 0.22.5 ± 0.25.3 ± 0.3--
GS_HS_HSW59.1 ± 22.514295601.6 ± 0.12.4 ± 0.21.3 ± 0.21.8 ± 0.2-
GS_LS_HSW9.0 ± 7.42872004.8 ± 1.92.1 ± 0.18.0 ± 0.7--
GS_LS_LSW5.5 ± 3.28911002.9 ± 0.82.6 ± 0.49.5 ± 0.0--
Subsurface flowSS_HS_HSW27.6 ± 22.30514188.0 ± 0.2-7.2 ± 0.28.1 ± 0.211.6 ± 0.0
SS_LS_HSW0.1 ± 0.11000004.1 ± 0.04.1 ± 0.0---
SS_LS_LSW10.2 ± 8.91000004.7 ± 0.24.7 ± 0.2---
GS_HS_HSW0---------
GS_LS_HSW0---------
GS_LS_LSW0---------
Total runoffSS_HS_HSW73.2 ± 23.720512632.0 ± 0.41.1 ± 0.11.9 ± 0.412.3 ± 1.411.6 ± 0.0
SS_LS_HSW24.3 ± 6.46634002.7 ± 0.71.8 ± 0.19.0 ± 0.5--
SS_LS_LSW37.7 ± 15.4982002.9 ± 0.42.9 ± 0.45.3 ± 0.3--
GS_HS_HSW59.1 ± 22.514295601.6 ± 0.12.4 ± 0.21.3 ± 0.21.8 ± 0.2-
GS_LS_HSW9.0 ± 7.42872004.8 ± 1.92.1 ± 0.18.0 ± 0.7--
GS_LS_LSW5.5 ± 3.28911002.9 ± 0.82.6 ± 0.49.5 ± 0.0--

References

  1. Hundey, E.J.; Russell, S.D.; Longstaffe, F.J.; Moser, K.A. Agriculture causes nitrate fertilization of remote alpine lakes. Nat. Commun. 2016, 7, 10571. [Google Scholar] [CrossRef] [PubMed] [Green Version]
  2. Mao, W.; Zhao, X.; Zhang, T.; Sun, Z.; Li, Y.; Smith, M.D. Divergent interactive impacts on productivity and functional diversity from fluctuated snowfall and continuous nitrogen pollution within Inner Mongolian. Sci. Total Environ. 2020, 704, 135443. [Google Scholar] [CrossRef] [PubMed]
  3. Xie, L.; Gao, X.; Liu, Y.; Yang, B.; Wang, B.; Zhao, J.; Xing, Q. Atmospheric wet deposition serves as an important nutrient supply for coastal ecosystems and fishery resources: Insights from a mariculture area in North China. Mar. Pollut. Bull. 2022, 182, 114036. [Google Scholar] [CrossRef]
  4. Zhao, Q.; Chang, D.; Wang, K.; Huang, J. Patterns of nitrogen export from a seasonal freezing agricultural watershed during the thawing period. Sci. Total. Environ. 2017, 599, 442–450. [Google Scholar] [CrossRef]
  5. Zhao, Q.; Guo, C.; Zeng, Q.; Zhao, H.; Liu, Y.; Zhang, J.; Huang, J.; Wu, J. Nitrogen migration paths and source areas at different snowmelt periods in a seasonal freezing agricultural watershed. J. Hydrol. Reg. Stud. 2022, 41, 101083. [Google Scholar] [CrossRef]
  6. Jiang, R.; Woli, K.P.; Kuramochi, K.; Hayakawa, A.; Shimizu, M.; Hatano, R. Hydrological process controls on nitrogen export during storm events in an agricultural watershed. Soil Sci. Plant Nutr. 2010, 56, 72–85. [Google Scholar] [CrossRef] [Green Version]
  7. Liu, K.; Elliott, J.A.; Lobb, D.A.; Flaten, D.N.; Yarotski, J. Critical Factors Affecting Field-Scale Losses of Nitrogen and Phosphorus in Spring Snowmelt Runoff in the Canadian Prairies. J. Environ. Qual. 2013, 42, 484–496. [Google Scholar] [CrossRef]
  8. Pittman, F.; Mohammed, A.; Cey, E. Effects of antecedent moisture and macroporosity on infiltration and water flow in frozen soil. Hydrol. Process. 2020, 34, 795–809. [Google Scholar] [CrossRef]
  9. Zaremehrjardy, M.; Victor, J.; Park, S.; Smerdon, B.; Alessi, D.S.; Faramarzi, M. Assessment of snowmelt and groundwater-surface water dynamics in mountains, foothills, and plains regions in northern latitudes. J. Hydrol. 2022, 606, 127449. [Google Scholar] [CrossRef]
  10. Macrae, M.L.; English, M.C.; Schiff, S.L.; Stone, M. Influence of antecedent hydrologic conditions on patterns of hydrochemical export from a first-order agricultural watershed in Southern Ontario, Canada. J. Hydrol. 2010, 389, 101–110. [Google Scholar] [CrossRef]
  11. Wang, X.; Wang, C.; Wang, X.; Huo, Z. Response of soil compaction to the seasonal freezing-thawing process and the key controlling factors. Catena 2020, 184, 104247. [Google Scholar] [CrossRef]
  12. Ireson, A.M.; van der Kamp, G.; Ferguson, G.; Nachshon, U.; Wheater, H.S. Hydrogeological processes in seasonally frozen northern latitudes: Understanding, gaps and challenges. Hydrogeol. J. 2013, 21, 53–66. [Google Scholar] [CrossRef]
  13. Appels, W.M.; Coles, A.E.; McDonnell, J.J. Infiltration into frozen soil: From core-scale dynamics to hillslope-scale connectivity. Hydrol. Process. 2018, 32, 66–79. [Google Scholar] [CrossRef]
  14. Sexstone, G.A.; Driscoll, J.M.; Hay, L.E.; Hammond, J.C.; Barnhart, T.B. Runoff sensitivity to snow depletion curve representation within a continental scale hydrologic model. Hydrol. Process. 2020, 34, 2365–2380. [Google Scholar] [CrossRef]
  15. Dou, T.; Xiao, C.; Liu, J.; Wang, Q.; Pan, S.; Su, J.; Yuan, X.; Ding, M.; Zhang, F.; Xue, K.; et al. Trends and spatial variation in rain-on-snow events over the Arctic Ocean during the early melt season. Cryosphere 2021, 15, 883–895. [Google Scholar] [CrossRef]
  16. Zhao, Q.; Tan, X.; Zeng, Q.; Zhao, H.; Wu, J.-W.; Huang, J.-S. Combined effects of temperature and precipitation on the spring runoff generation process in a seasonal freezing agricultural watershed. Environ. Earth Sci. 2021, 80, 490. [Google Scholar] [CrossRef]
  17. Rasmus, S.; Kivinen, S.; Irannezhad, M. Basal ice formation in snow cover in Northern Finland between 1948 and 2016. Environ. Res. Lett. 2018, 13, 114009. [Google Scholar] [CrossRef]
  18. Jeannotte, T.L.; Mahmood, T.H.; Vandeberg, G.S.; Matheney, R.K.; Hou, X.; Van Hoy, D.F. Impacts of cold region hydroclimatic variability on phosphorus exports: Insights from concentration-discharge relationship. J. Hydrol. 2020, 591, 125312. [Google Scholar] [CrossRef]
  19. Rey, D.M.; Hinckley, E.S.; Walvoord, M.A.; Singha, K. Integrating observations and models to determine the effect of seasonally frozen ground on hydrologic partitioning in alpine hillslopes in the Colorado Rocky Mountains, USA. Hydrol. Process. 2021, 35, e14374. [Google Scholar] [CrossRef]
  20. Mohammed, A.A.; Cey, E.E.; Hayashi, M.; Callaghan, M.V. Simulating preferential flow and snowmelt partitioning in seasonally frozen hillslopes. Hydrol. Process. 2021, 35, e14277. [Google Scholar] [CrossRef]
  21. Zhao, Q.; Wu, C.; Wang, K.; Chang, D.; Huang, J. In situ experiment on change law of soil mineral nitrogen availability in seasonal freezing agricultural areas. Trans. Chin. Soc. Agric. Eng. 2019, 17, 140–146. [Google Scholar]
  22. Jiang, N.; Juan, Y.; Tian, L.; Chen, X.; Sun, W.; Chen, L. Soil Water Contents Control the Responses of Dissolved Nitrogen Pools and Bacterial Communities to Freeze-Thaw in Temperate Soils. BioMed Res. Int. 2020, 2020, 6867081. [Google Scholar] [CrossRef] [Green Version]
  23. Zhao, Q.; Wu, J.; Guo, C.; Zhang, J.; Wang, X.; Liu, Y.; Zhao, H.; Zhang, R. Effects of Freezing–Thawing Processes on Net Nitrogen Mineralization in Salinized Farmland Soil. Agronomy 2022, 12, 2986. [Google Scholar] [CrossRef]
  24. Juan, Y.; Jiang, N.; Tian, L.; Chen, X.; Sun, W.; Chen, L. Effect of Freeze-Thaw on a Midtemperate Soil Bacterial Community and the Correlation Network of Its Members. BioMed Res. Int. 2018, 2018, 8412429. [Google Scholar] [CrossRef]
  25. Juan, Y.; Tian, L.; Sun, W.; Qiu, W.; Curtin, D.; Gong, L.; Liu, Y. Simulation of soil freezing-thawing cycles under typical winter conditions: Implications for nitrogen mineralization. J. Soils Sediments 2020, 20, 143–152. [Google Scholar] [CrossRef]
  26. Sebestyen, S.D.; Boyer, E.W.; Shanley, J.B.; Kendall, C.; Doctor, D.H.; Aiken, G.R.; Ohte, N. Sources, transformations, and hydrological processes that control stream nitrate and dissolved organic matter concentrations during snowmelt in an upland forest. Water Resour. Res. 2008, 44, W12410. [Google Scholar] [CrossRef]
  27. Han, C.-W.; Xu, S.-G.; Liu, J.-W.; Lian, J.-J. Nonpoint-source nitrogen and phosphorus behavior and modeling in cold climate: A review. Water Sci. Technol. 2010, 62, 2277–2285. [Google Scholar] [CrossRef]
  28. Iwata, Y.; Yanai, Y.; Yazaki, T.; Hirota, T. Effects of a snow-compaction treatment on soil freezing, snowmelt runoff, and soil nitrate movement: A field-scale paired-plot experiment. J. Hydrol. 2018, 567, 280–289. [Google Scholar] [CrossRef]
  29. Li, G.; Wang, Z.S.; Huang, N. A Snow Distribution Model Based on Snowfall and Snow Drifting Simulations in Mountain Area. J. Geophys. Res. Atmos. 2018, 123, 7193–7203. [Google Scholar] [CrossRef]
  30. Harms, T.; Chanasyk, D.S. Variability of Snowmelt Runoff and Soil Moisture Recharge. Hydrol. Res. 1998, 29, 179–198. [Google Scholar] [CrossRef]
  31. Hinckley, E.-L.S.; Barnes, R.T.; Anderson, S.P.; Williams, M.W.; Bernasconi, S.M. Nitrogen retention and transport differ by hillslope aspect at the rain-snow transition of the Colorado Front Range. J. Geophys. Res. Biogeosci. 2014, 119, 1281–1296. [Google Scholar] [CrossRef]
  32. Bao, S. Soil Agrochemical Analysis, 3rd ed.; China Agriculture Press: Beijing, China, 2000. [Google Scholar]
  33. Veldhuijsen, S.B.M.; de Kok, R.J.; Stigter, E.E.; Steiner, J.F.; Saloranta, T.M.; Immerzeel, W.W. Spatial and temporal patterns of snowmelt refreezing in a Himalayan catchment. J. Glaciol. 2022, 68, 369–389. [Google Scholar] [CrossRef]
  34. Staub, B.; Delaloye, R. Using Near-Surface Ground Temperature Data to Derive Snow Insulation and Melt Indices for Mountain Permafrost Applications. Permafr. Periglac. Process. 2017, 28, 237–248. [Google Scholar] [CrossRef]
  35. Wang, Y.; Yao, S.-W.; Yang, H.-W. A fractal derivative model for snow’s thermal insulation property. Therm. Sci. 2019, 23, 2351–2354. [Google Scholar] [CrossRef]
  36. Henry, H.A.L. Climate change and soil freezing dynamics: Historical trends and projected changes. Clim. Chang. 2008, 87, 421–434. [Google Scholar] [CrossRef]
  37. Lyu, Z.; Zhuang, Q. Quantifying the Effects of Snowpack on Soil Thermal and Carbon Dynamics of the Arctic Terrestrial Ecosystems. J. Geophys. Res. Biogeosci. 2018, 123, 1197–1212. [Google Scholar] [CrossRef]
  38. Zhang, T.; Zhang, J.; Fan, W.; Yang, H.; Qiao, C.; Xu, Z. Spatial analysis on water storage capacity of slope soil after snow melting in Manas river basin. J. Arid. Land Resour. Environ. 2022, 36, 140–146. [Google Scholar]
  39. Ming, F.; Pei, W.; Zhang, M.; Chen, L. A hydraulic conductivity model of frozen soils with the consideration of water films. Eur. J. Soil Sci. 2022, 73, e13210. [Google Scholar] [CrossRef]
  40. Watanabe, K.; Osada, Y. Simultaneous measurement of unfrozen water content and hydraulic conductivity of partially frozen soil near 0 degrees C. Cold Reg. Sci. Technol. 2017, 142, 79–84. [Google Scholar] [CrossRef]
  41. Moghadas, S.; Gustafsson, A.; Viklander, P.; Marsalek, J.; Viklander, M. Laboratory study of infiltration into two frozen engineered (sandy) soils recommended for bioretention. Hydrol. Process. 2016, 30, 1251–1264. [Google Scholar] [CrossRef]
  42. Zhao, Q.; Wu, C.; Luo, P.; Wang, K.; Li, H.; Huang, J. Variation and influencing factors of soil temperature and moisture during freezing and thawing period in a seasonal freezing agricultural area in Northeast China. J. Glaciol. Geocryol. 2020, 42, 986–995. [Google Scholar]
  43. Sveen, S.-E.; Nguyen, H.T.; Sørensen, B.R. Soil Moisture Variations in Frozen Ground Subjected to Hydronic Heating. J. Cold Reg. Eng. 2020, 34, 04020025. [Google Scholar] [CrossRef]
  44. Costa, D.; Pomeroy, J.; Wheater, H. A numerical model for the simulation of snowpack solute dynamics to capture runoff ionic pulses during snowmelt: The PULSE model. Adv. Water Resour. 2018, 122, 37–48. [Google Scholar] [CrossRef]
  45. Lilbæk, G.; Pomeroy, J.W. Ion enrichment of snowmelt runoff water caused by basal ice formation. Hydrol. Process. 2008, 22, 2758–2766. [Google Scholar] [CrossRef]
  46. Costa, D.; Pomeroy, J.W.; Brown, T.; Baulch, H.; Elliott, J.; Macrae, M. Advances in the simulation of nutrient dynamics in cold climate agricultural basins: Developing new nitrogen and phosphorus modules for the Cold Regions Hydrological Modelling Platform. J. Hydrol. 2021, 603, 126901. [Google Scholar] [CrossRef]
  47. Costa, D.; Roste, J.; Pomeroy, J.; Baulch, H.; Elliott, J.; Wheater, H.; Westbrook, C. A modelling framework to simulate field-scale nitrate response and transport during snowmelt: The WINTRA model. Hydrol. Process. 2017, 31, 4250–4268. [Google Scholar] [CrossRef]
  48. Sieczka, A.; Koda, E.; Miszkowska, A.; Osinski, P. Identification of Processes and Migration Parameters for Conservative and Reactive Contaminants in the Soil-Water Environment. In Proceedings of the 8th International Congress on Environmental Geotechnics Volume 1: Towards a Sustainable Geoenvironment 8th; Zhan, L., Chen, Y., Bouazza, A., Eds.; Springer: Singapore, 2019; pp. 551–559. [Google Scholar]
  49. Wang, S.; Chen, J. Study on the integrated distribution coefficient of ammonium N migration in layered soil. Environ. Sci. Pollut. Res. 2020, 27, 25340–25352. [Google Scholar] [CrossRef] [PubMed]
  50. Linggi, L.; Berlin, M.; Mallik, M.; Roy, S.; Natarajan, N.; Vasudevan, M. Feasibility investigation of adsorptive removal of NH4+ and NO3 species from clayey aquifer using special soils. Environ. Dev. Sustain. 2021, 23, 6749–6768. [Google Scholar] [CrossRef]
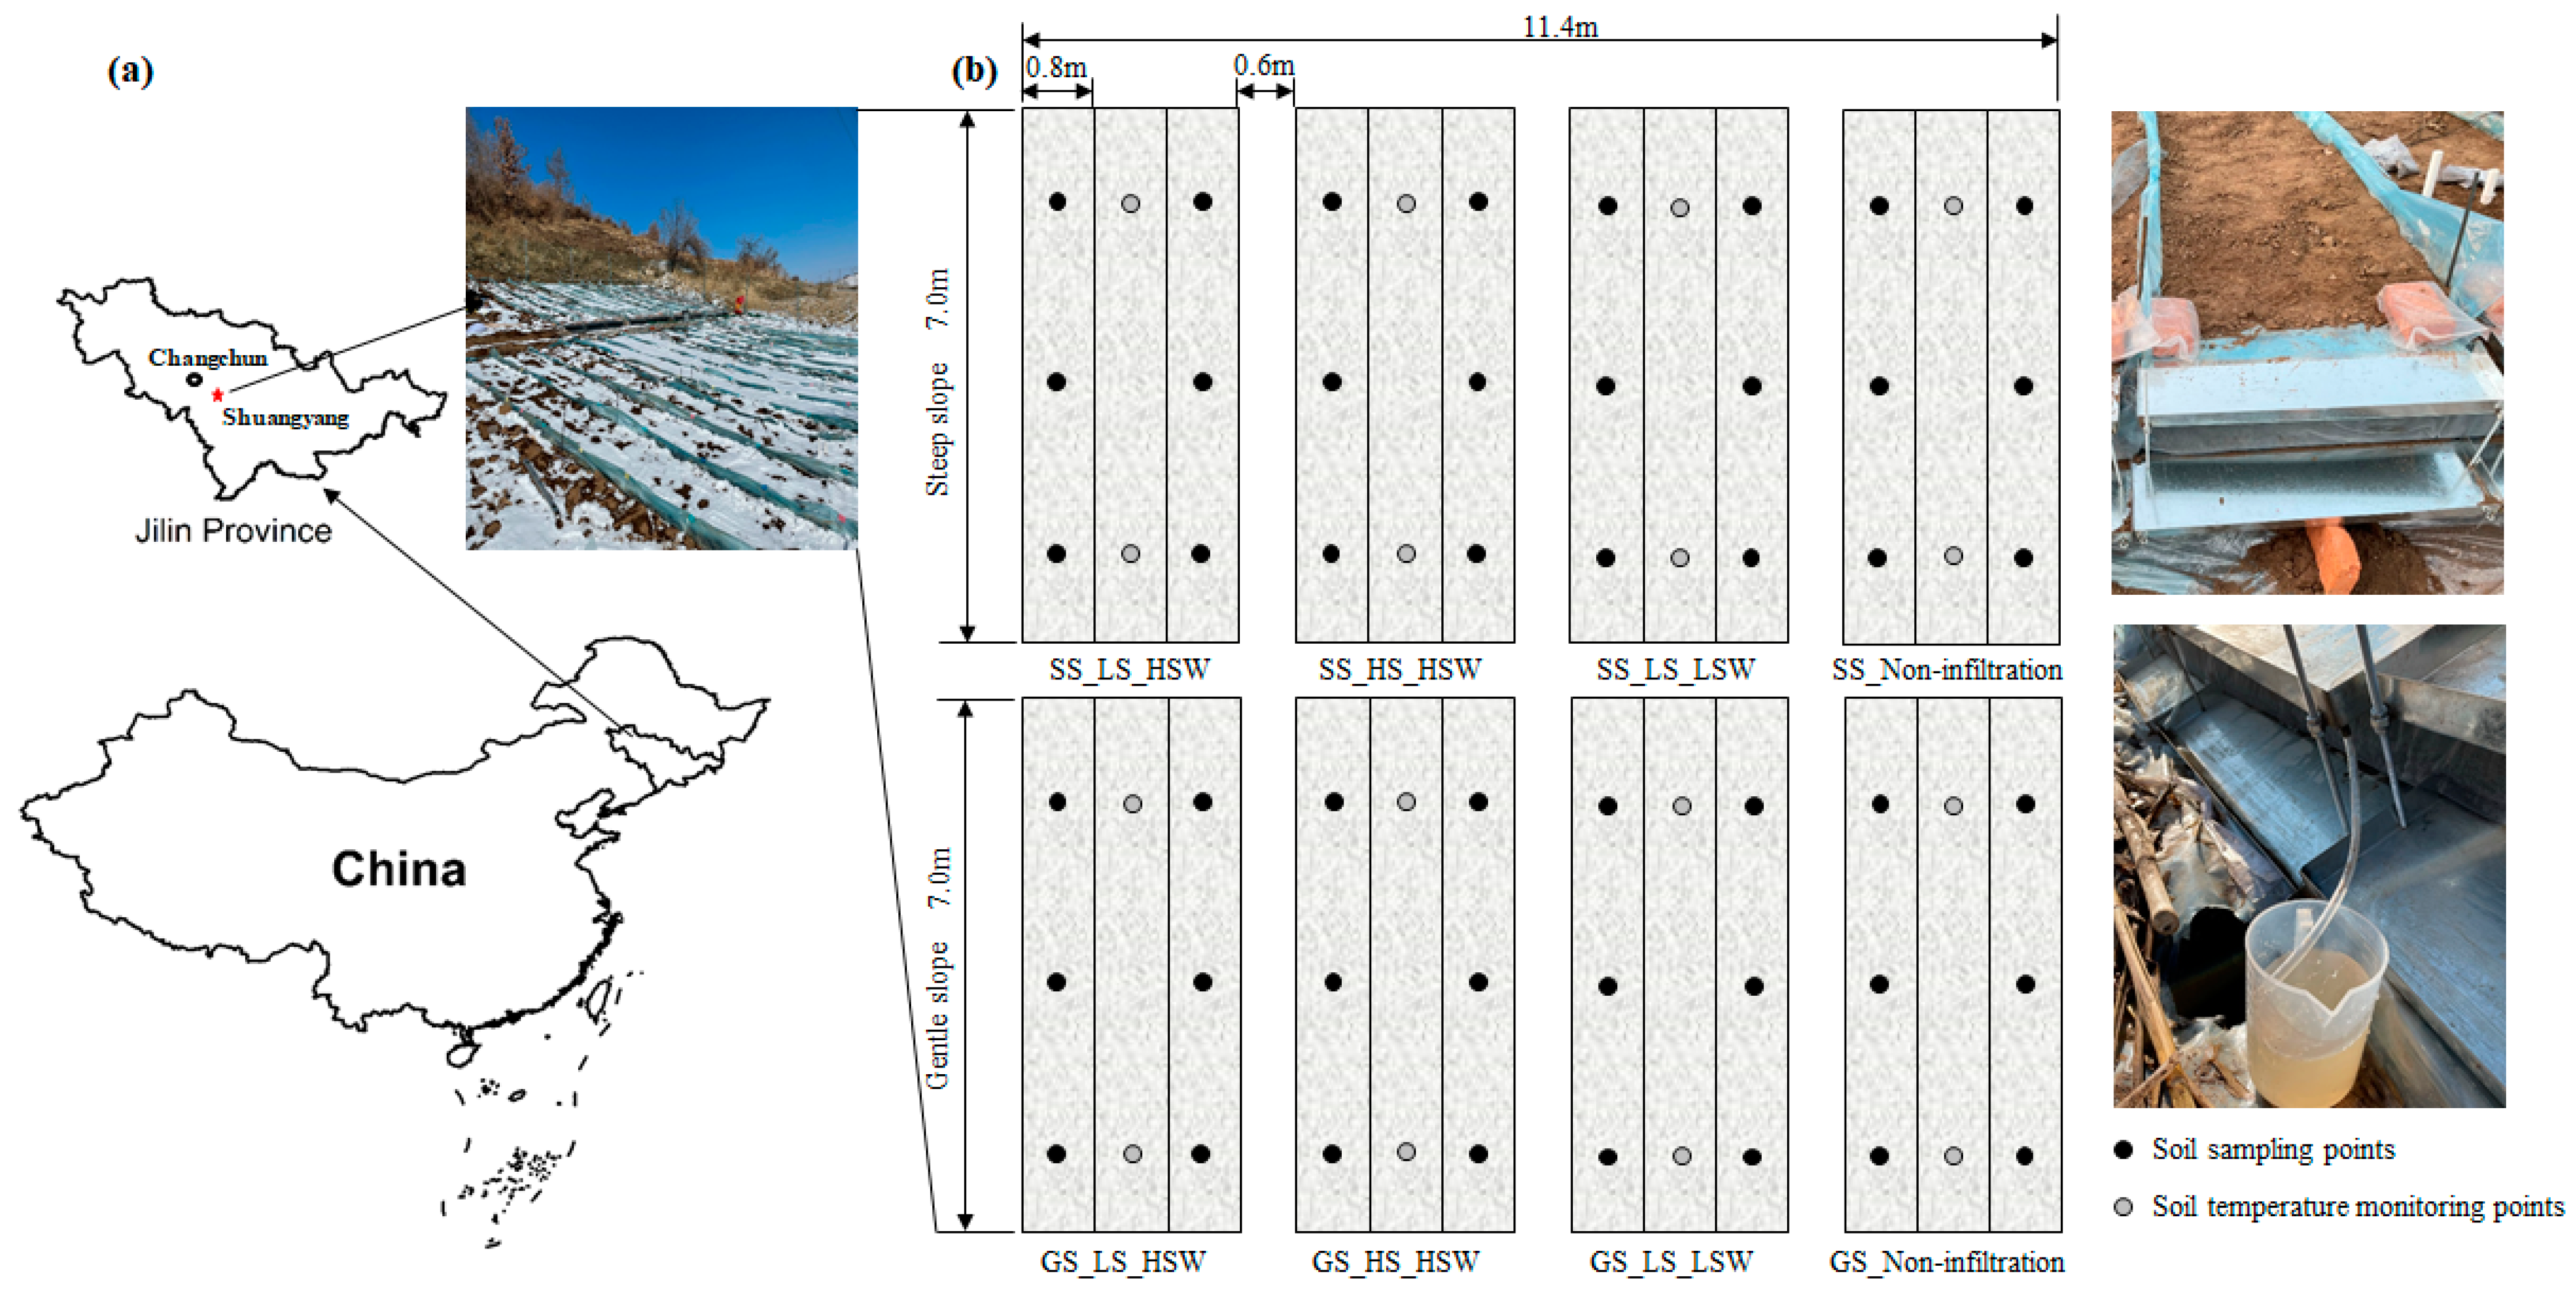
Figure 1. Map of study region and experimental plots: (a) Location of the experimental plots; (b) Arrangement and construction of experimental runoff plots (GS—gentle slope; SS—steep slope; LS—low snow; HS—high snow; LSW—low soil water; HSW—high soil water).
Agronomy 13 00350 g001
Figure 2. Soil temperature variation at different depths during the snowmelt process (a. Soil surface; b. 5 cm; c. 10 cm).
Agronomy 13 00350 g002
Figure 3. Variation in (a) snow water equivalent and temperature, water generation processes through (b) surface runoff, (c) subsurface runoff, and (d) total runoff, during the snowmelt event.
Agronomy 13 00350 g003
Figure 4. The ratio of (a) Runoff to snow water equivalent (SWE) and (b) Surface/subsurface runoff to total runoff (red: surface runoff; blue: subsurface runoff) in different treatments (GS—gentle slope; SS—steep slope; HS—high snow; LS—low snow; HSW—high soil water; LSW—low soil water).
Agronomy 13 00350 g004
Figure 5. Variation in ammonium nitrogen (NH4+-N) yield through (a) surface runoff, (b) subsurface runoff, and (c) total runoff during the snowmelt event.
Agronomy 13 00350 g005
Figure 6. Variation in nitrate nitrogen (NO3-N) yield through (a) surface runoff, (b) subsurface runoff, and (c) total runoff during the snowmelt event.
Agronomy 13 00350 g006
Figure 7. The ratio of (a,c) nitrogen (ammonium nitrogen: NH4+-N; nitrate nitrogen: NO3-N) yield in total runoff to nitrogen stored in snow and (b,d) nitrogen yield through surface/subsurface runoff to yield through total runoff (red: surface runoff; blue: subsurface runoff) in different treatments (GS—gentle slope; SS—steep slope; HS—high snow; LS—low snow; HSW—high soil water; LSW—low soil water).
Agronomy 13 00350 g007
Figure 8. Coefficients of principal component regression between slope, snow water equivalent (SWE), soil water content (SWC), surface soil water content (SWC_S), subsurface soil water content (SWC_SB) and runoff, surface runoff, subsurface runoff, ratio of surface runoff to runoff, and runoff to SWE.
Agronomy 13 00350 g008
Figure 9. Relationship of average soil temperature during the snowmelt process and corresponding soil water content (SWC) before snowmelt at depths of 5 cm (blue) and 10 cm (red).
Agronomy 13 00350 g009
Figure 10. Coefficients of principal component regression between slope, snow water equivalent (SWE), soil water content (SWC), surface soil water content (SWC_S), subsurface soil water content (SWC_SB), surface soil nitrogen content (S_ NH4+-N _S, S_ NO3-N _S), and nitrogen yielded through runoff (Y_N), surface runoff (Y_N_S), subsurface runoff (Y_N_SB), flow-weighted mean nitrogen concentration of runoff (C_N), surface runoff (C_N_S), ratio of nitrogen in surface runoff to that in runoff (Y_N_S/Y_N), and ratio of nitrogen in runoff to that in SWE (Y_N/Snow_N) (a: NH4+-N; b: NO3-N).
Agronomy 13 00350 g010
Table 1. Snow water equivalent (SWE) and soil water content (SWC) before snowmelt.
TreatmentsSWE (g)SWC (%)
0–20 cm0–5 cm5–20 cm
SS_HS_HSW66,677.3 ± 1935.824.2 ± 1.621.0 ± 2.125.3 ± 1.4
SS_LS_HSW31,266.7 ± 501.623.3 ± 0.820.8 ± 0.824.1 ± 1.4
SS_LS_LSW33,338.7 ± 211.221.8 ± 0.220.8 ± 1.422.2 ± 0.2
GS_HS_HSW66,546.7 ± 708.825.1 ± 0.519.6 ± 2.027.0 ± 1.4
GS_LS_HSW32,928.0 ± 1123.724.3 ± 2.318.8 ± 3.726.1 ± 1.8
GS_LS_LSW31,770.7 ± 708.823.5 ± 0.220.2 ± 1.824.6 ± 0.3
Table 2. Water yield of different treatments and contribution of different dates during the snowmelt process (GS—gentle slope; SS—steep slope; HS—high snow; LS—low snow; HSW—high soil water; LSW—low soil water).
ParameterTreatmentsWater Yield (g)R (%)
Mar. 19Mar. 20Mar. 21Mar. 22
SnowmeltSS_Snowmelt28,394.0 ± 1516.6100000
GS_Snowmelt29,639.1 ± 4601445600
Surface runoffSS_HS_HSW32,608.5 ± 2207.3415360
SS_LS_HSW9929.4 ± 4164.291900
SS_LS_LSW10,503.5 ± 3494.597300
GS_HS_HSW35,424.1 ± 12,362.91138510
GS_LS_HSW2078.6 ± 1251.8584200
GS_LS_LSW2055.8 ± 1484.897300
Subsurface runoffSS_HS_HSW3496.3 ± 2877.5055406
SS_LS_HSW19.4 ± 27.5100000
SS_LS_LSW2243.1 ± 2023.5100000
GS_HS_HSW0.0----
GS_LS_HSW0.0----
GS_LS_LSW0.0----
Total runoffSS_HS_HSW36,104.9 ± 4776.4375391
SS_LS_HSW9948.8 ± 4175.991900
SS_LS_LSW12,746.6 ± 442598200
GS_HS_HSW35,424.1 ± 12,362.91138510
GS_LS_HSW2078.6 ± 1251.8584200
GS_LS_LSW2055.8 ± 1484.897300
Table 3. Nitrogen (ammonium nitrogen: NH4+-N; nitrate nitrogen: NO3-N) in snow and extracted soil water before snowmelt.
TreatmentsSnow_N (mg)S_NH4+-N (mg/L)S_NO3-N (mg/L)
NH4+-NNO3-N0–20 cm0–5 cm5–20 cm0–20 cm0–5 cm5–20 cm
SS_HS_HSW105.9 ± 3.1176.8 ± 5.14.3 ± 0.57.6 ± 0.13.2 ± 0.74.1 ± 0.84.2 ± 0.84.1 ± 0.8
SS_LS_HSW49.7 ± 0.882.9 ± 1.35.2 ± 0.96.9 ± 0.54.7 ± 1.03.6 ± 1.24.7 ± 2.53.3 ± 0.8
SS_LS_LSW53.0 ± 0.388.4 ± 0.64.3 ± 1.38.1 ± 3.93.0 ± 0.47.7 ± 2.410.0 ± 2.96.9 ± 2.3
GS_HS_HSW105.7 ± 1.1176.4 ± 1.95.4 ± 0.66.7 ± 0.85.0 ± 0.57.7 ± 1.98.6 ± 1.97.4 ± 1.9
GS_LS_HSW52.3 ± 1.887.2 ± 3.05.3 ± 0.25.8 ± 0.55.1 ± 0.48.2 ± 0.58.9 ± 0.78.0 ± 0.9
GS_LS_LSW50.5 ± 1.184.2 ± 1.94.2 ± 0.05.0 ± 1.23.9 ± 0.49.6 ± 1.914.0 ± 1.78.1 ± 3.1
Table 4. Proportion of water and nitrogen export through surface runoff during the early snowmelt period.
DateSlopeWater Yield
(%)
NH4+-N (%)NO3-N (%)
Snowmelt WaterSurface RunoffSnowmelt WaterSurface Runoff
Mar. 19Gentle 1013.411.113.711.4
3038.831.439.531.8
Steep1014.613.114.212.2
3042.134.740.730.4
Mar. 20Gentle1019.414.419.314.3
3047.237.346.237.0
Steep10-16.8-13.7
30-41.6-34.8
Mar. 21Gentle10-10.2-12.7
30-30.3-33.8
Steep 10-24.0-16.5
30-51.6-40.7
Table 5. Differences in soil water content at different soil depths before and after snowmelt.
Soil Depth (cm)Changes of Soil Water Content (%)
SS_HS_HSWSS_LS_HSWSS_LS_LSWGS_HS_HSWGS_LS_HSWGS_LS_LSW
0–5−0.3 ± 1.9−2.7 ± 1.2−2.8 ± 1.02.0 ± 1.01.3 ± 2.50.7 ± 2.5
5–10−3.5 ± 0.3−3.6 ± 1.5−5.0 ± 0.7−6.0 ± 1.8−5.5 ± 0.8−2.2 ± 0.5
10–15−4.6 ± 2.1−6.0 ± 2.4−1.4 ± 0.8−0.5 ± 0.5−3.0 ± 0.1−2.2 ± 2.9
15–20−0.5 ± 3.00.6 ± 0.11.5 ± 1.4−2.1 ± 3.7−6.2 ± 4.50.2 ± 0.6
Disclaimer/Publisher’s Note: The statements, opinions and data contained in all publications are solely those of the individual author(s) and contributor(s) and not of MDPI and/or the editor(s). MDPI and/or the editor(s) disclaim responsibility for any injury to people or property resulting from any ideas, methods, instructions or products referred to in the content.