1. Introduction
Mainly bread wheat (
Triticum aestivum) is grown all over the world, including Europe and Latvia, and the largest bread wheat-growing area is under winter wheat (20 656.14 thousand ha in Europe in 2021,
https://ec.europa.eu/ (accessed on 18 November 2022); 448.7 thousand ha in Latvia in 2022,
https://stat.gov.lv/ (accessed on 18 November 2022)). The winter wheat yield is variable depending on the country (climate effect) and annual meteorological conditions, e.g., in the European Union in 2022, the average winter wheat yield (bread wheat and spelt wheat (
T. spelta) yields are reported both together by the Eurostat database) varied from 1.83 t ha
−1 to 10.87 t ha
−1 depending on the country. In Latvia in 2022, the average winter wheat yield was 4.36 t ha
−1, and exceeded 5.0 t ha
−1 in some very favourable years, reaching even 7.0–9.0 t ha
−1 in the best farms. The provision of all agrometeorological factors (water, photosynthetically active radiation, nutrients, soil conditions, suitable cultivar, etc.) as well as disease control is equally important for obtaining high winter wheat yields with good grain quality. Several leaf and ear diseases have been recognized as an important wheat-yield-limiting factor globally: tan spot (caused by
Pyrenophora tritici-repentis), e.g., [
1,
2,
3,
4]; Septoria leaf blotch (caused by
Zymoseptoria tritici), e.g., [
2,
4,
5,
6]; Septoria nodorum blotch (caused by
Parastagonospora nodorum), e.g., [
7]; powdery mildew (caused by
Blumeria graminis), e.g., [
4,
8]; leaf rust (caused by
Puccinia recondita; previously
Puccinia triticina), e.g., [
8]; stripe rust (caused by
P. striiformis), e.g., [
4]; and Fusarium head blight (caused by
Fusarium spp.), e.g., [
6]. Which disease will spread more widely and will be more harmful depends on the specific site and year conditions. In Latvia, tan spot and Septoria leaf blotch have been recognized as the most important wheat leaf diseases [
9]. In addition to yield loss, diseases can also cause grain quality decrease [
10]. The pressing target among farmers in Latvia is not whether to use a fungicide for winter wheat, but real time application (when and how often) has been of great importance. Nevertheless, after the data analysis of 350 field trials in Sweden, it was found that the use of fungicide was profitable in 188 cases, but was not profitable in 162 cases [
11]. It is fairly often concluded that the application of fungicides might not be recommended at all in dry years [
5,
8], that it is more effective in years with sufficient water provision [
4], and that one spraying can provide similar efficacy compared with two or three applications [
6,
8,
12]. These different effects have been obtained in diverse climatic conditions when different diseases prevailed, different fungicides were applied, different cultivars were used, and also the rates of fertilization with nitrogen (N) were different. Several research studies show a strong effect of the fungicide application (F) × nitrogen fertilization rate (N) interaction on grain yield, when higher yields were obtained using the most intensive fungicide application strategy together with the highest N rates [
1,
2,
3,
13]. However, there are also studies in which N × F interaction effect on grain yield has not been established [
14], and even in Brinkman et al’s [
13] study, it did not appear in one out of the nine locations. The literature also shows that the chemical indicators of wheat grain quality were not affected by the F × N interaction [
15].
It is observed that producers rarely make fungicide application decisions based solely on expected yield or yield quality losses due to disease outbreaks. Often, the decision is related to the farmer’s attitude towards risk, the use of pesticides in general, the farm’s financial situation, and other reasons. In addition, no farm has an unsprayed control variant, and if production results show a profit, the unnecessary fungicide application goes unnoticed even financially. However, the fact that fungicides should have been sprayed, but were not, is often obvious [
11]. In the most important wheat growing region of Latvia, farmers grow winter wheat comparatively intensively, using high N top-dressing rates and fungicides. For a fungicide application or N top-dressing to be cost-effective, it must pay for itself in increased yield and/or quality. Despite the fact that the impact of nitrogen top-dressing and the application of different fungicides at different timings has been studied thoroughly in the world, the results obtained are contradictory and more research in particular conditions is required. As tan spot and Septoria leaf blotch are the most common wheat diseases in the humid and cool climate [
9] of Northern Europe, the triazole (DeMethylation Inhibitor (DMI)) with high efficacy against both diseases was selected in our study—prothioconazole, which was supplemented with spiroxamine (amine, Sterol Biosynthesis Inhibitor (SBI)) in T1 (growth stage (GS) 32–33) treatment and with two active substances from carboxamide group (Succinate Dehydrogenase Inhibitors (SDHI)) in T2 (GS 55–59) treatment; metconazole (DMI) was used in T3 (ear) (GS 63–65) treatment. Therefore, the main objective of this study was to determine the effect of different intensities of fungicide application and N top-dressing rates on winter wheat yield and grain quality. Another objective was to test the hypothesis that an increase in N fertilization rates requires an intensified winter wheat disease control.
Since three trial-years were characterised by shorter or longer periods of drought and heat and a sufficient supply of water was observed only in one year, the hypothesis failed to be proven, but the average four-year yield was significantly affected by both investigated factors. On the other hand, the physical indicators of grain quality were significantly affected by fungicide application, while chemical indicators were significantly affected by increased N top-dressing rates.
2. Materials and Methods
2.1. Trial Site and Studied Factors
Two-factor field experiments with winter wheat (
Triticum aestivum) were carried out at the Research and Study farm “Peterlauki” (56° 31′ N; 23° 42′ E) of the Latvia University of Life Sciences and Technologies for four years (2017/2018–2020/2021). Soil at the site was Epiabruptic Endostagnic Endoprotocalcic Luvisol in the 2017/2018 and 2019/2020, and Cambic Calcisol in the 2018/2019 and 2020/2021 [
16]. Soil reaction (pH
KCL) was 6.4–7.0, the content of P
2O
5 was 118–181 mg kg
−1, the content of K
2O was 122–262 mg kg
−1, and soil organic matter content varied from 29 to 42 g kg
−1 depending on the year (agrochemical data refer to the 0–20 cm soil depth). Winter wheat cultivar ‘Skagen’ (DE) was used. ‘Skagen’ is widely grown in Latvia and is characterised by a high baking quality (elite group) and a comparatively low susceptibility to common leaf diseases (
https://www.bundessortenamt.de/bsa/sorten/beschreibende-sortenlisten/ (accessed on 30 December 2022)). Plot size was 20 m
2 (2 m × 10 m), and treatments were arranged randomly in four replications.
Studied factors were as follows: (A) fungicide application (F, five treatments), and (B) nitrogen top-dressing rate (N, four treatments). In total, 20 variants were studied.
Fungicide application variants:
F0—control, without fungicide application;
F1—half of a full fungicide dose sprayed at GS 55–59 (T2);
F2—a full fungicide dose sprayed at GS 55–59 (T2);
F3—a full fungicide dose split in two treatments: at GS 32–33 (T1), and at GS 55–59 (T2);
F4—two full fungicide doses split in three treatments: half—at GS 32–33 (T1), half—at GS 55–59 (T2), and full—at GS 63–65.
In this study, the full fungicide dose (100%) was taken as the fungicide dose according to the highest recorded dose of the triazole active substance prothioconazole (DMI) per hectare (200 g ha−1) in one treatment. Prothioconazole was selected due to its efficacy against the most spread wheat leaf diseases in Latvia. In the first treatment (T1), protioconazole was applied at 50% of the full dose (100 g ha−1) in combination with the active ingredient spiroxamine (SBI) (187.5 g ha−1), which is intended to control powdery mildew in cereals. In the second treatment (T2), a fungicide, which, in addition to prothioconazole (a half or a full dose according to the scheme), contains the active substances of the carboxamide group (SDHI)—bixafen and fluopyram (both—48.75 g ha−1 in F1, and 97.5 g ha−1 in F2). In the third treatment (T3), a full dose of a fungicide containing the active substance metconazole (DMI) (90 g ha−1) was used against Fusarium head blight.
Nitrogen top-dressing variants which were applied:
N120 kg ha−1, divided into two portions 80 + 40 kg ha−1;
N150 kg ha−1, divided into two portions 80 + 70 kg ha−1;
N180 kg ha−1, divided into three portions 80 + 70 + 30 kg ha−1;
N210 kg ha−1, divided into three portions 80 + 80 + 50 kg ha−1 (further in the text N120, N150, N180, and N210).
The first portion was given at the time of vegetation renewal in spring, the second portion—at GS 31–32, and the third portion—at GS 49–51. Ammonium nitrate (N 34.4%) was used for the first and third portion of top-dressing, and ammonium sulphate (N 21% and S 24% to provide 28.8 kg ha−1 of S) and ammonium nitrate were used for the second portion of top-dressing.
2.2. Crop Management
The agrotechnology used in the trial was typical for the region in production conditions. The pre-crop was always wheat. Traditional soil tillage including ploughing at the depth of 22 cm was used. The rate of basic fertilizer was calculated with the aim to obtain an 8 t ha−1 grain yield, and it was given before sowing: 11–25 kg ha−1 N, 33–66 kg ha−1 P2O5, and K2O depending on the year. Sowing was performed at the optimal time for local conditions (13–27 September depending on the year), and seeds treated with fungicides were used at the rate of 450 (in 2018–2020) to 500 (in 2017) germinable grain m−2. For crop care, herbicides for weed control and plant growth regulators (twice) were applied every year, and insecticides were applied according to the need in 2020 and 2021. Used plant growth regulators were as follows: Cycocel 750 SC (chlormequat chloride, 750 g L−1) 1 L ha−1 at the GS 28–29 and Medax Top SC (calcium prohexadione, 50 g L−1, mepiquat chloride, 300 g L−1) 0.75 L ha−1 at the GS 33–34. The foliar fertilizer YaraVita Gramitrel (Yara International ASA, Oslo, Norway) (N 3.9%, MgO 15.2%, Cu 3.0%, Mn 9.1%, and Zn 4.1%) was applied in spring together with the plant growth regulator. Grain yield was harvested at GS 89–90, using direct combining (25–26 July 2018, 2019, and 2021, and 2 August 2020), and the yield was recalculated at the 100% purity and 14% moisture.
2.3. Observations and Records Made in the Trial
Crop growth stages (GS 11, 21, 31, 32, 33, 37–39, 49, 51, 55, 59, 61–63, 69, 71, 81, 89–90) according to BBCH scale [
17] were recorded every year.
Disease severity (%) was recorded visually five times per season: the whole plant was evaluated at the end of tillering–early stem elongation; three upper leaves were evaluated at flag leaf stage and during heading; two upper leaves were evaluated during the milk stage of maturity. The AUDPC (area under the disease progress curve) was calculated to assess the disease impact during the whole vegetation season [
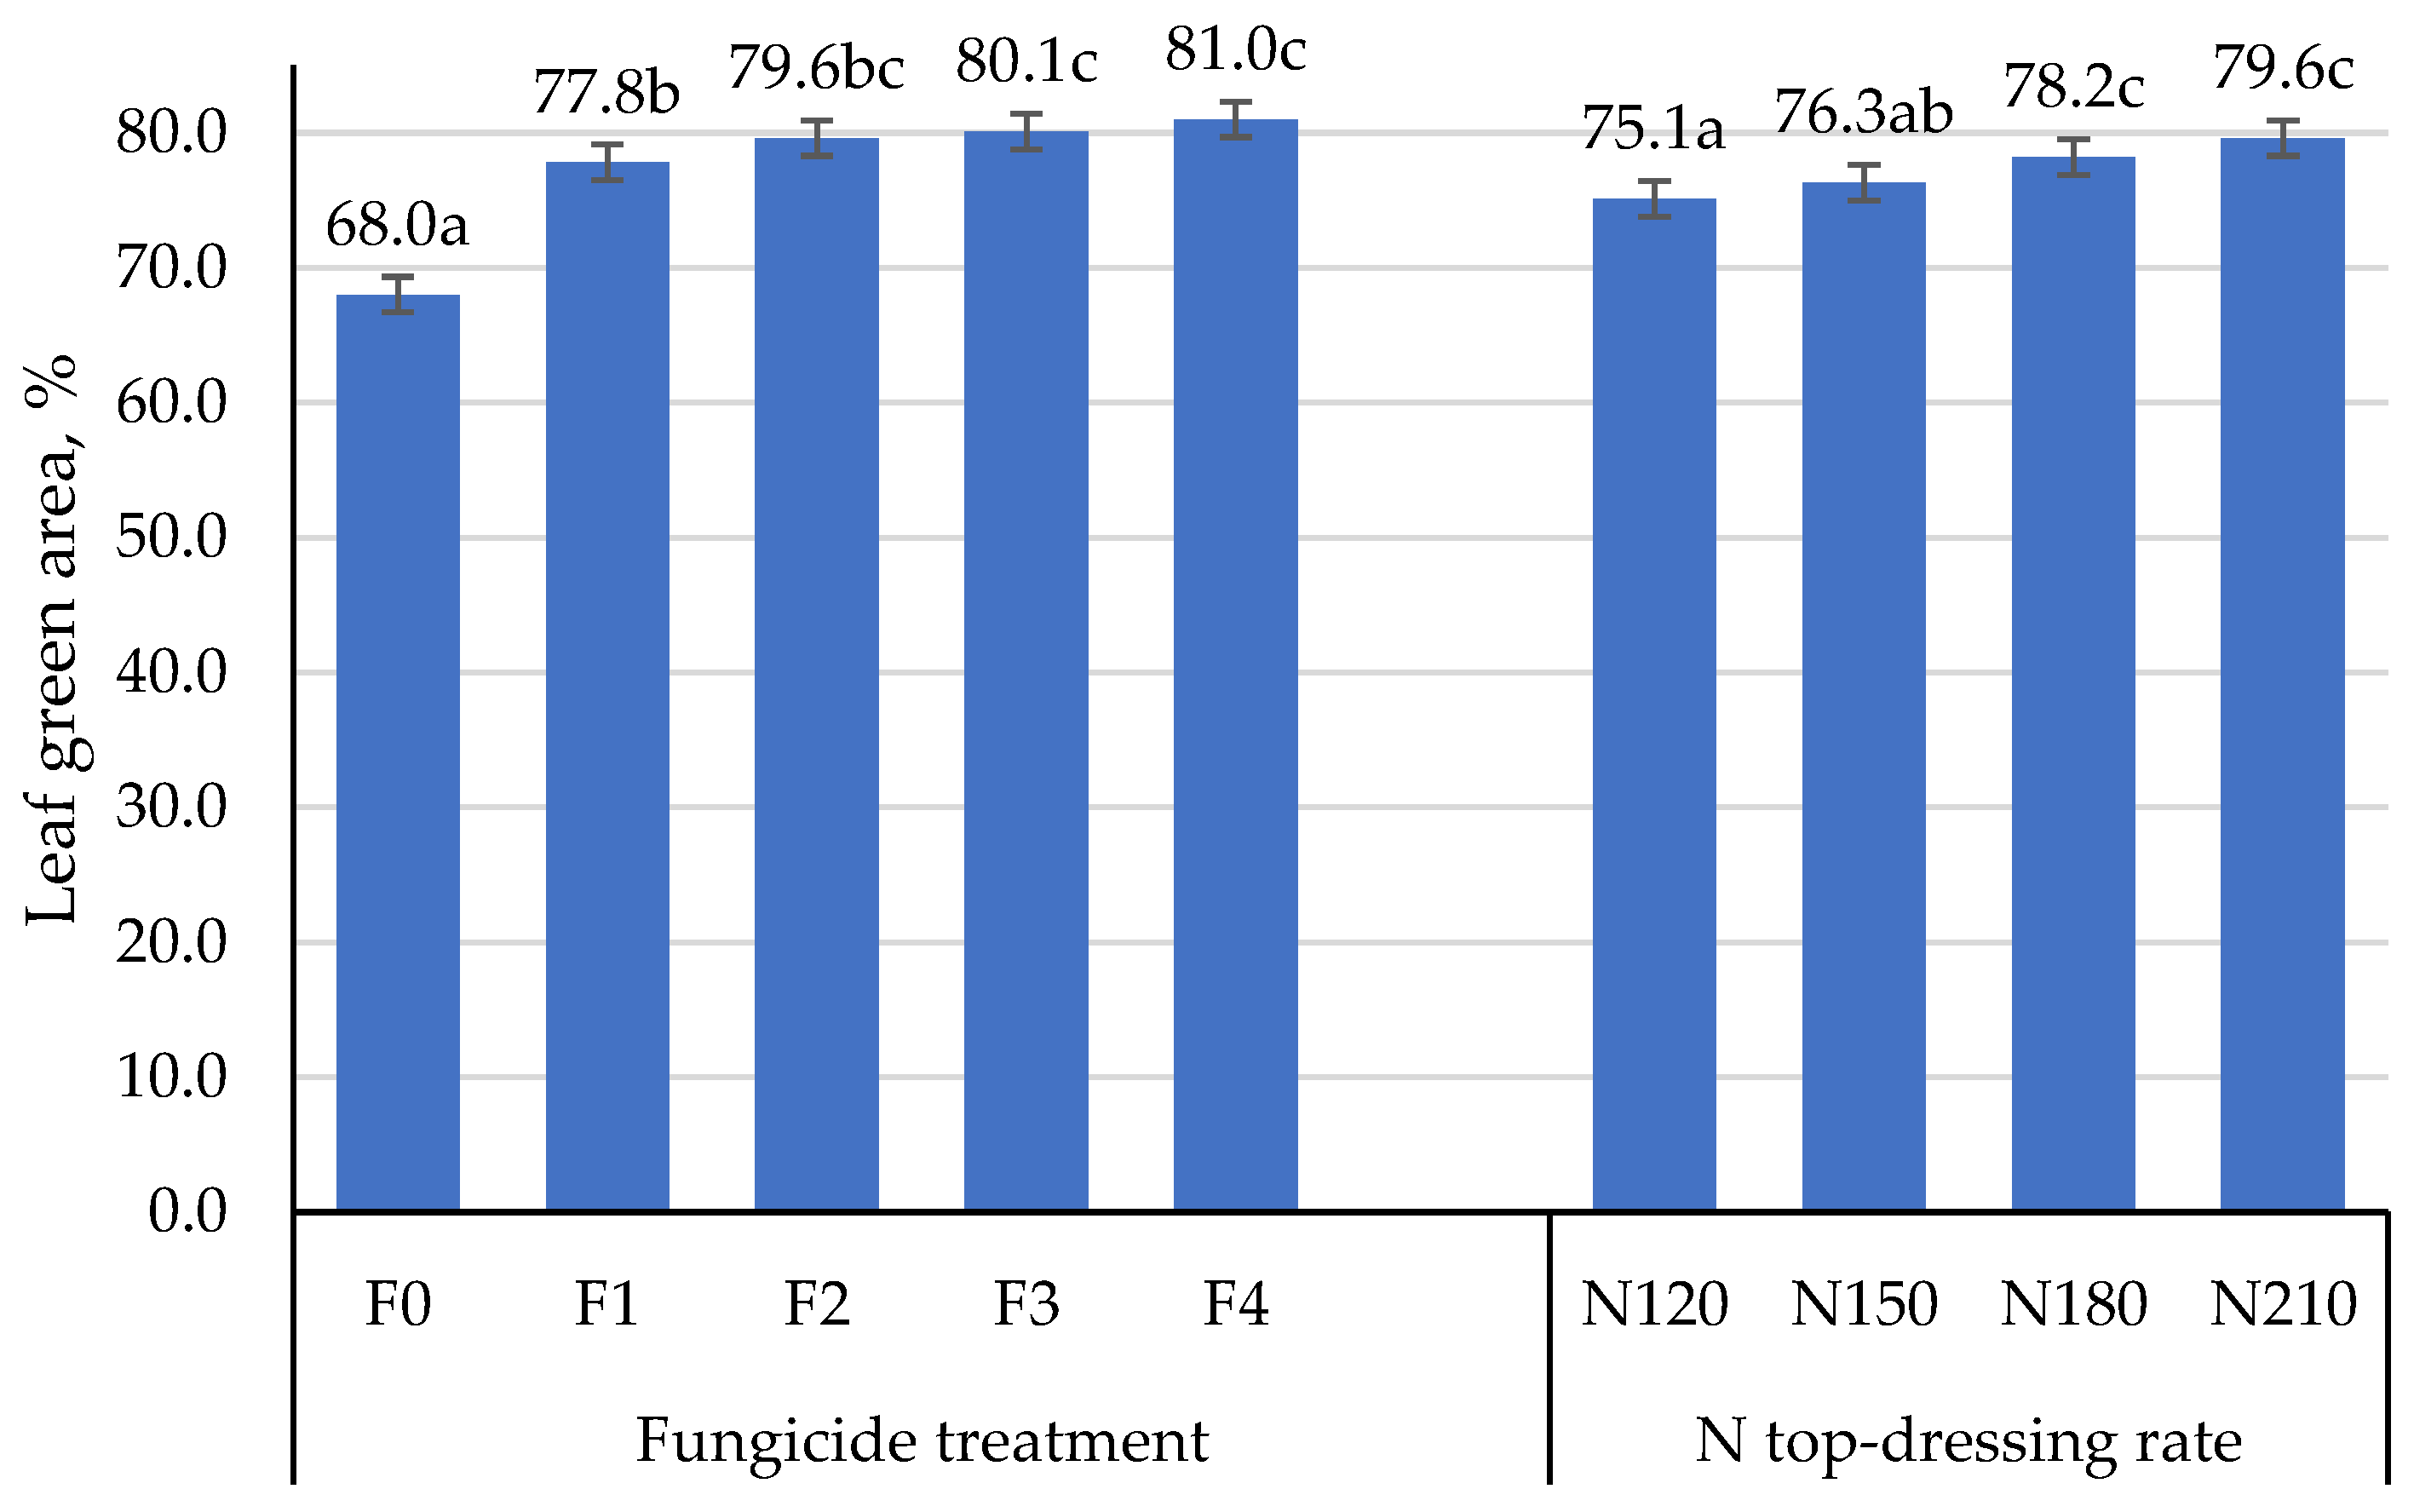
18]. Symptoms for every disease were evaluated separately. Fifty plants/leaves/ears were taken per every plot for evaluation, and leaves were taken to keep the proportion of all levels (flag leaf, 2nd leaf, and 3rd leaf). Wheat ears were evaluated at the early milk maturity stage (data not shown). In addition, the leaf green area (LGA) was recorded visually (in %) at the late milk maturity (GS 77) on the upper two leaves.
In 2020, lodging was observed, which was evaluated using a point scale (9–1, where 9 means no lodging, and 1 means very strong lodging and all stems are bent down at a 90° angle).
Before harvesting, two sample sheafs (each from 0.1 m2) were taken from every plot to determine the grain/straw ratio, which was later used to calculate the straw yield from the grain yield.
A grain sample of 1 kg was taken from each plot during harvesting to detect grain quality parameters. The Near Infrared Spectroscopy (NIRS) method (analyser InfratecTM NOVA (FOSS, Hillerød, Denmark)) was used to determine the content of crude protein (CP, % in dry matter), wet gluten (WG, for grain at 14% moisture), and starch (SC, % in dry matter), as well as Zeleny index (ZI) and volume weight (VW, kg hL−1). The thousand grain weight (TGW, g) was determined according to the standard ISO 520:2010.
2.4. Data Statistical Processing
The analysis of variance (ANOVA) was used for data analysis both in every specific year and taking into account the data of all four years. Differences between treatments were considered as significant at p ≤ 0.05 and were detected using Bonferroni test. Significantly different values in tables and figures are labeled with different letters in superscript. Correlation and regression analyses were used for discovering the relations between studied parameters. Data were analysed using IBM Statistics for Windows, Version 23.0.
2.5. Meteorological Conditions during the Study Period
Meteorological conditions were diverse during trial years (
Table 1). In autumn (September, October), the best temperature and moisture conditions for good stand establishment were observed in 2019. The autumn of 2017 was overly wet, but those of 2018 and 2020—overly dry. In general, conditions were good for wintering in all four winters, except early spring of 2021, when snow mold (caused by
Microdochium nivale and/or
Typula spp.) was observed. The whole spring and summer period of 2018 was extremely hot and dry, but that of 2019 and 2021 was characterised with several drought periods. Only the year 2020 was suitable for the formation of high winter wheat yields (
Figure 1).
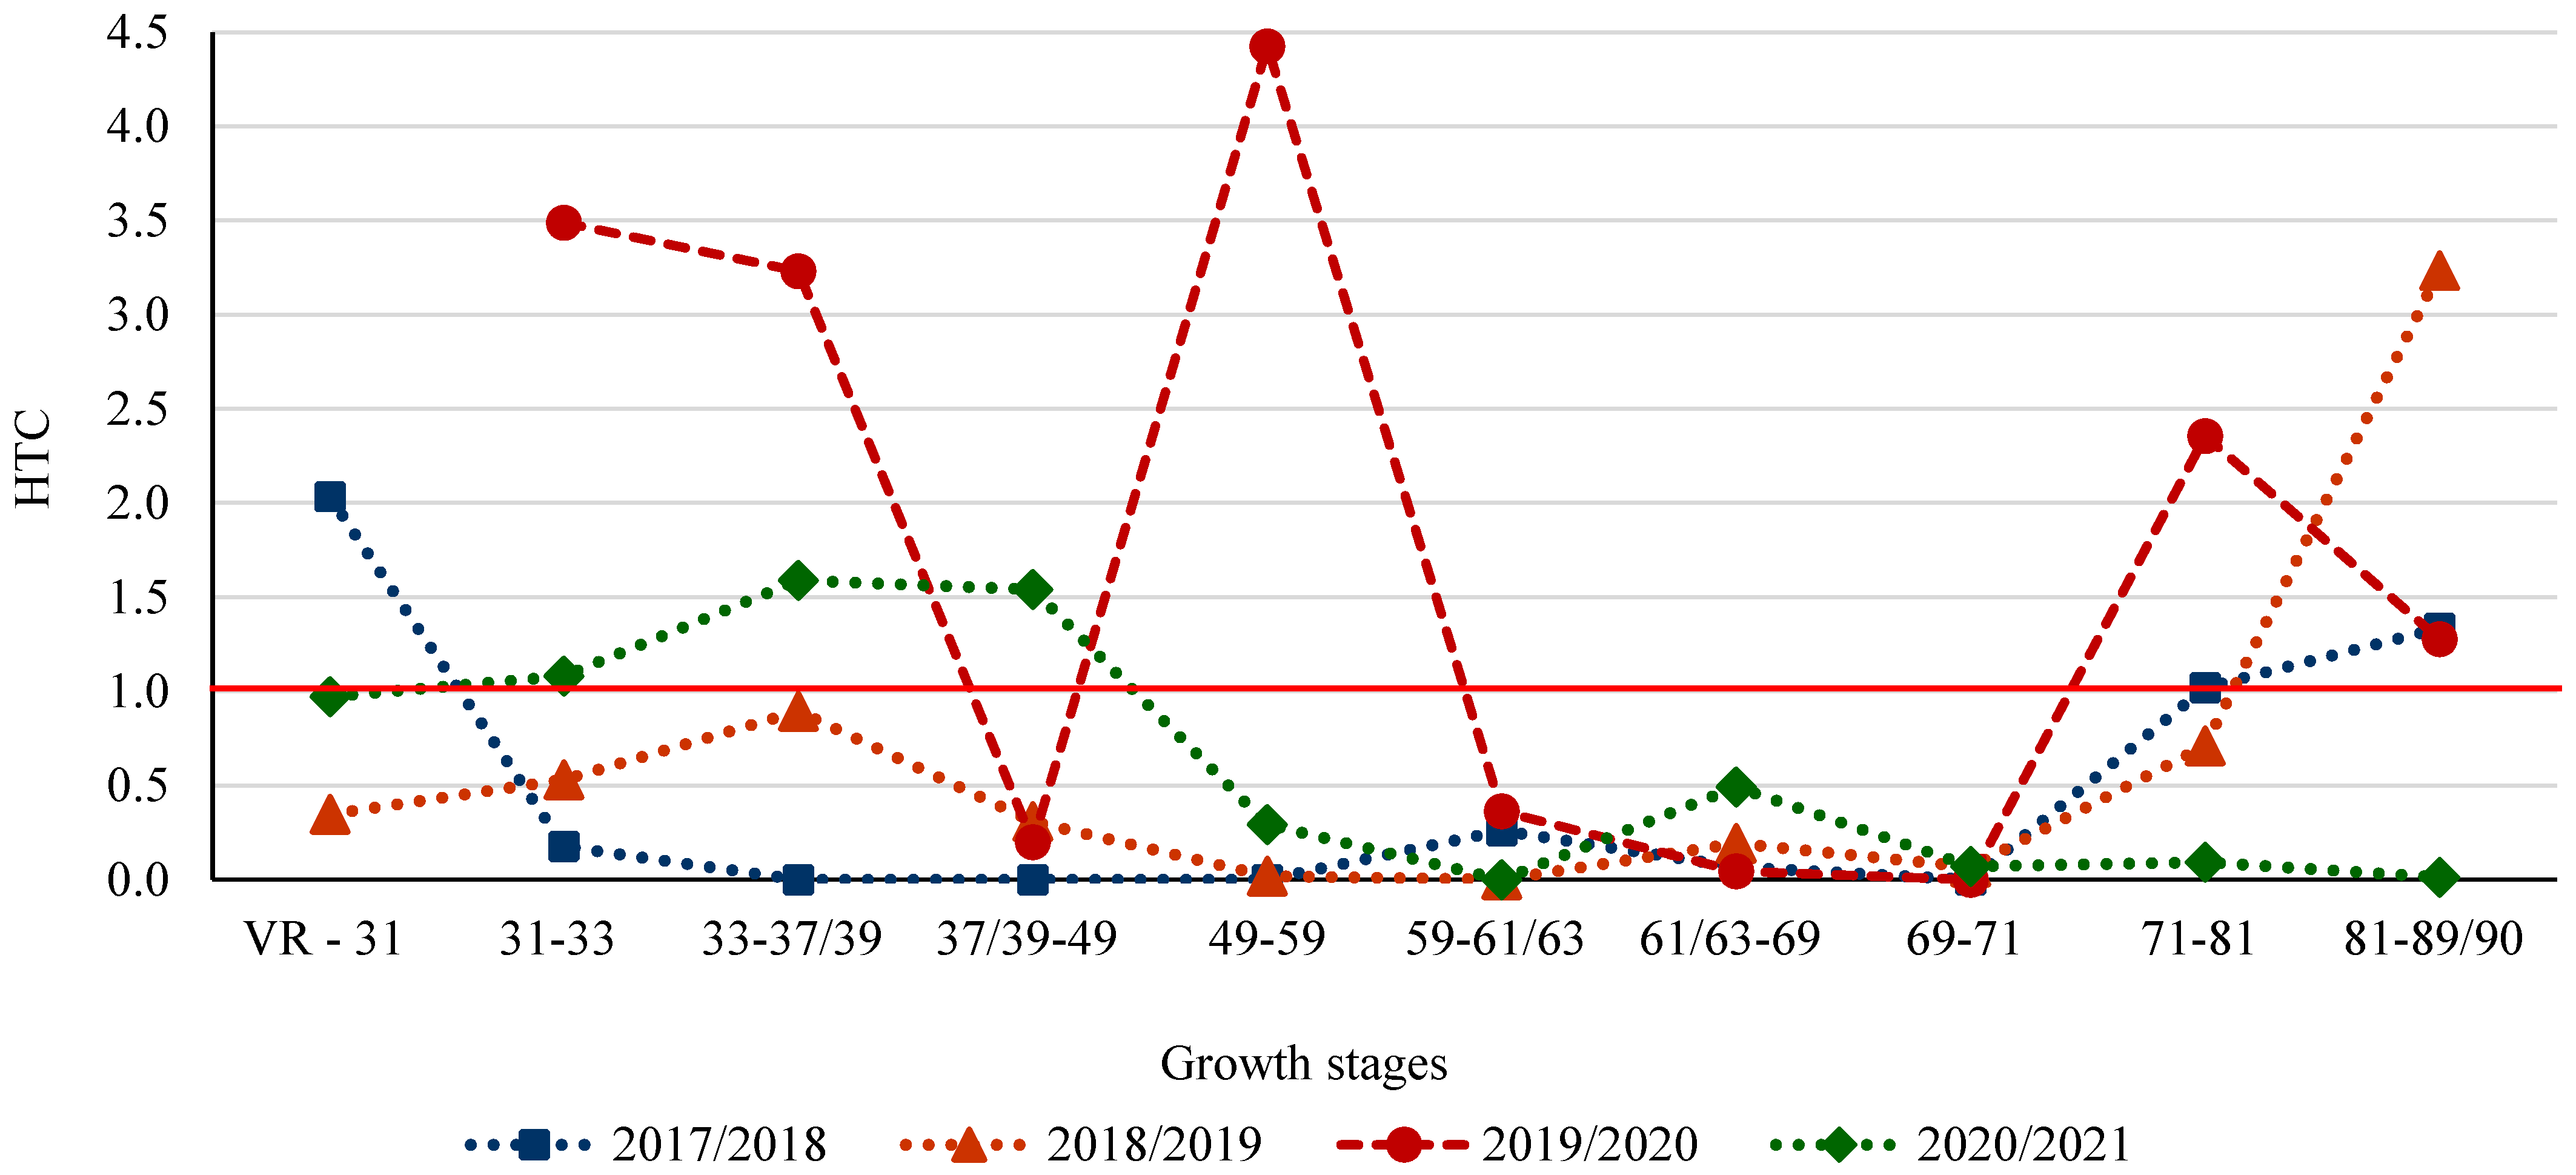
In order to characterise the temperature and moisture conditions more accurately in different wheat development stages in the spring-summer vegetation period, the Selyaninov’s hydrothermal coefficient (HTC) [
19] was calculated according to the Formula (1):
ΣR—sum of precipitation per period, which has to be characterised;
Σt—sum of temperatures above 10 °C per the same period.
We used the following criteria for the interpretation of HTC: >2—overly wet; 1–2—sufficient moisture provision; <1—insufficient moisture provision; 1.0–0.7—dry conditions; 0.7–0.4—very dry conditions.
Temperature and precipitation in different growth stages caused a critical lack of water, which was observed in the whole season of 2017/2018 and 2018/2019, as well as from the GS 49 to the harvesting maturity in 2020/2021 (HTC below 1 in
Figure 1).
A sufficient supply of water during ear formation (up to GS 32) was noted in 2020 and 2021, and up to GS 31—also in 2018. Grain filling stage (see GS 71–81 in
Figure 1) was best provided with moisture in the year 2020, when also temperature was more moderate, while the worst situation was observed in 2021.
4. Discussion
Tan spot and Septoria leaf blotch were the main diseases during the trial period, which supports our previous conclusions related to the situation in the Baltic region [
9,
12]. As it has been found before, wheat as a pre-crop for wheat increases the level of wheat diseases, but ploughing can mitigate this impact significantly. The influence of meteorological conditions on the development of diseases has been recognized as more significant than the impact of agronomic practices [
9]. The disease progress curves of leaf blotches in the present study differed compared with other findings—a rapid development of diseases started only at the time of flowering or even later in our trial. The results showed that, for example, in 2019, when tan spot achieved the highest level, its severity was 2% at GS 71, and two weeks later (GS 77) achieved 19% in the untreated variant. Similarly, in 2020, when Septoria leaf blotch dominated, the disease severity increased from 1.5% to 11.1% at the same growth stages (from GS 71 to 77). Those peculiarities of leaf disease development explain the comparatively low efficacy of T1, because that time of spraying did not coincide with the development of leaf diseases. The efficacy of fungicide treatment depends not only on the total pressure of diseases during the season, but also on crucial periods for disease development during the season.
More detailed data related to winter wheat leaf disease development depending on fungicide application and N top-dressing rate have been presented in other articles, e.g., by Švarta et al. [
20].
The results revealed that the influence of the meteorological conditions on the yield of winter wheat in the research years was greater than the influence of the studied factors (
Table 3,
Figure 3 and
Figure 4), despite the fact that both of them—fungicide application and N top-dressing rate—significantly affected the average four-year yield. According to the obtained data (
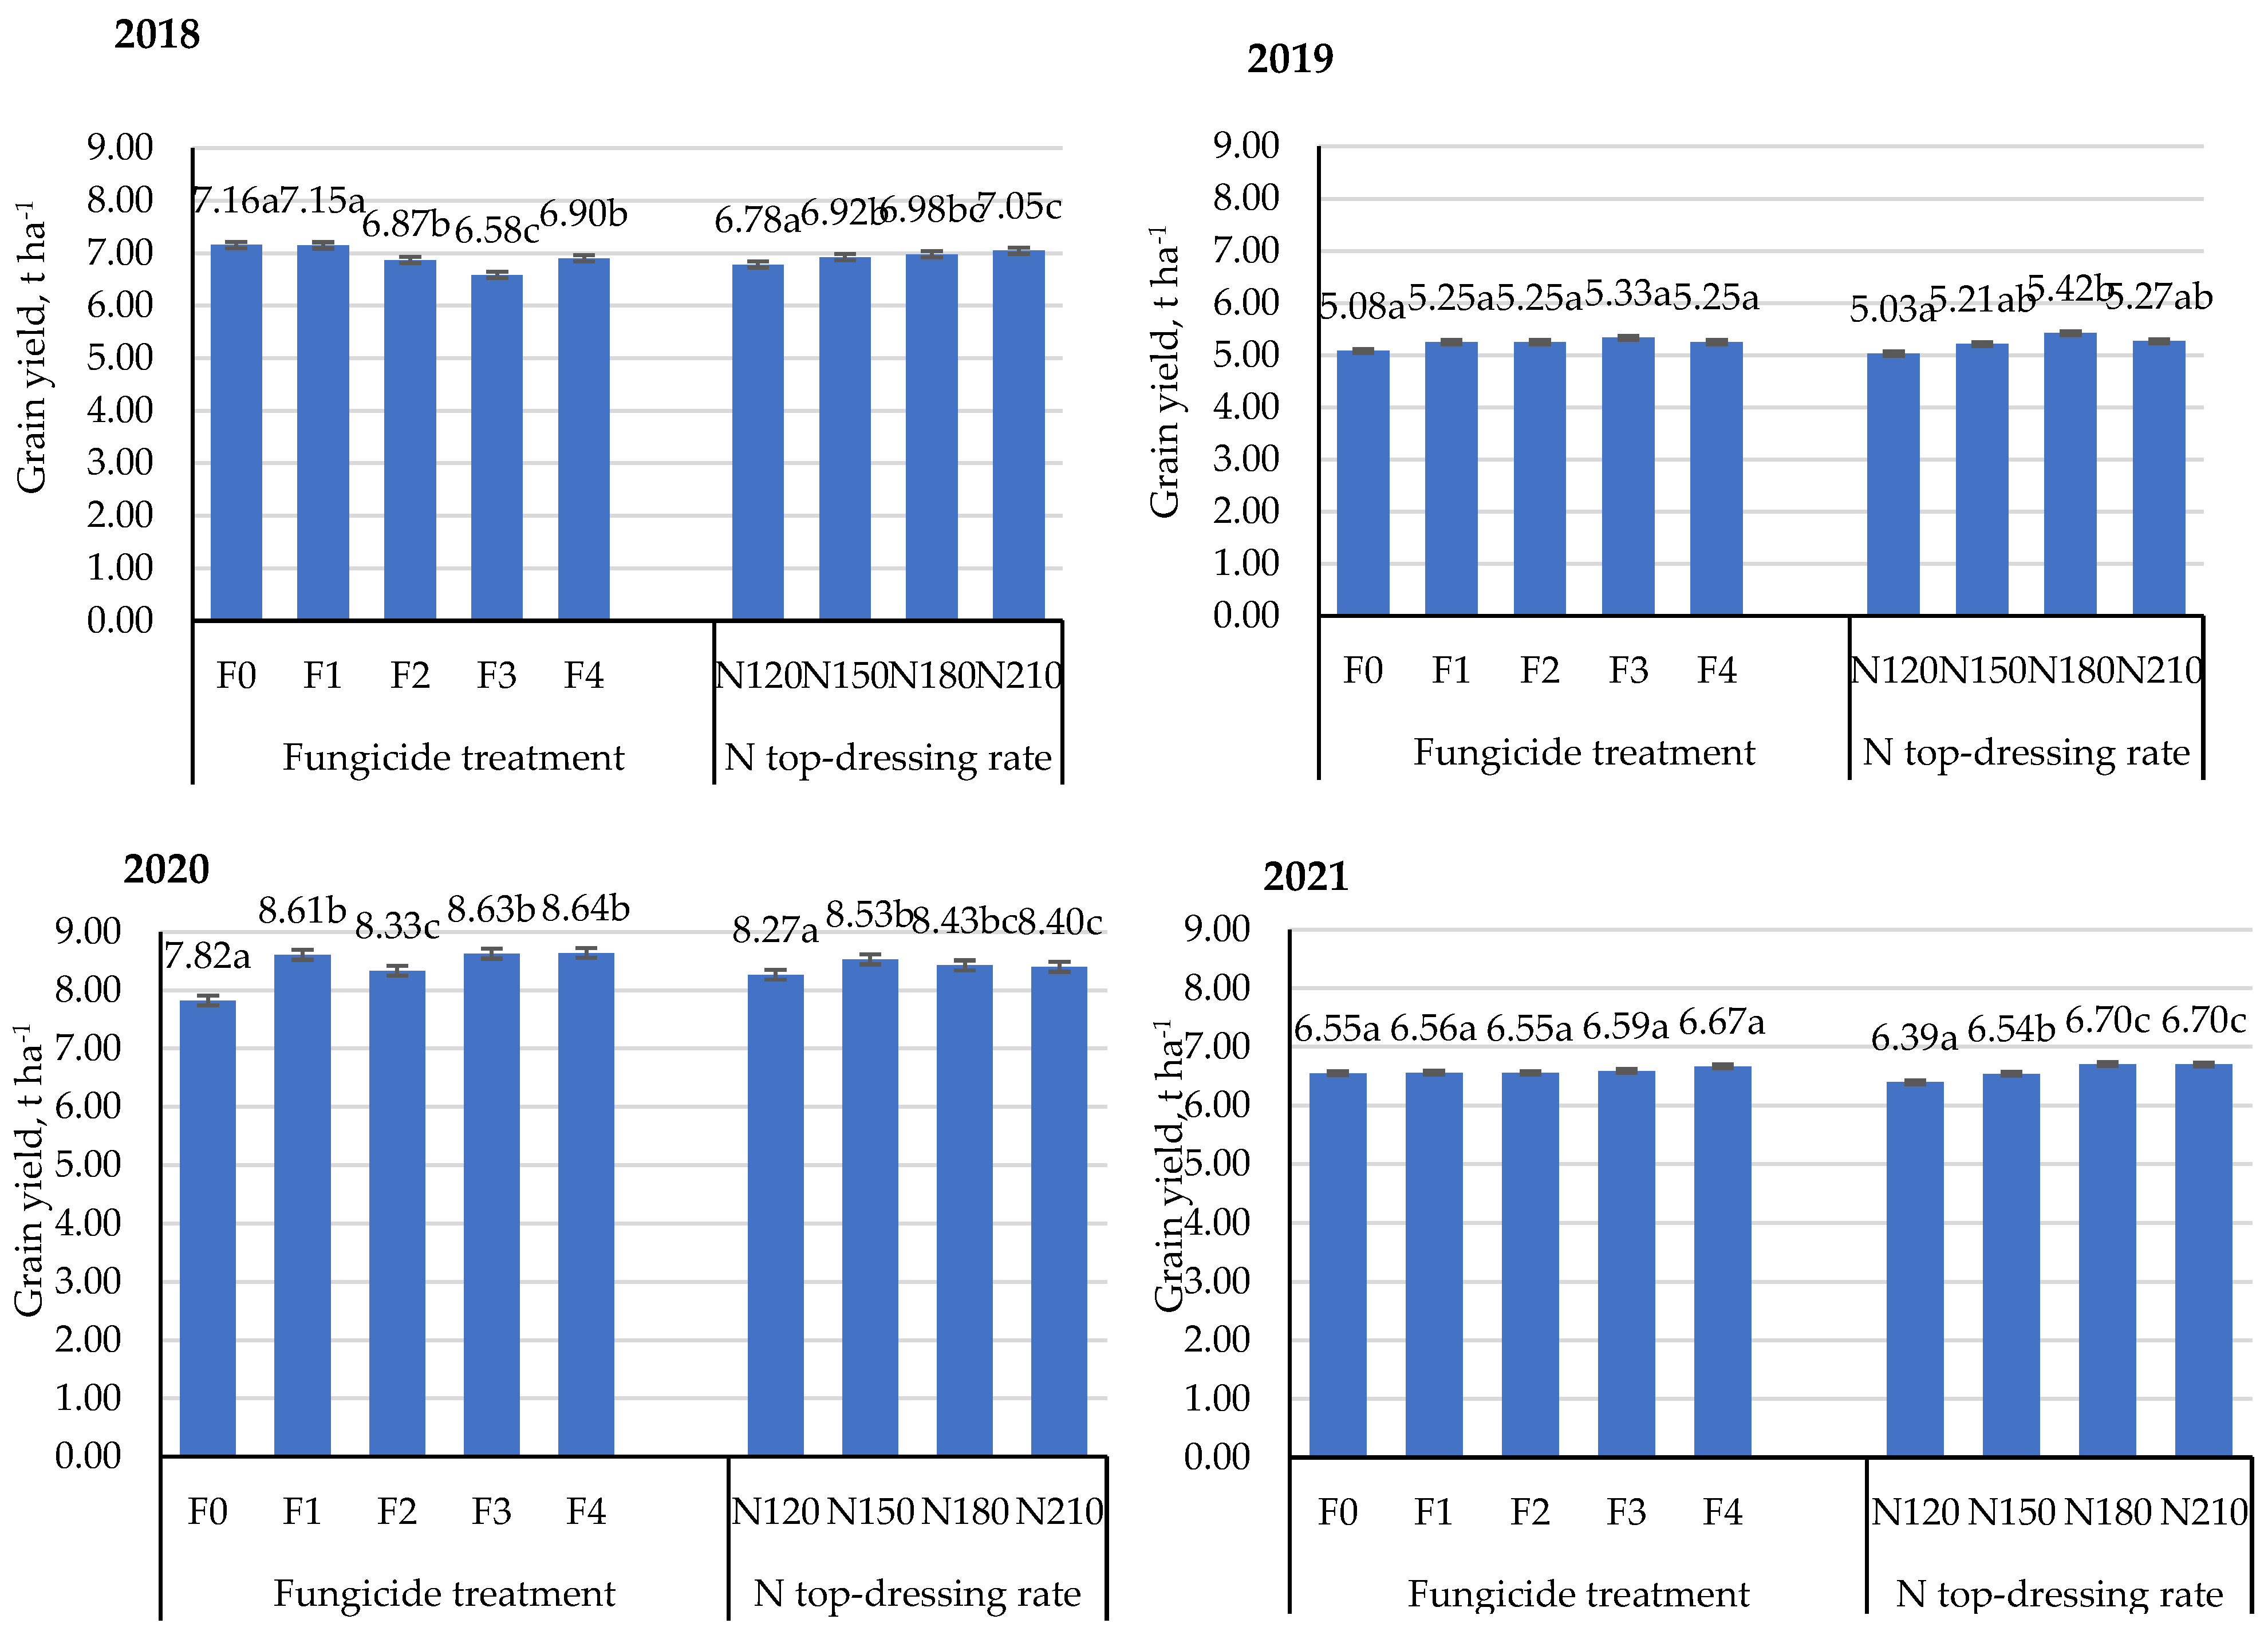
Table 4), any variant of fungicide application gave a significant increase in the average grain yield, but the differences in yield among the sprayed variants were inconclusive, e.g., the grain yield in the F1 variant (half of the fungicide dose was applied) was equivalent to the yield in the F4 variant (two full fungicide doses were applied in three sprayings). Obtained data are supported by similar results regarding the development of leaf diseases—fungicide application decreased the severity of diseases, but the increase in fungicide treatment intensity was not effective. Similar results have been also obtained in the previous studies in Latvia, where both the pre-developed fungicide application schemes and the two decision support systems were used in one trial, and the applied fungicides included also strobilurins. The results showed that any variant of fungicide application ensured an increase in the yield, but significant differences between yields in the variants differently treated with fungicides were not established [
12]. This conclusion is supported by several studies conducted in different conditions and in different regions. A study in Luxembourg [
6] found that a single spraying according to the recommendation of a decision support system can provide a yield equivalent to that provided by two or three sprayings according to a previously developed scheme. In Canada it was concluded that a single spraying at GS 39 provided the yields equivalent to those obtained in the variants where a split spraying was applied twice (at GS 30 and 39) [
21]. Previous findings in Latvia [
12] as well as other studies demonstrate that the yield increase as a result of fungicide application depends on meteorological conditions [
5,
21,
22,
23,
24] and also on other agrotechnical factors (pre-crop, tillage system, etc.) [
25]. A study of Byamukama et al. [
26] proved that the positive effect of fungicide application for yield increase is better manifested if there are sufficient moisture conditions at the time most favourable for disease development during the vegetation season. During our research, sufficient water provision in the vegetation period was observed only in 2020, when any variant of fungicide application provided a significant yield increase (
Figure 3); the other trial years were marked by drought in the stages important for the formation of winter wheat yield (
Figure 1). In two years (2019 and 2021), fungicide treatment did not significantly affect the wheat grain yield (
Figure 3), and the yield in the variants with fungicide application (F1–F4) was equivalent to that of the control variant (F0). Similar were the findings of Fernandez et al. [
27] who carried out a study of
Triticum durum in Canada. The researchers established that for disease control, one fungicide spraying (at GS 62–65) was of equal value to two sprayings (at GS 31 or 49 and at GS 62–65), but the yield in all treated variants was numerically but not significantly higher than in the control variant. In 2018, when the shortest vegetation period was observed and the season was extremely hot and dry (
Table 1,
Figure 1), the effect of fungicide application on the yield was significant but negative, i.e., a significant yield reduction was observed in three variants (F2–F4) (
Figure 3). In that year, the disease severity was low and only tan spot was spread more pronouncedly. We hypothesized that the drought stress together with the stress caused by fungicide spraying resulted in a yield reduction in variants F2–F4. Such hypothesis about a combined effect of both stresses was also expressed by Rodrigo et al. [
5], who observed that in dry years, all variants of fungicide spraying led to a decrease in grain yield. If decision support systems were used, it would have been possible to avoid such a situation, because in conditions that do not promote the spread of diseases, the system would likely not recommend spraying [
8]. The studies comprising simultaneously several cultivars report that cultivars with a lower yield potential are more responsive to the application of fungicide and provide a greater increase in yield (e.g., in Bhatta et al. [
23]—fungicide applied at GS 39; in Byamukama et al. [
26]—fungicide applied at GS 60), or—the effect of fungicide application depends on the cultivar’s genetic characteristics, which is related to the year of the registration of the cultivar [
28]. The cultivar ‘Skagen’ used in our study is characterized with at least medium yield potential and has a relatively good field resistance against the main leaf diseases (3 to 4 points in a 9-point scale, where 9 means the highest susceptibility;
https://www.bundessortenamt.de/bsa/sorten/beschreibende-sortenlisten/ (accessed on 30 December 2022)). On the other hand, Morgunov et al. [
29], while studying the use of fungicides against leaf rust (caused by
Puccinia recondita), found an increase in yield as a result of fungicide application for cultivars with different levels of resistance to this disease. In our study,
Puccinia recondita was observed only once—at milk ripeness in 2021, when the severity of the disease was low.
Although drought did not contribute to N-use efficiency in three of the four study years, our results suggest that in each study year separately (
Table 3,
Figure 3) and on average over the entire period (
Table 4), N top-dressing had a significant effect on wheat grain yield. On average during the study period, a significant increase in yield was noted by increasing the N top-dressing rate to N180; however, the results depended on the specific year, e.g., in 2020, a significant yield increase was noted up to the rate N150 (
Figure 3). The results were in line with the previous studies, when wheat yield increased significantly with the increase in N rate up to 120 kg ha
−1 [
30], 153 kg ha
−1 [
31], or 180 kg ha
−1 [
32,
33]. In addition, the N-rate up to which the yield increased significantly, was influenced by the agrometeorological conditions of the specific study.
At the start of the study, it was hypothesized that higher N rates would probably produce a denser wheat biomass, which would stimulate more diseases in the crop and therefore require a more intensive use of fungicides. However, in our case, the above-ground biomass-forming component, straw yield, did not increase by increasing the N top-dressing rate, nor did it depend on either F or F × N; it was influenced only by the conditions of the trial year (
Figure 4). In other studies, e.g., [
13], it was found that fungicide application strategy at GS 39 or GS 60–65 ensured the highest and a consistent grain yield increase, especially if it was supplemented with high N rates. Our results also revealed a small significant impact of F × N interaction on the average wheat grain yield over the entire research period and in three separate years (2018, 2020, and 2021;
Table 3). However, it was not possible to establish any regularity that in more intensive fertilizing options, also a more intensive spraying should be used (
Table 4). The inconsistency of the F × N impact on yield increase was even more expressed in specific years (data not shown) compared with the average four-year result. In Argentina, where a significant effect of the F × N interaction on yield was also found in the wheat artificially inoculated with
P. tritici-repentis, it was established that increasing N rates in a fungicide-untreated control variant did not result in a significant increase in yield, while the yield increase in fungicide-treated (all variants included the use of strobilurins) variants was significant [
3]. We observed a significant yield increase by increasing the N top-dressing rate also in untreated control. Our research was performed in a natural background of infection, and the infection level was not high. The results of different studies can differ depending also on cultivar and agrometeorological conditions of a specific study.
The effect of the studied factors on both groups of grain quality indicators—physical (TGW and VW) and chemical (CP, WG, ZI, and SC)—were found to be different. During the four-year trial period, the average physical grain quality indicators were significantly affected by fungicide treatment, but chemical quality indicators—by N top-dressing rate. Both groups were affected significantly by meteorological conditions of the study year, but were not affected by F × N interaction.
The increase in TGW due to fungicide application is established also by other researchers [
23,
27,
34], but Landolfi et al. [
34] have also pointed to the importance of the meteorological conditions of the trial year. We found a significant correlation of LGA at the end of milk ripeness stage with TGW, which is in line with MacLean et al. [
24], who pointed to the importance of LGA increase for the formation of TGW in the result of fungicide application. The fact that the increase in N top-dressing rate does not significantly increase TGW is consistent with the results of Landolfi et al. [
34] but differs from other findings [
32,
35], where also lower N rates (N60 and N90) and unfertilized control were included. The lowest N top-dressing rate used in our study was N120 kg ha
−1, which is not that small at all. Some researchers indicate an increase in TGW up to a certain N top-dressing rate which, when exceeded, decreases the TGW value [
36]. For producers, VW is even a more important indicator than TGW; therefore, it is used by grain buyers for price determination. VW depended mostly on the meteorological conditions of the year (
Table 5): strong lodging in 2020 and the lack of water during part of the 2021 season (
Table 1,
Figure 1) caused lower values of VW. As already mentioned, fungicide application increased VW on average per trial period and in two separate years (2019 and 2020), decreased the VW in 2018, and did not cause any significant changes in its value in 2021. In other studies, the observations of the dependence of VW on the use of fungicide were also various. Some results indicate a VW increase [
15,
26,
27], and some results show that the values of VW in control and sprayed variants did not significantly differ. At the same time, it is noted that the nature of VW is related to the climate (meteorological conditions) and the disease severity [
5], and that in years with a low disease spread, VW did not increase significantly due to fungicide application [
24]. Moreover, the genetic characteristics of the cultivar can affect changes in VW, depending on fungicide application [
23]. A study in Sweden revealed that a single fungicide spray (at GS 45–61) resulted in an increase in VW in 12 out of 25 research years [
37].
The effect of fungicide treatment on changes in CP content and ZI compared with WG content and SC is described in more detail in the literature. In Latvia, consumers prefer grain with high protein content (for bread baking at least 12%); however, none of four fungicide application variants increased it. Similar results have been obtained in several studies confirming that CP content does not depend on fungicide sprays but depends more on climatic (meteorological) conditions at the study site (including year) [
5,
15,
21,
38]. Byamakama et al. [
26] found that CP content was slightly but significantly increased by fungicide application; however, the increase depended on the conditions of the study site. The comparison of different timings (GS 60 was compared to GS 39) of fungicide sprays demonstrated that later spraying did not negatively affect the CP content [
24]. Some authors link the increase in CP content in the result of fungicide application to both the increase in LGA and the control of Fusarium head blight (caused by
Fusarium spp.) [
23]. In our study, only in 2018, when CP content did not reach 12% in any of the variants (which was connected with untypically hot and dry conditions in the vegetation period), a slight (by 0.3%) but significant decrease in CP content was observed in variants F2–F4. However, the relationship between CP and SC did not change in 2018—it was negative as it is often observed. A small decrease in CP content in wheat grain as a result of fungicide application was also found in Italy, where only two variants were compared (untreated control with fungicide application at GS 55) [
34], and in Sweden in separate years [
37]. Landolfi et al. (34] wrote that CP decrease affected by fungicide application is probably connected with the higher grain yield. The effect of nitrogen on CP content is well-known, and in our trial, high N rates (N180–210) ensured the highest values of CP content.
The effect of fungicide application on WG content has not been widely studied. Findings in Croatia, similarly to our results, revealed that gluten content is affected by N fertilization and the meteorological conditions in the trial year but not by fungicide (tebuconazole at GS 55) application and F × N interaction [
15]. ZI is an indicator characterising the CP quality. Changes in ZI were similar to changes in the values of CP and WG over the trial period and in separate years: ZI was not affected by F and F × N but was significantly affected by N top-dressing rate and meteorological conditions of the year. The effect of fungicide application on the value of ZI has not been found in previous research [
5,
15] either.
Starch content is not among the traditionally evaluated indicators for food wheat grain quality. SC should be evaluated in cases when wheat grain is intended for the production of ethanol [
39] or feed. Similarly to CP and WG content and ZI, SC was also significantly affected by N top-dressing rate; however, the effect was contrary to that of CP, WG, and ZI, i.e., SC decreased with the increase in N rate. Moreover, the effect of the conditions in the trial year was found significant, but fungicide application mainly did not significantly affect the SC (except in 2018).


 ,
, 


