Abstract
Due to global warming, late-spring coldness affecting wheat (LSCW) is one of the major abiotic adversities affecting wheat production. A combination of field and pot trials were conducted in this study. In the field experiment, 20 wheat varieties from the main wheat-producing areas in China were selected as experimental materials. By exploring the effects of LSCW on the spikelet characteristics and yields of different varieties, the evaluation methods and indexes of wheat varieties’ resistance to LSCW were established. Three varieties with strong resistance to LSCW (Yannong19, Guomai9, and Shannong17) and five varieties sensitive to LSCW (Zhengmai895, Xinmai26, Zhengmai366, Zhengmai8329, and Fanmai5) were screened out. The wheat varieties Yannong19 (YN19), with a strong resistance to LSCW, and Xinmai26 (XM26), with LSCW sensitivity, were selected as the test materials for the pot experiment. The ultrastructure changes in the wheat in different low-temperature treatments during the anther differentiation period were observed using an ultra-low-temperature artificial climate incubator set to 4 °C and −4 °C for 4 h (1:00–5:00 a.m.). The average temperature of the field during the low-temperature treatment was 10 °C, which was the control temperature (CK). The results showed that the cell morphology and chloroplast and mitochondrial structures of the functional leaves, young ears, and internodes below the ears were damaged, and the degree of damage was related to the cell location, the extent of low-temperature stress, and the resistance of the varieties. The degree of damage to the wheat cells was found to occur in the following order: young ears > internode belove young ears > functional leaves. The degrees of damage to the wheat cell, chloroplast, and mitochondrial structures increased with the intensification of the low-temperature stress. The damage to the XM26 variety was obviously greater than that inflicted on the YN19 variety. The anatomical mechanism of YN19 cells makes the cell structure more stable during late-spring coldness.
1. Introduction
Wheat (Triticum aestivum L.) is one of the three major grains in the world, and its seeds contain a lot of nutrients needed by humans; about 60% of the world’s population depends on wheat as a staple food [1,2,3]. Global warming has been an indisputable fact since the Industrial Revolution. According to the United Nations Intergovernmental Panel on Climate Change (IPCC)’s special report on Climate Change and Land, the global average land temperature increased by about 1.53 °C from 2006 to 2015 compared to that in 1850–1900 and is expected to rise again by more than 1.5 °C by 2100 [4]. Extreme weather caused by climate warming, such as late-spring coldness (LSC), poses serious challenges regarding global food production [5,6,7].
LSC has caused great losses in wheat production in several countries around the world. It was reported that as many as 41 LSC events occurred in Kansas, USA, from 1995 to 2010, resulting in a reduction in wheat yield by more than 538 kg/hm−2 [8]. In Queensland and northern New South Wales, Australia, wheat production is being reduced by 10% each year due to low-temperature disasters [9], with an average annual economic loss of AUD 100 million [10]. China is currently the world’s largest wheat producer, with wheat production exceeding 17.6% of global production [11]. Huanghuai is one of the main wheat-producing areas in China, with its annual sown and wheat production areas accounting for about 58% and 67% in the country [12]. From 1980 to 2023, nearly 20 large-scale LSC events occurred in China. In Huanghuai, the most serious events occurred in 2009, 2013, 2015, 2018, and 2020, with an occurrence frequency of up to 40% [13].
LSCW mainly refers to a kind of agrometeorological disaster that occurs from jointing to booting, causing the injury or death of young ears and some spikelets or even the whole spike, resulting in wheat yield reduction [14].
Many studies have shown that wheat LSCW resistance is closely related to wheat young ear differentiation. Li Chunyan et al. [15] found that an LSCW temperature of −2 °C would freeze and kill the main stem and large tillers of wheat, affecting the formation of grains, and the yield reduction rate was about 20%. Zheng et al. [11] concluded that the freezing and injury of young spikes were greatly and negatively correlated with plant height, spikelet number, grain numbers, and the grain weight of the main stem spike. Zhang Wenjing et al. [16] showed that low-temperature stress at the booting stage resulted in a decrease in the grain number per spike and the 1000 grain weight, among which the grain weight per spike most obviously decreased. Kaznina et al. [17] found that the reason behind the decrease in wheat yield caused by LSCW was that low-temperature stress damages the functional leaves, thus affecting the synthesis and supply of carbohydrates, leading to a decrease in wheat yield. Dolferus et al. [18] showed that wheat is very sensitive to LSCW, and LSCW will lead to a significant decrease in pollen mother cells and pollen, resulting in a serious yield reduction.
The low-temperature tolerance of plants is closely related to the ultrastructure of the cells [19,20]. When plants experience LSC, first, the structure of the cell membrane is damaged; then, the functional proteins on the cell membrane change from a liquid crystal to a gel; and the accumulation of malondialdehyde, the product of membrane lipid peroxidation, causes a series of physiological and biochemical changes. Previous studies have found that abiotic stress results in plant cell wall material deposition; protoplasm dehydration; plasmowall separation; the deformation of chloroplasts, mitochondria, and other organelles; the decomposition of large vacuoles; the disappearance of the nuclear and plasma membranes of cells; cell disintegration in a state of severe stress; and ultimately plant death.
Therefore, in this study, we established LSCW resistance evaluation methods and evaluation indexes by comparing the changes in the ear-fruiting characteristics and yields of 20 major wheat varieties in China after LSCW occurred naturally in a field. According to the LSCW resistance evaluation indexes, different varieties with LSCW resistance were classified. High-quality wheat varieties with stable yields and strong resistance to LSCW in China’s main wheat-producing area were selected. Then, YN19, which has a strong resistance to LSCW, and XM26, which is sensitive to LSCW, were taken as the research objects to compare and observe the cell structures of wheat after LSCW. To investigate the effect of LSCW on cell structures and its relationship with LSCW resistance, the anatomical mechanisms of different wheat varieties’ resistance to LSCW were explored from the perspective of the cell microstructure to provide a theoretical basis for LSCW resistance breeding and LSCW prevention and control technology.
2. Materials and Methods
2.1. Experimental Design
2.1.1. Field Experiment
From October 2017 to June 2018, this test was conducted in an Agricultural Science and Technology Demonstration Field (33°9′44″ N, 116°32′56″ E) in Mengcheng County, Anhui Province. This region has a warm, temperate, semi-humid, monsoon climate, with an average annual temperature of 14.8 °C, 2410 h of sunshine per year, and an average annual rainfall amount of 732.63 mm. The soil type is sandy ginger black soil, and the previous crop was corn straw, which had returned to the field in full. The 0–20 cm soil layer contained 12.46 g·kg−1 of organic matter, 0.99 g·kg−1 of total nitrogen, 80.20 mg·kg−1 of alkali-hydrolytic nitrogen, 15.40 mg·kg−1 of available phosphorus, and 100.30 mg·kg−1 of available potassium.
Twenty common wheat varieties from the main wheat-producing areas of China [21] were used as the experimental materials. There were a total of 60 sowing plots, and each plot was 12 m2 (4 m × 3 m). For each variety, 3 plots were randomly designated for repetition. The seeds were sown on October 17, and the sowing density was 2.25 million/ha. A total of 1.1 kg of compound fertilizer (N–P–K = 15–15–15) was applied as a base fertilizer to each plot, and 1.8 kg of N per plot was applied at the jointing stage. The other management techniques were the same as those for high-yield fields.
On 5–7 April 2018, a three-day late-spring coldness event occurred. Staring on 5 April 2018, while the daily average temperature gradually increased, the night average temperature gradually decreased, and the minimum temperatures dropped to 4.9 °C, 1 °C, and 3 °C, respectively, corresponding to a drop of 10–13 °C. At this time, the young ear differentiation stage of wheat reflected the anther differentiation period (Figure 1 and Figure 2).
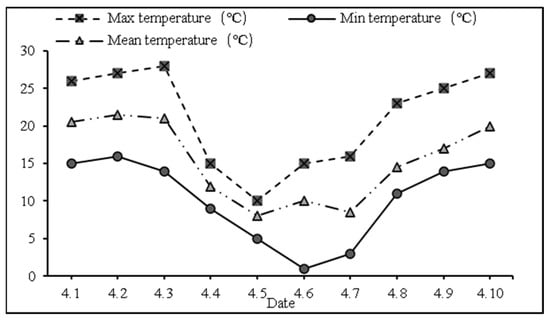
Figure 1.
Temperature trend before and after LSCW (2018–2019).
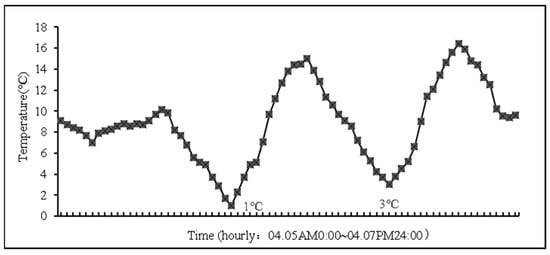
Figure 2.
The weather conditions during March in the anther differentiation period in the wheat growing season (2018–2019).
The most suitable range of effective growing degree days (GDDs) for wheat growth is 10–25 °C [22,23,24]. The GDD was less than 10 °C every day during the LSCW event (Table 1).

Table 1.
GDDs before and after LSCW.
2.1.2. Pot Experiments
The experiment was conducted from 2020 to 2021 (sowing/harvesting time: 1 November 2020/18 May 2021) at the Nongcuiyuan Experimental Base of Anhui Agricultural University (31°52′ N, 117°16′ E; altitude: 21.3 m). Two wheat cultivars, YN19 (strong LSCW resistance; the main wheat variety planted in Anhui Province [21]) and XM26 (weak LSCW resistance; suitable for planting in the south of Huang-huai winter wheat area, China [21]), were planted in plastic pots (30 cm diameter × 35 cm height; 3 drainage holes), with 8 plants per pot. Yellow-brown soil with a pH of 6.5 was used, containing 16.3 g·kg−1 of organic matter, 112.2 mg·kg−1 of available nitrogen, 23.0 mg·kg−1 of available phosphorus, and 161.6 mg· kg−1 of available potassium. Each pot was filled with 8 kg of soil and covered with 2 kg of soil after sowing. A total of 5.76 g of compound fertilizer (N–P–K = 15–15–15) was applied to each pot as a base fertilizer before sowing, and 1.5 g of nitrogen fertilizer was applied at the jointing stage per pot. The other cultivation methods were carried out in accordance with the local field’s wheat-planting standards.
On 21 March 2021, when the spikes of wheat had basically reached the anther differentiation period, as observed under a microscope (OLYMPUS SZ2-ILST; Tokyo, Japan), except for the control treatments (CK), all the other pots were transferred to an artificial climate chamber (DGXM-1008; Ningbo Jiangnan Instrument Manufacturing Factory, Ningbo, China; 1300 mm length × 630 mm width × 1305 mm height) with 75% humidity and 0 µmol·m−2 s−1·s light intensity at 21:00 on the same day for the LSCW treatment. Three pots were selected for each treatment and CK for three replications.
The temperature in the artificial climate chamber gradually dropped from the normal temperature in the natural field (14 °C) for 4 h to the two low-temperature treatment temperatures of T1 (4 °C) and T2 (−4 °C), and the treatment was carried out from 1:00 to 5:00 a.m., amounting to 4 h; the average field temperature during low-temperature treatment was 10 °C, which was the control temperature (CK). Immediately after the treatment, the pots were moved back to their original positions at 5:00 and grew until they matured. The changes in field temperature and treatment temperature during the experiment are shown in Figure 3 and Figure 4.
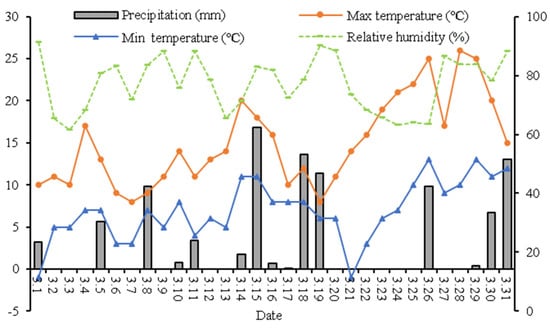
Figure 3.
The weather conditions during March in the anther differentiation period in the wheat growing season (2020–2021).
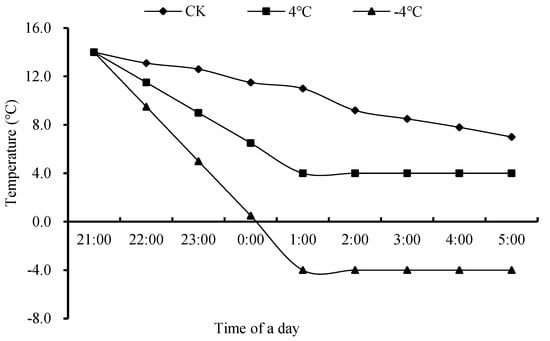
Figure 4.
Dynamics of ambient temperature (CK) and temperature in the smart climate box during the experiment days (data obtained from 21 to 22 March 2021). Note: 21:00–1:00: from ambient temperature (14 °C) to 4 °C, −4 °C, and ambient environment average temperature, i.e., 10 °C (CK); 1:00–5:00: low-temperature treatment was maintained at 4 °C, −4 °C, and ambient environment average temperature, i.e., 10 °C (CK).
2.2. Sampling and Measurement
2.2.1. Field Experiment
Two one-meter rows were selected in each plot at the three-leaf stage. At the milk-ripening stage, the numbers of damaged ears, grains per damaged ear, frozen ears, normal ears, and grains per normal ear were calculated. The results were recollected three times for each variety, and the yields were calculated after harvesting.
Measurement index:
- 1.
- LSCW-damaged spike rate: (number of damaged spikes in the sample/total number of spikes in the sample) × 100%.
- 2.
- LSCW-damaged spike rate at different levels:
- (1)
- Mildly LSCW-damaged spike rate: (the number of spikes with unproductive spikelets for less than 1/3 of the sample/total number of spikes in the sample) × 100%;
- (2)
- Moderately LSCW-damaged spike rate: (the number of spikes with unproductive spikelets for more than 1/3 and less than 1/2 of the sample/total number of spikes in the sample) × 100%;
- (3)
- Severely LSCW-damaged spike rate: (the number of spikes with unproductive spikelets for more than 1/2 and less than 2/3 of the sample/total number of spikes in the sample) × 100%;
- (4)
- Extremely severely LSCW-damaged spike rate: (the number of spikes with unproductive spikelets for more than 2/3 of the sample/total number of spikes in the sample) × 100%;
- (5)
- Dead spike rate under LSCW: (the number of spikes wherein all the spikelets are sterile in the sample/total number of spikes in the sample) × 100%.
- 3.
- Loss rate of grain number per spike (%): (the number of grains per damaged spike/the number of grains per normal spike) × 100%.
- 4.
- Late-Spring Coldness Resistance Index: (LSCRI) = yield of one test variety/average yield of all the test varieties.
2.2.2. Pot Experiment
After the treatment, the CK and treatment groups were immediately sampled. A 1 mm2 sample was cut from the top unfolding leaves of wheat, young ears, and the middle part of the internode below the ear and quickly fixed with 2.5% glutaraldehyde fixing solution (pH 7.2); the air in the bottle was pumped out until the sample was suspended in the fixing solution, and the bottle was placed in a refrigerator at 4 °C for 4 h. After the fixed sample had been placed in an environment at room temperature, it was cleaned with 0.1 mol/L sodium phosphate buffer 3 times and then fixed with 1% osmium tetroxide for 1.5 h. The material was washed with buffer 3 times, dehydrated with gradient ethanol, and finally permeated into Epon812 neutral resin to obtain a sample embedding block. The embedded blocks were sliced with an LKB-V ultra-thin microtome with a thickness of 60 nm. The ultra-thin slices were stained with uranyl acetate and lead citrate and observed under a transmission electron microscope (JEOL-1200EX, Tokyo, Japan), and 3 samples were randomly observed for each treatment.
2.3. Statistical Analysis
Microsoft Excel (version 2020; Microsoft, Inc., Redmond, WA, USA) was used for data sorting and figure and table production. Comparisons were made via one-way ANOVA using SPSS statistical software (version 19; SPSS, Inc., Chicago, IL, USA). Statistical divergence among treatments was determined using Tukey’s honestly significant difference (HSD) test. Correlation tests were processed using Pearson’s correlation coefficient, and K-mean method was used in cluster analysis.
3. Results
3.1. Characterization of Morphological Damage to Wheat Spikes Caused by LSCW
LSCW caused different degrees of damage to the spikes of different varieties of wheat.
When Zhongmai895 (ZM895) and XM26 were affected by LSCW, the upper and lower spikelets were seriously damaged, the spikes turned white, and some spikelets died. The half spikes of Wanmai52 (WM52) and Lemai 598 (LM598) were the most affected (Figure 5).
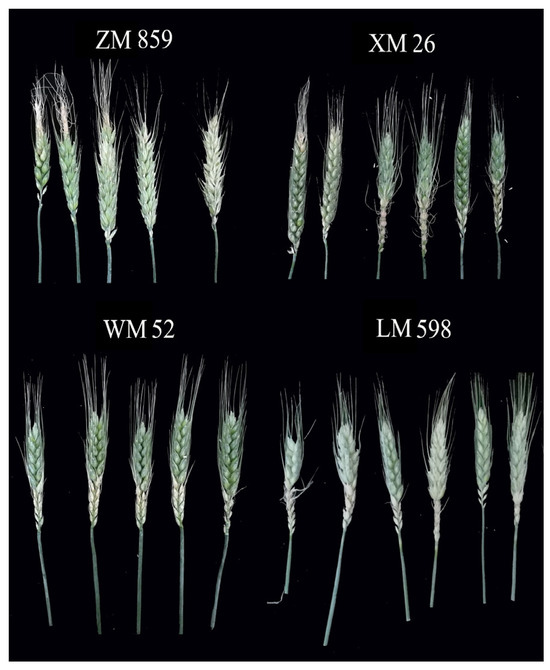
Figure 5.
Different varieties of winter wheat under LSCW (1).
While Liangxing66 (LX66) and Annong 0711 (AN0711) were affected by LSCW; the degradation of the top and lower spikelets was obvious, but the extent of the damaged spikelets generally did not exceed half of the spike. After the exposure of Guomai9 (GM9) and YN19 to LSCW, the spike degree of degradation was light, mainly concentrated in the top and base spikelets (Figure 6).
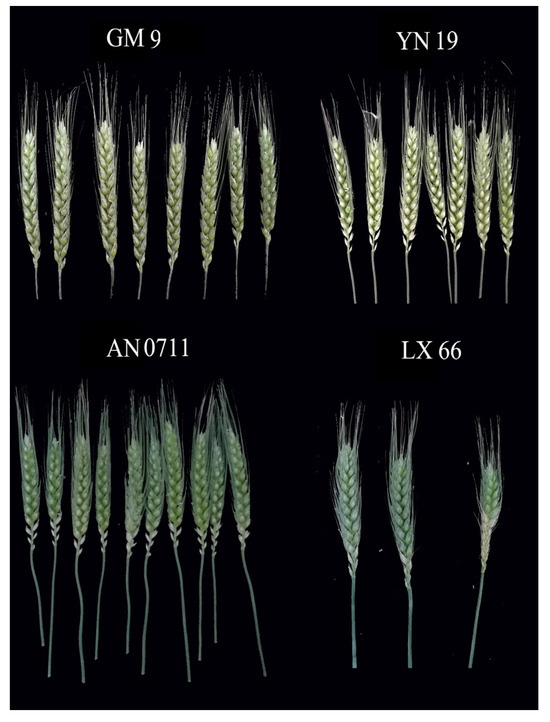
Figure 6.
Different varieties of winter wheat under LSCW (2).
3.2. Effect of LSCW on Damage to Spikes and Grain Number per Spike
3.2.1. Effect on Damage to Spikes and Spikelets
LSCW significantly affected the damaged spike rate of the test varieties. The rate of damaged spikes and the degree of damage varied according to the varieties (Table 2). ZM895, XM26, and Zhengmai366 (ZM366) had the most damaged spikes and many frozen spikes. The total damaged spike rate was as high as 50~65%, and the damaged spike rates in the mild (1/3 of spikelets not fruiting), moderate (1/3-1/2 of spikelets not fruiting), and severe (more than 1/2 of spikelets not fruiting) damage categories were 8~20%, 20~35%, and 15~20%, respectively. zhoumai27 (ZM27), zhengmai8329 (ZM8329), Fanmai5(FM5), WM52, and LM598 had damaged spike rates ranging from 20% to 50%. anke157(AK157), Xumai35(XM35), Huaimai33(HM33), Huaimai28(HM28), AN0711, and LX66 had damaged spike rates ranging from 6% to 10%. yn19, Shannong17 (SN17), GM9, Yannong5286 (YN5286), Yannong5158 (YN5158), and Jimai22 (JM22) had low damaged spike rates of less than 5%.

Table 2.
Effect of LSCW on damaged spike rates of different varieties.
3.2.2. Effects on Damage Rate in Spikelet Setting
LSCW significantly affected the damage to the spikelets of the test varieties, and there were significant differences in their damage (Table 3).

Table 3.
Effects of LSCW on damage rates in spikelet setting of different varieties.
The rate of damage to the ZM8329, ZM895, XM26, ZM366, and WM52 spikelets was as high as 65~75%. The rate of damage to the LM598, FM5, AK157, ZM27, HM28, XM35, and HM33 spikelets was higher, reaching 55~65%. The rate of damage to the JM22, YN5158, LX66, AN0711, and YN5286 spikelets was greater than 50% but not more than 55%. The rate of damage to the YN19, GM9, and SN17 spikelets was the lowest, amounting to less than 30%.
3.2.3. Effect of LSCW on Seed Yield
LSCW significantly affected the seed yields of the test varieties. The variation in seed yield varied among the different varieties of wheat (Table 4).

Table 4.
Effect of LSCW on yield and TLSCI of different varieties.
The seed yield of ZM895 was significantly lower than that of the other varieties, amounting to only 294.8 kg/ha. ZM366, FM5, XM26, WM52, AK157, and ZM8329 yielded between 350 kg and 380 kg/ha. The ZM27 and XM35 seed yields per hectare were at the lower-middle level, below 400 kg/ha. The HM33, HM28, JM22, and AN0711 seed yields were moderate, amounting to 400~450 kg/ha.
Several varieties, namely, LX66, YN5158, YN19, YN5286, and GM9, had higher yields between 450 kg and 500 kg/ha. The SN17 variety had the highest seed yield and the best steady yield performance of up to 511.5 kg/ha.
3.3. Comprehensive Evaluation of Resistance of Wheat Varieties to LSCW
3.3.1. Effects of LSCW on TLSCI
From Table 2 and Table 3, it can be seen that the combined rates of damage to the spikes and spikelets determine the degree of damage to the wheat spike, which ultimately leads to a reduction in wheat yield.
A comparison of the TLSCIs of different varieties after the LSCW event (Table 4) showed that the ZM895 TLSCI had the lowest value, amounting to only 0.722, followed by LM598, with a TLSCI of only 0.822. The ZM366, ZM8329, ZM26, WM52, FM5, and AK157 TLSCIs ranged from 0.85 to 0.95; the ZM27, XM35, HM33, HM28, JM22, and AN0711 TLSCIs reached 0.95~1.1; the LX66, YN5158, YN19, YN5286, and GM9 TLSCIs were higher, all exceeding 1.1; and the SN17 TLSCI was the largest, reaching 1.252.
The sizes of the TLSCI values of different wheat varieties under LSCW damage reflect the degree of spike damage, and the larger the TLSCI, the smaller the degree of spike loss.
3.3.2. Principal Component Analysis of Rates of Damaged Spikes, Damaged Spikelets, and TLSCI
According to the principal component analysis results of eight indexes of the tested materials shown in Table 5, principal component 1 mainly describes the yield, total damaged spikes, mildly LSCW-damaged spikes, moderately LSCW-damaged spikes, severely LSCW-damaged spikes, extremely severely LSCW-damaged spikes, and dead spike rates during the LSCW event. The absolute eigenvector value is the largest, and the contribution rate is 72.0410%. In principal component 2, the moderately LSCW-damaged spike rate had a larger feature vector, with a contribution rate of 10.9613%, while principal component 3 mainly represented the rate of damage to the spikelets, contributing 7.56672%. The cumulative contribution of the three principal components reached 90.5695%, which comprehensively summarized most of the data.

Table 5.
The results of principal component analysis.
Therefore, by analyzing the principal component structure and selecting the output, the rates of total damaged spikes, mildly LSCW-damaged spikes, severely LSCW-damaged spikes, and damage to the spikelets were further analyzed as indicators related to LSCW resistance.
3.3.3. Euclidean Clustering Method for Analyzing LSCW Resistance Traits in 20 Varieties
The Euclidean distance K-means method was used to cluster analyze the 20 wheat varieties experiencing LSCW and to study the degree of proximity among the LSCW resistance indexes of each variety. As can be seen from Table 6, the strength in LSCW resistance of the different varieties can be evaluated by the degree of proximity between the LSCW resistance indexes, the yield, the spike damage, and the size of the TLSCI.

Table 6.
The results of cluster analysis.
- Strong LSCW resistance: YN19, GM9, and SN17;
- Slightly strong LSCW resistance: AN0711, LX66, HM28, AK157, HM33, XM35, YN5286, YN5158, and JM22;
- Moderate LSCW resistance: ZM27, WM52, and LM598;
- Weak LSCW resistance: ZM895, XM26, ZM366, ZM8329, and FM5.
3.4. Effects of LSCW on Cell Ultrastructure of Different Wheat Varieties
3.4.1. Effect of LSCW on Morphology and Structure of Mesophyll Cells
Effect of LSCW on Morphology and Structure of Functional Leaf Cells
In the functional leaf blades, the chloroplasts of the two varieties of wheat tested (Figure 7A,D) were clearly structured and elliptical under the normal temperature treatment (CK, about 10 °C); most of them were very neatly arranged near the cell wall, and all of them had a large vesicle in the centers of their cells.
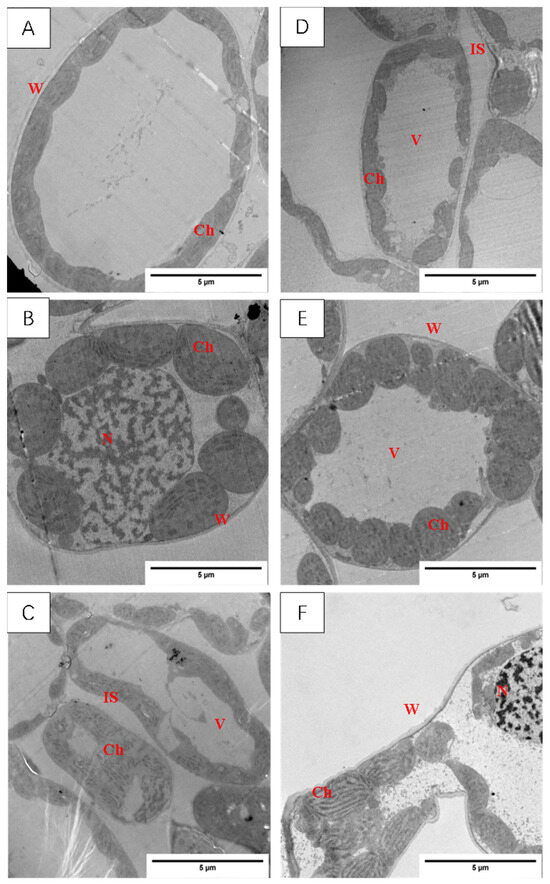
Figure 7.
Effect of LSCW on mesophyll cell structure of wheat functional leaves. Note: (A–C) show the mesophyll cell structure of XM26 at CK, 4 °C, and −4 °C, respectively (bar = 5 μm). (D–F) show the mesophyll cell structure of YN19 at CK, 4 °C, and −4 °C, respectively (bar = 5 μm). W: cell wall; IS: intercellular space; Ch: chloroplast; V: vacuole; N: nucleus.
After the T1 treatment, there was no obvious plasmolysis in the YN19 cells, and the protoplasm of the XM26 cells was wrinkled. The chloroplasts of the two varieties of wheat swelled slightly and were no longer neatly arranged close to the cell wall (Figure 7B,E).
After the T2 treatment of XM26, wheat leaf thin-walled-cell deformation and intracellular vacuolization occurred, most of the chloroplasts’ double membrane structure disappeared, and the contents leaked; the YN19 wheat leaf cell’s shape began to deform, the chloroplasts arranged in a chaotic position, and parts of the chloroplasts began to disintegrate (Figure 7C,F). It can be seen that 4 h of low-temperature stress caused damage to the structure of the wheat cell membrane and organelle membrane, and the degree of damage to XM26, a variety with weak resistance to LSCW, was greater than that of YN19, a variety with strong resistance to LSCW.
Effect of LSCW on Chloroplast Morphology and Structure
The chloroplast structures of the two tested varieties’ wheat leaf blades (Figure 8) in the normal temperature treatment (CK), according to the basal arrangement rules, include close basal lamellae, structural integrity, and neat stomping along the long axis; among these elements, there are a small number of osmiophilic particles within the chloroplasts of the XM26 wheat leaf blades.
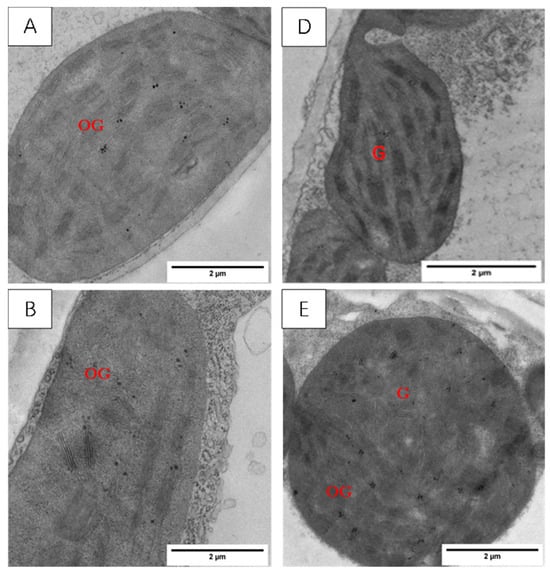
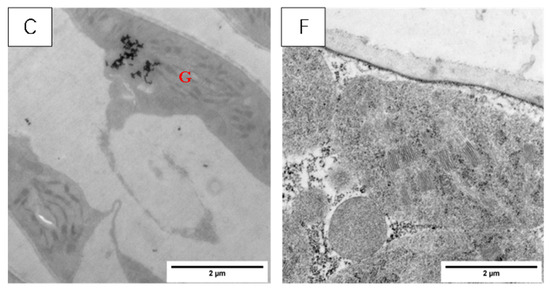
Figure 8.
Effect of LSCW on chloroplast structure of wheat functional leaves. Note: (A–C) show chloroplast structures of XM26 treated at CK, 4 °C, and −4 °C, respectively (bar = 2 μm). (D–F) show chloroplast structures of YN19 treated at CK, 4 °C, and −4 °C, respectively (bar =2 μm). G: grana; OG: osmophilic granules.
After the T1 treatment, the two varieties of wheat chloroplast were slightly swollen, the arrangement of the cysts became chaotic, and osmiophilic particles appeared in the chloroplasts. (Figure 8B,E).
After the T2 treatment, the chloroplasts of the YN19 wheat leaves were swollen and cracked, with cavities appearing inside; the bilayer membrane structure disappeared; and the basal lamellae loosened (Figure 8F); for the XM26 wheat leaves, most of the chloroplasts’ bilayer membrane structure disappeared, and chloroplast and basal lamellae disintegration occurred (Figure 8C). Comparative observations of the chloroplast structures of the two varieties showed that YN19, a strong LSCW-resistant variety, could more easily maintain a relatively stable chloroplast structure after exposure to low temperatures compared with XM26, a variety with weak LSCW resistance.
Effect of LSCW on Mitochondrial Morphology and Structure
As can be gleaned from Figure 9, the mitochondria of the two wheat varieties’ functional leaves under the normal temperature treatment (CK) were ellipsoidal, with an obvious double-membrane structure, a large number of cristae uniformly distributed in the inner part, and clear and regular cristae, and the mitochondria were mostly distributed between the two chloroplasts.
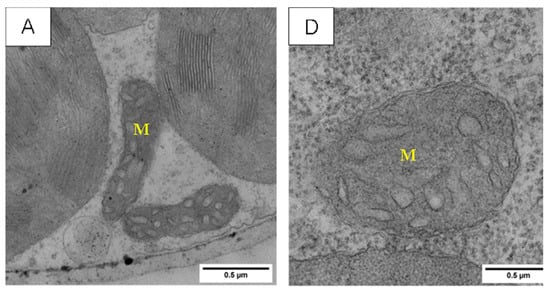
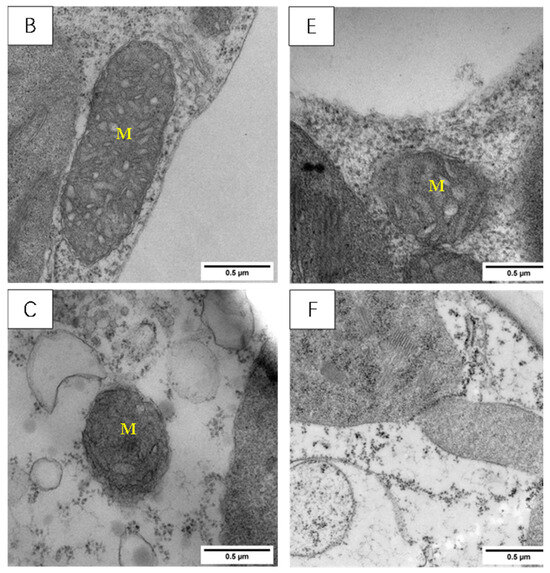
Figure 9.
Effect of LSCW on mitochondrial structure of wheat functional leaves. Note: (A–C) show the mitochondrial structures of XM26 treated at CK, 4 °C, and −4 °C, respectively. (D–F) show YN19 at CK, 4 °C, and −4 °C, respectively. M: mitochondria. Bar = 0.5 μm.
3.4.2. Effect of LSCW on Morphology and Structure of Young Ear Cells
As shown in Figure 10, treatment temperatures above and below 0 °C caused different degrees of damage to the ultrastructure of the cells in the young ears of the two varieties of wheat.
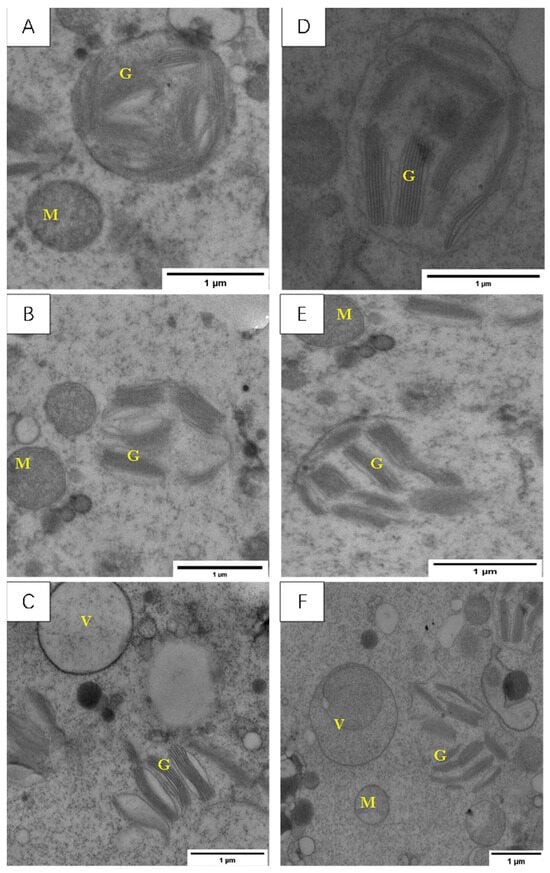
Figure 10.
Effect of LSCW on mesophyll cell structure of wheat young ears. Note: (A–C) show the mitochondrial structures of XM26 treated at CK, 4 °C, and −4 °C, respectively. (D–F) show YN19 at CK, 4 °C, and −4 °C, respectively. M: Mitochondria; G: grana; V: vacuole. Bar = 1 μm.
After the T1 treatment, the chloroplast plasma membrane of the YN19 young ears had ruptured, the basal lamellae were blurred, and the mitochondria were deformed (Figure 10); in XM26, the large vesicles were deformed; the chloroplast plasma membranes had completely disappeared; the basal lamellae were swollen, blurred, and scattered; and the mitochondria were swollen and rounded (Figure 10B).
After the T2 treatment, both the YN19 and XM26 cell morphologies were severely damaged, and the cell and organelle membrane structures completely disappeared; in YN19, the large vesicles disintegrated into small vesicles; in XM26, the large vesicles were concave. The chloroplast inclusions of both species spilled out in a state of disorder, and the mitochondrial cristae disappeared and became flat and smooth (Figure 10C,F).
3.4.3. Effect of LSCW on Morphology and Structure of Cells from Internode below Young Ear
Figure 11 shows that LSCW caused different degrees of damage to the morphology of the cells from the internodes below the young ears in the two varieties. The cells in the internodes below the young ears of YN19, a variety with strong resistance to LSCW, were more stable in terms of cell structure and showed almost no significant damage to the organelles after exposure to low-temperature stress compared with XM26, a variety with weak resistance to LSCW. This difference was more pronounced in the T2 treatment.
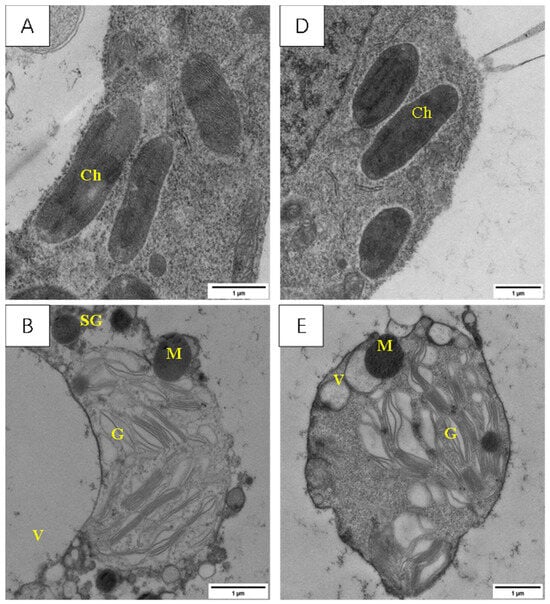
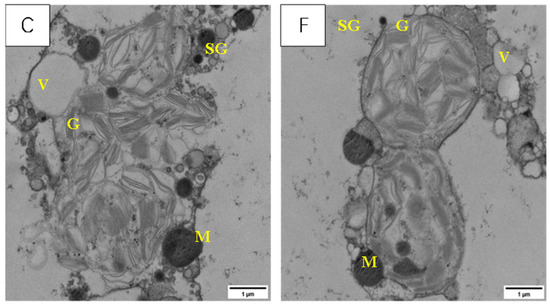
Figure 11.
Effect of LSCW on mesophyll cell structure of wheat internode below young ears. Note: (A–C) show the mitochondrial structures of XM26 treated at CK, 4 °C, and −4 °C, respectively. (D–F) show YN19 at CK, 4 °C, and −4 °C, respectively. Ch: chloroplast; M: mitochondria; G: grana; V: vacuole; SG: starch granule. Bar = 1 μm.
The membrane systems of the internode cells of the CK were intact (Figure 11A,D).
After the T1 treatment, there was no obvious damage to the membrane structure of the internode cells of YN19 (Figure 11E), whereas in XM26, the rupturing of the membrane of the internode cells had disappeared, starch grains appeared, and the mitochondrial membrane and cristae disappeared (Figure 11B).
After the T2 treatment, the cell membrane system of YN19 remained intact, the mitochondria exhibited no obvious deformations, and a small number of starch grains appeared in the cytosol (Figure 11F), whereas the cell and organelle membranes of XM26 were all ruptured, the contents were discharged, and a large number of starch grains had accumulated (Figure 11C).
4. Discussion
4.1. The Advantages and Disadvantages of Identification Methods Used to Study Resistance to LSCW and the Basis for Establishing Evaluation Indexes
The resistance of wheat to LSCW is a complex biological characteristic that is determined by many factors [27]. By investigating the spikelet loss and yield changes in different wheat varieties after an LSCW event, this experiment identified the LSCW resistance of the main wheat varieties grown in 20 major wheat-producing areas in China. From the perspective of field cultivation, the cold resistance of different wheat varieties can be easily and quickly investigated. This is an easy method used to identify wheat resistance to LSCW. But there are limitations to this approach. First, the wheat cultivated under natural conditions in a field may suffer from diseases, insect pests, droughts, dry hot air, and other natural disasters, in addition to the harm caused by cold during the spring. The influence of yield on this evaluation index may be the result of compounded disasters, and the accuracy of LSCW resistance identification will be affected only by the yield loss rate. Therefore, evaluating the LSCW resistance of different varieties according to the total number of damaged spikes, spikelets, and the TLSCI is a simple and reliable method. In addition, the effects of LSCW on the agronomic traits and physiological and biochemical response mechanisms were combined to evaluate the resistance of different varieties to cold spring reversion, the results of which could be used to more accurately identify and evaluate the resistance of wheat to LSCW.
4.2. Classification of Different Varieties into LSCW-Resistant Phenotypes for Application in Wheat Breeding and Production
The classification of wheat varieties according to this evaluation index can aid studies on the molecular mechanism of resistance to LSCW and breeding new wheat varieties that are resistant to LSCW. In wheat production, the varieties can be divided according to their different cold-resistance capacities, and the varieties with different resistance levels to LSCW can be selected according to their locations. This process can also be used to adjust the sowing date and density, the provision of water, fertilizer operations, and technical measures for preventing and controlling LSCW damage [28,29]; realizing disaster prevention, resistance, and reduction; and ensuring high yields and quality and the efficient development of wheat [14].
4.3. The Ultrastructural Changes in Wheat Cells under LSCW Stress Are Important Indicators of Resistance to LSCW
Other studies have found that the destruction of the cell membrane structure under low-temperature stress is the root cause of physiological and metabolic abnormalities and the death of crops; first, the membrane structure of chloroplasts is destroyed at low temperatures [30]. When the external ambient temperature drops to the critical temperature for plants, the result is a phase change in cell membrane lipids, transforming from a flowing liquid-crystal state to a solidified gel state, inhibiting the flow of protoplasm, resulting in the contraction of the membrane, which leads to the appearance of cracks or channels [31]. This change not only increases membrane permeability and promotes intracellular solute extravasation but also destroys the membrane-bound enzyme system and breaks its balance with the non-membrane-bound enzyme system, leading to cellular metabolic disorders and functional disorders, ultimately causing irreversible damage to plants [32]. Wang X.N. et al. [33] showed that the leaf sheath plasma membrane of wheat varieties with strong resistance to cold is more stable than that of the varieties with weak cold resistance, and the stabilization of the leaf sheath plasma membrane in cold-region wheat during the freezing period helps to improve its cold resistance. Triene fatty acids (TAs) are the main unsaturated fatty acids in plant membrane lipids. Routaboul et al. [34] found that increasing the content of TAs in the chloroplast membranes enhanced cold tolerance in the early stage of plant growth. It has been suggested that the larger the proportion of unsaturated fatty acids in the membrane lipid composition of plant cells, the higher the fatty acid unsaturation index, the lower the temperature at which the membrane lipid undergoes a phase transition, and the higher the cold stability of the membrane and the greater its cold resistance [35,36]. In this study, we found that the cell and organelle membranes of YN19, which is highly resistant to LSCW, were more stable under low-temperature stress than those of XM26, which is weakly resistant to LSCW. Therefore, improving the cold stability of cell membranes is a fundamental way of enhancing the LSCW resistance ability of wheat.
The integrity of plants’ morphology and structure is the prerequisite for maintaining plant growth and development, and the change in plants’ ultrastructure under stress is an important indicator of the plants’ stress resistance [37,38]. Lei Bin et al. [39] found that in uncoated cotton seedlings kept at a low temperature of 5 °C, the chloroplasts in their leaves expanded into spheroids, the structure of the grana lamella became loose, and the chloroplasts scattered in the cells, while the other organelles such as the mitochondria exhibited relatively stable performance. In this study, it was found that the shape and structure of the two wheat varieties’ chloroplasts changed in the LSCW treatment at 4 °C, and osmiophilic particles acting as lipid reservoirs of the chloroplasts began to appear, indicating that they began to senesce; the bilayer membrane structure of the chloroplasts was dissolved, the basal lamellar structure of basal lamellae was dispersed in the LSCW treatment at −4 °C, and the structure of the functional leaf chloroplasts was completely destroyed. Fu Lianshuang et al. [40] showed that compared with chloroplasts, mitochondria are more stable under low-temperature stress. The results of their experiment are consistent with the results of this study. When chloroplast disintegration occurs, the mitochondria are only blurred by the inner cristae but are still able to keep their structures intact.
Previous studies showed that most of the functional leaves and internodes below the young ears of strongly LSCW-resistant wheat varieties did not undergo morphological changes after stress occurred [41], whereas the cellular structure of the functional leaves of the weakly LSCW-resistant wheat varieties was severely damaged [42]. Furthermore, the cell walls were decomposed; the cytoplasm appeared to be vacuolated; the chloroplasts were broken; the vesicle-like system was scattered; and the cristae of the inner mitochondrion were also destroyed. These cytoskeletal alterations are irreversible, and they have a serious impact on the growth and development of plant [43].
Photosynthetic capacity is determined by the structure of mesophyll cells, in which the chloroplasts are the sites of photosynthesis in higher plants, and the closely arranged chloroplast grana lamella can improve the photosynthetic rate of leaves [44]. Liu et al. [45] studied the effects of low-temperature stress and low-temperature stress + cadmium stress on the chloroplast ultrastructure of wheat leaves. The results showed that the chloroplast structures were distorted by the low-temperature treatments, as exemplified by the disappearance of the chloroplast membrane, enlarged starch grains, and greater number of osmiophilic lipid droplets. The XM26 chloroplasts decreased at a much higher rate than those of YN19 under LCSW, suggesting that the chloroplast structure of YN19 was more stable and could still maintain a relatively dense light-trapping structure under stress. In addition, the chloroplasts swelled and changed from an ellipsoid to globular form after the LSCW event at 4 °C, but this did not occur under LCSW at −4 °C, which might be due to the disassembly of the chloroplasts at −4 °C [46,47].
Low-temperature stress at −4 °C resulted in severe damage to the internodes below the young ears of XM26, a variety with weak LSCW resistance, which hindered the transport of photosynthetic products to the reproductive organs [48], affected the accumulation of osmotic-regulatory substances in the ears resistant to LSCW, led to the degeneration of the spikelets and the abortion of florets, and, finally, affected the grain yield [49]. After the LSCW event, maintaining the stability of the cells from the internodes below the young ears may be one of the reasons why wheat becomes more resistant to LSCW.
This study demonstrates that, using 0 °C as the threshold, subzero-temperature stress hinders wheat growth and development by causing irreversible damage, such as plasmalemma–wall separation and the destruction of biofilm structures. The stability of the cell structure of the LSCW-resistant varieties is stronger than that of the LSCW-sensitive varieties, which facilitates the recovery of photosynthesis and the ability of internodes below the young ears to transport photosynthetic products [50,51,52] and accelerate the remanufacturing of photosynthetic products in order to ultimately continue the growth and development of wheat [53,54,55,56].
5. Conclusions
The disruption of the ultrastructure of wheat cells is the root cause of the decline in wheat yield and quality due to LSCW. LSCW directly affects the synthesis and storage of photosynthesis products in wheat and hinders their transportation to reproductive organs by destroying the cellular ultrastructure of the wheat leaves, young ears, and internodes below the young ears, ultimately leading to the degeneration of spikelets and floret abortion and reducing grain yield and quality.
This study indicates that the change in grain number per spike is the main reason behind the yield reduction caused by LSCW, and the indicators of resistance to LSCW can be constructed on the basis of spikelet characteristics. Pertinent to China’s main wheat-producing regions, SN17, YN19, and GM9 have strong LSCW resistance and a stable yield, which are suitable for promotion and planting. However, ZM895, XM26, ZM366, ZM8329, and FM5 are sensitive to LSCW. We should pay close attention to the effect of climate change on wheat at the anther differentiation stage and take preventive and control measures, such as cultivating strong seedlings to resist disasters, irrigating to prevent disasters before cooling, and spraying foliar fertilizers after disasters to alleviate damage to wheat.
The natural environment is complex and variable, and its impact on wheat cultivation is also different in various regions, so the simulation of a meteorological disaster such as LSC cannot be fully replicated in a laboratory. Wheat’s resistance to LSCW is closely related to its growing environment. In a field trial study, besides the uncontrollable intensity and duration of the LSCW event, environmental factors, such as drought, waterlogging, diseases, and insect pests, all have an impact on the normal development of wheat. Therefore, more in-depth research is needed to better explore the effects and mechanisms of the multiple biotic and abiotic stresses occurring under imposed adversity stress to carry out targeted research that comprehensively considers the growth and development characteristics of wheat and the growth environment and to more accurately combine different LSCW-resistant morphologies and physiological indexes for the evaluation and identification of wheat varieties that are resistant to LSCW.
Author Contributions
Conceptualization, Y.Z. and J.L.; Formal analysis, Y.Z. and J.L.; Methodology, Y.Z., H.X. and X.C.; Resources, J.L.; Software, L.L. and H.C.; Writing—original draft, Y.Z.; Writing—review and editing, X.C. and J.L. All authors have read and agreed to the published version of the manuscript..
Funding
This work was supported by the Major Science and Technology Projects in Anhui Province (202003b06020021), the Natural Science Foundation of Anhui Province (2008085QC122), and the Special Fund for Anhui Agriculture Research System.
Institutional Review Board Statement
Not applicable.
Informed Consent Statement
Not applicable.
Data Availability Statement
Data are contained within the article.
Conflicts of Interest
The authors declare no conflict of interest.
References
- Ortiz, R.; Sayre, K.D.; Govaerts, B.; Gupta, R.; Subbarao, G.; Ban, T.; Hodson, D.; Dixon, J.M.; Ortiz-Monasterio, J.I.; Reynolds, M. Climate change: Can wheat beat the heat? Agric. Ecosyst. Environ. 2008, 126, 46–58. [Google Scholar] [CrossRef]
- Lobell, D.B.; Gourdji, S.M. The influence of climate change on global crop productivity. Plant Physiol. 2012, 160, 1686–1697. [Google Scholar] [CrossRef] [PubMed]
- Ray, D.K.; Mueller, N.D.; West, P.C.; Foley, J.A. Yield Trends Are Insufficient to Double Global Crop Production by 2050. PLoS ONE 2013, 8, e66428. [Google Scholar] [CrossRef]
- Special Report. Global Warming of 1.5 °C. The Intergovernmental Panel on Climate Change (IPCC), 2018. Available online: https://www.ipcc.ch/report/sr15 (accessed on 9 November 2023).
- Barlow, K.M.; Christy, B.P.; O’Leary, G.J.; Riffkin, P.A.; Nuttall, J.G. Simulating the impact of extreme heat and frost events on wheat crop production: A review. Field Crop. Res. 2015, 171, 109–119. [Google Scholar] [CrossRef]
- Tshewang, S.; Jessop, R.; Birchall, C. Effect of frost on triticale and wheat varieties at flowering in the north eastern Australian cereal belt. Cereal Res. Commun. 2017, 45, 655–664. [Google Scholar] [CrossRef]
- Crimp, S.J.; Zheng, B.; Khimashia, N.; Gobbett, D.L.; Chapman, S.; Howden, M.; Nicholls, N. Recent changes in southern Australian frost occurrence: Implications for wheat production risk. Crop Pasture Sci. 2016, 67, 801–811. [Google Scholar] [CrossRef]
- Holman, J.D.; Schlegel, A.J.; Thompson, C.R.; Lingenfelser, J.E. Influence of precipitation, temperature and 56 years on winter wheat yields in western Kansas. Crop Manag. 2011, 10, 11–21. [Google Scholar] [CrossRef]
- Frederiks, T.M.; Christopher, J.T.; Borrel, A.K. Investigation of Post Head-Emergence Frost Resistance in Several CIMMYT Synthetic and Queensland wheats. In Proceedings of the 4th International Crop Science Congress, Brisbane, QLD, Australia, 26 September–1 October 2004. [Google Scholar]
- Frederiks, T.M.; Christopher, J.T.; Borrell, A.K. Low Temperature Adaption of Wheat Post Head-Emergence in Northern Australia. In Proceedings of the 11th International Wheat Genetics Symposium, Sydney University, Camperdown, NSW, Australia, 27 August 2008. [Google Scholar]
- Zhao, H.; Wang, X.; Hu, W.; Cao, T.; Liu, Z.; Chen, Y. Status and suggestion of wheat variety utilization in southern Huang-Huai wheat region. J. Henan Agric. Sci. 2016, 45, 18–24. [Google Scholar] [CrossRef]
- FAO. FAO Statistical Yearbook. 2013. Available online: http://www.fao.org/docrep/018/i3107e/i3107e.pdf (accessed on 9 November 2023).
- Qian, Y.L.; Wang, J.L.; Zheng, C.L.; Yang, F.Y.; Song, Y.L.; Song, Y.B. Spatial-temporal change of low temperature disaster of winter wheat in North China in last 50 years. Chin. J. Ecol. 2014, 33, 3245–3253. [Google Scholar] [CrossRef]
- Xiao, L.; Liu, B.; Zhang, H.; Gu, J.; Fu, T.; Asseng, S.; Liu, L.; Tang, L.; Cao, W.; Zhu, Y. Modeling the response of winter wheat phenology to low temperature stress at elongation and booting stages. Agric. For. Meteorol. 2021, 303, 108376. [Google Scholar] [CrossRef]
- Li, C.-Y.; Xu, W.; Liu, L.-W.; Yang, J.; Zhu, X.-K.; Guo, W.-S. Changes of endogenous hormone contents and antioxidative enzyme activities in wheat leaves under low temperature stress at jointing stage. Chin. J. Appl. Ecol. 2015, 26, 2015–2022. [Google Scholar] [CrossRef]
- Zheng, J.C.; Liu, T.; Zheng, Q.X.; Li, J.Q.; Qian, Y.C.; Li, J.C.; Zhan, Q.W. Identification of cold tolerance and analysis of genetic diversity for major wheat varieties in jianghuai region of china. Pak. J. Bot. 2020, 3, 839–849. [Google Scholar] [CrossRef]
- Zhang, W.; Wang, J.; Huang, Z.; Mi, L.; Xu, K.; Wu, J.; Fan, Y.; Ma, S.; Jiang, D. Effects of Low Temperature at Booting Stage on Sucrose Metabolism and Endogenous Hormone Contents in Winter Wheat Spikelet. Front. Plant Sci. 2019, 10, 498. [Google Scholar] [CrossRef] [PubMed]
- Kaznina, N.M.; Batova, Y.V.; Laidinen, G.F.; Sherudilo, E.G.; Titov, A.F. Low-temperature adaptation of winter wheat seedlings under excessive zinc content in the root medium. Russ. J. Plant Physiol. 2019, 66, 763–770. [Google Scholar] [CrossRef]
- Dolferus, R.; Powell, N.; Ji, X.; Ravash, R.; Edlington, J.; Oliver, S.; Van Dongen, J.; Shiran, B. The Physiology of Reproductive-Stage Abiotic Stress Tolerance in Cereals. In Molecular Stress Physiology of Plants; Rout, G.R., Das, A.B., Eds.; Springer: New Delhi, India, 2013; pp. 193–216. [Google Scholar]
- Zhang, Y.T.; Zhu, Q.Y.; Zhang, M.; Guo, Z.H.; Yang, J.J.; Mo, J.X.; Cui, J.B.; Hu, H.L.; Xu, J. Individual cryptomeria fortunei hooibrenk clones show varying degrees of chilling stress resistance. Forests 2020, 11, 189. [Google Scholar] [CrossRef]
- Notice of the Ministry of Agriculture of People’s Republic of China. Ministry of Agriculture of the PRC, Beijing, China. Available online: http://www.moa.gov.cn/ (accessed on 9 November 2023).
- Mukherjee, A.; Wang, S.Y.S.; Promchote, P. Examination of the Climate Factors That Reduced Wheat Yield in Northwest India during the 2000s. Water 2019, 11, 343. [Google Scholar] [CrossRef]
- Liu, Y.; Su, L.; Wang, Q.; Zhang, J.; Shan, Y.; Deng, M. Comprehensive and quantitative analysis of growth characteristics of winter wheat in China based on growing degree days. Adv. Agron. 2020, 159, 237–273. [Google Scholar] [CrossRef]
- Ji, H.; Xiao, L.; Xia, Y.; Song, H.; Liu, B.; Tang, L.; Cao, W.; Zhu, Y.; Liu, L. Effects of jointing and booting low temperature stresses on grain yield and yield components in wheat. Agric. For. Meteorol. 2017, 243, 33–42. [Google Scholar] [CrossRef]
- Crimp, S.; Bakar, K.S.; Kokic, P.; Jin, H.; Nicholls, N.; Howden, M. Bayesian spacetime model to analyse frost risk for agriculture in Southeast Australia. Int. J. Climatol. 2014, 35, 2092–2108. [Google Scholar] [CrossRef]
- Potithep, S.; Yasuoka, Y. Application of the 3-PG model for gross primary productivity estimation in deciduous broadleaf forests: A study area in Japan. Forests 2011, 2, 343–349. [Google Scholar] [CrossRef]
- Shi, D.; Wei, X.; Chen, G. Effects of low temperature on photosynthetic characteristics in the super-high-yield hybrid rice ‘Liangyoupeijiu’ at the seedling stage. Genet. Mol. Res. 2016, 15, gmr15049021. [Google Scholar] [CrossRef]
- Khakwani, A.A.; Dennett, M.D.; Munir, M. Early growth response of six wheat varieties under artificial osmotic stress condition. Pak. J. Agri. Sci. 2011, 48, 119–123. Available online: http://www.pakjas.com.pk (accessed on 9 November 2023).
- Porker, K.; Straight, M.; Hunt, J.R. Evaluation of G × E × M interactions to increase harvest index and yield of early sown wheat. Front. Plant Sci. 2020, 11, 994. [Google Scholar] [CrossRef]
- Zheng, G.; Tian, B.; Zhang, F.; Tao, F.; Li, W. Plant adaptation to frequent alterations between high and low temperatures: Remodelling of membrane lipids and maintenance of unsaturation levels. Plant Cell Environ. 2011, 34, 1431–1442. [Google Scholar] [CrossRef]
- Lukatkin, A.S.; Brazaityte, A.; Bobinas, C.; Duchovskis, P. Chilling injury in chilling-sensitive plants: A review. Zemdirbyste 2012, 99, 111–124. [Google Scholar] [CrossRef]
- Landi, M. Commentary to: “Improving the thiobarbituric acid-reactive-substances assay for estimating lipid peroxidation in plant tissues containing anthocyanin and other interfering compounds” by Hodges et al., Planta (1999) 207:604–611. Planta 2017, 245, 1067. [Google Scholar] [CrossRef] [PubMed]
- Wang, X.N.; Xie, D.W.; Fu, L.S. Plasma Membrane Stability in Leaf Sheath of Cold-area Winter Wheat with Different Cold Resistance. J. Triticeae Crops 2013, 33, 477–482. Available online: https://www.cnki.net/kcms/detail/61.1359.S.20130305.1147.021.html (accessed on 9 November 2023).
- Routaboul, J.-M.; Fischer, S.F.; Browse, J. Trienoic Fatty Acids Are Required to Maintain Chloroplast Function at Low Temperatures. Plant Physiol. 2000, 124, 1697–1705. [Google Scholar] [CrossRef]
- Iba, K. Acclimative response to temperature stress in higher plants: Approaches of gene engineering for temperature tolerance. Annu. Rev. Plant Biol. 2002, 53, 225–245. [Google Scholar] [CrossRef]
- Upchurch, R.G. Fatty acid unsaturation, mobilization, and regulation in the response of plants to stress. Biotechnol. Lett. 2008, 30, 967–977. [Google Scholar] [CrossRef]
- Venzhik, Y.; Talanova, V.; Titov, A. The effect of abscisic acid on cold tolerance and chloroplasts ultrastructure in wheat under optimal and cold stress conditions. Acta Physiol. Plant. 2016, 38, 63. [Google Scholar] [CrossRef]
- Venzhik, Y.; Deryabin, A.; Moshkov, I.; Timiryazev, K.A. Adaptive strategy of plant cells during chilling: Aspect of ultrastructural reorganization. Plant Sci. 2023, 332, 111722. [Google Scholar] [CrossRef] [PubMed]
- Bin, L.E.I.; Jin, L.I.; Liu-sheng, D.U.A.N.; Peng-zhong, Z.H.A.N.G.; Jie, L.I.; Wei-ming, T.A.N. Effects of seed coating agents on external morphology and ultrastructure of cotton radicles and seedings under low temprature treatment. Chin. J. Agrometeorol. 2017, 38, 248–256. [Google Scholar]
- Fu, L.S.; Wang, X.N.; Wang, X.D.; Xie, F.D.; Li, Z.F. Comparison of cell ultrastructure between winter wheat cultivars during cold acclimation and freezing period. J. Triticeae Crops 2010, 30, 66–72. [Google Scholar] [CrossRef]
- Han, S.H.; Wang, S. Electron microscopic observation on mitochondria of an especial cold-hardened plant in winter. Acta Bot. Sin. 2000, 4, 539–543+697–698. [Google Scholar] [CrossRef]
- Bhadra, P.; Maitra, S.; Shankar, T.; Hossain, A.; Praharaj, S.; Aftab, T. Climate change impact on plants:plant responses and adaptations. In Plant Perspectives to Global Climate Changes; Academic Press: Cambridge, MA, USA, 2022; pp. 1–24. [Google Scholar] [CrossRef]
- Lu, Y.; Hu, Y.; Snyder, R.L.; Kent, E.R. Tea leaf’s microstructure and ultrastructure response to low temperature in indicating critical damage temperature. Inf. Process. Agric. 2019, 6, 247–254. [Google Scholar] [CrossRef]
- Ren, B.Z.; Zhang, J.W.; Dong, S.T.; Liu, P.; Zhao, B. Effects of waterlogging on leaf mesophyll cell ultrastructure and photosynthetic characteristics of summer maize. PLoS ONE 2016, 11, e0161424. [Google Scholar] [CrossRef]
- Liu, L.; Li, S.X.; Guo, J.H.; Li, N.; Jiang, M.; Li, X.N. Low temperature tolerance is depressed in wild-type and abscisic acid-deficient mutant barley grown in Cd-contaminated soil. J. Hazard. Mater. 2022, 430, 128489. [Google Scholar] [CrossRef]
- Wang, W.; Wang, X.; Zhang, J.; Huang, M.; Cai, J.; Zhou, Q.; Dai, T.; Jiang, D. Salicylic acid and cold priming induce late-spring freezing tolerance by maintaining cellular redox homeostasis and protecting photosynthetic apparatus in wheat. Plant Growth Regul. 2019, 90, 109–121. [Google Scholar] [CrossRef]
- Fuller, M.P.; Fuller, A.M.; Kaniouras, S.; Christophers, J.; Fredericks, T. The freezing characteristics of wheat at ear emergence. Eur. J. Agron. 2007, 26, 435–441. [Google Scholar] [CrossRef]
- Venzhik, Y.V.; Titov, A.F.; Talanova, V.V.; Miroslavov, E.A.; Koteeva, N.K. Structural and functional reorganization of the photosynthetic apparatus in adaptation to cold of wheat plants. Cell Tissue Biol. 2013, 7, 168–176. [Google Scholar] [CrossRef]
- Babenko, L.M.; Kosakivska, I.V.; Akimov, Y.A.; Klymchuk, D.O.; Skaternya, T.D. Effect of temperature stresses on pigment content, lipoxygenase activity and cell ultrastructure of winter wheat seedlings. Genet. Plant Physiol. 2014, 4, 117–125. Available online: http://www.ifrg-bg.com (accessed on 9 November 2023).
- Chaudhry, S.; Sidhu, G.P.S. Climate change regulated abiotic stress mechanisms in plants: A comprehensive review. Plant Cell Rep. 2022, 41, 1–31. [Google Scholar] [CrossRef] [PubMed]
- Osman, R.; Zhu, Y.; Ma, W.; Zhang, D.; Ding, Z.; Liu, L.; Tang, L.; Liu, B.; Cao, W. Comparison of wheat simulation models for impacts of extreme temperature stress on grain quality. Agric. For. Meteorol. 2020, 288, 107995. [Google Scholar] [CrossRef]
- Allen, D.J.; Ort, D.R. Impacts of chilling temperatures on photosynthesis in warm-climate plants. Trends Plant Sci. 2001, 6, 36–42. [Google Scholar] [CrossRef]
- Thakur, P.; Kumar, S.; Malik, J.A.; Berger, J.D.; Nayyar, H. Cold stress effects on reproductive development in grain crops: An overview. Environ. Exp. Bot. 2010, 67, 429–443. [Google Scholar] [CrossRef]
- Izhar Shafi, M.; Adnan, M.; Fahad, S.; Wahid, F.; Khan, A.; Yue, Z.; Danish, S.; Zafar-ul-Hye, M.; Brtnicky, M.; Datta, R. Application of single superphosphate with humic acid improves the growth, yield and phosphorus uptake of wheat (Triticum aestivum L.) in calcareous soil. Agronomy 2020, 10, 1224. [Google Scholar] [CrossRef]
- Gururani, M.A.; Venkatesh, J.; Tran, L.S.P. Regulation of photosynthesis during abiotic stress-induced photoinhibition. Mol. Plant 2015, 8, 1304–1320. [Google Scholar] [CrossRef]
- Hussain, S.; Ulhassan, Z.; Brestic, M.; Zivcak, M.; Zhou, W.J.; Allakhverdiev, S.I.; Yang, X.H.; Safdar, M.E.; Yang, W.Y.; Liu, W.G. Photosynthesis research under climate change. Photosynth. Res. 2021, 150, 5–19. [Google Scholar] [CrossRef]
Disclaimer/Publisher’s Note: The statements, opinions and data contained in all publications are solely those of the individual author(s) and contributor(s) and not of MDPI and/or the editor(s). MDPI and/or the editor(s) disclaim responsibility for any injury to people or property resulting from any ideas, methods, instructions or products referred to in the content. |
© 2023 by the authors. Licensee MDPI, Basel, Switzerland. This article is an open access article distributed under the terms and conditions of the Creative Commons Attribution (CC BY) license (https://creativecommons.org/licenses/by/4.0/).