Abstract
As a temperature-loving crop, rice is sensitive to low temperatures. With the popularization of direct-seeded rice, cold tolerance (CT) at the bud burst stage has become an important breeding goal. Here, we evaluated CT for 513 rice accessions at the bud burst stage. A total of 13 QTLs were detected by genome-wide association analysis using the severity of damage (SD) and survival rate of seedlings (SR) as indicators of CT. Based on analyses of LD blocks, GO enrichment, gene expression and haplotype, we identified five genes, LOC_Os01g35184, LOC_Os01g56150, LOC_Os01g73410, LOC_Os02g36740, and LOC_Os09g28180, as the most likely candidates for qSD1-1, qSD1-4, qSD1-5, qSD2-1, and qSR9-1, respectively, for CT. The accumulative effects of favorable haplotypes for the above five most likely candidate genes played an important role in the improvement of the CT of rice cultivars. Hence, this study has furnished valuable insights for advancing gene cloning and pyramiding breeding, aiming to enhance cold tolerance during the bud burst stage in rice.
1. Introduction
With the projected increase in population, the United Nations Organization for Food and Agriculture estimates that global food production must increase by 70% by 2050 to meet the food needs of the world population [1]. Rice (Oryza sativa L.), as one of the most important cereal crops, is crucial for food security [2]. As food demand increases, it is necessary to expand cultivation to high latitudes and elevations, where cold stress often occurs with increasing frequency [3]. In recent years, as global climate change has intensified, the occurrence of extreme low-temperature events has risen, resulting in an increased frequency of rice chilling injuries. Because of its low cost and simple operation, direct seeding has become the main choice for rice cultivation instead of artificial transplanting [4]. In contrast, direct-seeded rice involves sowing seeds or budding seeds directly into a field irrigated with cold water, which makes the seeds more fragile to cold stress and further reduces the germination rate of the seeds, resulting in poor establishment of seedling population due to seed death [5]. As a result, enhancing the CT of rice varieties during the bud stage has evolved into a pivotal breeding objective for direct-seeded rice.
CT in rice is an intricate trait governed by multiple quantitative trait loci (QTLs) [6]. Through different mapping populations such as double haploid lines (DHs), recombinant inbred lines (RILs), and chromosome segment substitution lines (CSSLs), researchers have identified many QTLs associated with CT at different developmental stages in rice, including the germination stage, the seedling stage, and the booting stage (Table 1) [5,7,8,9,10,11,12,13,14,15,16,17,18]. In contrast, limited reports are available for CT at the bud burst stage in rice. Recently, a new major QTL, qCTBB9 controlling seed survival (SR) at 5 °C for nine days, was identified in the 5.40 Mb region on chromosome 9 using 460 individual F2:3 mapping populations [19].
Genome-wide association analysis (GWAS) is an efficient method to correlate phenotypes and genotypes for genetic mapping and search for candidate genes affecting traits. It can be employed for the simultaneous association analysis of multiple complex traits and has been extensively utilized to uncover genes associated with crucial agronomic traits in rice, including grain size [20], heading date [21], and plant architecture [22]. Similarly, several genes associated with CT have been identified by GWAS, such as OsSAP16, bZIP73, and qPSR10, which control CT in the vegetative stage (Table 1) [23,24,25]. Recently, 47 QTLs were identified for CT at the bud burst stage using 249 indica rice accessions [26]. Furthermore, a natural population comprising 211 rice landraces was utilized to identify 12 QTLs associated with the seedling survival rate (SR) following treatment at 4 °C for a defined duration of time [27].
In this study, 513 rice germplasm populations composed of the Aus, Basmati (Bas), Geng/japonica (GJ), and Xian/indica (XI) subpopulations were selected for identification of CT at the bud burst stage. GWAS analysis was performed to identify new QTLs for CT at the rice bud stage. Further analysis showed that five candidate genes were identified. These candidate genes can be used to improve rice CT and provide a new direction for the study of rice’s CT mechanism.

Table 1.
Known QTLs and genes associated with CT at different developmental stages.
Table 1.
Known QTLs and genes associated with CT at different developmental stages.
| QTLs/Genes | Chromosome | Stages | Reference |
|---|---|---|---|
| qCTP11 | 11 | the germination stage | [7] |
| qCTP12 | 12 | the germination stage | [7] |
| qLTG3-1 | 3 | the germination stage | [5] |
| qCTS12 | 12 | the seedling stage | [8] |
| qCTS4 | 4 | the seedling stage | [8] |
| qCtss11 | 11 | the seedling stage | [9] |
| qSCT1 | 1 | the seedling stage | [10] |
| qSCT11 | 11 | the seedling stage | [10] |
| qLOP2 | 2 | the seedling stage | [11] |
| qPSR2–1 | 2 | the seedling stage | [11] |
| COLD1 | 4 | the seedling stage | [12] |
| qCTS-9 | 9 | the seedling stage | [13] |
| Ctb1 | 1 | the booting stage | [14] |
| qCT8 | 8 | the booting stage | [15] |
| qCTB7 | 7 | the booting stage | [16] |
| qCTB3 | 3 | the booting stage | [17] |
| qCT-3-2 | 3 | the booting stage | [18] |
| qCTBB9 | 9 | bud burst stage | [19] |
| OsSAP16 | 7 | the vegetative stage | [23] |
| bZIP73 | 9 | the vegetative stage | [24] |
| qPSR10 | 10 | the vegetative stage | [25] |
2. Materials and Methods
2.1. Plant Materials and CT Evaluation
A panel of 513 rice accessions from the 3K Rice Genome Project (3K-RG) [28] was used to evaluate CT at the bud burst stage. Of the 513 rice accessions, 129 were classified as the Aus subpopulation, 35 were classified as the Bas subpopulation, 119 were classified as the GJ subpopulation, and 230 were classified as the XI subpopulation (Table S1). A total of 500 seeds from each accession were subjected to a 5-day period at 50 °C to break dormancy. To avoid bacterial influence in subsequent experiments, the seeds were disinfected with 3% NaClO solution and then washed three times with sterile water. Next, the seeds were soaked in water for 36 h and allowed to germinate for 24 h. Thirty seeds with a 5 mm bud length were selected and placed evenly in petri dishes with 10 mL sterile water and two pieces of filter paper, and each variety was repeated three times. Petri dishes containing the seeds were placed in a cold-treated dark incubator at 4 °C for 10 days, then the petri dishes were transferred to a 16 h light/8 h dark photoperiod (32 °C/28 °C) incubator to resume growth. The severity of damage (SD) was evaluated following a 3-day recovery growth period. The SD was graded as follows: a score of 1 indicated a seedling with normal leaf color and robust growth without any damage; a score of 3 denoted healthy growth with minimal damage and green leaf color; a score of 5 signified slow shoot growth with green shoot color; a score of 7 indicated no increase in shoot size, with the internal leaf color remaining green, albeit with withered cotyledons; and a score of 9 represented a germinated seed that was deceased, lacking any green leaves [15]. The survival rate of seedlings (SR) was evaluated after 5 days of recovery growth, and it was calculated as number of surviving seedlings/30 × 100 (%) [29].
2.2. GWAS for CT
SNP genotype information of 513 rice materials with a missing rate <0.1 and a minimum allele frequency (MAF) ≥ 0.05 were screened from the 3K-RG 4.8M SNP dataset [30] by PLINK [31]. A total of 2,802,578 SNPs were screened for genome-wide association analysis. Based on a mixed linear model, the EMMAX [32] algorithm was used to identify the associations between SNPs and CT-related traits. PLINK was used to filter SNPs based on LD to establish a kinship matrix (with the parameter “indep-pairwise 50 10 0.1”). GCTA software (v1.25.3) (with the parameter “-make-grm”) was used to calculate the genetic relationship matrix (GRM) [33], the first three principal components were extracted as covariables to control the population structure, and principal component analysis was carried out. GEC software was used to calculate the effective number of SNPs (N) [34], and the Bonferroni correction method (1/N) was used to determine the correlation significance threshold (p = 2.29 × 10⁻⁶) to declare significant SNPs. Manhattan and QQ plots of GWAS results were plotted by the R package “qqman” (v0.1.9) [35]. According to the previously reported linkage disequilibrium (LD) decay in the 3K RG, significant SNPs within the 300 kb region were regarded as the same QTL [28].
2.3. Analysis of Candidate Genes
The lead SNP within a locus was designated as the SNP with the lowest p value. A local LD block analysis was conducted within 150 kb upstream and downstream of the lead SNP using LDBlockShow [36]. The genes in the region were screened for the following conditions to identify candidate genes: (1) GO annotation was associated with metabolic process, response to stress, biosynthetic process, or response to endogenous stimulus. (2) The expression level changed after cold stress treatment and the data were obtained from the Rice RNA-seq Database (http://ipf.sustech.edu.cn/pub/ricerna/, accessed on 12 June 2023). (3) Genes containing SNPs of the most significant association (p < 0.05/N) with traits. The gene haplotypes were constructed with all nonsynonymous SNPs in the coding sequence. Phenotypic differences between haplotypes were evaluated by Duncan’s multiple range post-hoc tests in R (v4.2.3). At least 20 accessions were obtained for each haplotype. (4) After cold treatment for 2 h, there was significant difference in the expression of favorable and inferior haplotypes.
2.4. RNA Extraction and Real-Time PCR Analysis
After cold treatment at 4 °C for 2 h, RNA was extracted from four seeds of each accession as samples. Seeds’ RNA was extracted using a modified SDS-TRIzol method [37]. The cDNA was obtained by using a reverse transcription kit (Vazyme, Nanjing, China, r333-01). qRT-PCR was performed using a Light Cycler 480 instrument (Roche, Basel, Switzerland) with the Taq Pro Universal SYBR qPCR Master Mix (Vazyme, Nanjing, China, Q712) in a 20 μL reaction volume. Reaction system: 2 μL cDNA, 0.8 μL primers (10 μM), 10 μL 2× Taq Pro Universal SYBR qPCR Master Mix, and 7.2 μL ddH2O. Reaction procedure: 95 °C 30 s, 1 cycle; 95 °C 10 s, 60 °C 10 s, 40 cycles; 95 °C 15 s, 60 °C 60 s, 95 °C 15 s, 1 cycle. All primers of the qRT-PCR are listed in Supplementary Table S13. The relative expression levels were calculated using the 2−∆∆CT method [38]. Each sample was set up for three biological replicates.
3. Results
3.1. Phenotypic Variations between and within Subspecies
Two traits including the severity of damage (SD) and survival rate of seedlings (SR) were used to evaluate CT at the bud burst stage (Figure 1A). In order to better reflect the differences between different accessions, the method has been modified from that of Zhang et al. (2018) [26]. We divided SR into five levels according to the previous method: extremely sensitive (0 ≤ X ≤ 20), sensitive (20 < X ≤ 40), slightly sensitive (40 < X ≤ 60), tolerant (60 < X ≤ 80), and extremely tolerant (80 < X ≤ 100) (Figure 1B). The results showed that the CT at the bud burst stage varied greatly among rice germplasm resources (Table S1). The scores of SD and SR showed continuous distributions in the whole rice population, and the SD scores’ distribution is more uniform, but the SR scores were deviated to the two extreme ranges, 0 ≤ X ≤ 20% and 80 < X ≤ 100% (Table 2 and Table 3). The means were 4.93 ranging from 1.00 to 9.00 for SD and 59.07% ranging from 0 to 100.0% for SR in the whole population. There were significant differences in CT at the bud burst stage among different subpopulations, as indicated by the mean SD and SR being 6.30 and 40.42% in XI, 5.95 and 51.08% in Aus, 3.75 and 77.53% in Bas, and 1.54 and 98.36% in GJ, respectively (Figure 1C,D). Obviously, the GJ subpopulation had strongest CT, whereas the XI subpopulation had weakest CT.
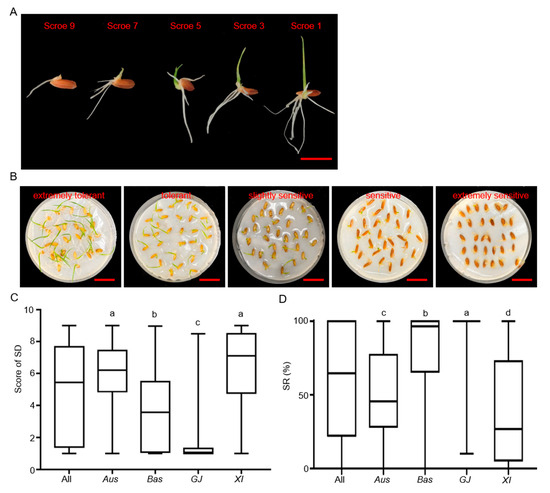
Figure 1.
Identification of CT phenotype at bud burst stage. (A) Classification of damage degree. Bar = 1 cm. (B) Variations in cold tolerance at bud burst stage in rice germplasm. Each of the five samples represents a distinct level of tolerance to cold stress. Bar = 2 cm. (C) Box plots of SD for the whole population (All), Aus, Basmati (Bas), Xian/Indica (XI), and Geng/Japonica (GJ) subpopulations. (D) Box plots of SR for All, Aus, Bas, XI, and GJ subpopulations. In (C,D), distinct letters denote significant differences (p < 0.05, Duncan’s multiple range post-hoc test).

Table 2.
SD (severity of damage) after cold treatment at the bud burst stage.

Table 3.
SR (seedling survival rate) after cold treatment at the bud burst stage.
3.2. GWAS Analysis of CT
We conducted GWAS on the phenotypes of SD and SR using a compressed mixed linear model. Because the XI subpopulation has a larger sample size and large differences from other subpopulations, GWAS was performed on the whole population as well on the XI subpopulation. A total of 15 SNPs were identified to be significantly associated with CT in the whole population, including 11 and 4 SNPs associated with SD and SR, respectively. Similarly, 38 significant SNPs were identified in the XI population, along with all of the SNPs associated with SD (Figure 2). Based on these significant SNPs, 13 loci were identified by LD block analysis, and among them, 8, 1, 1, 1, 1, and 1 were on chromosomes 1, 2, 4, 5, 9, and 11, respectively. By comparing the known genes and reported QTLs for cold tolerance, L8 [39] and qCTSD1-1 [26] were found in the regions of qSD1-2 and qSD1-3, respectively, and qCTSS-1 [40] was found in the regions of qSD1-4, qSR1-2, and qSD1-6 (Table 4).
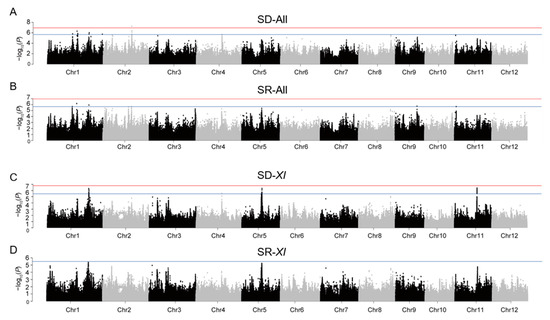
Figure 2.
Genome-wide association study of SD and SR. (A) Manhattan plot of GWAS results for SD in the whole population. (B) Manhattan plot of GWAS results for SR in the whole population. (C) Manhattan plot of GWAS results for SD in the XI population. (D) Manhattan plot of GWAS results for SR in the XI population. The suggestive significance threshold (p = 2.29 × 10⁻⁶) is indicated by the horizontal blue lines.

Table 4.
The significant loci for cold tolerance at the bud burst stage in rice.
3.3. Haplotype Analyses of the Candidate Genes
LD block analysis was performed on 13 QTLs according to lead SNPs, and the genes in the region were summarized (Tables S2–S12). Haplotype analysis, gene functional annotation, and expression change were performed for each gene. Conclusively, utilizing the Nipponbare reference genome IRGSP 1.0, we pinpointed eight genes demonstrating substantial phenotypic variations between haplotypes, thus establishing them as pivotal candidate genes for CT. These include LOC_Os01g35184, LOC_Os01g41510, LOC_Os01g56150, LOC_Os01g73410, LOC_Os02g36740, LOC_Os09g28180, LOC_Os01g55799, and LOC_Os05g26890. According to the haplotype of these eight genes, a cold-resistant material and a cold-sensitive material were selected for each gene. After cold treatment, RT analysis showed that the expression levels of favorable haplotypes of LOC_Os01g56150, LOC_Os01g73410, LOC_Os02g36740, and LOC_Os09g28180 were significantly higher than those of inferior haplotypes. The expression of the favorable haplotype of LOC_Os01g35184 was significantly lower than that of the inferior haplotype, and the other three genes had no significant difference (Figure 3).
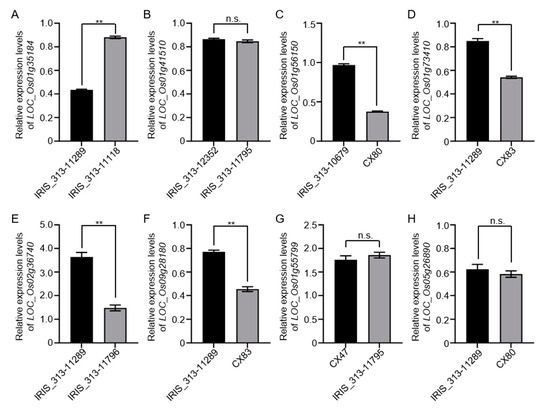
Figure 3.
The expression levels of candidate genes relative to those under 4 °C for 2 h. (A) Relative expression levels of LOC_Os01g35184: IRIS_313-11289 contained a favorable haplotype and IRIS_313-11118 contained an inferior haplotype. (B) Relative expression levels of LOC_Os01g41510: IRIS_313-12352 contained a favorable haplotype and IRIS_313-11795 contained an inferior haplotype. (C) Relative expression levels of LOC_Os01g56150: IRIS_313-10679 contained a favorable haplotype and CX80 contained an inferior haplotype. (D) Relative expression levels of LOC_Os01g73410: IRIS_313-11289 contained a favorable haplotype and CX83 contained an inferior haplotype. (E) Relative expression levels of LOC_Os02g36740: IRIS_313-11289 contained a favorable haplotype and IRIS_313-11796 contained an inferior haplotype. (F) Relative expression levels of LOC_Os09g28180: IRIS_313-11289 contained a favorable haplotype and CX83 contained an inferior haplotype. (G) Relative expression levels of LOC_Os01g55799: CX47 contained a favorable haplotype and IRIS_313-11795 contained an inferior haplotype. (H) Relative expression levels of LOC_Os05g26890: IRIS_313-11289 contained a favorable haplotype and CX80 contained an inferior haplotype. After normalizing gene expression to the OsActin gene control, the relative expression levels were calculated as fold changes compared to the expression levels of the candidate genes. Statistical significance was indicated by ** p < 0.01 (two-tailed Student’s t-test), and the data are presented as means ± SD (n = 3). The experiment was set up with three biological replicates.
The LD block region for qSD1-1 on chromosome 1 was projected to extend between 19421427 and 19478182 bp (Figure 4A). LOC_Os01g35184 was identified as a candidate gene, which was a CAMK_KIN1/SNF1/Nim1_like. 10-CAMK includes calcium/calmodulin-dependent protein kinases. Six principal haplotypes of LOC_Os01g35184 were identified, determined by two SNPs in the coding region (Figure 4B). When comparing the SD across the six haplotypes, Hap2, Hap4, and Hap6 exhibited a significantly higher SD compared to Hap1 and Hap3, while Hap5 did not show a significant difference from the other haplotypes (Figure 4C). Looking at the distribution of each haplotype, Hap2, Hap4, and Hap6 mainly appeared in the XI subpopulation (Figure 4D). The LD block region for qSD1-4 and qSR1-2 on chromosome 1 was anticipated to extend between 32312787 and 32376234 bp (Figure 5A). Five predominant haplotypes of LOC_Os01g56150 were identified, determined by four SNPs in the coding region (Figure 5B). Hap4 had a mean SD of 1.33, the lowest of the five haplotypes, and it was only distributed in the GJ population. In addition, Hap1 and Hap3 had a higher SD and were mainly distributed in the Aus and XI subpopulations (Figure 5C,D). The LD block region for qSD1-5 on chromosome 1 was anticipated to range from 42540957 to 42584530 bp (Figure 6A). Two primary haplotypes of LOC_Os01g73410 were identified, determined by two SNPs in the coding region (Figure 6B). Hap1 had a lower SD than Hap2, so hap1 was the favorable haplotype for CT (Figure 6C). Hap2 was only distributed in the Aus and XI subpopulations (Figure 6D). The LD block region for qSD2-1 on chromosome 2 was anticipated to extend between 22163165 and 22244135 bp (Figure 7A). Three principal haplotypes of LOC_Os02g36740 were identified, determined by two SNPs in the coding region (Figure 7B). Hap2 had the lowest SD and was mainly distributed in the GJ subpopulation (Figure 7C,D). The LD block region for qSR9-1 on chromosome 9 was projected to extend between 16943706 and 17107319 bp (Figure 8A). Four principal haplotypes of LOC_Os09g28180 were identified, determined by five SNPs in the coding region (Figure 8B). Hap3 and Hap4 had a higher SR than Hap1 and Hap2 (Figure 8C). Hap1, Hap2, Hap3, and Hap4 were mainly distributed in the XI, Aus, Bas and GJ, and GJ subpopulations, respectively (Figure 8D).
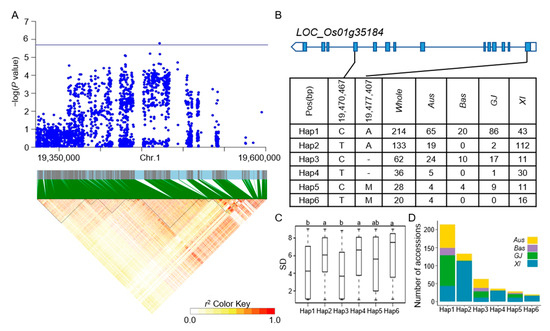
Figure 4.
Analyzing candidate genes associated with qSD1-1 located on chromosome 1. (A) Local Manhattan plot (top) and LD heat map (bottom) of qSD1-1 for SD in the whole population. (B) Coding region haplotype analysis of LOC_Os01g35184. (C) SD distribution across the whole population for the six haplotypes of LOC_Os01g35184. Distinct letters above each box plot signify significant differences among haplotypes, as per Duncan’s multiple range post-hoc test (p < 0.05). (D) The number of subpopulations in the six haplotypes of LOC_Os01g35184.
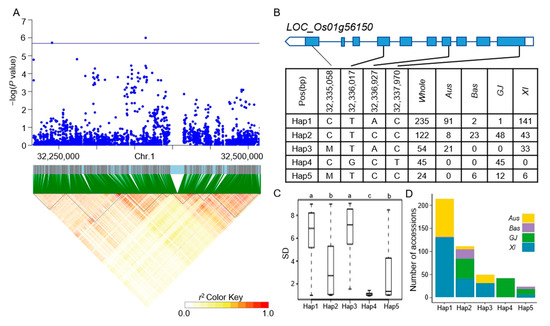
Figure 5.
Analyzing candidate genes associated with qSD1-4 located on chromosome 1. (A) Local Manhattan plot (top) and LD heat map (bottom) of qSD1-4 for SD in the whole population. (B) Coding region haplotype analysis of LOC_Os01g56150. (C) SD distribution across the whole population for the five haplotypes of LOC_Os01g56150. Distinct letters above each box plot signify significant differences among haplotypes, as per Duncan’s multiple range post-hoc test (p < 0.05). (D) The number of subpopulations in the five haplotypes of LOC_Os01g56150.
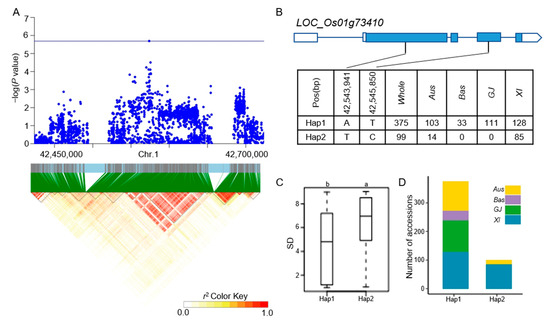
Figure 6.
Analyzing candidate genes associated with qSD1-5 located on chromosome 1. (A) Local Manhattan plot. (top) and LD heat map (bottom) of qSD1-5 for SD in the whole population. (B) Coding region haplotype analysis of LOC_Os01g73410. (C) SD distribution across the whole population for the two haplotypes of LOC_Os01g73410. Distinct letters above each box plot signify significant differences among haplotypes, as per Duncan’s multiple range post-hoc test (p < 0.05). (D) The number of subpopulations in the two haplotypes of LOC_Os01g73410.
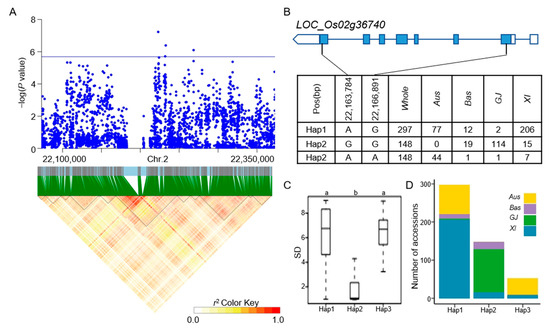
Figure 7.
Analyzing candidate genes associated with qSD2-1 located on chromosome 2. (A) Local Manhattan plot (top) and LD heat map (bottom) of qSD2-1 for SD in the whole population. (B) Coding region haplotype analysis of LOC_Os02g36740. (C) SD distribution across the whole population for the six haplotypes of LOC_Os02g36740. Distinct letters above each box plot signify significant differences among haplotypes, as per Duncan’s multiple range post-hoc test (p < 0.05). (D) The number of subpopulations in the three haplotypes of LOC_Os02g36740.
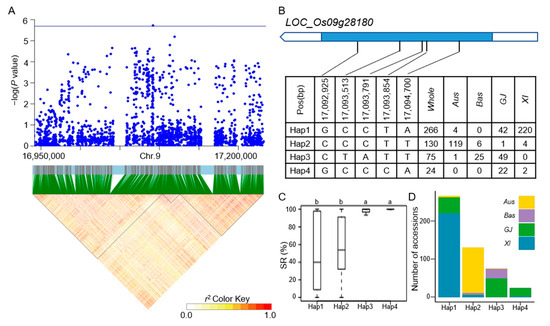
Figure 8.
Analyzing candidate genes associated with qSR9-1 located on chromosome 9. (A) Local Manhattan plot (top) and LD heat map (bottom) of qSR9-1 for SD in the whole population. (B) Coding region haplotype analysis of LOC_Os09g28180. (C) SD distribution across the whole population for the four haplotypes of LOC_Os09g28180. Distinct letters above each box plot signify significant differences among haplotypes, as per Duncan’s multiple range post-hoc test (p < 0.05). (D) The number of subpopulations in the four haplotypes of LOC_Os09g28180.
3.4. Analysis of Pyramiding Effect of CT Haplotypes
According to the results of the haplotype analysis of five candidate genes, Hap1 and Hap3 of LOC_Os01g35184, Hap4 of LOC_Os01g56150, Hap1 of LOC_Os01g73410, Hap2 of LOC_Os02g36740, and Hap3 and Hap4 of LOC_Os09g28180 were identified as the favorable haplotypes of CT, and other haplotypes were relatively defined as inferior haplotypes. To investigate the potential of candidate genes in rice cold tolerance breeding, the cumulative effects of combined haplotype analysis were examined within the population. After eliminating rare haplotype combinations, eight groups remained (n < 10 accessions). The groups HC1 to HC8 contained 5, 4, 4, 3, 2, 1, 1, and 0 favorable haplotypes, respectively. The groups HC1, HC2, and HC3 were enriched in the GJ subpopulation. The groups HC5, HC6, and HC7 were mainly distributed in the Aus and XI subpopulations. The group HC8 was mainly found in the XI subpopulation. Comparing the SD and SR of different haplotype combinations, it was found that the groups with more favorable haplotype genes would have lower SD and higher SR (Figure 9, Table S14). The results showed that pyramiding of different favorable haplotypes of CT genes may be an effective way to improve the CT of rice at the bud burst stage.
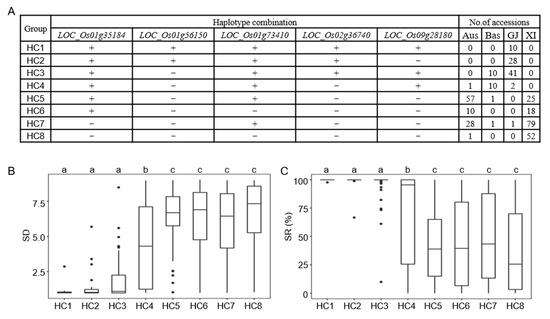
Figure 9.
Optimal cold-tolerant haplotype combination of candidate genes. (A) Combined haplotypes of LOC_Os01g35184, LOC_Os01g56150, LOC_Os01g73410, LOC_Os02g36740 and LOC_Os09g28180. “+” and “−” represent favorable and inferior haplotypes, respectively. (B) Comparison of the SD among different haplotype combinations. (C) Comparison of the SR among different haplotype combinations. Different letters above each histogram indicate significant differences at p < 0.05.
4. Discussion
With the popularization of direct-seeded rice, it is more important and urgent to study the CT of rice at the bud burst stage. The CT of 513 diverse international rice accessions at the bud burst stage was evaluated in this study. After low-temperature treatment at 4 °C, both extreme CT and extreme cold sensitivity were found in each sub-population of Aus, Bas, GJ, and XI. The results showed that there were significant variations in SD and SR among rice accessions. Nevertheless, based on the SD and SR distribution within the four groups, the GJ group exhibited a significantly higher proportion of cold-tolerant rice compared to the other three groups. This is consistent with Li et al.’s research results that japonica rice is more tolerant to cold than indica rice [27]. GJ is predominantly cultivated at higher latitudes, where temperatures are lower compared to those at lower latitudes. This environmental factor is likely a driving force behind the evolution of CT and the selective breeding of rice.
In this study, we found a total of 13 QTLs for SD or SR, and five of them were colocalized with reported QTLs. qSD1-2 was colocalized with L8 [39], qSD1-3 was colocalized with qCTSD1-1 [26], and qSR1-2, qSD1-4, and qSD1-6 were colocalized with qCTSS-1 [40]. Although we identified these reported QTLs, no genes associated with CT at different developmental stages were detected. It may be that rice has different genetic mechanisms to cope with environmental temperature changes at different growth and developmental stages.
In this study, we screened five candidate genes to regulate CT-related traits through different network pathways, indicating that they have complex molecular mechanisms. Under cold stress, the cytoplasmic Ca2+ levels in plant cells increased rapidly [41]. LOC_Os01g35184 encoded a CIPK (CBL-interacting protein kinase). Previous studies showed that CIPKs could interact with CBLs (calcineurin B-like protein). Through the transmission of Ca2+ signals, the stimulus–response coupling signal network is coordinated under various environmental stresses [42]. A point mutation of the same gene family, OsCIPK7, induced a conformational change in the activation loop of the kinase domain, resulting in a subsequent increase in protein kinase activity. This, in turn, conferred enhanced tolerance to chilling stress [43]. LOC_Os01g56150 codes the Putative Lysosomal Pro-x Carboxypeptidase homologue, and there are also 4 homologous genes in rice, LOC_Os06g43930, LOC_Os10g36760, LOC_Os10g36780, and LOC_Os11g05760. These four genes were retrieved through the Rice RNA-seq Database. The results showed that their expression levels were significantly down-regulated under cold stress. It is suggested that the Lysosomal Pro-x Carboxypeptidase homologue may play an important role in the CT of rice. LOC_Os01g73410 and LOC_Os02g36740 both encoded the zinc finger domain containing protein. By comparing the cloned genes related to cold stress, many genes containing the zinc finger structure were found, such as OsCOIN [44], ZFP245 [45], ZFP182 [46], and SRZ1 [47]. Therefore, it is speculated that this structure plays an important role in the regulation of cold tolerance. The gene LOC_Os09g28180 encodes a protein belonging to the D-mannose-binding lectin family. D-mannose-binding lectins play a crucial role in defense signaling, regulating growth, development, and responses to abiotic stress. Although we analyzed the relationship between these five genes and CT in rice, genetic materials and molecular biology experiments are still needed to verify their functions.
CT at the bud burst stage is of great significance for rice direct seeding and planting area increases. How to use the excavated CT genes is the key to CT breeding at the bud burst stage. Varieties with more favorable haplotype combinations have a stronger CT to cold stress, so the introduction of favorable haplotypes into cold-sensitive varieties or further pyramiding of favorable CT alleles will be an effective strategy of CT breeding in the rice bud burst stage. In this study, we have shown that 10 varieties (IRIS_313-11246, IRIS_313-11661, IRIS_313-11973, IRIS_313-11198, IRIS_313-9839, IRIS_313-9782, CX47, CX111, IRIS_313-11436, and CX359) with five favorable haplotype combinations can be used as donors to improve other varieties with weak cold tolerance (Table S14).
5. Conclusions
Based on two traits, SD and SR, 13 QTLs associated with CT at bud burst stage were identified by GWAS analysis and 5 candidate genes were identified. There were differences in cold tolerance among different subgroups, among which GJ had the highest CT and XI had the lowest. The five candidate genes had different gene functions, indicating that they play a role in cold stress through different regulatory mechanisms. Our findings confirmed that gene pyramiding will be an effective method to improve CT at the bud burst stage in rice.
Supplementary Materials
The following supporting information can be downloaded at https://www.mdpi.com/article/10.3390/agronomy13122945/s1, Table S1: The 513 rice accessions used in this study and their cold tolerance at the bud burst stage. Table S2: Summary of functional annotation of the genes in the candidate region of qSD1-1. Table S3: Summary of functional annotation of the genes in the candidate region of qSD1-2 and qSR1-1. Table S4: Summary of functional annotation of the genes in the candidate region of qSD1-3. Table S5: Summary of functional annotation of the genes in the candidate region of qSD1-4 and qSR1-2. Table S6. Summary of functional annotation of the genes in the candidate region of qSD1-5. Table S7: Summary of functional annotation of the genes in the candidate region of qSD2-1. Table S8: Summary of functional annotation of the genes in the candidate region of qSR9-1. Table S9: Summary of functional annotation of the genes in the candidate region of qSD1-6. Table S10: Summary of functional annotation of the genes in the candidate region of qSD4-1. Table S11: Summary of functional annotation of the genes in the candidate region of qSD5-1. Table S12: Summary of functional annotation of the genes in the candidate region of qSD11-1. Table S13: Primers used for qRT-PCR. Table S14: Cold-tolerant haplotype combination of candidate genes.
Author Contributions
Conceptualization and methodology, J.X. and Z.L.; validation, P.L. and G.Z.; formal analysis and investigation, W.C., P.L. and G.Z.; resources, J.X. and K.C.; data curation, W.C.; writing—original draft preparation, W.C. and P.L.; writing—review and editing, J.X. and Z.L.; supervision, Z.L.; funding acquisition, J.X. and K.C. All authors have read and agreed to the published version of the manuscript.
Funding
This research was funded by the Science, Technology and Innovation Commission of Shenzhen Municipality (JCYJ20200109150713553) and the Key Research and Development Program of Hainan Province (ZDYF2021XDNY128).
Data Availability Statement
The datasets supporting the conclusions of this article are included in the article and its Supplementary Files.
Conflicts of Interest
The authors declare no conflict of interest.
References
- Najeeb, S.; Ali, J.; Mahender, A.; Pang, Y.L.; Zilhas, J.; Murugaiyan, V.; Vemireddy, L.R.; Li, Z. Identification of main-effect quantitative trait loci (QTLs) for low-temperature stress tolerance germination- and early seedling vigor-related traits in rice (Oryza sativa L.). Mol. Breed 2020, 40, 10. [Google Scholar] [CrossRef] [PubMed]
- Wu, L.; Jing, X.; Zhang, B.; Chen, S.; Xu, R.; Duan, P.; Zou, D.; Huang, S.; Zhou, T.; An, C.; et al. A natural allele of OsMS1 responds to temperature changes and confers thermosensitive genic male sterility. Nat. Commun. 2022, 13, 2055. [Google Scholar] [CrossRef]
- Guo, H.; Zeng, Y.; Li, J.; Ma, X.; Zhang, Z.; Lou, Q.; Li, J.; Gu, Y.; Zhang, H.; Li, J.; et al. Differentiation, evolution and utilization of natural alleles for cold adaptability at the reproductive stage in rice. Plant Biotechnol. J. 2020, 18, 2491–2503. [Google Scholar] [CrossRef] [PubMed]
- Mahender, A.; Anandan, A.; Pradhan, S.K. Early seedling vigour, an imperative trait for direct-seeded rice: An overview on physio-morphological parameters and molecular markers. Planta 2015, 241, 1027–1050. [Google Scholar] [CrossRef] [PubMed]
- Fujino, K.; Matsuda, Y. Genome-wide analysis of genes targeted by qLTG3-1 controlling low-temperature germinability in rice. Plant Mol. Biol. 2010, 72, 137–152. [Google Scholar] [CrossRef] [PubMed]
- Zhang, Q.; Chen, Q.; Wang, S.; Hong, Y.; Wang, Z. Rice and cold stress: Methods for its evaluation and summary of cold tolerance-related quantitative trait loci. Rice 2014, 7, 24. [Google Scholar] [CrossRef]
- Baruah, A.R.; Ishigo-Oka, N.; Adachi, M.; Oguma, Y.; Tokizono, Y.; Onishi, K.; Sano, Y. Cold tolerance at the early growth stage in wild and cultivated rice. Euphytica 2009, 165, 459–470. [Google Scholar] [CrossRef]
- Andaya, V.C.; Tai, T.H. Fine mapping of the qCTS12 locus, a major QTL for seedling cold tolerance in rice. Theor. Appl. Genet. 2006, 113, 467–475. [Google Scholar] [CrossRef]
- Koseki, M.; Kitazawa, N.; Yonebayashi, S.; Maehara, Y.; Wang, Z.X.; Minobe, Y. Identification and fine mapping of a major quantitative trait locus originating from wild rice, controlling cold tolerance at the seedling stage. Mol. Genet. Genom. 2010, 284, 45–54. [Google Scholar] [CrossRef]
- Kim, S.M.; Suh, J.P.; Lee, C.K.; Lee, J.H.; Kim, Y.G.; Jena, K.K. QTL mapping and development of candidate gene-derived DNA markers associated with seedling cold tolerance in rice (Oryza sativa L.). Mol. Genet. Genom. 2014, 289, 333–343. [Google Scholar] [CrossRef]
- Xiao, N.; Huang, W.N.; Li, A.H.; Gao, Y.; Li, Y.H.; Pan, C.H.; Ji, H.; Zhang, X.X.; Dai, Y.; Dai, Z.Y.; et al. Fine mapping of the qLOP2 and qPSR2-1 loci associated with chilling stress tolerance of wild rice seedlings. Theor. Appl. Genet. 2015, 128, 173–185. [Google Scholar] [CrossRef] [PubMed]
- Ma, Y.; Dai, X.; Xu, Y.; Luo, W.; Zheng, X.; Zeng, D.; Pan, Y.; Lin, X.; Liu, H.; Zhang, D.; et al. COLD1 confers chilling tolerance in rice. Cell 2015, 160, 1209–1221. [Google Scholar] [CrossRef]
- Zhao, J.; Zhang, S.; Dong, J.; Yang, T.; Mao, X.; Liu, Q.; Wang, X.; Liu, B. A novel functional gene associated with cold tolerance at the seedling stage in rice. Plant Biotechnol. J. 2017, 15, 1141–1148. [Google Scholar] [CrossRef]
- Saito, K.; Hayano-Saito, Y.; Maruyama-Funatsuki, W.; Sato, Y.; Kato, A. Physical mapping and putative candidate gene identification of a quantitative trait locus Ctb1 for cold tolerance at the booting stage of rice. Theor. Appl. Genet. 2004, 109, 515–522. [Google Scholar] [CrossRef] [PubMed]
- Kuroki, M.; Saito, K.; Matsuba, S.; Yokogami, N.; Shimizu, H.; Ando, I.; Sato, Y. A quantitative trait locus for cold tolerance at the booting stage on rice chromosome 8. Theor. Appl. Genet. 2007, 115, 593–600. [Google Scholar] [CrossRef] [PubMed]
- Zhou, L.; Zeng, Y.; Zheng, W.; Tang, B.; Yang, S.; Zhang, H.; Li, J.; Li, Z. Fine mapping a QTL qCTB7 for cold tolerance at the booting stage on rice chromosome 7 using a near-isogenic line. Theor. Appl. Genet. 2010, 121, 895–905. [Google Scholar] [CrossRef] [PubMed]
- Andaya, V.C.; Mackill, D.J. QTLs conferring cold tolerance at the booting stage of rice using recombinant inbred lines from a japonica x indica cross. Theor. Appl. Genet. 2003, 106, 1084–1090. [Google Scholar] [CrossRef] [PubMed]
- Zhu, Y.; Chen, K.; Mi, X.; Chen, T.; Ali, J.; Ye, G.; Xu, J.; Li, Z. Identification and Fine Mapping of a Stably Expressed QTL for Cold Tolerance at the Booting Stage Using an Interconnected Breeding Population in Rice. PLoS ONE 2015, 10, e0145704. [Google Scholar] [CrossRef] [PubMed]
- Yang, L.; Lei, L.; Li, P.; Wang, J.; Wang, C.; Yang, F.; Chen, J.; Liu, H.; Zheng, H.; Xin, W.; et al. Identification of Candidate Genes Conferring Cold Tolerance to Rice (Oryza sativa L.) at the Bud-Bursting Stage Using Bulk Segregant Analysis Sequencing and Linkage Mapping. Front. Plant Sci 2021, 12, 647239. [Google Scholar] [CrossRef]
- Kumar, A.; Daware, A.; Kumar, A.; Kumar, V.; Gopala Krishnan, S.; Mondal, S.; Patra, B.C.; Singh, A.K.; Tyagi, A.K.; Parida, S.K.; et al. Genome-wide analysis of polymorphisms identified domestication-associated long low-diversity region carrying important rice grain size/weight quantitative trait loci. Plant J. 2020, 103, 1525–1547. [Google Scholar] [CrossRef]
- Han, Z.; Zhang, B.; Zhao, H.; Ayaad, M.; Xing, Y. Genome-Wide Association Studies Reveal that Diverse Heading Date Genes Respond to Short and Long Day Lengths between Indica and Japonica Rice. Front. Plant Sci. 2016, 7, 1270. [Google Scholar] [CrossRef] [PubMed][Green Version]
- Hong, J.; Su, S.; Wang, L.; Bai, S.; Xu, J.; Li, Z.; Betts, N.; Liang, W.; Wang, W.; Shi, J.; et al. Combined genome-wide association study and epistasis analysis reveal multifaceted genetic architectures of plant height in Asian cultivated rice. Plant Cell. Environ. 2023, 46, 1295–1311. [Google Scholar] [CrossRef] [PubMed]
- Wang, X.; Zou, B.; Shao, Q.; Cui, Y.; Lu, S.; Zhang, Y.; Huang, Q.; Huang, J.; Hua, J. Natural variation reveals that OsSAP16 controls low-temperature germination in rice. J. Exp. Bot. 2018, 69, 413–421. [Google Scholar] [CrossRef] [PubMed]
- Liu, C.; Ou, S.; Mao, B.; Tang, J.; Wang, W.; Wang, H.; Cao, S.; Schläppi, M.R.; Zhao, B.; Xiao, G.; et al. Early selection of bZIP73 facilitated adaptation of japonica rice to cold climates. Nat. Commun. 2018, 9, 3302. [Google Scholar] [CrossRef]
- Xiao, N.; Gao, Y.; Qian, H.; Gao, Q.; Wu, Y.; Zhang, D.; Zhang, X.; Yu, L.; Li, Y.; Pan, C.; et al. Identification of Genes Related to Cold Tolerance and a Functional Allele That Confers Cold Tolerance. Plant Physiol. 2018, 177, 1108–1123. [Google Scholar] [CrossRef]
- Zhang, M.; Ye, J.; Xu, Q.; Feng, Y.; Yuan, X.; Yu, H.; Wang, Y.; Wei, X.; Yang, Y. Genome-wide association study of cold tolerance of Chinese indica rice varieties at the bud burst stage. Plant Cell. Rep. 2018, 37, 529–539. [Google Scholar] [CrossRef]
- Li, C.; Liu, J.; Bian, J.; Jin, T.; Zou, B.; Liu, S.; Zhang, X.; Wang, P.; Tan, J.; Wu, G.; et al. Identification of cold tolerance QTLs at the bud burst stage in 211 rice landraces by GWAS. BMC Plant Biol. 2021, 21, 542. [Google Scholar] [CrossRef]
- Wang, W.; Mauleon, R.; Hu, Z.; Chebotarov, D.; Tai, S.; Wu, Z.; Li, M.; Zheng, T.; Fuentes, R.R.; Zhang, F.; et al. Genomic variation in 3,010 diverse accessions of Asian cultivated rice. Nature 2018, 557, 43–49. [Google Scholar] [CrossRef]
- Zhou, L.; Zeng, Y.; Hu, G.; Pan, Y.; Yang, S.; You, A.; Zhang, H.; Li, J.; Li, Z. Characterization and identification of cold tolerant near-isogenic lines in rice. Breed Sci. 2012, 62, 196–201. [Google Scholar] [CrossRef]
- Alexandrov, N.; Tai, S.; Wang, W.; Mansueto, L.; Palis, K.; Fuentes, R.R.; Ulat, V.J.; Chebotarov, D.; Zhang, G.; Li, Z.; et al. SNP-Seek database of SNPs derived from 3000 rice genomes. Nucleic Acids Res. 2015, 43, 1023–1027. [Google Scholar] [CrossRef]
- Purcell, S.; Neale, B.; Todd-Brown, K.; Thomas, L.; Ferreira, M.A.; Bender, D.; Maller, J.; Sklar, P.; de Bakker, P.I.; Daly, M.J.; et al. PLINK: A tool set for whole-genome association and population-based linkage analyses. Am. J. Hum. Genet. 2007, 81, 559–575. [Google Scholar] [CrossRef] [PubMed]
- Kang, H.M.; Sul, J.H.; Service, S.K.; Zaitlen, N.A.; Kong, S.Y.; Freimer, N.B.; Sabatti, C.; Eskin, E. Variance component model to account for sample structure in genome-wide association studies. Nat. Genet 2010, 42, 348–354. [Google Scholar] [CrossRef] [PubMed]
- Yang, J.; Lee, S.H.; Goddard, M.E.; Visscher, P.M. GCTA: A tool for genome-wide complex trait analysis. Am. J. Hum. Genet. 2011, 88, 76–82. [Google Scholar] [CrossRef] [PubMed]
- Li, M.X.; Yeung, J.M.; Cherny, S.S.; Sham, P.C. Evaluating the effective numbers of independent tests and significant p-value thresholds in commercial genotyping arrays and public imputation reference datasets. Hum. Genet. 2012, 131, 747–756. [Google Scholar] [CrossRef]
- Barrett, J.C.; Fry, B.; Maller, J.; Daly, M.J. Haploview: Analysis and visualization of LD and haplotype maps. Bioinformatics 2005, 21, 263–265. [Google Scholar] [CrossRef] [PubMed]
- Dong, S.S.; He, W.M.; Ji, J.J.; Zhang, C.; Guo, Y.; Yang, T.L. LDBlockShow: A fast and convenient tool for visualizing linkage disequilibrium and haplotype blocks based on variant call format files. Brief Bioinform. 2021, 22, 227. [Google Scholar] [CrossRef]
- Wang, G.; Wang, G.; Zhang, X.; Wang, F.; Song, R. Isolation of high quality RNA from cereal seeds containing high levels of starch. Phytochem. Anal. 2012, 23, 159–163. [Google Scholar] [CrossRef] [PubMed]
- Livak, K.J.; Schmittgen, T.D. Analysis of relative gene expression data using real-time quantitative PCR and the 2(-Delta Delta C(T)) Method. Methods 2001, 25, 402–408. [Google Scholar] [CrossRef]
- Lv, Y.; Guo, Z.; Li, X.; Ye, H.; Li, X.; Xiong, L. New insights into the genetic basis of natural chilling and cold shock tolerance in rice by genome-wide association analysis. Plant Cell. Environ. 2016, 39, 556–570. [Google Scholar] [CrossRef]
- Yang, Z.; Huang, D.; Tang, W.; Zheng, Y.; Liang, K.; Cutler, A.J.; Wu, W. Mapping of quantitative trait loci underlying cold tolerance in rice seedlings via high-throughput sequencing of pooled extremes. PLoS ONE 2013, 8, e68433. [Google Scholar] [CrossRef]
- Saijo, Y.; Hata, S.; Kyozuka, J.; Shimamoto, K.; Izui, K. Over-expression of a single Ca2+ dependent protein kinase confers both cold and salt/drought tolerance on rice plants. Plant J. 2000, 23, 319–327. [Google Scholar] [CrossRef] [PubMed]
- Kanwar, P.; Sanyal, S.K.; Tokas, I.; Yadav, A.K.; Pandey, A.; Kapoor, S.; Pandey, G.K. Comprehensive structural, interaction and expression analysis of CBL and CIPK complement during abiotic stresses and development in rice. Cell Calcium 2014, 56, 81–95. [Google Scholar] [CrossRef] [PubMed]
- Zhang, D.; Guo, X.; Xu, Y.; Li, H.; Ma, L.; Yao, X.; Weng, Y.; Guo, Y.; Liu, C.M.; Chong, K. OsCIPK7 point-mutation leads to conformation and kinase-activity change for sensing cold response. J. Integr. Plant. Biol. 2019, 61, 1194–1200. [Google Scholar] [CrossRef] [PubMed]
- Liu, K.; Wang, L.; Xu, Y.; Chen, N.; Ma, Q.; Li, F.; Chong, K. Overexpression of OsCOIN, a putative cold inducible zinc finger protein, increased tolerance to chilling, salt and drought, and enhanced proline level in rice. Planta 2007, 226, 1007–1016. [Google Scholar] [CrossRef]
- Huang, J.; Sun, S.J.; Xu, D.Q.; Yang, X.; Bao, Y.M.; Wang, Z.F.; Tang, H.J.; Zhang, H. Increased tolerance of rice to cold, drought and oxidative stresses mediated by the overexpression of a gene that encodes the zinc finger protein ZFP245. Biochem. Biophys. Res. Commun. 2009, 389, 556–561. [Google Scholar] [CrossRef]
- Huang, J.; Sun, S.; Xu, D.; Lan, H.; Sun, H.; Wang, Z.; Bao, Y.; Wang, J.; Tang, H.; Zhang, H. A TFIIIA-type zinc finger protein confers multiple abiotic stress tolerances in transgenic rice (Oryza sativa L.). Plant Mol. Biol. 2012, 80, 337–350. [Google Scholar] [CrossRef]
- Huang, J.; Wang, M.M.; Jiang, Y.; Wang, Q.H.; Huang, X.; Zhang, H.S. Stress repressive expression of rice SRZ1 and characterization of plant SRZ gene family. Plant Sci. 2008, 174, 227–235. [Google Scholar] [CrossRef]
Disclaimer/Publisher’s Note: The statements, opinions and data contained in all publications are solely those of the individual author(s) and contributor(s) and not of MDPI and/or the editor(s). MDPI and/or the editor(s) disclaim responsibility for any injury to people or property resulting from any ideas, methods, instructions or products referred to in the content. |
© 2023 by the authors. Licensee MDPI, Basel, Switzerland. This article is an open access article distributed under the terms and conditions of the Creative Commons Attribution (CC BY) license (https://creativecommons.org/licenses/by/4.0/).