Article

Dynamic of Grassland Degradation and Its Driving Forces from Climate Variation and Human Activities in Central Asia

Research Center for Ecological Protection and Climate Change Response, Nanjing Institute of Environmental Sciences, Nanjing 210042, China
*
Author to whom correspondence should be addressed.
Agronomy 2023, 13(11), 2763; https://doi.org/10.3390/agronomy13112763
Submission received: 7 September 2023 / Revised: 10 October 2023 / Accepted: 23 October 2023 / Published: 3 November 2023

Abstract

:
Central Asia is one of the most sensitive regions to climate changes in the world and the grassland degradation of this region has attracted considerable concern. Quantifying the driving force of grassland degradation is important for understanding the effects of climate variation and human activities on grassland. In this study, net primary productivity (NPP) was selected as an indicator to quantitatively evaluate the relative role of climate variation and human activities in Central Asia from 2000 to 2020. This study used the global NPP product MOD17A3 as actual NPP and estimated the potential NPP using the Thornthwaite memorial model. The potential NPP and the difference between the potential NPP and actual NPP were used to represent the influence of climate variation and human activities. The grassland degradation or restoration can be demonstrated by the slope of actual NPP (SA). A positive slope value (SA) suggested that restoration occurs, whereas a negative slope value suggested that degradation occurred. The results showed that 23.08% of the total grassland area experienced grassland degradation, whereas 2.51% of the whole grassland underwent grassland restoration. Furthermore, 53.8% of the degraded grassland areas were influenced by climate variation, and 14.5% were caused by human activities. By contrast, the relative roles of climate variation and human activities in grassland restoration were 25% and 47.9%, respectively. The NPP variation also could be calculated by assessing the effects of these factors and the results showed that 55.7% of the NPP decrease was caused by climate variation, whereas 9.6% was a result of human activities. On the contrary, climate variation and human activities resulted in 19.8% and 37.3% of grassland restoration, respectively. Therefore, climate variation was the dominant factor of grassland degradation, and human activities were the main driver of grassland restoration in Central Asia.

1. Introduction

The central area of Asia, Central Asia, includes Kazakhstan, Kyrgyzstan, Tajikistan, Turkmenistan, Uzbekistan, and Xinjiang Province in northwest China [1,2]. Lying in the hinterland of the Eurasian continent and far from the sea, Central Asia is located in the rain shadows of high mountain ranges, and the climate is arid and semi-arid [3,4]. It was characterized by dry temperature, scarce precipitation, intensive evaporation, and water shortage. Adding its unique topography and complex natural conditions, the grassland ecosystem in Central Asia is sensitive and vulnerable to climate variation [5,6].
In recent years, with the intensification of human activities, the human disturbance factor has become more and more dominant in the grassland dynamics of Central Asia. As the region is located in the core area of the Silk Road Economic Belt, it has an important strategic position and causes the development of economic activities. With the intensified human activity, such as overstocking, the conversion of grassland to cropland, and the overexploitation of water resources, the fragile ecosystems face more and more severe challenges. Consequently, the vulnerability of grassland ecosystems to climate variation and human activities is evident, with even some parts of this area having undergone grassland degradation. For example, previous studies found that the grassland degradation has been attributed to global climate change and overgrazing in Pakistan [7] and in the Xinjiang province of China [8]. The area of grassland in Uzbekistan is gradually decreasing [9,10]. With the cultivation of farmland, the area of grassland has decreased slightly from 2000 to 2009 [11]. Liu, Zhang [12] found that the Central Asia grassland showed a general trend of degradation, especially in the western and northern regions of Kazakhstan, as well as in some basins. Grassland degradation has become an important factor of restricting animal husbandry, promoting sustainable development, and ecological environment improvement. Therefore, a deeper understanding of grassland degradation is critical for promoting the sustainable development of grassland resources and restoring degraded grassland [13].
Previous studies have shown that climate variation and human activities are the main drivers of grassland degradation [14,15]. With the intensification of climate variation and the increase in human activities [16], quantifying the effects of different driving forces on grassland degradation has become an investigative emphasis and hot spot. To date, some studies have been conducted to assess the relative roles of climate variation and human activities [17,18,19,20,21].
Net primary productivity (NPP), which refers to the net amount of solar radiation converted by plants into plant organic matter through photosynthesis, is a reliable indicator of ecosystem function and plays a critical role in maintaining ecosystem health and regulating carbon balance [22]. The decrease in vegetation productivity is the main manifestation of vegetation degradation, and NPP is an important index of vegetation productivity [23]. NPP can serve as an indicator of vegetation growth status and is very sensitive to climate change and human activity [24]. Therefore, many researchers have used NPP as a degradation indicator to explore the long-term dynamic changes in vegetation in terrestrial ecosystems [25,26,27]. By selecting the slope and scenarios simulation for NPP, Xu, Kang [28] established a method to distinguish the relative roles of climate variation and human activities in desertification, defining three types of NPP: actual NPP, potential NPP, and human activity NPP. Actual NPP represents the real situation of vegetation productivity. Potential NPP is a hypothetical situation of vegetation growth, which is free from human disturbance. Human activity NPP represents the effect of human activities on vegetation growth, which is the difference between potential NPP and actual NPP. Gang, Zhou [21] and Zhou, Gang [8] have extended the study area of this method to global and regional scales. Therefore, the NPP coupled with scenario simulation method has been proven to be reliable in monitoring land degradation [23,29,30,31].
Consequently, we used the NPP coupled with scenario simulation method to evaluate the grassland degradation in Central Asia from 2000 to 2020. Based on the slope of NPP, we established eight kinds of scenarios which can evaluate the effect of climate variation and human activities on grassland degradation or grassland restoration. The main purpose of this study was to investigate the dynamics of grassland degradation in Central Asia during the period of 2000–2020, and to evaluate the relative role of climate variation and human activities in grassland degradation or grassland restoration. The results of this study not only provide a comprehensive picture of grassland degradation in Central Asia, but also provide a more solid basis for policy decisions in the process of grassland production and grazing management.

2. Materials and Methods
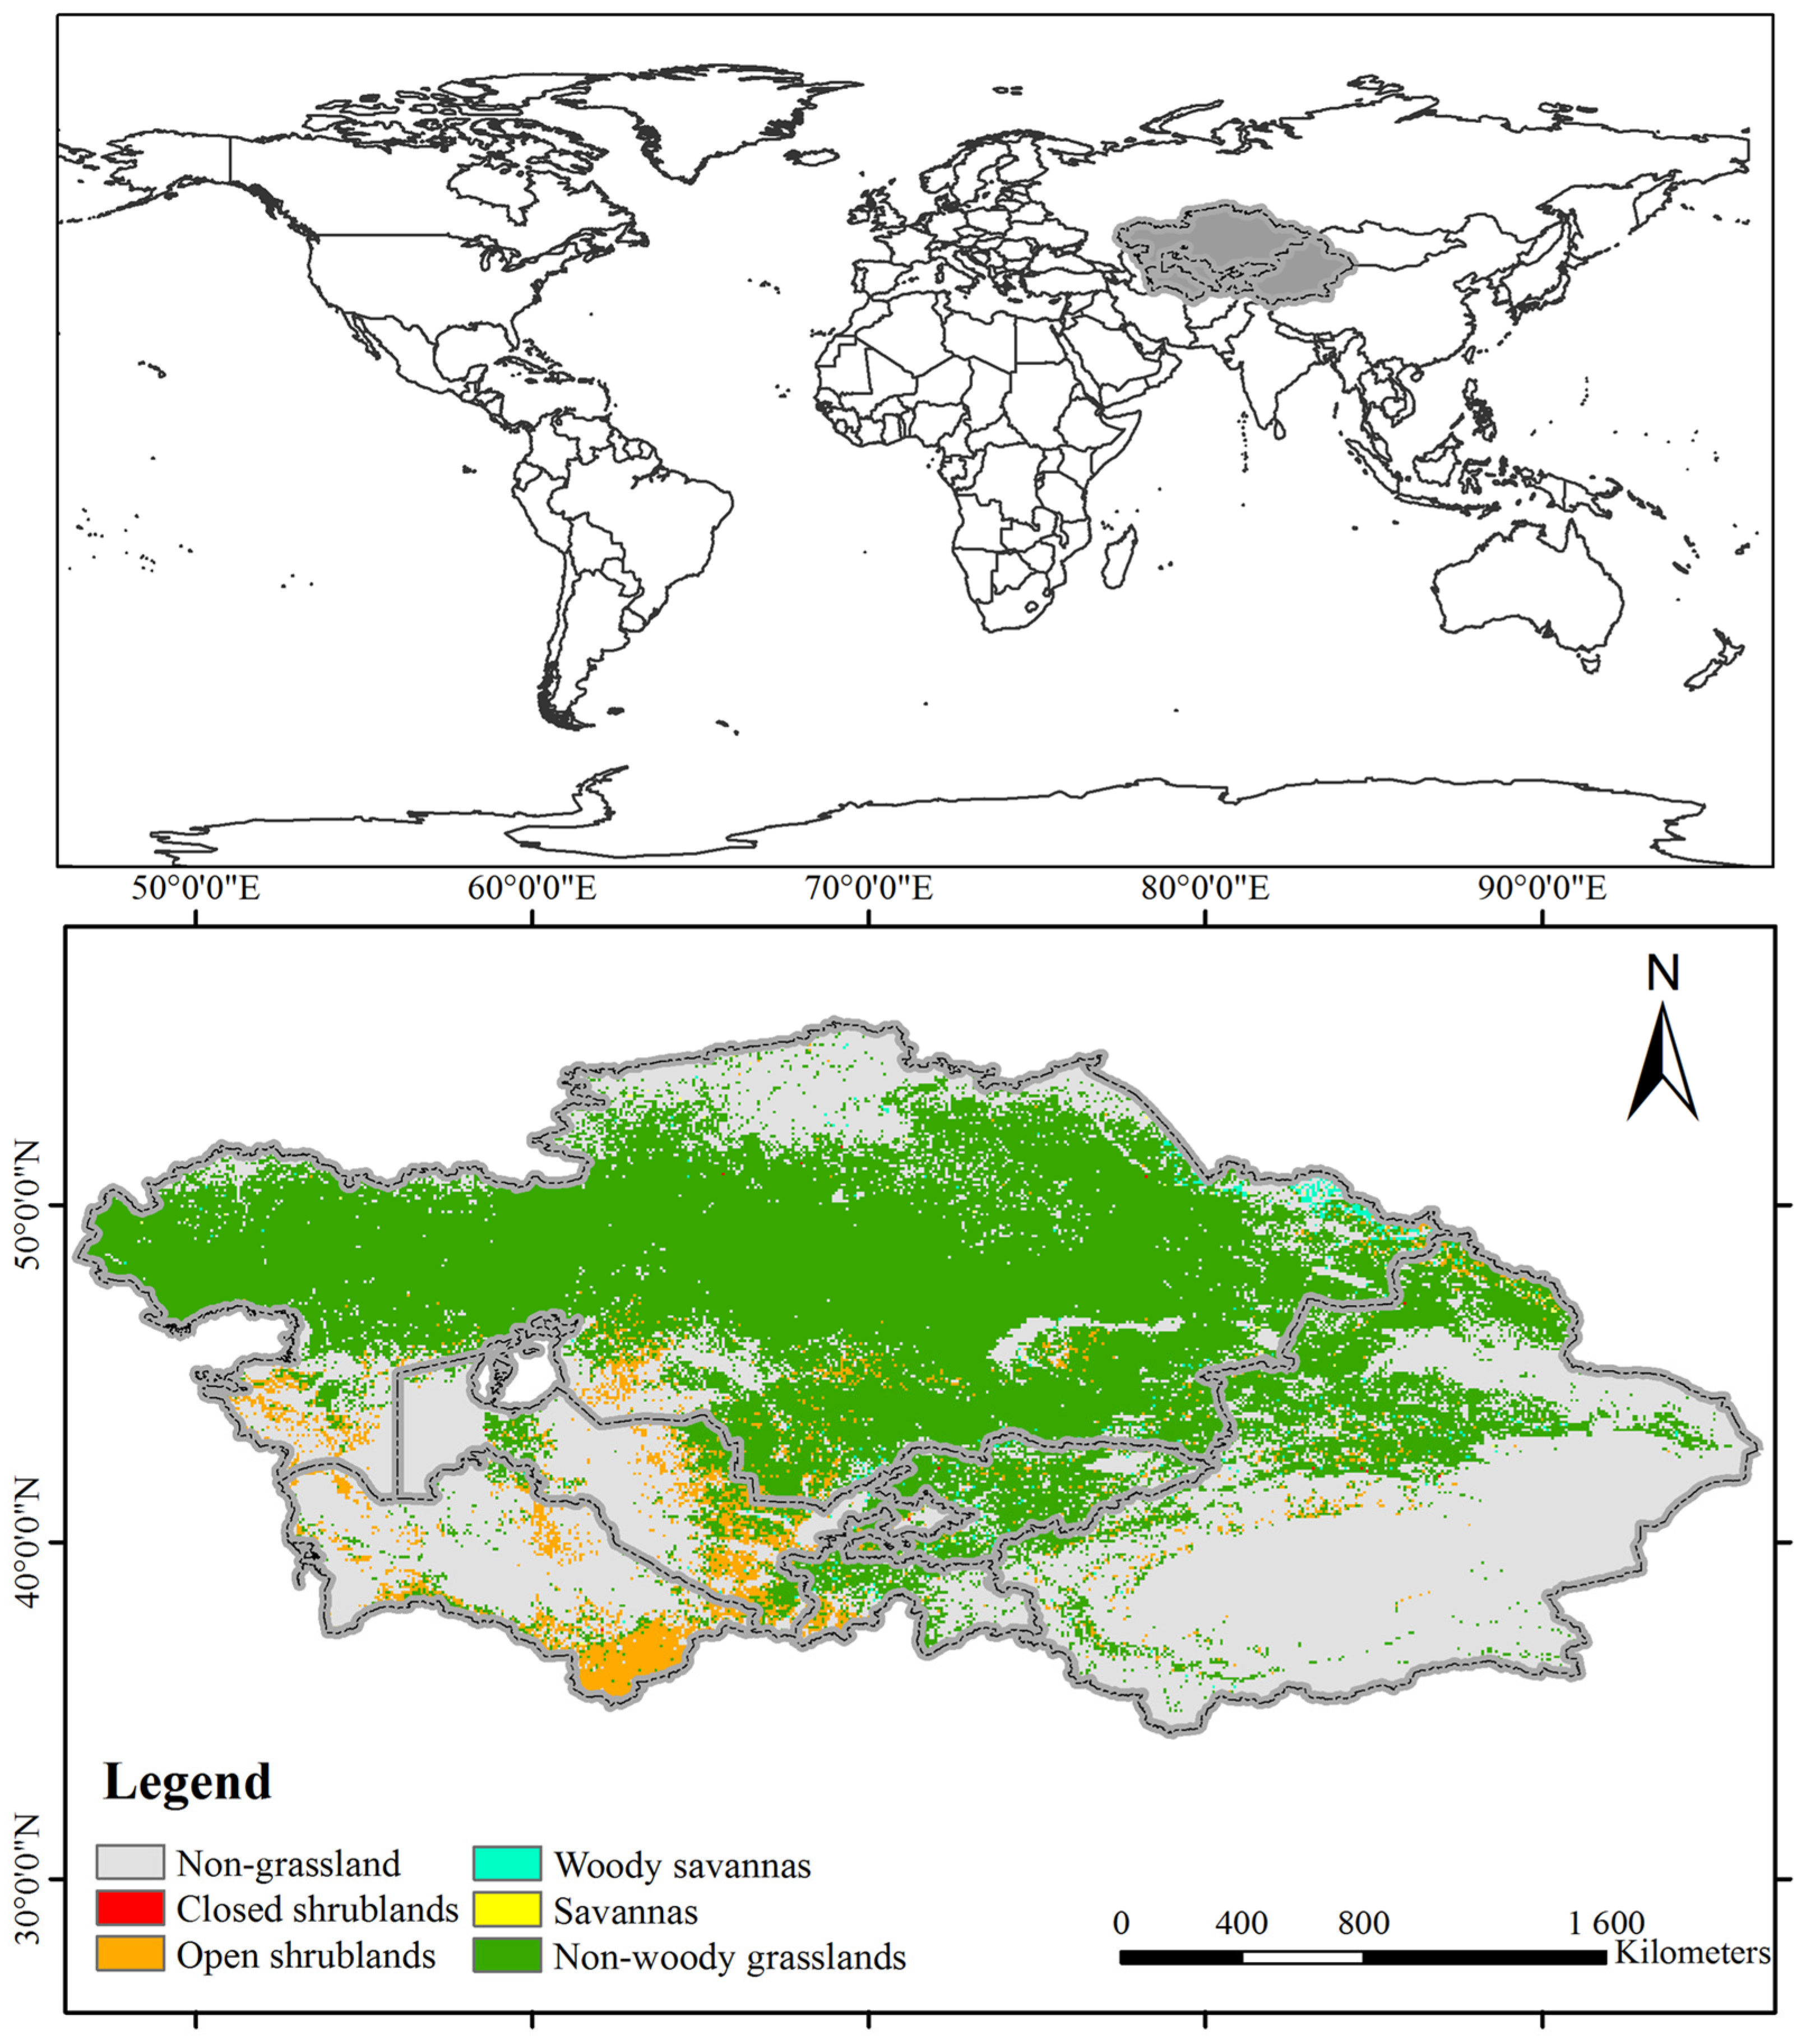
2.1. Study Area

Central Asia (34.3°–55.4° N, 46.5°–96.4° E) consists of the Xinjiang Province in China, and five central Asia states (CAS): Kazakhstan, Kyrgyzstan, Tajikistan, Turkmenistan, and Uzbekistan [2] (Figure 1). The region has a vast territory, complicated topography, and is located deep in Eurasia, with an arid climate. Mountains and plateaus intercept weak wet and cold-water vapor from the Atlantic Ocean and the Arctic Ocean, make the rainfall focused on the windward slope, and receive litter precipitation on the leeward slope and mountain basins. In recent decades, the study area has experienced rapid and accelerated warming that is about twice the global average rate of land warming [1]. Grasslands are the dominant vegetation types in Central Asia, which covers over 50% of the area [32]. The mean annual precipitation (MAP) ranges from approximately 400 mm in northern Kazakhstan to less than 100 mm in southern Uzbekistan and northern Turkmenistan, except in mountainous areas where the MAP is between 600 and 800 mm [33]. During the period of 1981–2010, the average annual temperature in northern Kazakhstan was between 2 °C and in southern Turkmenistan it was above 18 °C [34].

2.2. Data Sources

2.2.1. Land Use Data

Land use data were obtained from Moderate Resolution Imaging Spectroradiometer (MODIS) Land Cover Type (MCD12Q1). This product provides a global distribution of land cover types, which was obtained by the supervised classification of reflectance data from MODIS’s Terra and Aqua satellites. (http://modis-land.gsfc.nasa.gov/landcover.html/, accessed on 16 December 2022).
The International Geosphere-Biosphere Program (IGBP) land cover classification system identified 17 classes, which contained 3 human-altered classes, 11 natural vegetation classes, and 3 non-vegetated classes (Table 1). In this study, we selected class value 6–10 as a single grassland land cover type, including shrubland cover, savanna cover, and grassland cover.

2.2.2. Meteorological Data

The global meteorological forcing dataset was mainly obtained from UDel_AirT_Precip (University of Delaware Air Temperature and Precipitation), including monthly precipitation and temperature data (http://www.esrl.noaa.gov/psd/, accessed on 25 November 2021). We used ArcGIS 10.6 software (ESRI, Redlands, CA, USA) to calculate the mean annual temperature and mean annual precipitation from the downloaded monthly data.
At last, we used ArcGIS 10.6 software to resample all the related databases to a uniform 1 km spatial resolution. And the projection and coordinate systems used in this study were the Albers equal area conic projection and the World Geodetic System 1984, respectively.

2.3. Methods

2.3.1. Estimation of Actual NPP

In this study, the actual NPP is estimated based on the global NPP product MOD17A3 (with a spatial resolution of 1 km). The production is determined by first computing a daily net photosynthesis value which is then composited over an 8-day interval of observations for a year (http://landval.gsfc.nasa.gov/, accessed on 16 December 2022). The MOD17A3 NPP was calculated using the BIOME-BGC model [35,36]. It has been validated and applied extensively in different parts of the world [37,38]. The calculated equation is presented as follows:
N P P = t 365 P S N e t R m + R g   ,
P S N e t = G P P R l r ,
where NPP is the annual NPP (gC/m2/year). PSNet (gC/m2/day) is the net photosynthesis, which results from the difference between Gross Primary Production (GPP) and the leaf and fine root maintenance respiration. R m is the annual maintenance respiration of live cells in woody tissue, and R g refers to annual growth respiration of live cells in woody tissue. R l r is the daily leaf and fine root maintenance respiration.

2.3.2. Estimation of Potential NPP

The Thornthwaite memorial model was employed to estimate potential NPP [39,40]. It was a climate productivity model, based on the Miami model, and was modified to include Thornthwaite’s potential evaporation model. This model has been widely used in global and regional research [23]. The calculated equations are presented as follows:
N P P = 3000 [ 1 e 0.0009695 ( v 20 ) ]  
V = 1.05 r 1 + 1 + 1.05 r / L 2
L = 3000 + 25 t + 0.05 t 3
where NPP is the total annual potential NPP (gC/m2/year) and v is the annual mean actual evapotranspiration (mm). r is the total annual precipitation (mm), L is the annual mean evapotranspiration (mm), and t is the annual mean temperature (°C).

2.3.3. Estimation of Human Activity NPP

Human activity NPP represents the effect of human activities on vegetation productivity, which is calculated using the difference between potential NPP and actual NPP.
H N P P = P N P P A N P P
where HNPP is the human activity NPP. PNPP refers to potential NPP. ANPP is the actual NPP.

2.3.4. Grassland Dynamic Assessment

Vegetation dynamic is an important ecological process of land degradation. Using NPP as a basic index of grassland productivity, the grassland degradation or restoration can be evaluated. The slope was determined using ordinary least squares regression. The calculated equation is expressed as follows:
S l o p e = n × i = 1 n i × N P P i i = 1 n i i = 1 n N P P i n × i = 1 n i 2 i = 1 n i 2  
where i is the sequence number of the year ( i = 1, 2, … 21). n is the number of years, which is 21 in this formula. N P P i is the total annual N P P in time of i year. A positive slope value indicates a trend of restoration, while a negative slope value indicates a trend of degradation.
The significance of the variation tendency was analyzed by using the statistic F test to express the confidence level of variation. The calculation for statistics is presented as follows:
F = U × ( n 2 ) / Q  
Q = i = 1 n ( y i y i ^ ) 2  
U = i = 1 n y i ^ y ¯ 2
where C is a regression sum of the squares and Q is the sum of the square error. y i is the average NPP in the year i , y i ^ refers to the regression value of NPP, and y ¯ is the average value over n years. n is the number of years studied, which is 21 in this study.
According to the results of the significance test, the variation trend was divided into the following five levels: Extremely Significant Increase (ESI, slope > 0, p < 0.01); Significant Increase (SI, slope > 0, 0.01 < p < 0.05); Not Significant Change (NSC, p > 0.05); Significant Decrease (SD, slope < 0, 0.01 < p < 0.05); and Extremely Significant Decrease (ESD, slope < 0, p < 0.01).

2.3.5. Establishing Scenarios

The degradation or restoration of grassland can be represented by the slope of actual NPP (SA). A positive slope value of SA represents that grassland restoration occurs, whereas a negative slope value of SA represents that grassland degradation occurs. The effect of climate variation and human activities can be demonstrated based on the slope of potential NPP (SP) and human activity NPP (SH). A positive slope value of SP suggested that the climate is beneficial for grass growth. By contrast, a negative slope value of SP indicated that the climate decreased the grassland productivity. Meanwhile, a positive slope value of SH indicated that human activities decreased grassland productivity, whereas a negative slope value of SH demonstrated that human activities are beneficial for grass growth.
Consequently, we established eight scenarios to distinguish the relative roles of climate variation and human activities based on the slope of these three types NPP (Table 2). Scenario 1 is climate-dominated restoration (CDR), which is under the SA > 0, SP > 0, SH > 0 situation. Scenario 2 is human-activities-dominated restoration (HDR), which is under the SA > 0, SP < 0, SH < 0 situation. Scenario 3 combines the two factors of dominated restoration (BDR), which is under the SA > 0, SP > 0, SH < 0 situation. Scenario 5 is climate-dominated degradation (CDD), which is under the SA < 0, SP < 0, SH < 0 situation. Scenario 6 is human-activities-dominated degradation (HDD), which is under the SA < 0, SP > 0, SH > 0 situation. Scenario 7 combines the two factors of dominated degradation (BDD), which is under the SA < 0, SP < 0, SH > 0 situation. In scenarios 4 and 8, both human activities and climate were not the dominant factor in grassland degradation or restoration. This situation was not analyzed to avoid uncertainties in this study.

3. Results

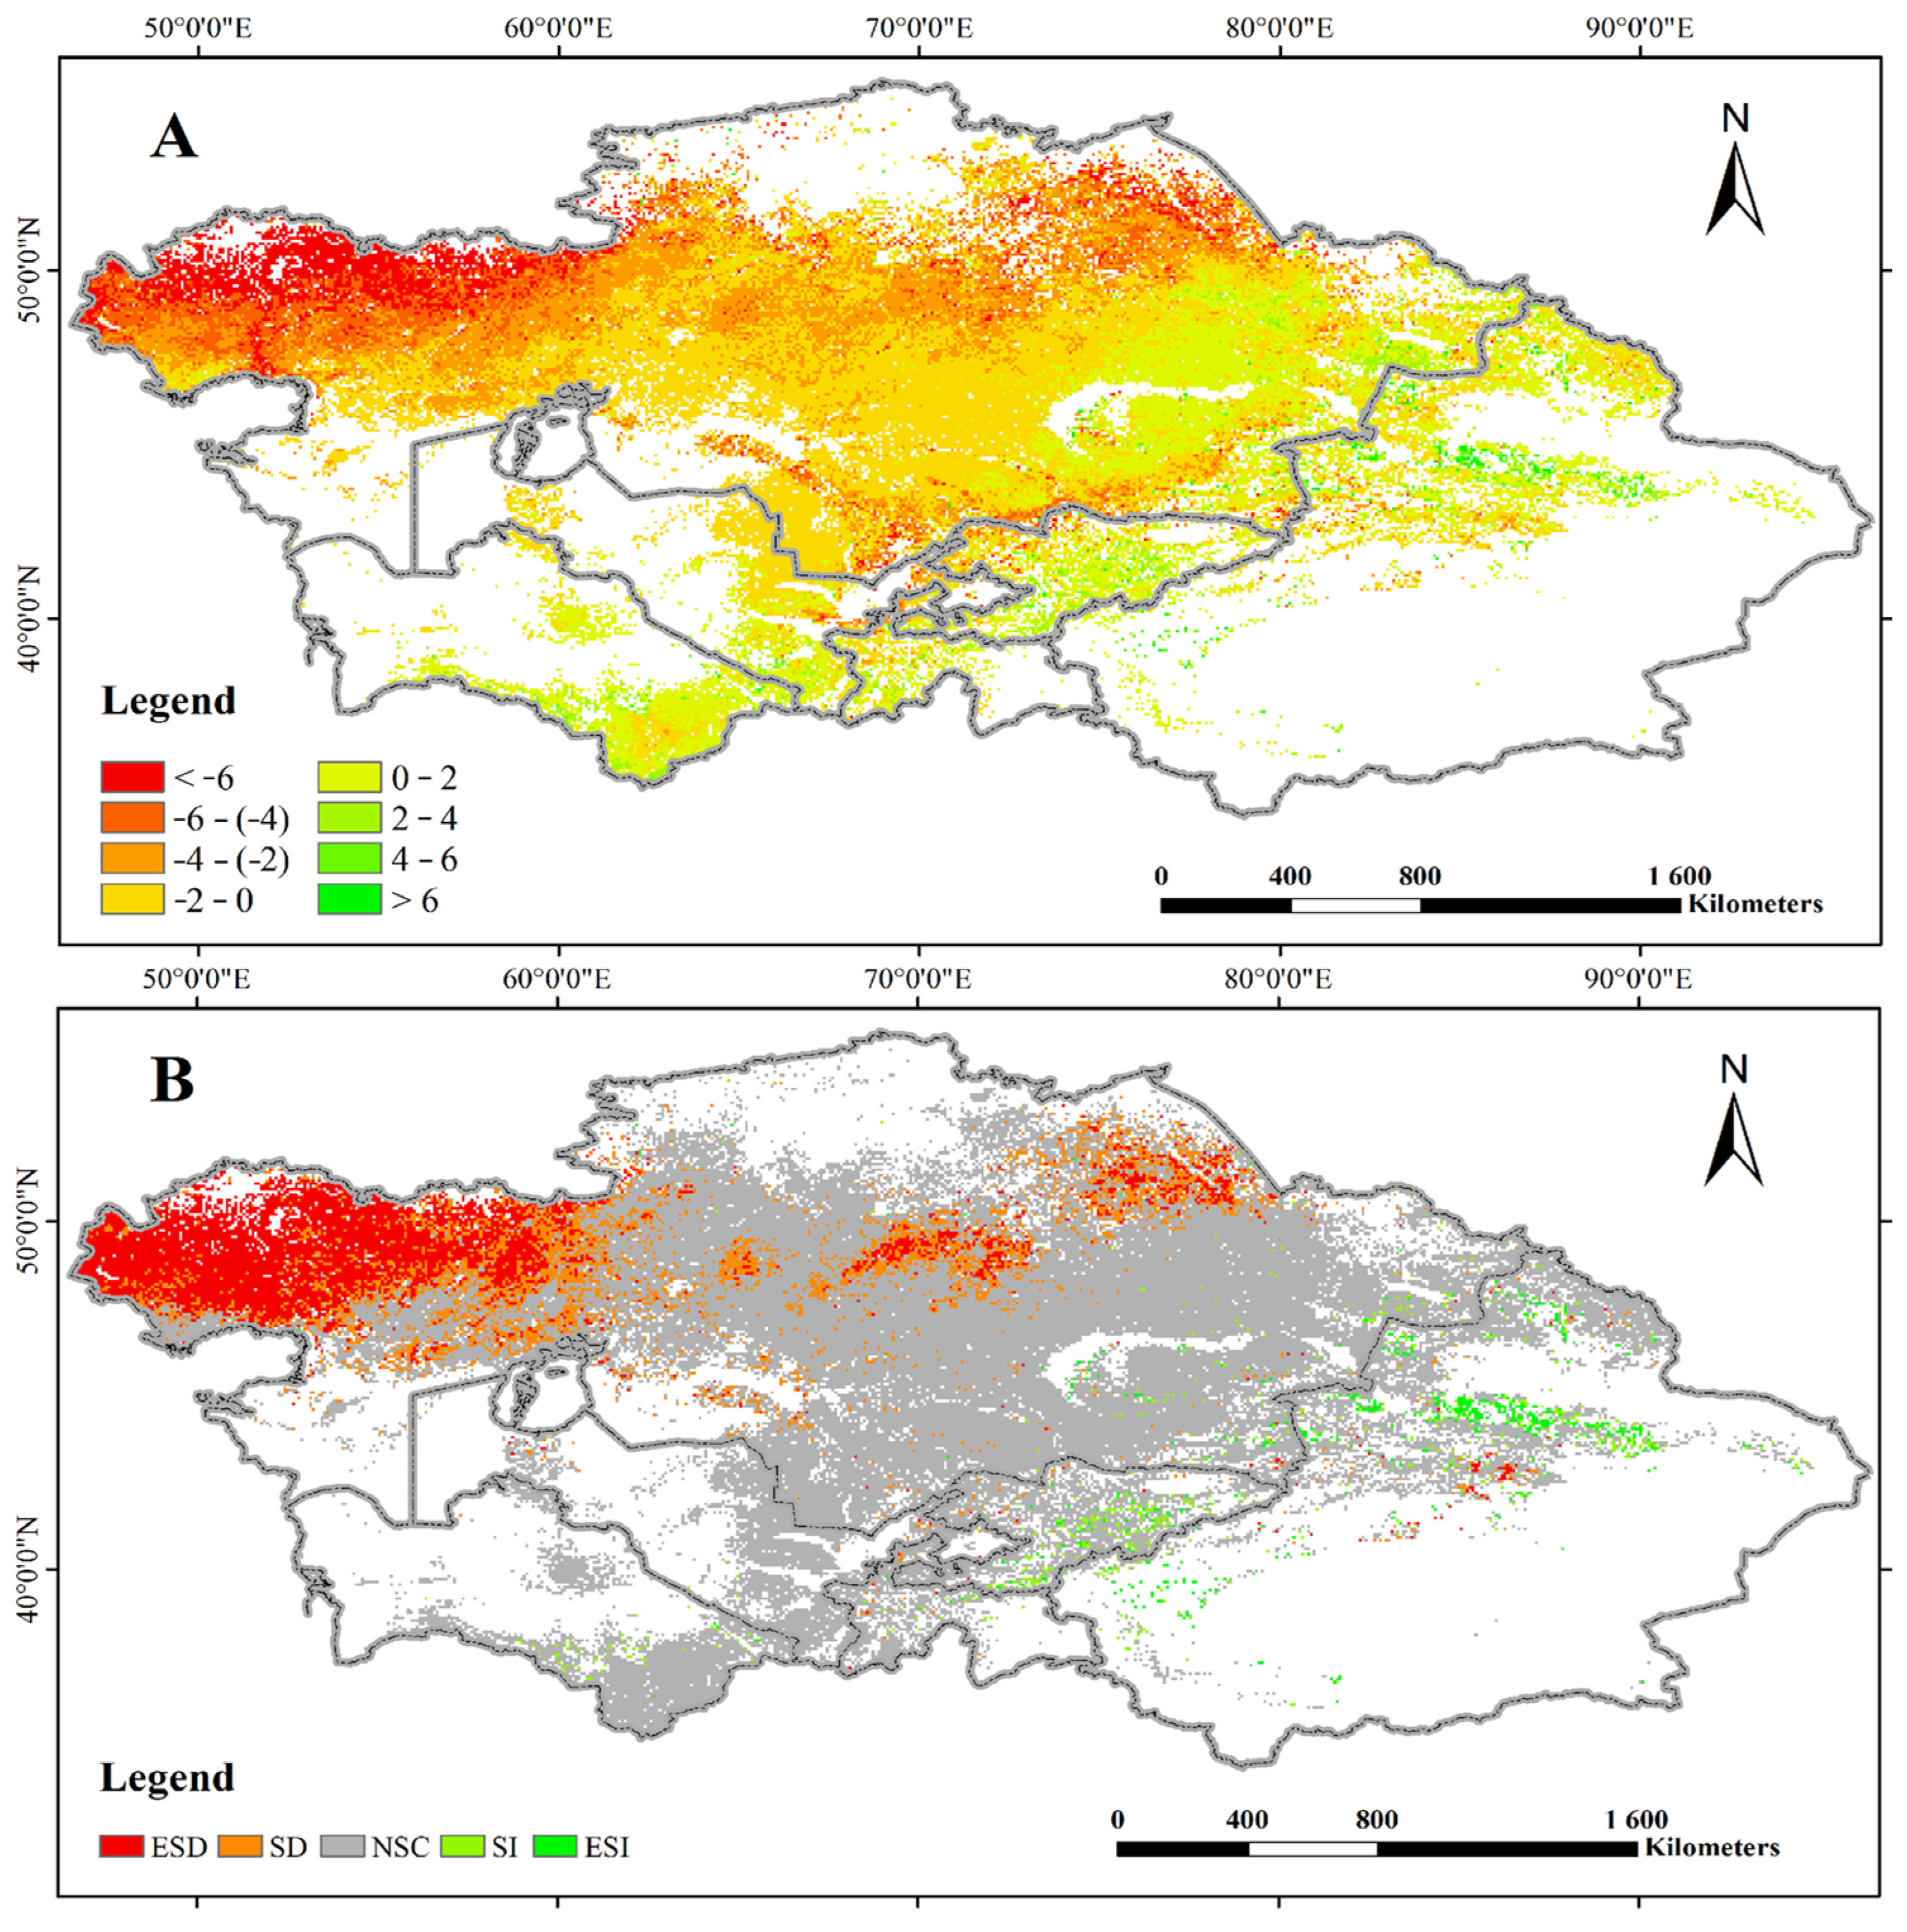
3.1. Dynamic Analysis of Grassland

The Mann–Kendall (M–K) test was performed in the actual NPP trend analysis of Central Asia from 2000 to 2020. Throughout the whole area, actual NPP represents a significant decrease at the confidence level of 95% (R2 = 0.19). The spatial distribution of the Central Asia grassland NPP dynamic was represented in Figure 2A. The whole variation trend of grassland NPP was decreasing, while a significantly increasing trend occurred in some regions. The area of decreased grassland NPP was widely spread and accounted for 73.6% of the Central Asia grassland area, to the extent of 28.02 × 10⁵ km2. Such a trend mainly occurred in Kazakhstan. By contrast, the increasing trend was mainly distributed in the Xinjiang province of China. In summary, the total NPP decreased by 6.01 Tg C year−1 (Tg = 1012 g) from 2000 to 2020 as the area representing the NPP decreasing trend is larger than the area where the NPP increasing trend occurred. The average annual NPP variation of this study area was −1.62 g Cm−2year−1.
The variation trend of the grassland NPP in these regions did not occur evenly. In Kazakhstan, approximately 85.4% of the area exhibited a grassland NPP decreasing trend. In Uzbekistan, the whole change trend was decreasing, and the areas of decreased NPP accounted for 62.69% of the grassland area. On the contrary, an increasing trend of grassland NPP was observed in Kyrgyzstan, Tajikistan, Turkmenistan, and the Xinjiang province of China, where the increased NPP area accounted for 65.23%, 52.95%, 79.81%, and 63.89% of the grassland area, respectively.
The detail spatial variation of grassland NPP and its significance were represented in Figure 2B. The extremely significant increase (ESI) area and significant increase (SI) area accounted for 1.13% and 1.38% of the whole area, respectively. These areas were mostly distributed in the Xinjiang province of China. By contrast, the extremely significant decrease (ESD) area and significant decrease (SD) area accounted for 12.38% and 10.70% of the whole area, which were mainly found in Kazakhstan. In the rest of the region, there was no significant trend of increase or decrease.
In this study, the areas that do not have a significant slope were considered as “grassland with no trend” or “unchanged grassland”. The extremely significant increase area and significant increase area were considered as “restored grassland”, and the extremely significant decrease area and significant decrease area were considered as “degraded grassland” (Table 3). Therefore, the degraded grassland area was 8.79 × 10⁵ km2, accounting for 23.08% of the whole area. These areas were mostly distributed in the north and northwest of Kazakhstan, including the Turgai Plateau, Turgay Depression, Kazakhskiy Melkosopochnik, Ural River, and the Ertix River. The restored grassland area was 0.96 × 10⁵ km2, which occupied 2.51% of the whole area. The restored grassland mostly occurred in the north of the Tianshan Mountain, Xinjiang province.

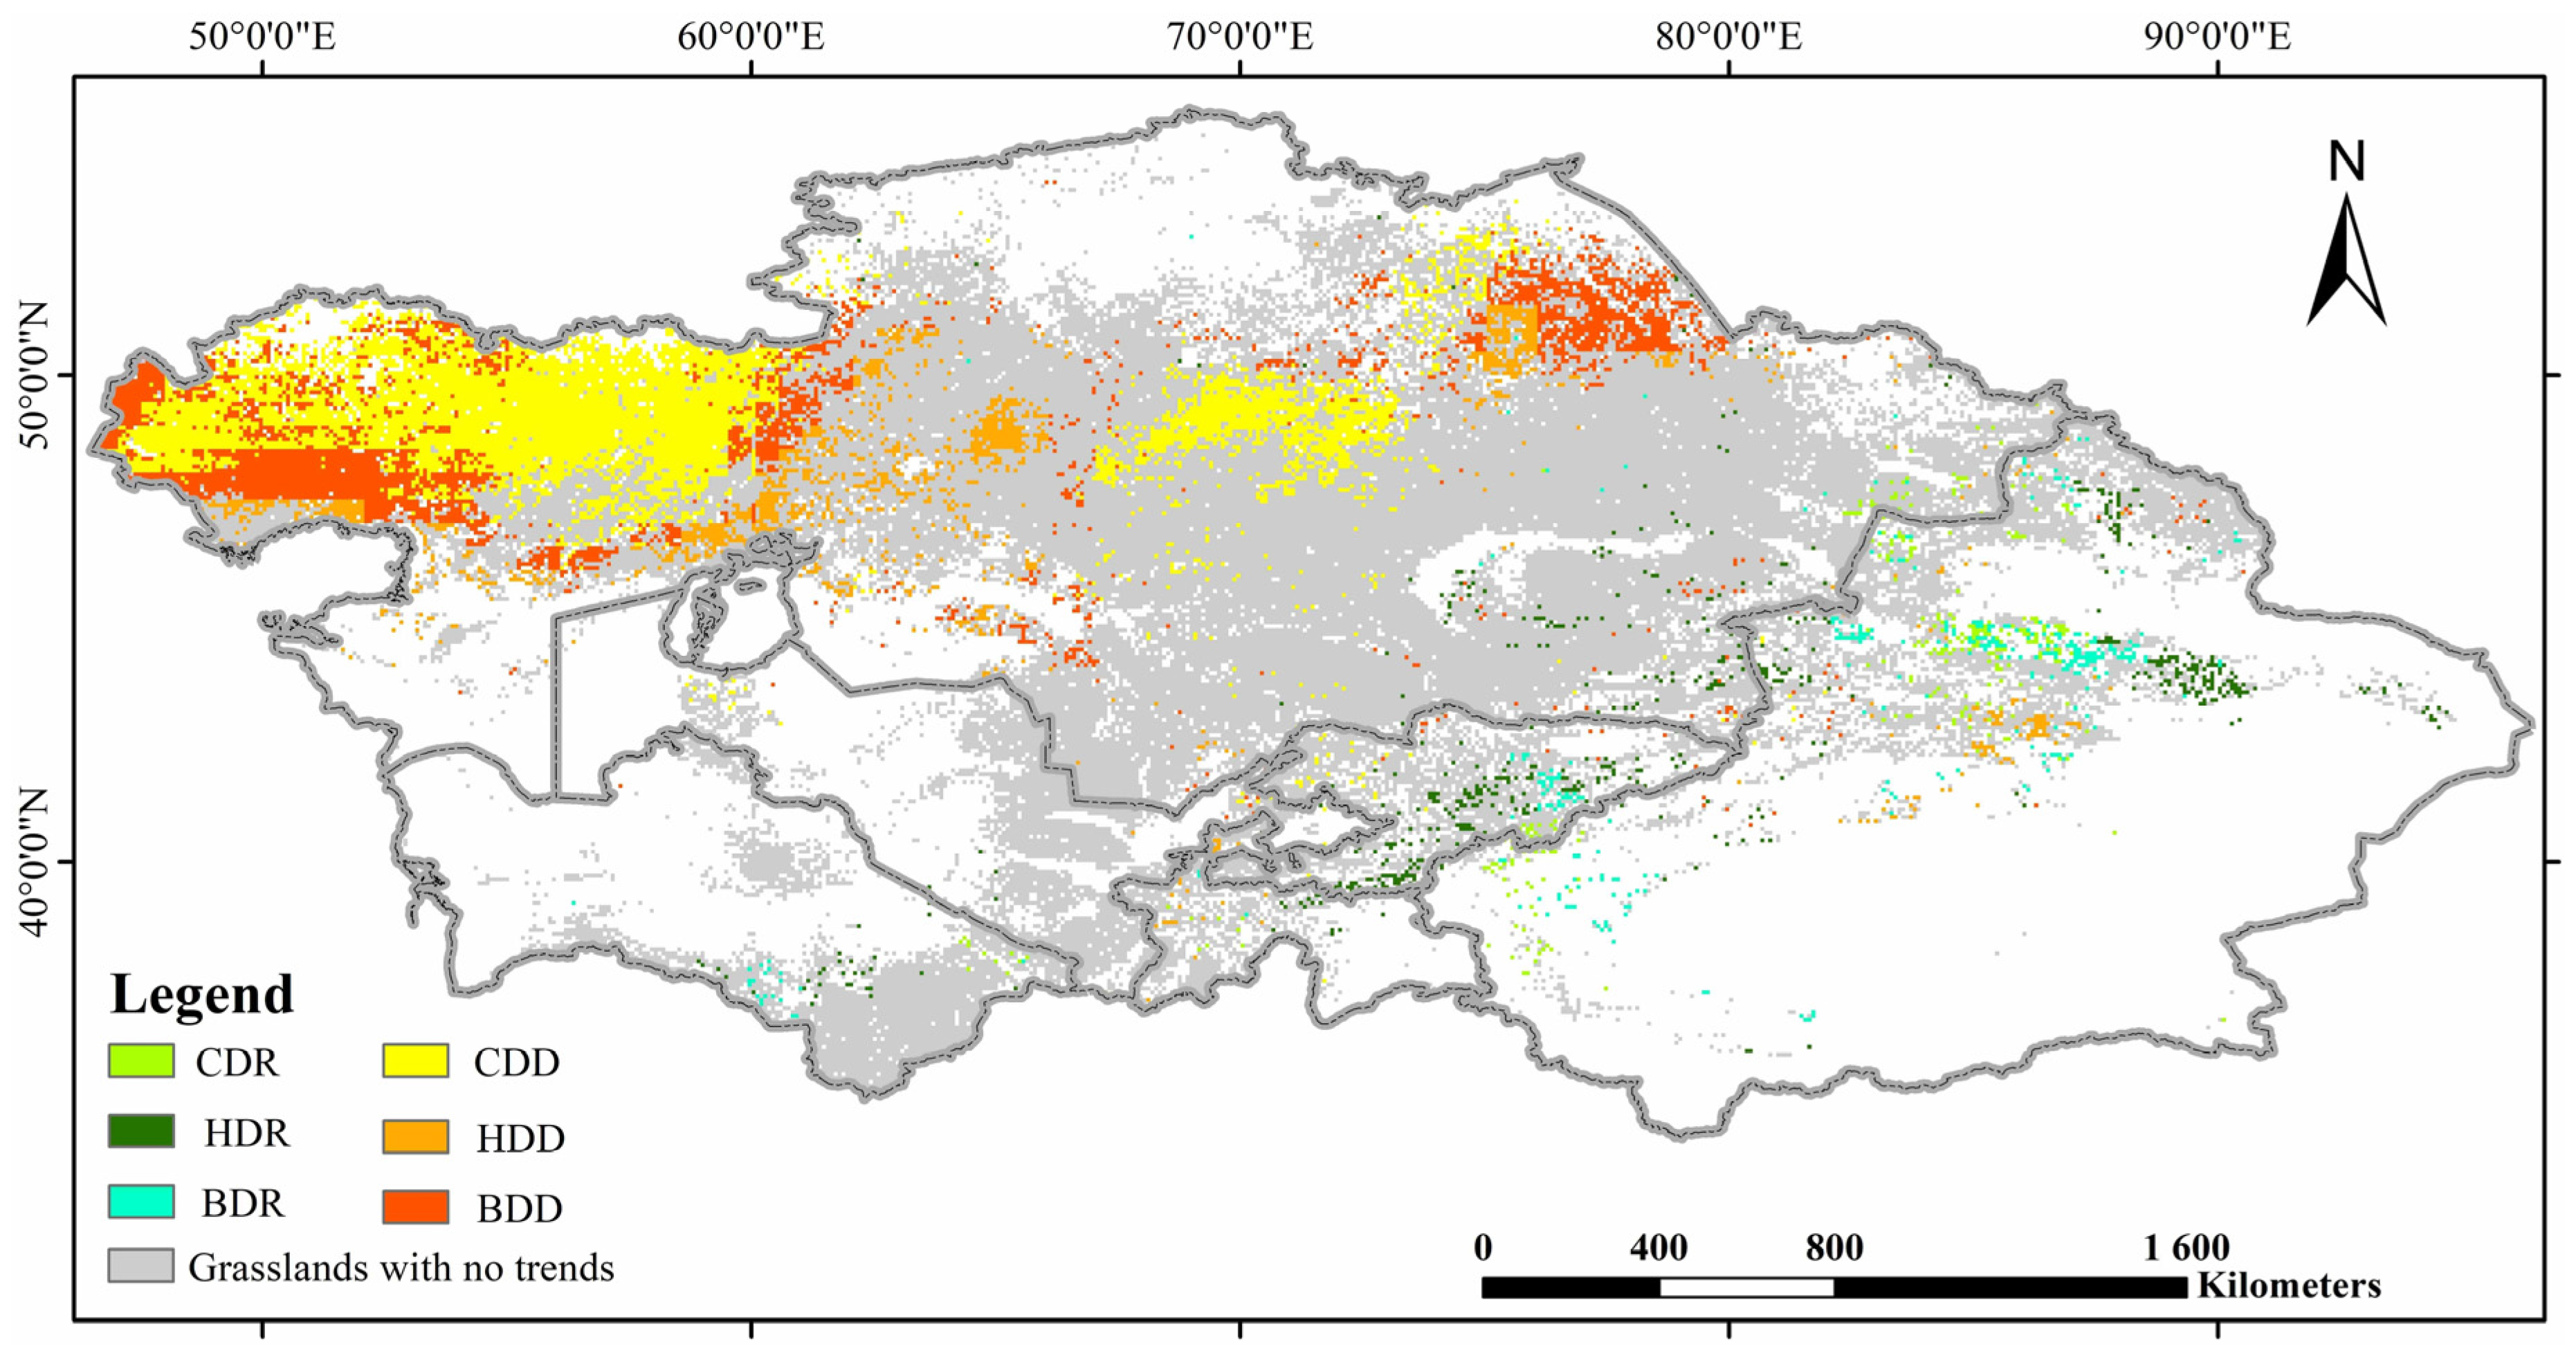
3.2. Respective Roles of Climate Variation and Human Activities in Central Asia Grassland

The spatial distribution of grassland dynamics in Central Asia, under the influence of climate variation and human activities, is represented in Figure 3. Climate variation had an impact on grassland degradation, resulting in 53.81% of grassland area degradation, which was typically observed in the Turgai Plateau and Kazakhskiy Melkosopochnik of Kazakhstan. The human-dominated degradation grassland was mainly distributed in the Turgay Depression of Kazakhstan, accounting for 14.45% of the total degraded grassland. The contribution of the combined climate variation and human activities to grassland degradation was 31.74%, which was mainly found in Kazakhstan from the east to the west.
The grassland restoration caused by the combined climate variation and human activities was also analyzed. The restored grassland area was 0.96 × 10⁵ km2, accounting for 2.52% of the whole area. The human-activities-dominated area accounted for 47.92% of the restored grassland area and was mainly distributed in the Xinjiang province of China. By contrast, the effect of climate variation resulted in 25% of restoration, compared with 27.08% of the restored grassland induced by the combination of climate variation and human activities. In all, climate variation was the main driving force of grassland degradation and the human-activities-dominated grassland restoration.
To further assess the contribution of climate variation and human activities to grassland, we calculated the grassland degradation and restoration based on NPP variation (Table 4). The grassland NPP of the degraded areas decreased by 9.77 Tg C (Tg = 1012 g) from 2000 to 2020. A total of 55.68% of the NPP decrease was caused by climate variation, whereas 9.62% was a result of human activities. The decreased NPP contributed by the combination of the two factors was 3.39 Tg C, which occupied 34.7% of the total loss of carbon. This further explained that climate variation dominated the grassland degradation.
Meanwhile, the restored grassland NPP increased 1.26 Tg C during the study period. Furthermore, the restored grassland contributed to by climate variation accounted for 19.84% of the whole restored grassland NPP. Human activities and the combination of the two factors resulted in 37.3% and 42.86% of grassland restoration, respectively. Both the two factors resulted in maximum grassland NPP restoration, and human activities were the principal driving force of grassland restoration.
In summary, no matter whether the quantitative evaluation was based on grassland NPP change or the area of grassland variation, climate variation had a dominant role in driving grassland degradation, and human activities were the dominant factor for grassland restoration.

4. Discussion

4.1. Spatial Heterogeneity and Trends of Central Asia Grassland

In this study, we found that 23.08% of grassland in Central Asia was in the trend of degradation, while 2.51% of grassland was in the trend of recovery during the study period (Table 3). These results are consistent with the outcomes of previous studies. Liu, Zhang [12] found that the grasslands in Central Asia were commonly experiencing degradation. The decline in grassland productivity and vegetation degradation problems in this region may be attributed to a combination of human activities and climatic factors. Unsustainable grazing practices and irrational human development have contributed to these issues [41]. The decline in grassland productivity can be attributed, to some extent, to the impact of climate change [34].
The spatial distribution of grassland in this region exhibited non-uniformity. In Kazakhstan and Uzbekistan, the whole changing trend was degradation. On the contrary, a restoration trend of grassland was observed in Kyrgyzstan, Turkmenistan, Tajikistan, and the Xinjiang province of China. The findings align with the outcomes of prior investigations. The grassland in some basins of Kazakhstan was commonly experiencing degradation and presented the trend of restoration in Kyrgyzstan, Tajikistan, and the Xinjiang province of China [12]. The variation trend of grassland NPP was decreasing in Uzbekistan [10]. And the grassland area of Uzbekistan showed a decreasing trend from 1991 to 2010 [9].

4.2. Impact of Climate Factors on Grassland Dynamics

In recent decades, Central Asia has experienced a regional trend of rising temperature and declining precipitation levels [4,42]. Xu, Wang [43] found that the decrease in precipitation and the increase in potential evapotranspiration in Central Asia from 2000 to 2012 attributed to the escalating air temperature. In the current study, the annual precipitation showed a decreasing trend, and the annual temperature experienced an increasing trend during the period of 2000–2020 in these regions. The region of Kazakhstan had an especially large decreasing trend in precipitation. The rise in temperature typically resulted in enhanced evaporation, thereby inducing soil moisture stress [44]. Accompanied with the decreased precipitation, this would lead to water deficit. As the primary constraint on vegetation growth is the availability of water, these results of climate variation would cause vegetation degradation. Furthermore, Xu, Wang [43] and Propastin [45] found that grasslands exhibit the highest vulnerability to water scarcity in Central Asia due to their shallower rooting habit.
Therefore, climate variation induced the grassland degradation during the study period, and the vegetation growth was affected by both temperature and water availability; precipitation was the main climate-controlling factor for grassland growth in Central Asia [46,47].

4.3. Impact of Human Activities on Grassland Dynamics

Human activities have both beneficial and detrimental impacts on grassland degradation and restoration. The findings revealed that grazing exerted significant impacts on the vegetation coverage, leaf count, leaf height, and aboveground biomass of grassland. In particular, the biomass exhibited a notable decrease, indicating that overgrazing played a pivotal role in driving grassland degradation [30,48]. Our study found that the human-dominated degradation grassland was mainly distributed in Kazakhstan. This result agrees with previous research. The livestock population in Kazakhstan exhibited a consistent and continuous growth trend from 2003 to 2017. The conflict between grassland and livestock make Kazakhstan stand out as one of the most prominent grassland degradation areas in Central Asia [49]. The influence of human activities on grassland degradation is less important than that of climate variation (Table 4); this result might be closely related to regional climatic conditions, which largely determine regional vegetation type and primary productivity.
Our study found that grassland restoration mainly occurred in the Xinjiang province of China (Figure 3), and human activities were the dominant factor for grassland restoration (Table 4). This result may be associated with the implementation of grassland restoration projects and government management policies [50]. The Chinese government had enforced a series of ecological programs, such as the Grain to Green Program, Natural Forest Conversation Program, and Grazing Withdrawal Program [51]. Previous studies have found that the restoration of grassland has been facilitated by human activities such as forbidding grazing and the conversion of cropland to grassland [8,18,52]. These aforementioned findings may provide an explanation for the prevailing influence of human activities on grassland restoration.

4.4. Strengths and Limitation of Method

The dynamics of grassland productivity are primarily influenced by climate variation and human activities. The monitoring and assessment of these two factors, however, have traditionally been dependent on field surveys or social statistics, which are deemed inefficient, particularly in regions where conducting field surveys poses challenges or where there is a dearth of statistical data [53,54]. The prevailing approach is to assume that grassland productivity dynamics are only affected by climate variation and human activities. The potential NPP represents a hypothetical condition that grassland achieved maximum productivity, and the actual NPP is the real condition of vegetation productivity. The disparity between actual NPP and potential NPP is solely influenced by human activities. This methodology to distinguish and assess the relative role of climate variation and human activities by comparing actual grassland NPP with potential NPP has successfully detected grassland degradation in previous research [8,18,19,21,28,55].
This method is capable of detecting regional, spatial, and NPP variations influenced by climate change and human activities. Xu, Kang [28] employed this approach to develop a simulation model incorporating the slope of NPP and desertification scenarios. Gang [21], Zhou [8], and Wang [56] have applied this methodology to assess the grassland degradation and expanded the study region to global and regional scales. Therefore, the NPP coupled with scenario simulation method has been effectively utilized for monitoring grassland degradation.
The various approaches each have their respective limitations. The methodology we used in this study was based on the hypothesis that the difference between potential NPP and actual NPP is only affected by human activities. Although it has been widely used and verified in previous studies, the presence of unaccounted factors, such as grassland fires, grassland rodents, and variations in grassland species, can introduce uncertainties into the results (Table 5). Furthermore, there are some uncertainties in calculating potential NPP by using the statistic model, which is only affected by air temperature and precipitation.

5. Conclusions

The present study assessed the impact of climate variation and human activities on grassland degradation and restoration in Central Asia from 2000 to 2020, utilizing NPP as an indicator. The outcomes showed that the grassland in Central Asia exhibited a decreasing trend during the study period. A total of 23.08% of the whole grassland area experienced grassland degradation and the degraded grassland was mainly distributed in Kazakhstan. On the contrary, 2.51% of the whole grassland experienced grassland restoration and the restored grassland mainly occurred in the Xinjiang province of China.
The relative contribution of climate variation and human activities to grassland degradation were 53.8% and 14.5%, respectively. By contrast, 47.9% of grassland restoration was induced by human activities, and 25% was caused by climate variation. Furthermore, the quantitative assessment based on NPP variation was used in this study. The results revealed that 55.7% of NPP decrease was caused by climate variation, whereas 9.6% was a result of human activities. By contrast, climate variation and human activities resulted in 19.8% and 37.3% of grassland restoration, respectively. Therefore, whether based on changes in net primary productivity or quantitative evaluations of grassland area change, the dominant driving force behind grassland degradation is climate variation, and human activities remain the primary factors for grassland restoration. The promotion of grassland protection programs and management measures in Central Asia needs to be conducted with great vigor.

Author Contributions

Conceptualization, Y.Y. and M.X.; methodology, J.S.; software, J.Q.; validation, Y.Y., W.P. and K.Z.; formal analysis, X.X.; data curation, Y.Y. and X.X.; writing—original draft preparation, Y.Y.; writing—review and editing, Y.Y.; visualization, Y.Y.; supervision, D.L.; project administration, D.L. All authors have read and agreed to the published version of the manuscript.

Funding

This research was funded by [Research on pollution and carbon reduction Regulation Technology and Policy] grant number [GYZX210501] and [Research Project of Ecological Environment Protection Planning and Policy Evaluation under the Background of Yangtze River Delta Integration].

Data Availability Statement

Not applicable.

Acknowledgments

The editors and reviewers have our utmost gratitude.

Conflicts of Interest

The authors declare no conflict of interest.

References

  1. Hu, Z.; Zhang, C.; Hu, Q.; Tian, H. Temperature Changes in Central Asia from 1979 to 2011 Based on Multiple Datasets. J. Clim. 2014, 27, 1143–1167. [Google Scholar] [CrossRef]
  2. Li, C.; Zhang, C.; Luo, G.; Chen, X.; Maisupova, B.; Madaminov, A.A.; Han, Q.; Djenbaev, B.M. Carbon stock and its responses to climate change in Central Asia. Glob. Change Biol. 2015, 21, 1951–1967. [Google Scholar] [CrossRef]
  3. Hu, Z.; Li, Q.; Chen, X.; Teng, Z.; Chen, C.; Yin, G.; Zhang, Y. Climate changes in temperature and precipitation extremes in an alpine grassland of Central Asia. Theor. Appl. Climatol. 2016, 126, 519–531. [Google Scholar] [CrossRef]
  4. Lioubimtseva, E.; Cole, R. Uncertainties of Climate Change in Arid Environments of Central Asia. Rev. Fish. Sci. 2006, 14, 29–49. [Google Scholar] [CrossRef]
  5. Parry, M.L.; Canziani, O.F.; Palutikof, J.P.; Linden, P.J.v.d.; Hanson, C.E. Climate Change 2007: Impacts, Adaptation and Vulnerability; Cambridge University Press: Cambridge, UK, 2007; Volume 976. [Google Scholar]
  6. UNDP. Central Asia Human Development Report; UN Development Programme: New York, NY, USA, 2005. [Google Scholar]
  7. Scarnecchia, D.L.; Miller, D.J.; Craig, S.R. Rangelands and Pastoral Development in the Hindu Kush-Himalayas. J. Range Manag. 1998, 51, 723. [Google Scholar] [CrossRef]
  8. Zhou, W.; Gang, C.; Zhou, F.; Li, J.; Dong, X.; Zhao, C. Quantitative assessment of the individual contribution of climate and human factors to desertification in northwest China using net primary productivity as an indicator. Ecol. Indic. 2015, 48, 560–569. [Google Scholar] [CrossRef]
  9. Fan, B.-B.; Luo, G.-P.; Hu, Z.-Y.; Li, C.-F.; Han, Q.-F.; Wang, Y.-G. Land resource development and utilization in Centural Asia. Arid Land Geogr. 2012, 35, 928–937. [Google Scholar] [CrossRef]
  10. Yang, Y.; Wang, Z.; Li, J.; Gang, C.; Zhang, Y.; Zhang, Y.; Odeh, I.; Qi, J. Comparative assessment of grassland degradation dynamics in response to climate variation and human activities in China, Mongolia, Pakistan and Uzbekistan from 2000 to 2013. J. Arid Environ. 2016, 135, 164–172. [Google Scholar] [CrossRef]
  11. Chen, X.; Bai, J.; Li, X.; Luo, G.; Li, J.; Li, B.L. Changes in land use/land cover and ecosystem services in Central Asia during 1990–2009. Curr. Opin. Environ. Sustain. 2013, 5, 116–127. [Google Scholar] [CrossRef]
  12. Liu, C.J.; Zhang, L.; Zhou, Y.; Zhang, B.H.; Hou, X.L. Retrieval and analysis of grassland coverage in arid Xinjiang, China and five countries of Central Asia. Pratacult. Sci. 2016, 10, 861–870. [Google Scholar]
  13. Han, J.G.; Zhang, Y.J.; Wang, C.J.; Bai, W.M.; Wang, Y.R.; Han, G.D.; Li, L.H. Rangeland degradation and restoration management in China. Rangel. J. 2008, 30, 233–239. [Google Scholar] [CrossRef]
  14. Haberl, H. Human Appropriation of Net Primary Production as an Environmental Indicator: Implications for Sustainable Development. Ambio 1997, 26, 143–146. [Google Scholar]
  15. Field, C.B. Sharing the Garden. Science 2001, 294, 2490–2491. [Google Scholar] [CrossRef]
  16. Intergovernmental Panel on Climate Change (Ed.) Climate Change 2013—The Physical Science Basis; Cambridge University Press: Cambridge, UK, 2014. [Google Scholar]
  17. Zhou, W.; Li, J.L.; Mu, S.J.; Gang, C.C.; Sun, Z.G. Effects of ecological restoration-induced land-use change and improved management on grassland net primary productivity in the Shiyanghe River Basin, north-west China. Grass Forage Sci. 2014, 69, 596–610. [Google Scholar] [CrossRef]
  18. Xu, D.Y.; Kang, X.W.; Zhuang, D.F.; Pan, J.J. Multi-scale quantitative assessment of the relative roles of climate change and human activities in desertification—A case study of the Ordos Plateau, China. J. Arid Environ. 2010, 74, 498–507. [Google Scholar] [CrossRef]
  19. Zhang, C.; Wang, X.; Li, J.; Hua, T. Roles of climate changes and human interventions in land degradation: A case study by net primary productivity analysis in China’s Shiyanghe Basin. Environ. Earth Sci. 2011, 64, 2183–2193. [Google Scholar] [CrossRef]
  20. Zhou, W.; Gang, C.; Zhou, L.; Chen, Y.; Li, J.; Ju, W.; Odeh, I. Dynamic of grassland vegetation degradation and its quantitative assessment in the northwest China. Acta Oecologica 2014, 55, 86–96. [Google Scholar] [CrossRef]
  21. Gang, C.; Zhou, W.; Chen, Y.; Wang, Z.; Sun, Z.; Li, J.; Qi, J.; Odeh, I. Quantitative assessment of the contributions of climate change and human activities on global grassland degradation. Environ. Earth Sci. 2014, 72, 4273–4282. [Google Scholar] [CrossRef]
  22. Yeganeh, H.; Khajedein, S.J.; Amiri, F.; Shariff, A.R.B.M. Monitoring rangeland ground cover vegetation using multitemporal MODIS data. Arab. J. Geosci. 2012, 7, 287–298. [Google Scholar] [CrossRef]
  23. Zhang, Y.; Zhang, C.; Wang, Z.; Chen, Y.; Gang, C.; Ru, A.; Li, J. Vegetation dynamics and its driving forces from climate change and human activities in the Three-River Source Region, China from 1982 to 2012. Sci. Total Environ. 2016, 563–564, 210–220. [Google Scholar] [CrossRef]
  24. Schimel, D.S. Terrestrial biogeochemical cycles: Global estimates with remote sensing. Remote Sens. Environ. 1995, 51, 49–56. [Google Scholar] [CrossRef]
  25. Zheng, Y.R.; Xie, Z.X.; Robert, C.; Jiang, L.H.; Shimizu, H. Did climate drive ecosystem change and induce desertification in Otindag sandy land, China over the past 40 years? J. Arid Environ. 2006, 64, 523–541. [Google Scholar] [CrossRef]
  26. Wessels, K.J.; Prince, S.D.; Reshef, I. Mapping land degradation by comparison of vegetation production to spatially derived estimates of potential production. J. Arid Environ. 2008, 72, 1940–1949. [Google Scholar] [CrossRef]
  27. Prince, S.D.; Becker-Reshef, I.; Rishmawi, K. Detection and mapping of long-term land degradation using local net production scaling: Application to Zimbabwe. Remote Sens. Environ. 2009, 113, 1046–1057. [Google Scholar] [CrossRef]
  28. Xu, D.Y.; Kang, X.W.; Liu, Z.L.; Zhuang, D.F.; Pan, J.J. Assessing the relative role of climate change and human activities in sandy desertification of Ordos region, China. Sci. China 2009, 52, 855–868. [Google Scholar] [CrossRef]
  29. Liu, Y.; Zhang, Z.; Tong, L.; Khalifa, M.; Sun, Z. Assessing the effects of climate variation and human activities on grassland degradation and restoration across the globe. Ecol. Indic. 2019, 106, 105504. [Google Scholar] [CrossRef]
  30. Tong, L.; Liu, Y.; Wang, Q.; Zhang, Z.; Li, J.; Sun, Z.; Khalifa, M. Relative effects of climate variation and human activities on grassland dynamics in Africa from 2000 to 2015. Ecol. Inform. 2019, 53, 100979. [Google Scholar] [CrossRef]
  31. Zhou, Y.; Zhu, M.; Guo, X.; Li, K.; Miao, J.; Guo, J.; Xu, X.; Yue, D. Relative effects of climate change and human activities on net primary productivity in Shule River Basin. Acta Ecol. Sin. 2019, 39, 5127–5137. [Google Scholar] [CrossRef]
  32. Fei, H.Q.; Ping, L.G.; Jie, B.; Li, L.J.; Fan, L.C.; Bin, F.B.; Gang, W.Y. Characteristics of land use and cover change in Central Asia in recent 30 years. Arid Land Geogr. 2012, 35, 909–918. [Google Scholar]
  33. Klein, I.; Gessner, U.; Kuenzer, C. Regional land cover mapping and change detection in Central Asia using MODIS time-series. Appl. Geogr. 2012, 35, 219–234. [Google Scholar] [CrossRef]
  34. Mohammat, A.; Wang, X.; Xu, X.; Peng, L.; Yang, Y.; Zhang, X.; Myneni, R.B.; Piao, S. Drought and spring cooling induced recent decrease in vegetation growth in Inner Asia. Agric. For. Meteorol. 2013, 178–179, 21–30. [Google Scholar] [CrossRef]
  35. Li, D.K.; Fan, J.Z.; Wang, J. Variation characteristics of vegetation net primary productivity in Shaanxi Province based on MO17A3. Chin. J. Ecol. 2011, 30, 2776–2782. [Google Scholar]
  36. Turner, D.P.; Ritts, W.D.; Cohen, W.B.; Gower, S.T.; Running, S.W.; Zhao, M.; Costa, M.H.; Kirschbaum, A.A.; Ham, J.M.; Saleska, S.R. Evaluation of MODIS NPP and GPP products across multiple biomes. Remote Sens. Environ. 2006, 102, 282–292. [Google Scholar] [CrossRef]
  37. Jones, M.O.; Running, S.W.; Kimball, J.S.; Robinson, N.P.; Allred, B.W. Terrestrial primary productivity indicators for inclusion in the National Climate Indicators System. Clim. Change 2020, 163, 1855–1868. [Google Scholar] [CrossRef]
  38. Peng, D.; Zhang, B.; Wu, C.; Huete, A.R.; Gonsamo, A.; Lei, L.; Ponce-Campos, G.E.; Liu, X.; Wu, Y. Country-level net primary production distribution and response to drought and land cover change. Sci. Total Environ. 2017, 574, 65–77. [Google Scholar] [CrossRef]
  39. Lieth, H. Modeling the Primary Productivity of the World; Springer: Berlin/Heidelberg, Germany, 1975; pp. 237–263. [Google Scholar]
  40. Lieth, H.; Box, E. Evapotranspiration and primary productivity. Publ. Climatol. 1972, 25, 37–46. [Google Scholar]
  41. Yan, J.J.; Qiao, M.; Zhou, H.F.; Zhou, S.B.; Lou, L.; Song, P. Vegetation dynamics in Ili River valley of Xinjiang based on MODIS/NDVI. Arid Land Geogr. 2013, 36, 512–519. [Google Scholar]
  42. Lioubimtseva, E.; Henebry, G.M. Climate and environmental change in arid Central Asia: Impacts, vulnerability, and adaptations. J. Arid Environ. 2009, 73, 963–977. [Google Scholar] [CrossRef]
  43. Xu, H.-j.; Wang, X.-p.; Zhang, X.-x. Decreased vegetation growth in response to summer drought in Central Asia from 2000 to 2012. Int. J. Appl. Earth Obs. Geoinf. 2016, 52, 390–402. [Google Scholar] [CrossRef]
  44. Dai, A. Increasing drought under global warming in observations and models. Nat. Clim. Chang. 2013, 3, 52–58. [Google Scholar] [CrossRef]
  45. Propastin, P.A. Inter-Annual Changes in Vegetation Activities and Their Relationship to Temperature and Precipitation in Central Asia from 1982 to 2003. J. Environ. Inform. 2008, 12, 75–87. [Google Scholar] [CrossRef]
  46. Gessner, U.; Naeimi, V.; Klein, I.; Kuenzer, C.; Klein, D.; Dech, S. The relationship between precipitation anomalies and satellite-derived vegetation activity in Central Asia. Glob. Planet. Change 2012, 110, 74–87. [Google Scholar] [CrossRef]
  47. Zhang, C.; Lu, D.; Chen, X.; Zhang, Y.; Maisupova, B.; Tao, Y. The spatiotemporal patterns of vegetation coverage and biomass of the temperate deserts in Central Asia and their relationships with climate controls. Remote Sens. Environ. 2016, 175, 271–281. [Google Scholar] [CrossRef]
  48. Xia, J.; Zhu, C. Effect of grazing intensity on pasture structure and tissue turnover in a perennial ryegrass pasture ecosystem. Chin. J. Appl. Ecol. 1995, 6, 6. [Google Scholar]
  49. Xin, W.; Yan, H.; Xie, X.; Du, W.; Lai, C.; Zhen, L. Temporal and Spatial Dynamics Analysis of Grassland Ecosystem Pressure in Kazakhstan. J. Resour. Ecol. 2019, 10, 667. [Google Scholar] [CrossRef]
  50. Zhang, Y.; Wang, Q.; Wang, Z.; Yang, Y.; Li, J. Impact of human activities and climate change on the grassland dynamics under different regime policies in the Mongolian Plateau. Sci. Total Environ. 2020, 698, 134304. [Google Scholar] [CrossRef]
  51. Wang, W.; Xing, L. Ecological Construction and Sustainable Development in China: The Case of Jiaxing Municipality; Springer: New York, NY, USA, 2010; pp. 223–241. [Google Scholar]
  52. Wang, T.; Sun, J.-G.; Han, H.; Yan, C.-Z. The relative role of climate change and human activities in the desertification process in Yulin region of northwest China. Env. Monit Assess 2012, 184, 7165–7173. [Google Scholar] [CrossRef]
  53. Li, B. The Rangeland Degradation in North China and Its Preventive Strategy. Sci. Agric. Sin. 1997, 30, 1–9. [Google Scholar]
  54. Rojstaczer, S.; Sterling, S.M.; Moore, N.J. Human appropriation of photosynthesis products. Science 2001, 294, 2549–2552. [Google Scholar] [CrossRef]
  55. Wessels, K.J.; Prince, S.D.; Malherbe, J.; Small, J.; Frost, P.E.; VanZyl, D. Can human-induced land degradation be distinguished from the effects of rainfall variability? A case study in South Africa. J. Arid Environ. 2007, 68, 271–297. [Google Scholar] [CrossRef]
  56. Li, Q.; Zhang, C.; Shen, Y.; Jia, W.; Li, J. Quantitative assessment of the relative roles of climate change and human activities in desertification processes on the Qinghai-Tibet Plateau based on net primary productivity. Catena 2016, 147, 789–796. [Google Scholar] [CrossRef]
Figure 1. The location of the study area and the distribution of Central Asia grassland in 2000.
Agronomy 13 02763 g001
Figure 2. The spatial variation trend of grassland NPP under different significance levels from 2000 to 2020. (A) is the slope of NPP (g Cm−2year−1) and (B) is the corresponding significance levels.
Agronomy 13 02763 g002
Figure 3. The spatial distribution of climate variation, human activities, and the two combined effects on the Central Asia grassland from 2000 to 2020.
Agronomy 13 02763 g003
Table 1. International Geosphere-Biosphere Program (IGBP) land cover classification system.
NameValueDescription
Evergreen Needleleaf Forests1Dominated by evergreen conifer trees (canopy > 2 m). Tree cover > 60%.
Evergreen Broadleaf Forests2Dominated by evergreen broadleaf and palmate trees (canopy > 2 m). Tree cover > 60%.
Deciduous Needleleaf Forests3Dominated by deciduous needleleaf (larch) trees (canopy > 2 m). Tree cover > 60%.
Deciduous Broadleaf Forests4Dominated by deciduous broadleaf trees (canopy > 2 m). Tree cover > 60%.
Mixed Forests5Dominated by neither deciduous nor evergreen (40–60% of each) tree type (canopy > 2 m). Tree cover > 60%.
Closed Shrublands6Dominated by woody perennials (1–2 m height) >60% cover.
Open Shrublands7Dominated by woody perennials (1–2 m height) 10–60% cover.
Woody Savannas8Tree cover 30–60% (canopy > 2 m).
Savannas9Tree cover 10–30% (canopy > 2 m).
Grasslands10Dominated by herbaceous annuals (<2 m).
Permanent Wetlands11Permanently inundated lands with 30–60% water cover and >10% vegetated cover.
Croplands12At least 60% of area is cultivated cropland.
Urban and Built-up Lands13At least 30% impervious surface area including building materials, asphalt, and vehicles.
Cropland/Natural Vegetation Mosaics14Mosaics of small-scale cultivation 40–60% with natural tree, shrub, or herbaceous vegetation.
Permanent Snow and Ice15At least 60% of area is covered by snow and ice for at least 10 months of the year.
Barren16At least 60% of area is non-vegetated barren (sand, rock, soil) areas with less than 10% vegetation.
Water Bodies17At least 60% of area is covered by permanent water bodies.
Table 2. The eight scenarios for distinguishing the relative roles of climate variation and human activities in degradation or restoration.
Change TrendsScenarioSPSHDominant Driving Forces
SA > 0
(Restoration)
Scenario 1>0>0Climate variation
Scenario 2<0<0Human activities
Scenario 3>0<0Combining the two factors
Scenario 4<0>0Uncertainty
SA < 0
(Degradation)
Scenario 5<0<0Climate variation
Scenario 6>0>0Human activities
Scenario 7<0>0Combining the two factors
Scenario 8>0<0Uncertainty
Table 3. The changing area of grassland NPP in Central Asia from 2000 to 2020.
Change TrendsSignificance LevelsArea (105 km2)Proportion (%)
Restored grasslandESI0.431.13
SI0.531.38
Degraded grasslandSD4.0810.70
ESD4.7112.38
Table 4. The contribution of the respective roles of climate variation and human activities by area, NPP variation rate, and total NPP from 2000 to 2020.
Dominating FactorArea (105 km2)NPP Variation Rate
(g Cm−2year−1)
Total NPP (Tg C)
CDR0.240.800.25
HDR0.460.790.47
BDR0.261.600.54
CDD4.73−0.88−5.44
HDD1.27−0.57−0.94
BDD2.79−0.93−3.39
Table 5. The driving forces of grassland degradation.
Driving ForceDescriptionData Source
Climate changeGlobal warming leads to increased grassland evaporation, arid climate, and fragile ecosystemChinese Encyclopedia of Resource Science, General introduction to grassland agro-ecosystems, Grasses and Grassland Ecology, Remote Sensing Monitoring of Grassland Degradation, Degraded Succession and Ecological Restoration of Alpine Grassland in the Three-River Source Region, etc.
Natural disasterFire, drought, wind, hail, and other disasters
Other natural factorsGrassland rodents, plant diseases, and insect pests
Over grazingOvergrazing reduces the yield of grass
Other human interferenceExcessive reclamation, indiscriminate mining, irrational use of water resources, lack of protection and management measures
Disclaimer/Publisher’s Note: The statements, opinions and data contained in all publications are solely those of the individual author(s) and contributor(s) and not of MDPI and/or the editor(s). MDPI and/or the editor(s) disclaim responsibility for any injury to people or property resulting from any ideas, methods, instructions or products referred to in the content.

