Article

Effects of Subsoiling with Different Wing Mounting Heights on Soil Water Infiltration Using HYDRUS-2D Simulations

1
College of Agricultural Equipment Engineering, Henan University of Science and Technology, Luoyang 471000, China
2
College of Mechanical and Electric Engineering, Northwest A&F University, Xianyang 712100, China
3
Collaborative Innovation Center of Machinery Equipment Advanced Manufacturing of Henan Province, Luoyang 471000, China
*
Authors to whom correspondence should be addressed.
Agronomy 2023, 13(11), 2742; https://doi.org/10.3390/agronomy13112742
Submission received: 9 October 2023 / Revised: 28 October 2023 / Accepted: 30 October 2023 / Published: 30 October 2023
(This article belongs to the Special Issue Effective Soil and Water Conservation Practices in Agriculture)

Abstract

:
Subsoiling is an essential practice in conservation tillage technology. The amount of disturbed soil at various depths resulting from subsoilers with different parameters has an important effect on soil properties (e.g., bulk density and water infiltration). The information regarding the effects of subsoiling on the characteristics of soil water infiltration is essential for the design of subsoiling tools. In this study, the effects of the wing mounting height (h) (75–155 mm) of the subsoiler on soil disturbance and soil water infiltration were modelled using HYDRUS-2D and validated using field experiments. Results showed that reducing h values resulted in larger soil disturbance area ratios, soil water infiltration rates (f(t)), distances of vertical wetting front movement (DVWs), accumulative infiltrations (AINs), and soil moisture contents at depths of 10–30 cm. The relationships among characteristics of soil water infiltration, h and time (t), were developed. The stable infiltration rates (fs) varied quadratically with h and the corresponding coefficient of determination (R2) was 0.9869. The Horton model is more suitable for describing the relationship between f(t) and t under the tested soil conditions, as compared with the Kostiakov and Philip models. According to the results of soil water content at different depths from the HYDRUS simulations and field experiments, the developed soil water infiltration model had a good accuracy, as indicated by RMSEs of <0.05, R2 values of >0.95, and mean relative errors of <12%. The Above results indicated that increasing the hardpan disturbance by optimizing wing parameters of the subsoiler could improve soil water infiltration characteristics.

1. Introduction

Mechanical subsoiling is one of the key practices in conservation tillage technology. It is mainly employed to break hardpans, eliminate the issue of soil compaction, improve the characteristics of soil water infiltration, and restore the productivity of farmland [1,2,3,4,5]. The wing mounting height of a winged subsoiling tool can greatly affect subsequent soil water infiltration after subsoiling by changing the disturbance behaviour of soils at various layers. The existing research about winged subsoilers has mainly investigated the effects of geometrical or working parameters of subsoiler’s wings on resistances and soil’s dynamic attributes [6,7,8,9]. Spoor and Godwin [6] investigated the effect of wing length on tillage resistance and soil disturbance area. Raper [10] compared the tillage performance of several column-type subsoilers from Kelley Manufacturing Co. (Tifton, GA, USA) and found that adding different wings to the shank more or less increased the specific draft force of subsoilers. A study from Li et al. [7] showed that both draught force and soil disturbance area increased with the addition of two wings to a column subsoiler. Wang et al. [8] investigated soil-winged subsoiler interactions using discrete element method simulations and found that the draft force of the subsoiler in the hardpan was the main source of total draught force in the winged subsoiler. Xia [9] found that wing mounting angle and mounting height significantly affected the shape of the furrow profile disturbed by the winged subsoiler. Reducing top layer soil disturbance and increasing hardpan disturbance during subsoiling operations are often identified as methods to conserve soil and preserve soil water [10,11,12,13,14]. However, differences in the density of the top layer at different locations can be reduced by completely disturbing the top layer soil, which helps to prepare a good seedbed. Moreover, increasing disturbance in the hardpan layer can cause additional energy consumption because of re-compaction from future field operations of agricultural equipment [5]. For a given soil condition, the information regarding the appropriate soil disturbance at various layers that leads to the best water infiltration, which is the premise of designing high-performance subsoilers, is lacking in the literature.
The infiltration process has long been a focus of hydrology and agricultural engineering since it provides the water that is available for plants and groundwater recharge and defines water runoff at soil surface [15,16,17,18]. Many mathematical models have been developed to evaluate the computation of infiltration and they can be classified into physically based models (PBMs), semi-empirical, and empirical models [19,20]. Compared with semi-empirical and empirical models, the physically based models can substantially describe the detailed infiltration process. The Richards equation was derived by the mass conservation law and Darcy’s law and is one of the most commonly used PBMs [19,20]. However, the Richards equation is strongly non-linear and cannot be solved analytically, especially under complex initial and boundary conditions [19,21]. With the development of computer technology, numerical simulations have become effective tools for solving the Richards equation. Based on the finite element method (FEM), the HYDRUS code was developed to solve the Richards equation and has been widely used to simulate water movement in variably saturated media [22,23]. Ebrahimian et al. [22] predicated soil water content, nitrate concentrations, and deep percolation caused by the geometry of the infiltration domain in furrow irrigation using the HYDRUS-2D model. Karandish and Simunek [24] investigated the influence of various water-saving irrigation strategies on maize water footprints using the HYDRUS model. Argyrokastritis et al. [21] investigated the ponded infiltration processes that occurs in agricultural lands irrigated by flooding of their soil surface or under insufficient drainage conditions using the HUDRUS-1D code. Ma et al. [19] modelled water infiltration in a large layered soil column with a modified Green-Ampt model and HYDRUS-1D. The above relevant works mainly focused on the effects of the geometry of the infiltration domain and initial water conditions on soil water infiltration characteristics. The effects of the amount of soil disturbance in different layers due to the variation of soil-engaging tools on water infiltration are absent in the literature.
In this study, soil disturbance area ratio (SDAR) was used to quantify the relative soil disturbance between the hardpan and the top layer. It was defined as the ratio of the disturbance area of the hardpan to that of the top layer. Therefore, the objectives of the study were to: (1) develop a soil water infiltration model using HYDRUS-2D based on the soil properties at various depths, (2) investigate the effects of variation of wing mounting heights of the subsoiler in subsoiling process on soil disturbance amount at various layers and soil water infiltration characteristics, and (3) validate the model using data from double-ring water infiltration tests in the field.

2. Materials and Methods

2.1. Study Site Description

The soil used is a Lou soil (1% clay, 9% silt, 74% sand, and 16% gravel,), which has a granular structure with secondary loess as the parent material and clay as the loamy material [12,13,14]. In this region, summer maize and winter wheat are two common crops. After harvesting the crops, conventional tillage was generally performed before this field test.
Soil cone index (CI) in the tested field was determined using a SC-900 digital display soil compactness meter (Figure 1A). The soil compaction degree and formation of hardpan soil (i.e., Plough sole) can be evaluated using the soil cone index [4,25]. Previous researchers [4,26] have shown that increasing the soil cone index can decrease the elongation and growth of crop roots. The threshold level at which soil strength hinders root elongation varies with plant species, but is usually 1800 kPa or larger [26,27]. The soil cone index in the depth of 16–30 cm from the surface was larger than 1800 kPa (Figure 1B). Therefore, the hardpan layer at the depth of 16–30 cm could limit the development of crop roots, especially for drier soil, as the strength of soil rises as soil dries [27,28,29].

2.2. Experimental Design and Data Collection

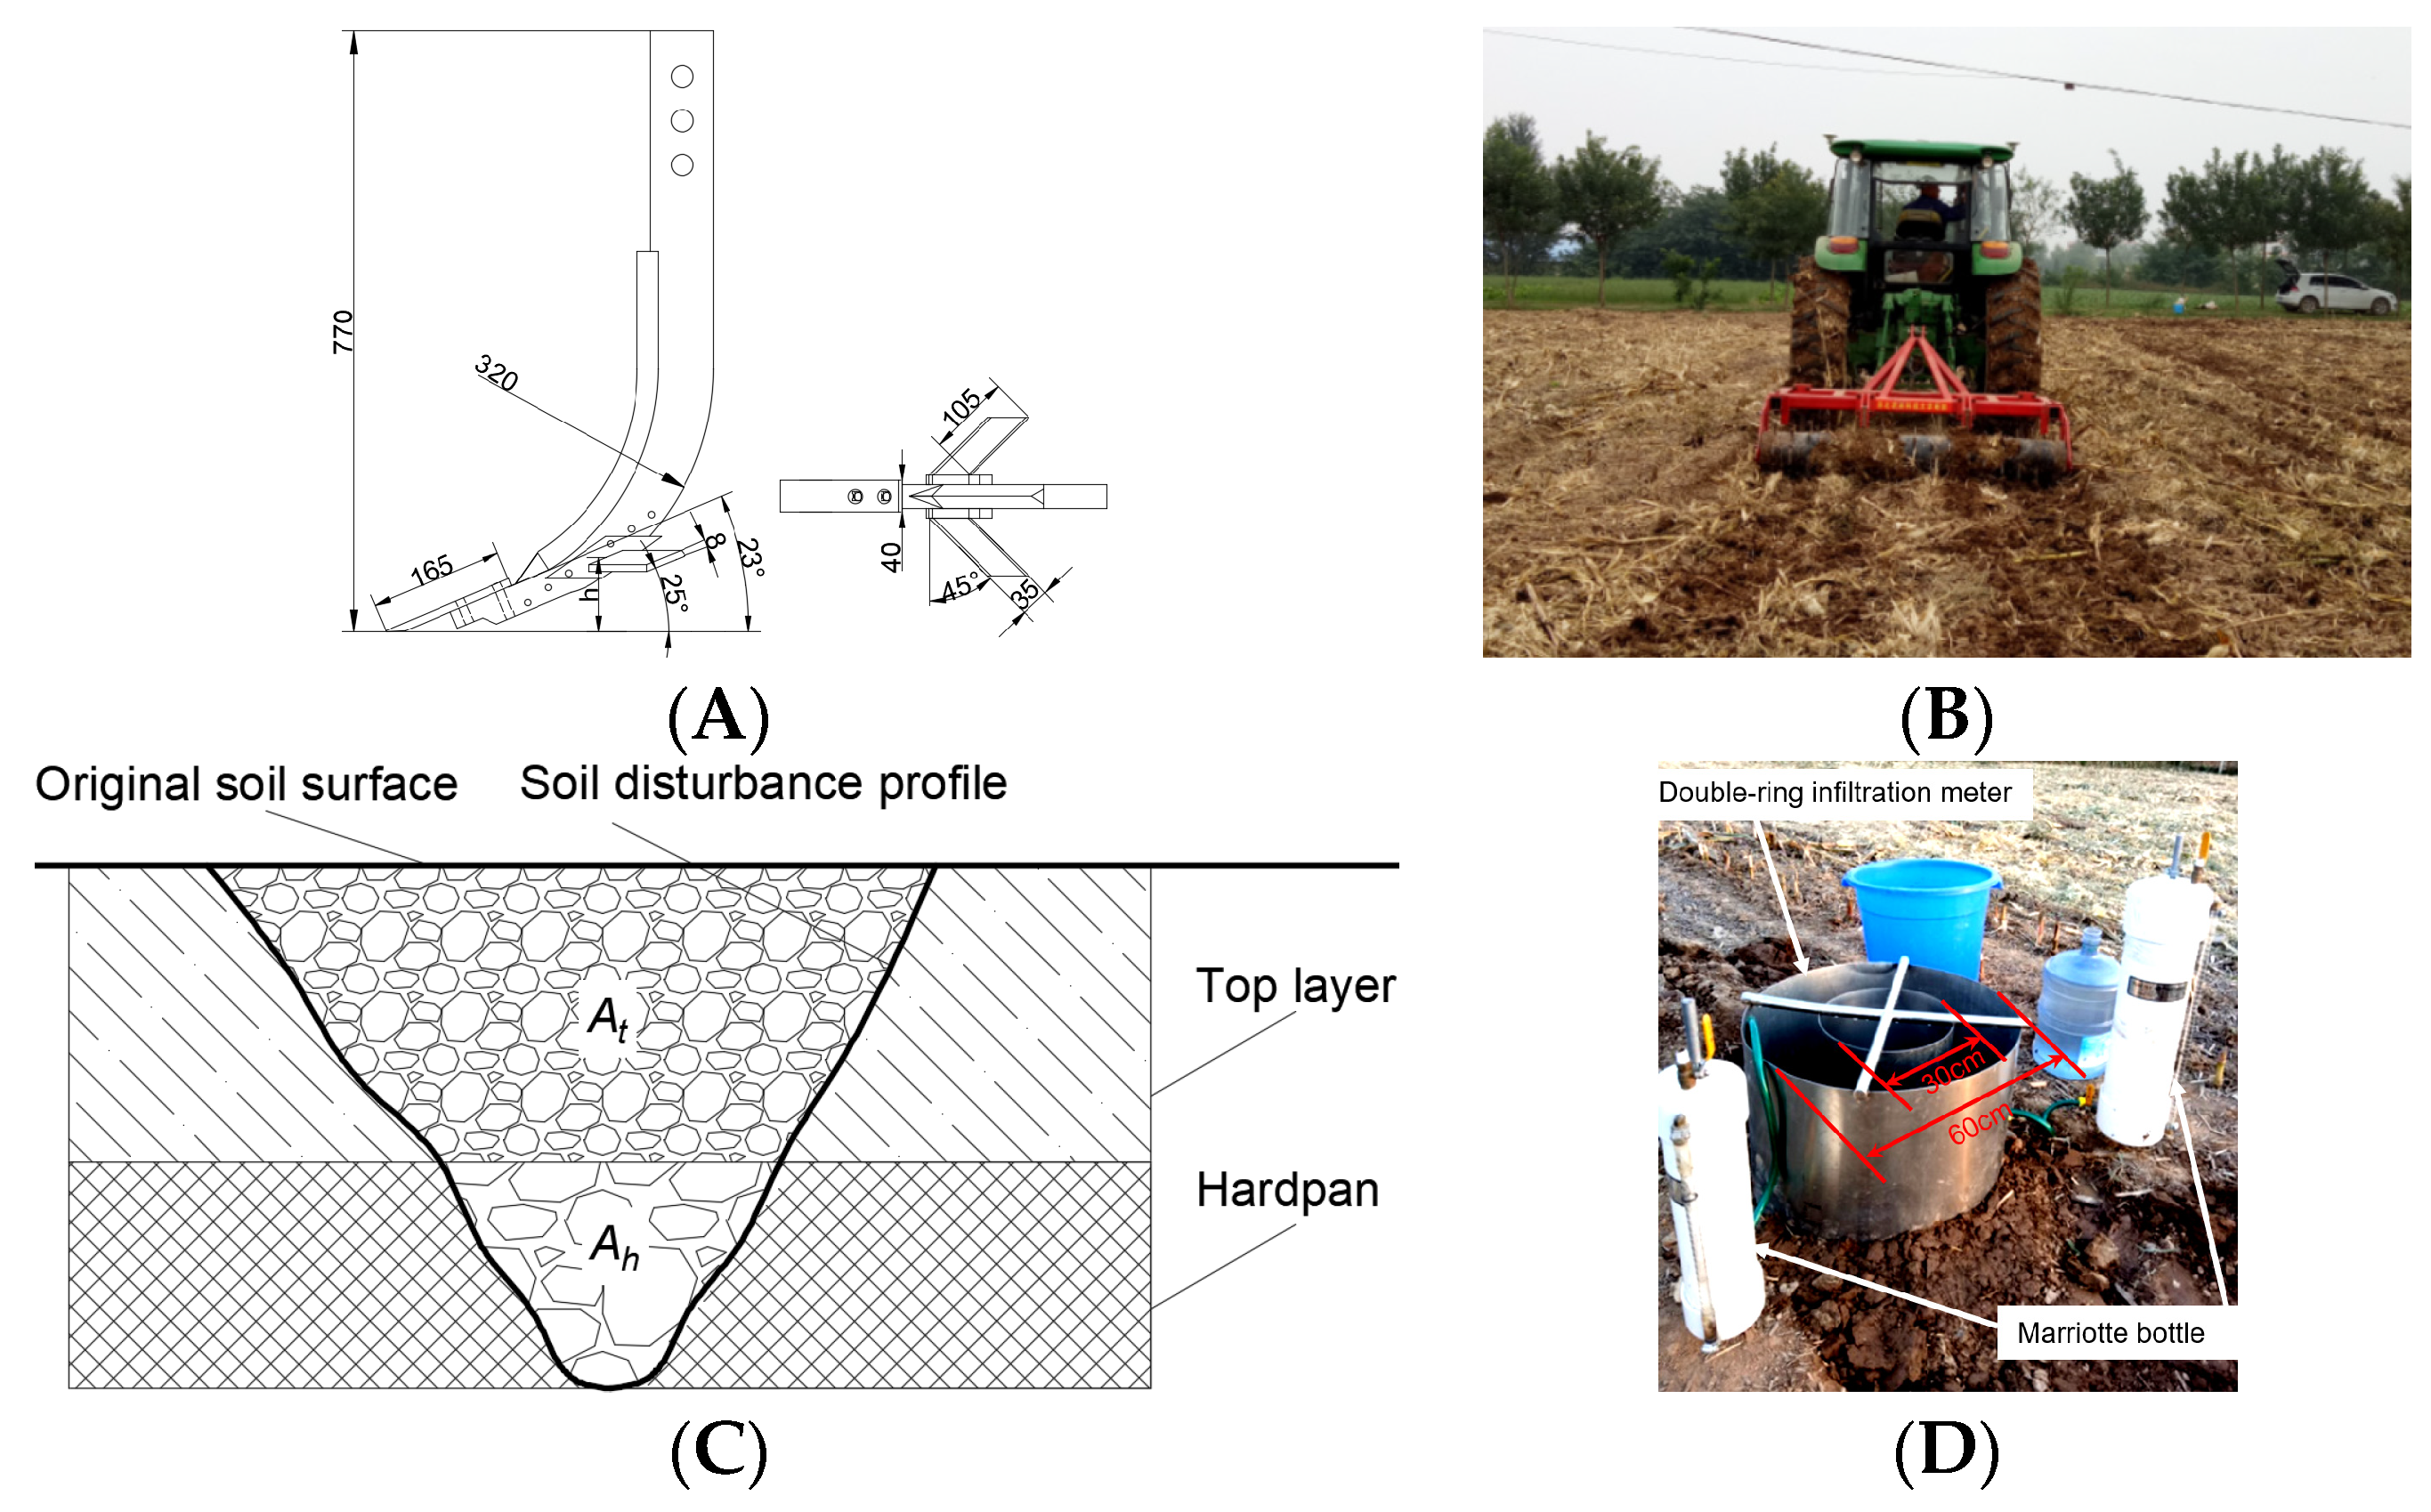
2.2.1. Field Experiment

Subsoiling process was performed in the field using subsoilers with wing mounting heights ranging from 75 to 155 mm and a non-winged subsoiler (Figure 2A,B). The working speed and working depth were determined in accordance with the working parameters during subsoiling in local region which were 3 km h−1 and 30 cm, respectively [14,30]. After subsoiling operations, the profiles of disturbed soil under different subsoiling treatments were determined by a profile meter, which is made up of 150 wooden bars with a width of 1 cm. The bars in the profile meter can freely adjust their vertical positions under their own gravity force. The specific measuring method and operations of soil disturbance profiles can refer to the studies from Hang et al. [14] and Chen et al. [29]. Initially, furrow profiles of the soil were traced on engineering graphic paper (grid spacing: 1 mm); the soil disturbance areas of top layer (0–16 cm from surface) and hardpan (16–30 cm from surface) (Figure 2C) were determined by the grid number in the furrow profile and the area of each grid (1 mm2), respectively. Soil disturbance area ratio (SDAR) was used to evaluate the relative disturbance area between different soil layers and it was calculated as follows.
SDAR = A h A t
where Ah and At stand for disturbance areas of hardpan and top layer, respectively.
Soil water infiltration test was carried out using a double-ring infiltration meter (DIM) (Figure 2D). The specific operations followed these steps: (1) the DIM was placed at the middle of subsoiler path and vertically driven into the soil using a rubber hammer (~10 cm depth); (2) the gap between DIM and the neighbouring soil, created during the hitting process, was filled by soil and the disturbed soil out of the DIM was compacted; (3) the 5 cm high locations from the surface were marked on both inner and outer rings of DIM [23,31,32]; (4) water was quickly injected into the inner and outer rings at the same time, until the water level reached their marked positions; (5) water was continuously injected using a Marriotte bottle for more than 80 min, until the water infiltration rate is basically stable in unit time (i.e., 5 min).
The cutting-ring method was used to collect soil samples before and after subsoiling as well as after water infiltration from seven depths (i.e., 0–10, 10–20, 20–30, 30–40, 40–60, 60–80, 80–100 cm). Soil samples from three locations were weighed wet and oven-dried at 105 °C to a steady weight. The soil bulk density and moisture content (Equation (2)) were determined according to the wet and dry soil weight. The mean of three repetitions was used for both the soil moisture content and bulk density. The soil moisture content at various depths after water infiltration were used for the validation of soil water infiltration model.
Soil   moisture   content = wet   soil   weight     dried   soil   weight dried   soil   weight

2.2.2. FEM Simulations and Validation

Model Development

HYDRUS-2D software (Version: 2.04) was used for developing a soil water infiltration model. The Galerkin method was used to solve the soil disturbance profiles created by various subsoiling treatments as suggested by Fu et al. [33]. The model development consists of initial and boundary conditions, mesh generation, and soil hydraulic characteristic parameters.
  • Initial conditions: The model initial conditions consist of the initial soil moisture content, bulk density, and particle size distribution, which were set as the measured data from above field tests (Table 1).
Table 1. Soil moisture content, density and texture before subsoiling and soil density after subsoiling.
Soil Conditions before SubsoilingSoil Density after Subsoiling (g cm³)
Depth (cm)Moisture Content (%)Density (g cm³)Sand (%)Silt (%)Clay (%)TreatmentDepth (cm)
0–1010–2020–30
0–1024.21.35687.1012.100.80h01.3261.3551.402
10–2021.51.45489.238.052.72h751.3071.2641.214
20–3021.61.48287.9310.032.04h951.3101.2841.254
30–4020.41.49090.408.151.45h1151.3001.3041.346
40–6019.81.51192.067.060.88h1351.3171.2911.399
60–8019.51.49191.327.501.18h1551.3181.2871.391
80–10020.71.53487.0110.452.54    
2.
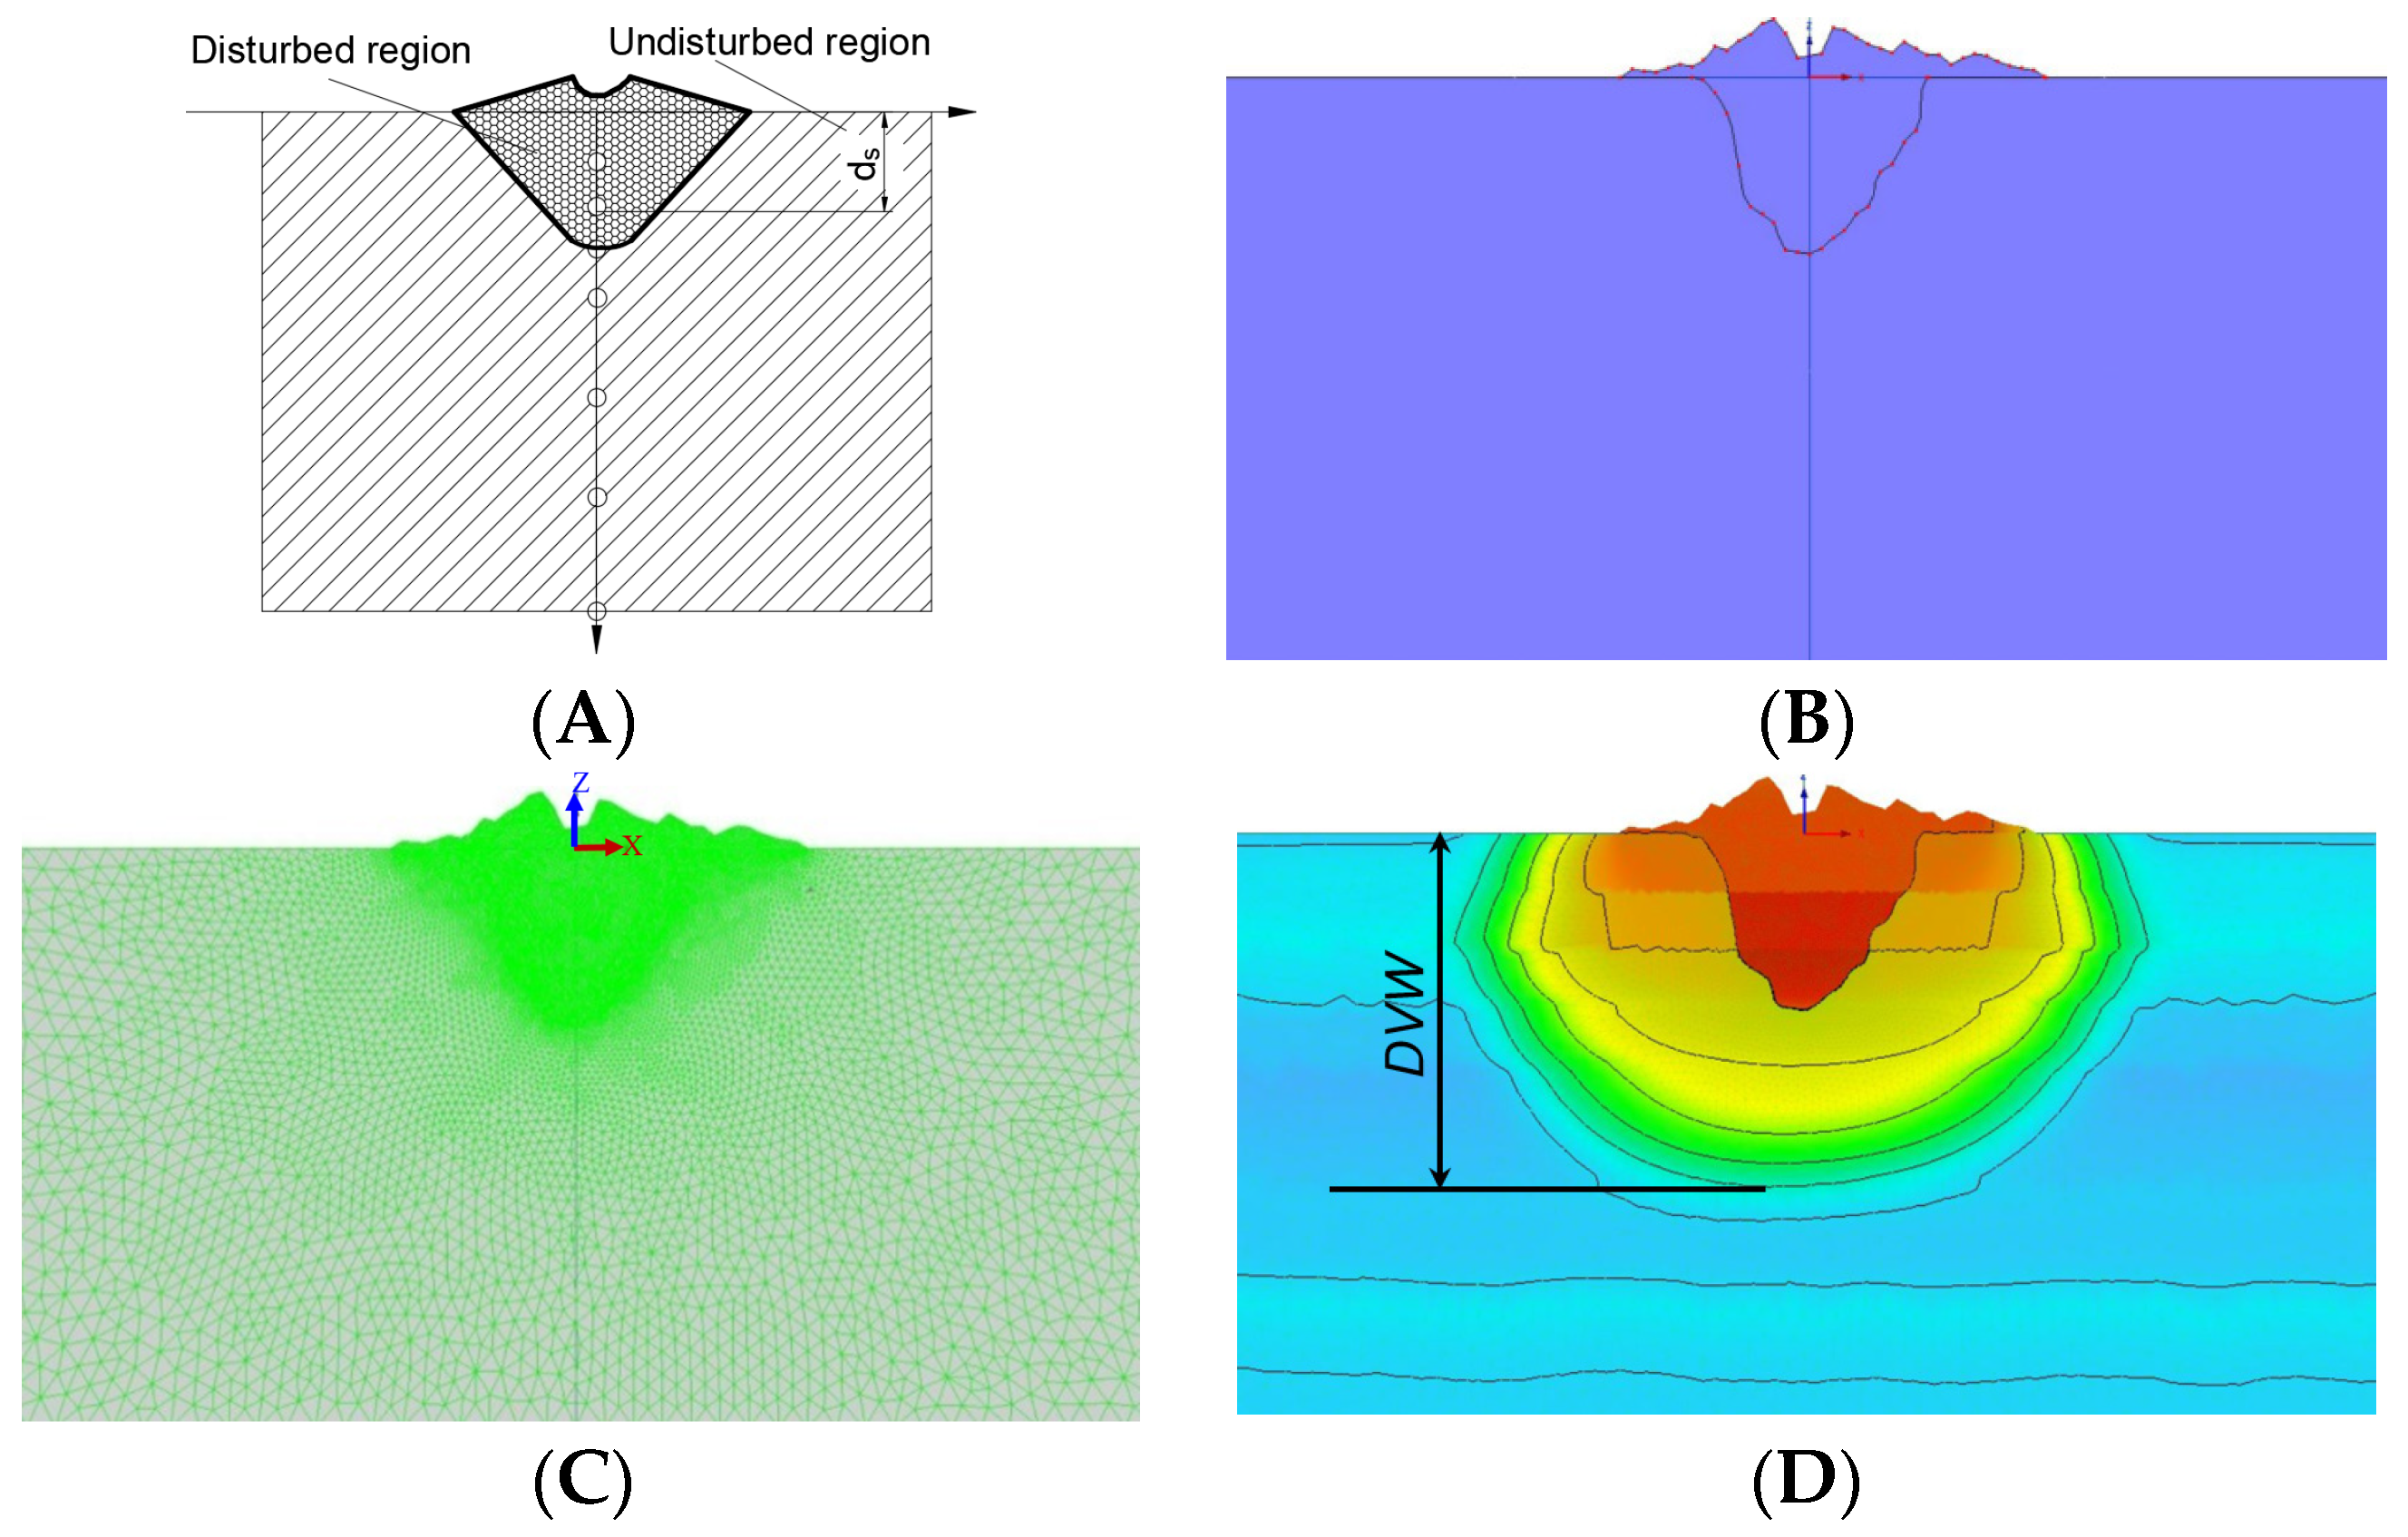
Boundary conditions: A 60 cm wide (i.e., outer diameter of DIM) disturbance area was set as the constant pressure head (5 cm) at the centre of the soil ridge in accordance with the water infiltration test in the field. Atmospheric boundary condition was used for other locations at the soil surface (Figure 3). Both lateral boundaries were considered to be zero flux faces. The bottom boundary was set as a free drainage boundary as the groundwater depth was relatively large (30–50 m) [34] and the groundwater which moved into the test zone was neglected.
3.
Mesh generation: The FE-Mesh module of HYDRUS was used to generate mesh with size of 50 mm (Figure 3C). To improve the accuracy of the model, the triangular mesh size of the disturbed region was appropriately encrypted (i.e., 5 mm). The initial, maximum, and minimum time steps were set as 0.001 min, 10 min, and 0.0001 min, respectively.
4.
Soil hydraulic characteristic parameters: These parameters were determined using the “Rosetta” module of HYDRUS based on the measured soil bulk density and particle sizes at various depths, including residual moisture content, saturated moisture content, reciprocal of air inlet, shape parameter, and saturated hydraulic conductivity.
Figure 3. Simulations of soil water infiltration test: (A) diagram showing the disturbance area; (B) formation of disturbance profile; (C) mesh generation; (D) distance of vertical wetting front movement (DVW).
Agronomy 13 02742 g003

Model Application

The developed model was used to investigate the effect of wing mounting height of subsoiler on soil water infiltration characteristics (i.e., water infiltration rate, accumulative infiltration, distance of vertical wetting front movement) and moisture content of soil at various depths after water infiltration.
Developing appropriate relationships between soil water characteristics and time are conducive to better understanding hydrologic process under various conditions. Current models which describe soil water infiltration rate mainly consist of empirical models, semiempirical models, and the models based on physical significance; moreover, Kostiakov model (Equation (3)), Philip model (Equation (4)) and Horton model (Equation (5)) are the representative models of above three types of models, respectively.
f(t) = ϛtϵ
f(t) = 0.5υt−0.5 + fs
f(t) = fs + ΔfeΓt
where f(t) is water infiltration rate in real time, mm min−1; fs is stable infiltration rate, mm min−1; Δf is the difference between initial and stable infiltration rate, mm min−1; t was infiltration time, min; ϛ and ϵ are empirical constants; υ is water absorption rate, mm min−1; Γ is model parameter.
Based on the soil water infiltration results of HYDRUS, three models were used to compare and evaluate the water infiltration process, and then a water infiltration rate model, suitable for the tested soil conditions, was obtained.

Model Validation

To validate the accuracy of the HYDRUS model, soil moisture contents at various depths from both the model and the field experiment were compared and analysed using root mean square error (RMSE) and coefficient of determination (R2). The RMSE and R2 are generally calculated as follows [33,35,36].
R M S E = 1 n i = 1 n M o i M s i 2
where M(o)i and M(s)i (I = 1…n) stand for simulated and measured soil moisture content, respectively (%).
R 2 = 1 M o i M s i 2 M o i M o 2
where M(o) is the mean of the simulated soil moisture content M(o)i (I = 1…n) (%).

3. Results and Discussion

3.1. Effect of Wing Mounting Height (h) on Soil Disturbance Area Ratio

The soil disturbance area ratios (SDARs) were 0.4463, 0.4271, 0.3694, 0.3572, 0.3488, and 0.3215 for subsoilers with an h of 75, 95, 115, 135, 155 mm, and a non-winged subsoiler, respectively. Increasing h gave smaller SDARs which corresponded to lower quality of hardpan disturbance. In addition, the soil disturbance area ratio from the non-winged subsoiler was smaller than those obtained from the winged subsoilers. For the non-winged subsoiler, the tillage depth/tool width ratio was 7.5 due to the much smaller tool width of 40 mm, and only the soil near the soil surface was disturbed in a crescent manner. This led to much less soil disturbance in the hardpan, which can explain the much smaller values of SDAR for the non-winged subsoiler.

3.2. Effect of Wing Mounting Height on Soil Water Infiltration Rate

As shown in Figure 4A, with the increase in time, soil water infiltration rates in real time (f(t)), at various wing mounting heights (h), initially reduced rapidly and then gradually reduced, and eventually stable infiltration rates (fs) were obtained. The fs varied quadratically with h and the corresponding coefficient of determination (R2) was 0.9869 (Figure 4B). The high value of R2 indicates that the quadratic function can be used to describe the relationships between fs and h. Moreover, decreasing h from 155 to 75 mm gave larger values of soil disturbance area, soil disturbance area ratio, f(t), and fs, which implied that reducing the wing mounting height of a subsoiling tool would improve the water infiltration rate. Additionally, both the f(t) and fs of the non-winged subsoiler (i.e., h0) were much smaller than those of a winged subsoiler with various h values. The above results agreed well with the study from Yao [23] who found that larger soil disturbance areas resulted in higher soil water infiltration rates.
To describe the relationship between f(t) and t (i.e., time), values of f(t) at various subsoiling treatments (h0–h155) were firstly fitted using three typical models (i.e., Kostiakov, Philip, and Horton) based on MATLAB R2014b software. As shown in Table 2, the variation in the range of R2 for fitted equations were 0.815–0.834, 0.947–0.963, and 0.968–0.980, respectively, for the Kostiakov, Philip, and Horton models. The higher values of variation in the range of 0.968–0.980 indicated that the Horton model is more suitable to describe the relationship between f(t) and t under the tested soil conditions.
The stable water infiltration rate (fs), the difference between initial and stable water infiltration rate (Δf), and the model parameter (Γ) in the Horton model were fitted to the h, respectively, as shown in Table 3. The R2 values of the fitted equations were >0.83, indicating a high fitting degree. The fitted equations of h in Table 3 were then substituted into the Horton model, and the relationship among soil water infiltration rate (f(t,h)), wing mounting height (h), and time (t) can be obtained, as shown in Equation (8).
f(t,h) = −0.0002h2 + 0.0264h + 3.2815 +
(0.0103h + 3.7757)e−[0.5947sin(0.009957h + 0.306) + 0.3819sin(0.2085h + 8.976)]t

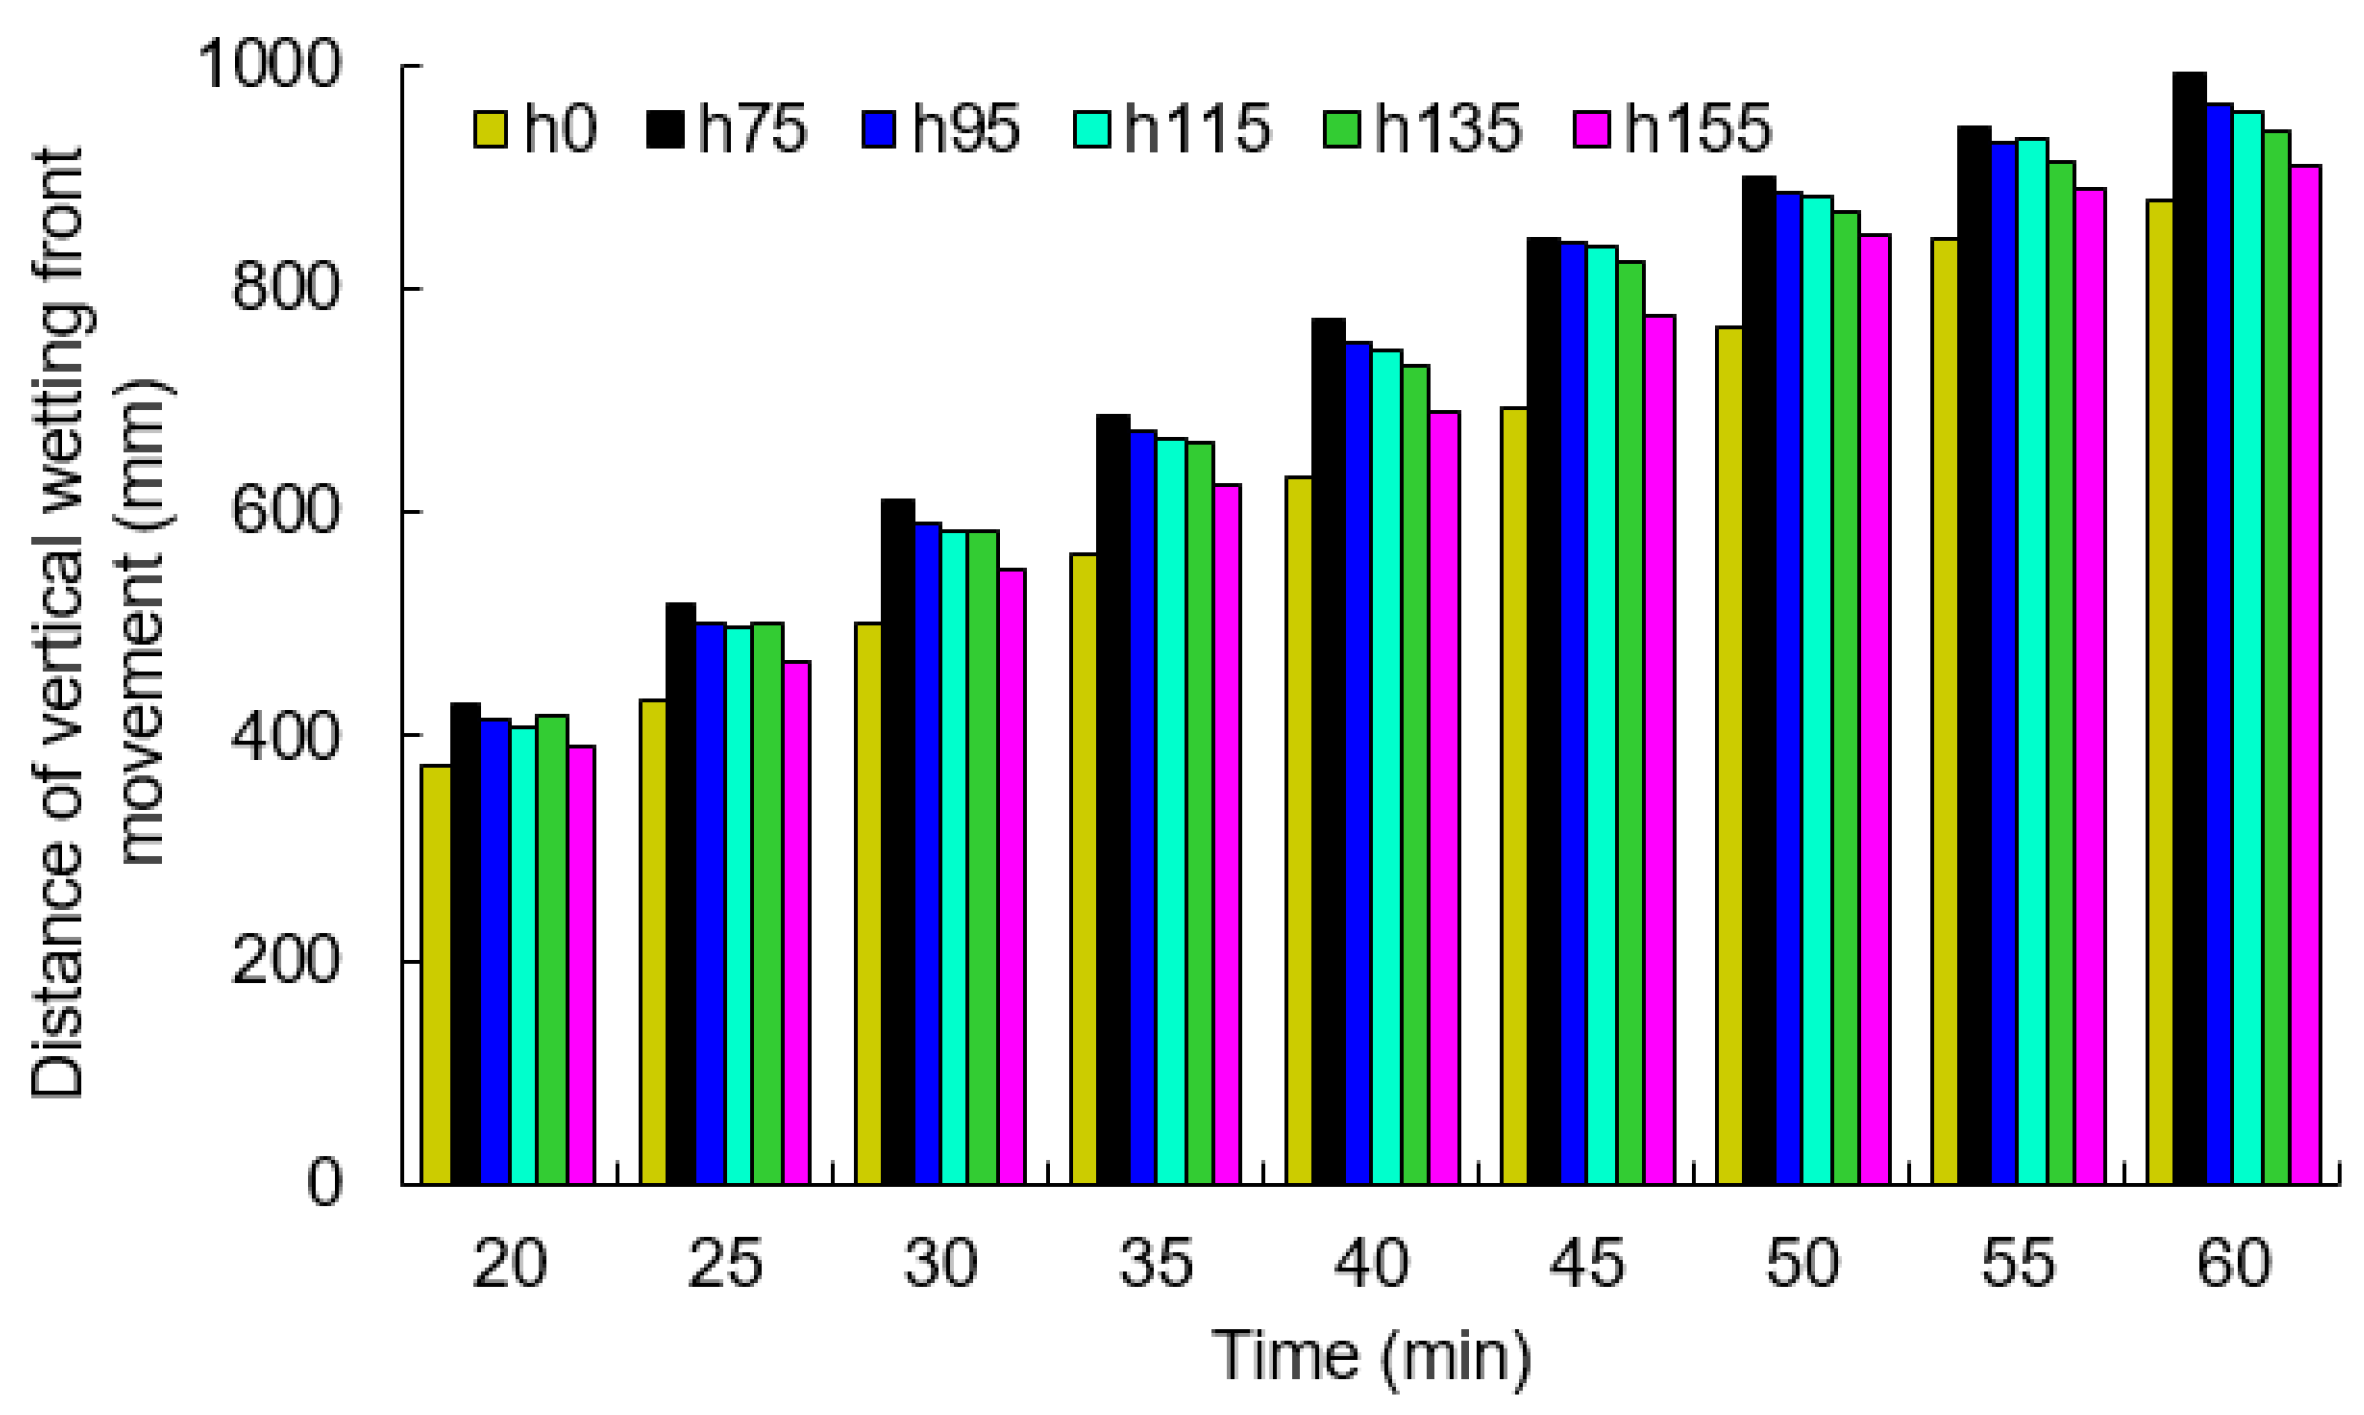
3.3. Effect of Wing Mounting Height on Distance of Vertical Wetting Front Movement

As shown in Figure 5, during the first 20 min of soil water infiltration, the distance of vertical wetting front movement (DVW) showed no obvious variation under different h values. With the further increase in time (≥25 min), the DVW showed a decreasing trend with the increase in h. The DVW corresponding to the subsoiler without wings (h0) was significantly lower than that of other subsoiling treatments.
A study from Yao [23] demonstrated that DVW and time of water infiltration (t) are approximately satisfied as follows.
DVW = b1 + b2t0.5 + b3t
where b1, b2, b3 are all constants.
This function (i.e., Equation (9)) was used to fit the DVW under different h values, and the fitting results under each subsoiling treatment (h) were obtained, as shown in Table 4. The R2 values of the fitting results were all greater than 0.994, indicating that the fitting results are reliable. According to the results in Table 4, h was fitted for b1, b2, and b3, respectively, and the relationships between h and b1, b2, and b3 were established, respectively, as shown in Table 5. Similarly, the R2 values were all greater than 0.995 and the fitting was valid.
By substituting b1(h), b2(h), and b3(h) into the DVW expression, the relationship among DVW, wing mounting height (h), and time (t) can be established as follows.
DVW = (0.0021h2 + 0.4463h + 13.512)t + (−0.0284h2 + 5.8292h − 5.2937)t0.5 +
0.0781h2 − 16.178h + 124.84

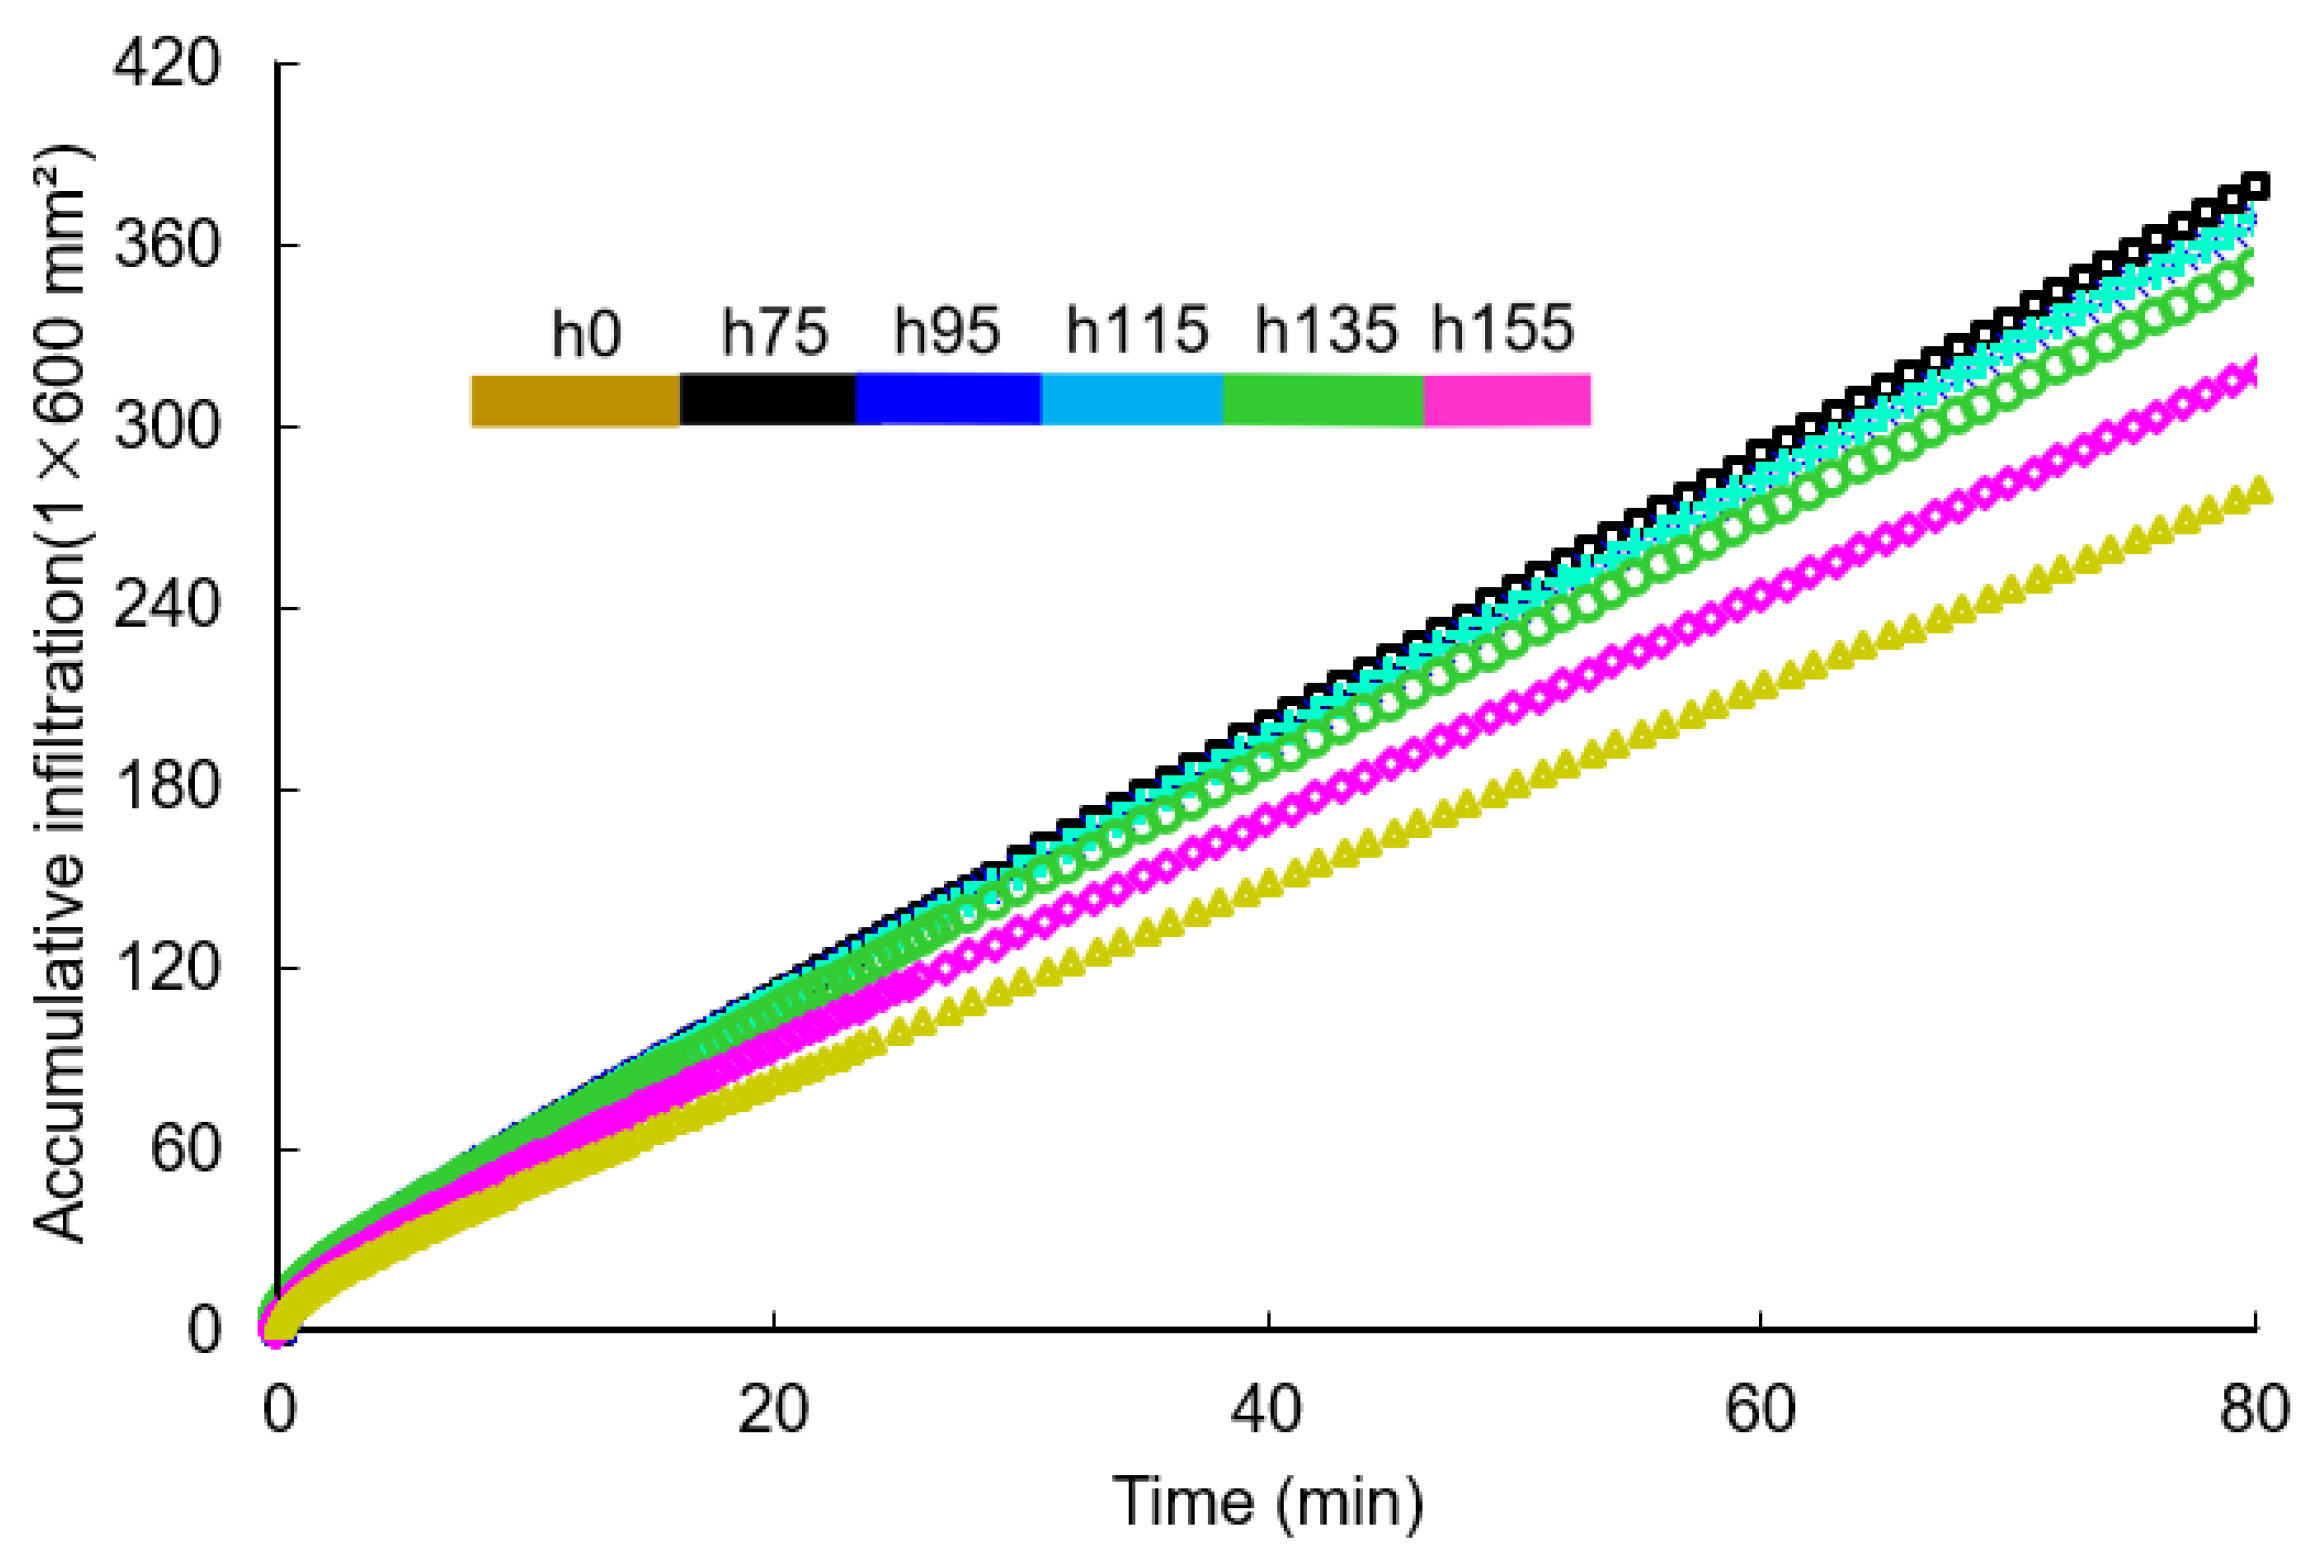
3.4. Effect of Wing Mounting Height on Accumulative Infiltration

As shown in Figure 6, with the increase in time (i.e., t), the values of accumulative infiltration (AIN) gradually increased for all subsoiling treatments. However, the increase rate of AIN was different to some extent, i.e., the increase rate of AIN from h of >135 mm was much smaller than these from smaller h values. The AIN for h of >135 mm and h0 after 60 min was significantly lower than those of other treatments.
The AIN and infiltration time (t) can be approximated using the following function.
AIN = a1t2 + a2t + a3
Table 6 describes the detailed fitting results under different h values with a coefficient of determination (R2) of >0.998. In the same way, h was fitted using the coefficients of t under different subsoiling treatments (R2 values were all greater than 0.97), and then substituted into Equation (10) to obtain the mathematical model between AIN, t, and h (Equation (12)).
AIN = (−0.0002h2 + 0.0453h + 6.1008)t2 + (−0.0002h2 + 0.0308h + 3.9044h)t
+ 3 × 10⁻⁷h2 − 5×10⁻⁵h − 0.0067

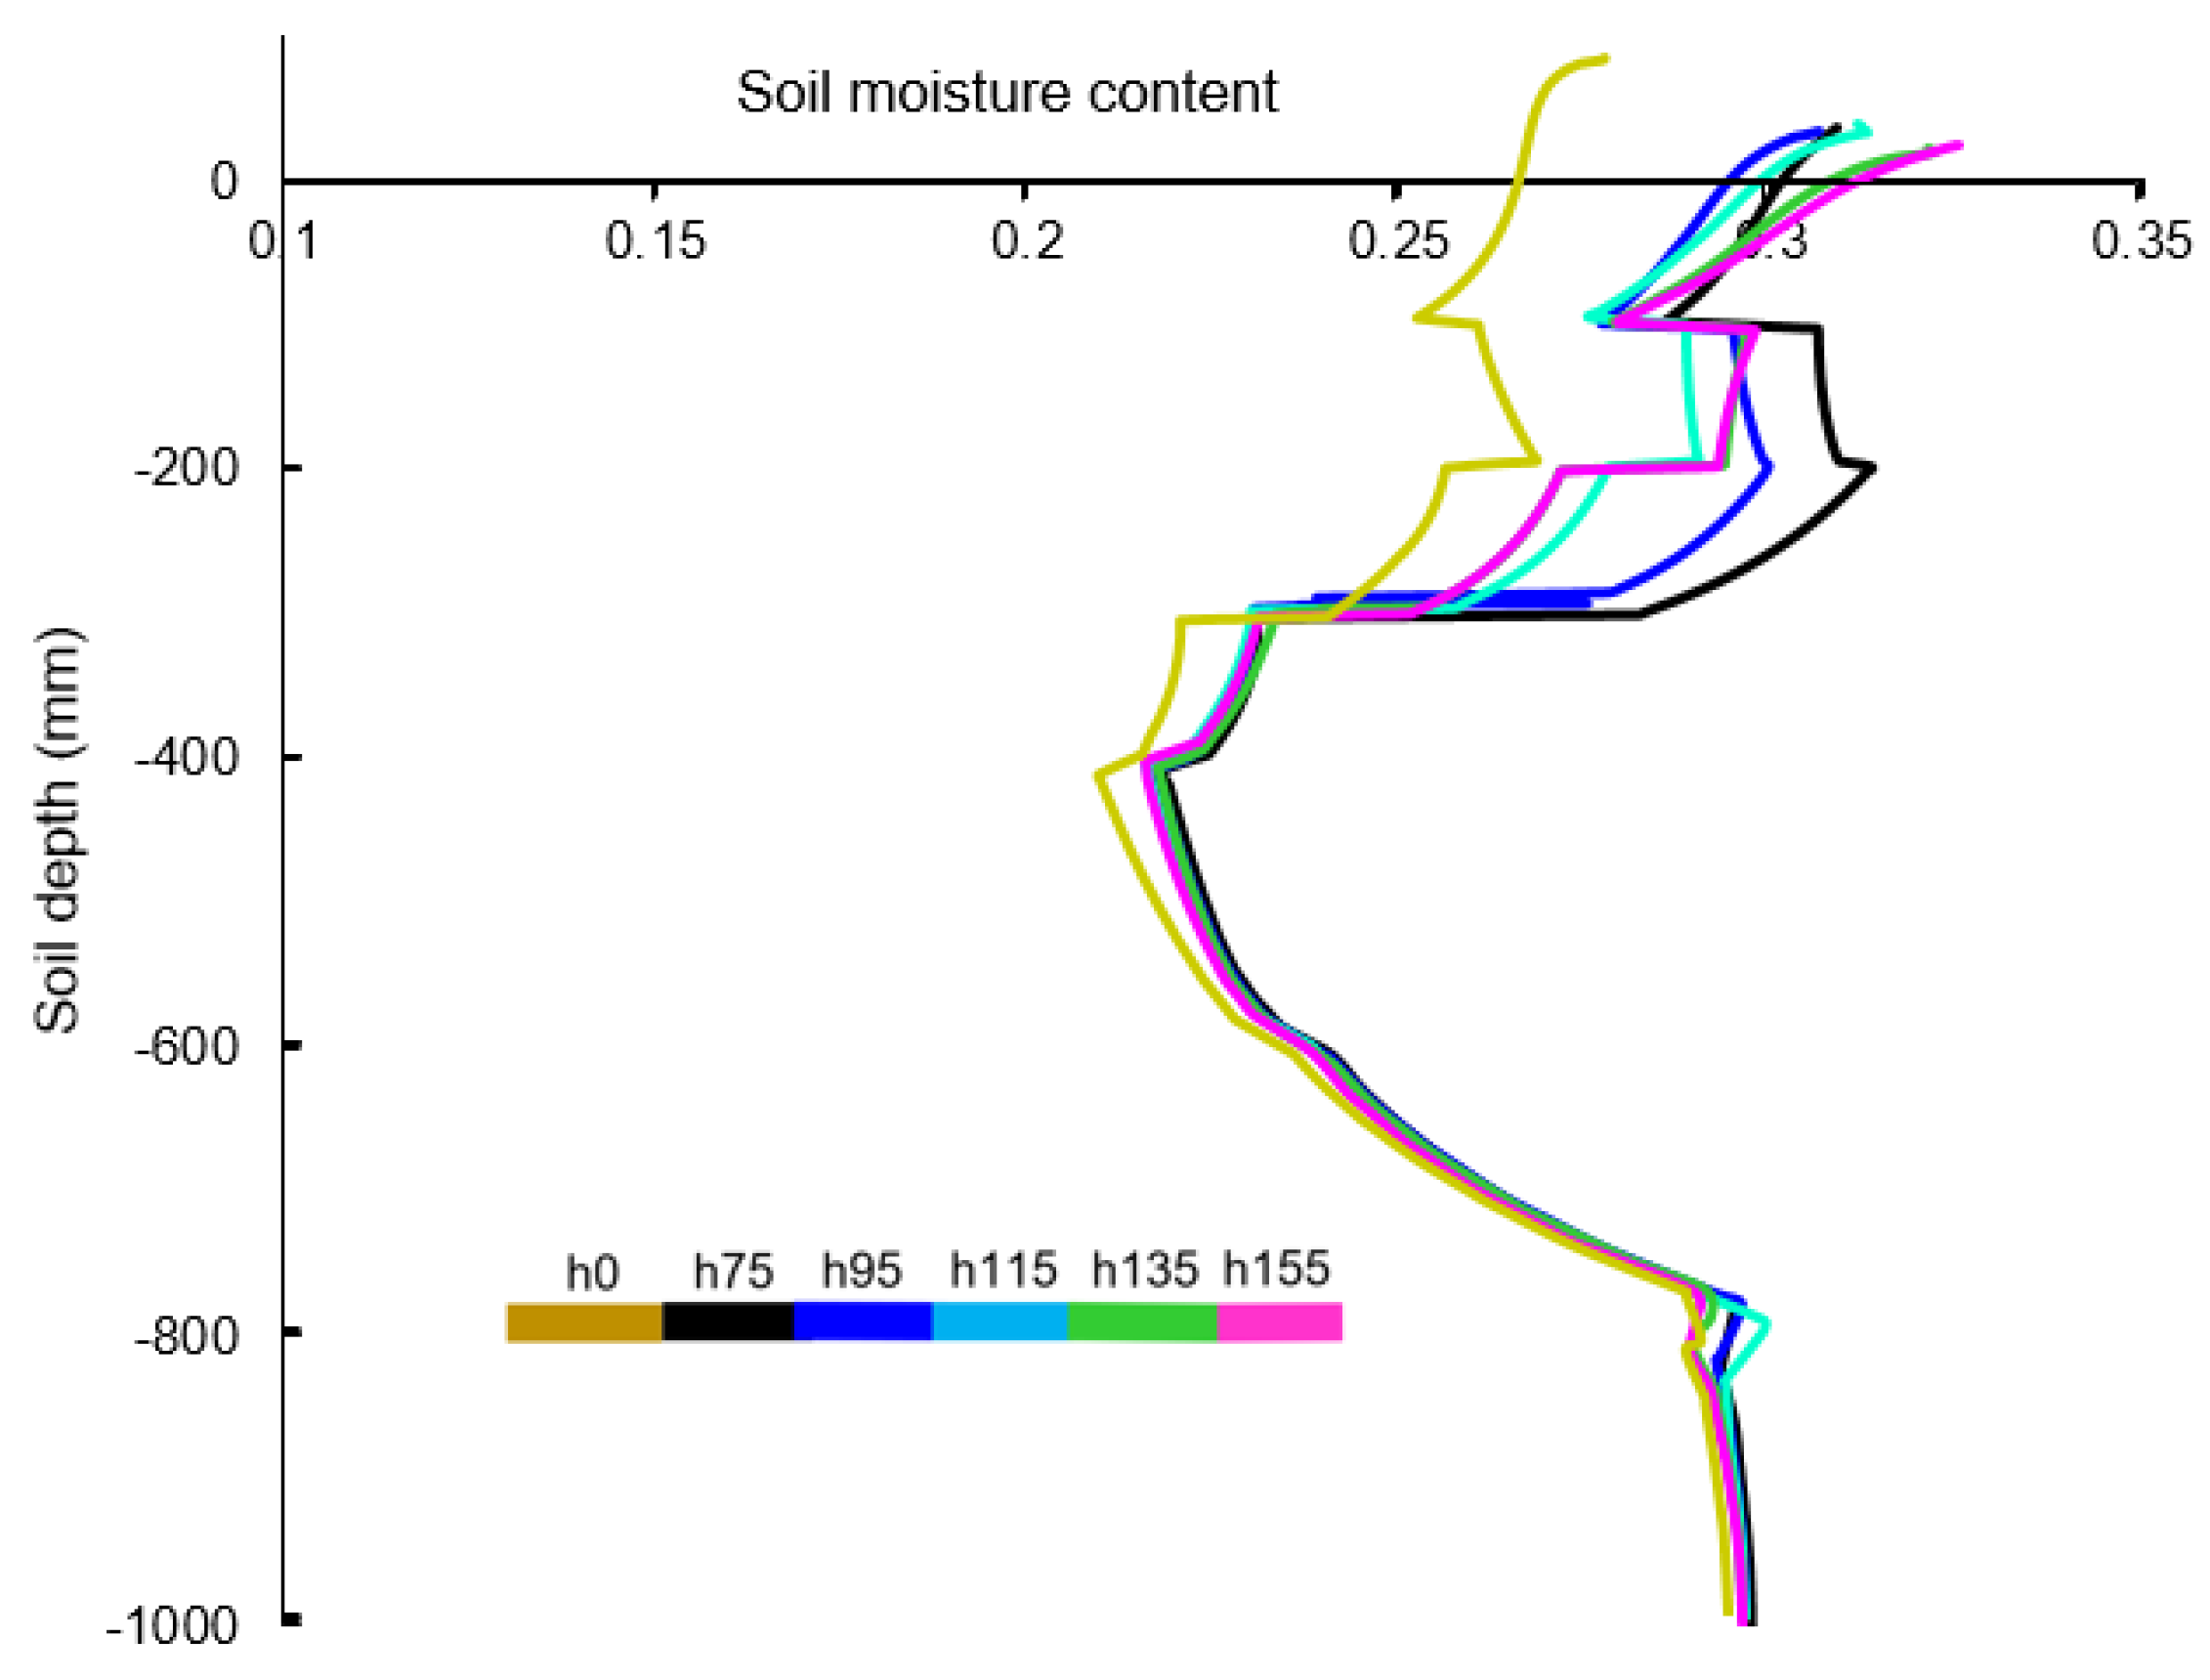
3.5. Effect of Wing Mounting Height on Soil Moisture Content

After the free infiltration of water into the soil for three hours, the difference in soil moisture content in the top 10 cm below the surface and depths of >30 cm under various h values was small (Figure 7). By contrast, the soil moisture content in the depth of 10–30 cm, when h ≤ 95 mm, was significantly higher than those when h > 95 mm. Both the present research and a study from Yao [23] showed that there was a significant positive correlation between soil water infiltration rate and soil disturbance area. The above results are attributed to the fact that a lower wing mounting height can break more hardpan soil and improve the fragmentation degree of hardpan. As a result, the water can seep out more quickly into the hardpan section. The smaller the wing mounting height of the subsoiler, the faster the soil water infiltration, and the larger the distance of vertical wetting front movement (DVW) and accumulative infiltration (AIN).

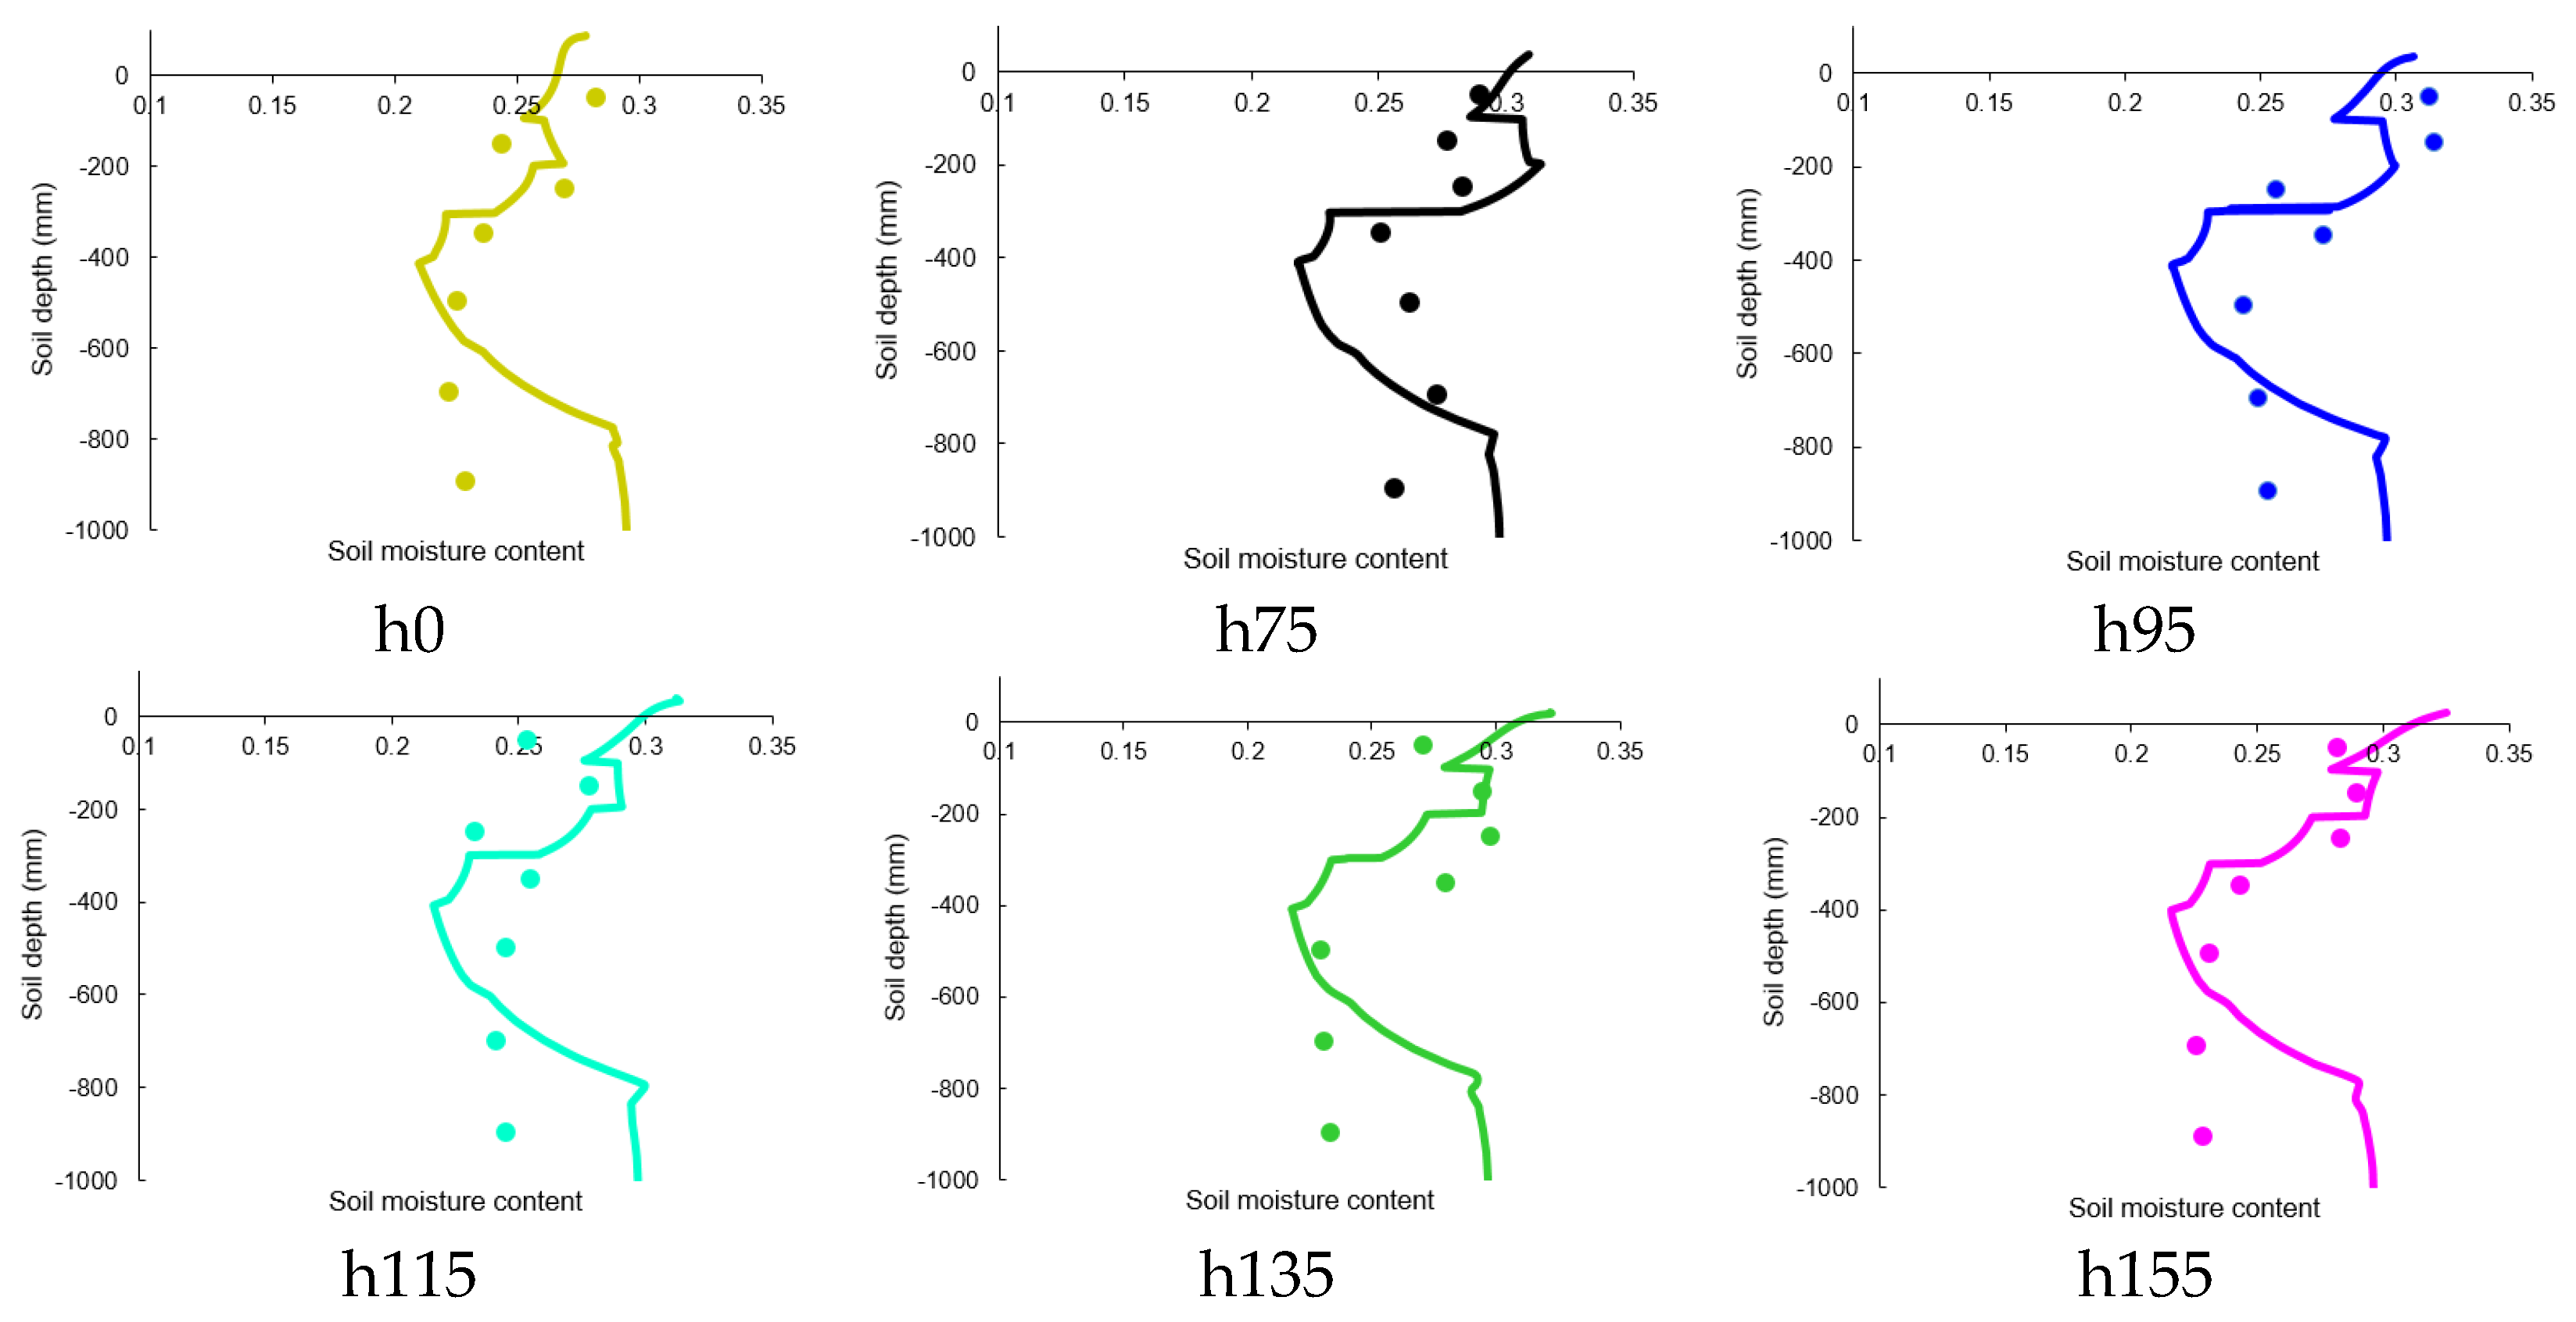
3.6. Model Validation

As shown in Figure 8, the simulated (curves) and measured (scattered points) values of soil water contents at various depths (especially the range above 80 cm) after 3 h of free infiltration of soil water were basically consistent. According to the results for soil water contents at different depths from FEM simulations (curve) and field experiments (scatter), RMSEs were lower than 0.05, R2 values were higher than 0.95, and mean relative errors were less than 12% (Table 7). This indicated that the developed soil water infiltration model had a good accuracy. These errors can be attributed to the following aspects: (1) the soil water infiltration model did not consider the roots and organic matter in the soil; and (2) there are more or less differences in the bulk density and moisture content of soil at different locations at the same depth in the actual field.

4. Conclusions

The effects of the wing mounting height (h) (75–155 mm) of a subsoiler on soil disturbance and soil water infiltration were modelled using HYDRUS-2D and validated using field experiments. The following conclusions were drawn:
  • Reducing h values gave larger soil disturbance area ratios, soil water infiltration rates f(t), distances of vertical wetting front movement (DVW), accumulative infiltration (AIN), and soil moisture content at depths of 10–30 cm.
  • The relationships among characteristics of soil water infiltration, h and time (t), were developed. The stable infiltration rates (fs) varied quadratically with h and the corresponding coefficient of determination (R2) was 0.9869.
  • The Horton model is more suitable to describe the relationship between f(t) and t under the tested soil conditions, as compared with the Kostiakov and Philip models.
  • Overall, reducing the h can improve the accumulative infiltration (AIN) and distance of vertical wetting front movement (DVW) with an increase in time of water infiltration. The relationships among DVW, wing mounting height (h), and time (t), and among AIN, wing mounting height (h) and time (t) were established.
  • According to the results for soil water contents at different depths from FEM simulations and field experiments, RMSEs were lower than 0.05 and R2 values were higher than 0.95, and mean relative errors were less than 12%. The developed soil water infiltration model had a good accuracy.
  • Given the fact that increasing the hardpan disturbance by reducing wing mounting height of the subsoiler could improve soil water infiltration characteristics, it is recommended to appropriately reduce the wing mounting height of the subsoiler before subsoiling. It should be noted that the results obtained in this study are limited to only one soil type (Lou soil) and future studies will be needed to consider more soil types.

Author Contributions

Methodology, X.W.; software, X.W.; validation, X.W.; formal analysis, X.W.; investigation, X.W.; resources, X.W.; data curation, X.W.; writing—original draft preparation, X.W.; writing—review and editing, L.G., H.Z., Y.H. and J.J.; visualization, X.W.; supervision, Y.H. and J.J.; project administration, X.W.; funding acquisition, X.W. All authors have read and agreed to the published version of the manuscript.

Funding

The research was funded by the Natural Science Foundation of Henan Province (grant number: 232300420203), Doctoral Research Fund of Henan University of Science and Technology (grant number: 13480042), Innovation and Entrepreneurship Training Program for University Students (grant number: 202310464020), Key Scientific Research Project of Colleges and Universities of Henan Province and Major Science and Technology Project of Henan Province (grant number: 221100110800) for the financial support of this study.

Institutional Review Board Statement

Not applicable.

Data Availability Statement

The data reported in this study are contained within the article.

Acknowledgments

The authors sincerely thank Shaopeng Yang, Shilin Zhang, Peng Li, Junjie Zhang, Pengyang Gao, and Qingkai Zhang for their assistance in field experiments of this study.

Conflicts of Interest

The authors declare no conflict of interest.

References

  1. Kuang, N.; Tan, D.; Li, H.; Gou, Q.; Li, Q.; Han, H. Effects of subsoiling before winter wheat on water consumption characteristics and yield of summer maize on the North China Plain. J. Agric. Water Manag. 2020, 227, 105786. [Google Scholar] [CrossRef]
  2. Wang, X.Z.; Zhou, H.; Wang, S.S.; Zhou, H.M.; Ji, J.T. Methods for reducing the tillage force of subsoiling tools: A review. Soil Till. Res. 2023, 229, 105676. [Google Scholar] [CrossRef]
  3. Xu, D.; Mermoud, A.J. Topsoil properties as affected by tillage practices in North China. Soil Till. Res. 2001, 60, 11–19. [Google Scholar] [CrossRef]
  4. Chen, Y.; Cavers, C.; Tessier, S.; Monero, F.; Lobb, D. Short-term tillage effects on soil cone index and plant development in a poorly drained, heavy clay soil. Soil Till. Res. 2005, 82, 161–171. [Google Scholar] [CrossRef]
  5. Zeng, Z.; Chen, Y.; Zhang, X. Modelling the interaction of a deep tillage tool with heterogeneous soil. Comput. Electron. Agric. 2017, 143, 130–138. [Google Scholar] [CrossRef]
  6. Spoor, G.; Godwin, R.J. An experimental investigation into the deep loosening of soil by rigid tines. J. Agric. Eng. Res. 1978, 23, 243–258. [Google Scholar] [CrossRef]
  7. Li, B.; Chen, Y.; Chen, J. Comparison of two subsoiler designs using the discrete element method (DEM). Trans. ASABE 2018, 61, 1529–1537. [Google Scholar] [CrossRef]
  8. Wang, X.Z.; Yue, B.; Gao, X.; Zheng, Z.; Zhu, R.; Huang, Y. Discrete element simulations and experiments of disturbance behavior as affected by the mounting height of the subsoiler’s wing. Trans. CSAM 2018, 49, 129–141. [Google Scholar] [CrossRef]
  9. Xia, L. Optimum Parameter and Experimental Study of Shovel Wing Based on Discrete Element Method. Master’s Thesis, Northwest A&F University, Xianyang, China, 2018. [Google Scholar]
  10. Raper, R.L. Force requirements and soil discruption of straight and bendleg subsoilers for conservation tillage systems. Appl. Eng. Agric. 2005, 21, 787–794. [Google Scholar] [CrossRef]
  11. Barr, J.B.; Desbiolles, J.M.A.; Fielke, J.M. Minimising soil disturbance and reaction forces for high speed sowing using bentleg furrow openers. Biosyst. Eng. 2016, 151, 53–64. [Google Scholar] [CrossRef]
  12. Huang, Y.; Hang, C.; Yuan, M.; Wang, B.; Zhu, R. Discrete element simulations and experiments on disturbance behavior of subsoiling. Trans. CSAM 2016, 47, 80–88. [Google Scholar] [CrossRef]
  13. Hang, C.; Huang, Y.; Zhu, R. Analysis of the movement behaviour of soil between subsoilers based on the discrete element method. J. Terramech. 2017, 74, 35–43. [Google Scholar] [CrossRef]
  14. Hang, C.; Gao, X.; Yuan, M.; Huang, Y.; Zhu, R. Discrete element simulations and experiments of soil disturbance as affected by the tine spacing of subsoiler. Biosyst. Eng. 2018, 163, 73–82. [Google Scholar] [CrossRef]
  15. Argyrokastritis, I.; Psychogiou, M.; Londra, P.A. Infiltration under ponded conditions. Water 2021, 13, 3492. [Google Scholar] [CrossRef]
  16. Ommi, S.H.; Sciarra, G.; Kotronis, P. A phase field model for partially saturated geomaterials describing fluid–fluid displacements. Part I: The model and one-dimensional analysis. Adv. Water Resour. 2022, 164, 104170. [Google Scholar] [CrossRef]
  17. Qiao, Z.R.; Wu, L.F.; Yang, Z.Z. Prediction of water consumption in 31 provinces of China based on FGM(1,1) model. Clean Soil Air Water 2022, 50, 2200052. [Google Scholar] [CrossRef]
  18. Yang, P.; Cheng, M.H.; Wu, L.F.; Fan, J.L.; Li, S.; Wang, H.D.; Qian, L. Review on drip irrigation: Impact on crop yield, quality, and water productivity in China. Water 2023, 15, 1733. [Google Scholar] [CrossRef]
  19. Ma, Y.; Feng, S.; Su, D.Y.; Gao, G.Y.; Huo, Z.L. Modeling water infiltration in a large layered soil column with a modified Green–Ampt model and HYDRUS-1D. Comput. Electron. Agric. 2010, 71 (Suppl. S1), S40–S47. [Google Scholar] [CrossRef]
  20. Mishra, S.K.; Kumar, S.R.; Singh, V.P. Calibration and validation of a general infiltration model. Hydrol. Process. 1999, 13, 1691–1718. [Google Scholar] [CrossRef]
  21. Arampatzis, G.; Tzimopoulos, C.; Sakellariou-Makrantonaki, M.; Yannopoulos, S. Estimation of unsaturated flow in layered soils with the finite control volume method. Irrig. Drain. 2001, 50, 349–358. [Google Scholar] [CrossRef]
  22. Ebrahimian, H.; Liaghat, A.; Parsinejad, M.; Abbasi, F.; Navabian, M. Comparison of one- and two-dimensional models to simulate alternate and conventional furrow fertigation. J. Irrig. Drain. Eng. 2012, 138, 929–938. [Google Scholar] [CrossRef]
  23. Yao, Y.X. Numerical Simulation and Experimental Study of Soil Water Infiltration in Subsoil Tillage. Master’s Thesis, Northwest A&F University, Xianyang, China, 2019. [Google Scholar]
  24. Karandish, F.; Simunek, J. A comparison of the HYDRUS (2D/3D) and SALTMED models to investigate the influence of various water-saving irrigation strategies on the maize water footprint. Agric. Water Manag. 2019, 213, 809–820. [Google Scholar] [CrossRef]
  25. Chen, Y.; Tessier, S. Techniques to diagnose plow and disk pans. Can. J. Agric. Eng. 1997, 39, 143–147. [Google Scholar]
  26. Atwell, B.J. Response of roots to mechanical impedance. Environ. Exp. Bot. 1993, 33, 27–40. [Google Scholar] [CrossRef]
  27. Letey, J. Relationship between soil physical properties and crop production. Adv. Soil Sci. 1995, 1, 227–294. [Google Scholar] [CrossRef]
  28. Francis, G.S.; Cameron, K.C.; Swift, R.S. Soil physical conditions after six years of direct drilling or conventional cultivation on silt loam soil in New Zealand. J. Soil Res. 1987, 25, 517–520. [Google Scholar] [CrossRef]
  29. Chen, Y.; Munkholm, L.J.; Nyord, T. A discrete element model for soil-sweep interaction in three different soils. Soil Till. Res. 2013, 126, 34–41. [Google Scholar] [CrossRef]
  30. Wang, X.Z.; Fu, Z.L.; Zhang, Q.K.; Huang, Y.X. Short-term subsoiling effects with different wing mounting heights before winter wheat on soil properties and wheat growth in Northwest China. Soil Till. Res. 2021, 213, 105151. [Google Scholar] [CrossRef]
  31. Liu, H.H.; Wang, G.L.; Yin, H.S. Characteristics of soil water infiltration under different vegetation cover in jujube economic forest. J. Irrig. Drain. 2020, 39, 54–60. [Google Scholar] [CrossRef]
  32. Ren, Z.P.; Zhang, H.H.; Wang, B. Effect of double ring diameter on soil infiltration rate. J. Soil. Water Conserv. 2012, 26, 94–97. [Google Scholar]
  33. Fu, Q.; Li, Y.; Li, T.X.; Cui, S.; Liu, D.D. HYDRUS simulation verification and influencing factors analysis of channel leakage. Trans. CSAE 2017, 33, 112–118. [Google Scholar] [CrossRef]
  34. Zhu, X.M. Soil and Agriculture on the Loess Plateau; Agriculture Press: Beijing, China, 1989. [Google Scholar]
  35. Zhang, J.; Wei, Z.M.; Zhang, J.D.; Su, R.N. Channel leakage simulation and analysis of influencing factors based on HYDRUS model. J. Water Soil. Conserv. 2020, 34, 141–148. [Google Scholar]
  36. Zhang, Y.Y. Simulation of Soil Water Infiltration for Ridge Irrigation. Ph.D. Thesis, Graduate School of Chinese Academy of Sciences (Research Center of Soil and Water Conservation and Ecological Environment, Ministry of Education), Xianyang, China, 2013. [Google Scholar]
Figure 1. The (A) soil cone index measurement and (B) soil cone index at various depths in the tested field.
Agronomy 13 02742 g001
Figure 2. The (A) winged subsoiler structure, (B) field subsoiling operations, (C) soil disturbance areas of top layer (At) and hardpan (Ah), and (D) field double-ring water-infiltration test. (h represents the wing mounting height of the subsoiler).
Agronomy 13 02742 g002
Figure 4. Effect of wing mounting height of subsoiler (h) on soil water infiltration rate in real time (A) and stable infiltration rate (B).
Agronomy 13 02742 g004
Figure 5. Effect of the mounting height of subsoiler’s wing (h) on distance of vertical wetting front movement (DVW).
Agronomy 13 02742 g005
Figure 6. Effect of the mounting height of subsoiler’s wing (h) on accumulative infiltration (AIN).
Agronomy 13 02742 g006
Figure 7. Effect of the mounting height of subsoiler’s wing (h) on soil moisture distribution.
Agronomy 13 02742 g007
Figure 8. Comparisons between simulated (curves) and experimental (scattered points) soil moisture contents.
Agronomy 13 02742 g008
Table 2. Results of fitting of soil water infiltration rate with time under different conditions.
TreatmentKostiakovPhilipHorton
ϛϵR2υ/
(mm/min)
fs/
(mm/min)
R2fs/
(mm/min)
Δf/
(mm/min)
ΓR2
h05.1380.1230.8346.3562.7250.9623.2773.7390.3450.979
h756.7230.1160.8317.8243.750.9634.4704.3310.3260.968
h956.7930.1290.8248.5423.5240.9554.3285.2000.3800.972
h1156.6600.1230.8278.0663.5660.9594.3144.8080.3660.972
h1356.6460.1350.8348.6063.3110.9584.1115.2670.3830.980
h1556.0350.1380.8158.1302.9360.9473.7085.2200.4070.980
Table 3. Fitting results of Horton model parameters.
Fitted EquationsR2
fs(h) = −0.0002h2 + 0.0264h + 3.28150.987
Δf(h) = 0.0103h + 3.77570.839
Γ(h) = 0.5947sin(0.009957h + 0.306) + 0.3819sin(0.2085h + 8.976)1.000
Table 4. Fitting parameters of DVW with time (t).
Treatmentb1b2b3R2
h0121.37−4.3513.421.000
h75−629.50268.57−7.530.998
h95−702.22288.45−9.220.996
h115−744.81299.94−10.060.995
h135−618.04264.51−7.890.995
h155−502.89213.77−3.700.994
Table 5. Coefficients of variation in the fitted equations of DVW with h.
Fitted EquationsR2
b1(h) = 0.0781h2 − 16.178h + 124.840.995
b2(h) = −0.0284h2 + 5.8292h − 5.29370.998
b3(h) = 0.0021h2 − 0.4463h + 13.5120.999
Table 6. Fitting equations of accumulative infiltration (AIN) with time (t).
TreatmentFitted EquationsR2
h0AIN = −0.0067t2 + 3.9004t + 6.08510.999
h75AIN = −0.0091t2 + 5.2844t + 8.39450.999
h95AIN = −0.0093t2 + 5.1688t + 8.72560.998
h115AIN = −0.0089t2 + 5.1218t + 8.3660.999
h135AIN = −0.0087t2 + 4.9069t + 8.56970.998
h155AIN = −0.0081t2 + 4.4461t + 8.29530.998
Table 7. Root mean square error (RMSE), determination coefficient (R2) and mean relative error.
Itemh0h75h95h115h135h155
RMSE0.0320.0260.0310.0320.0360.031
R20.9480.9820.9700.9640.9560.968
Mean relative error (%)11.038.1910.5811.8711.389.9
Disclaimer/Publisher’s Note: The statements, opinions and data contained in all publications are solely those of the individual author(s) and contributor(s) and not of MDPI and/or the editor(s). MDPI and/or the editor(s) disclaim responsibility for any injury to people or property resulting from any ideas, methods, instructions or products referred to in the content.

