Article

Estimation of Genetic Parameters and Identification of Leaf Blast-Resistant Rice RILs Using Cluster Analysis and MGIDI

1
Department of Agronomy and Plant Breeding, Faculty of Agricultural Sciences, University of Guilan, Rasht 41996-13776, Iran
2
Department of Plant Protection, Faculty of Agricultural Sciences, University of Guilan, Rasht 41996-13776, Iran
3
Crop and Horticultural Science Research Department, Zanjan Agricultural Resources Research and Education Center, Agricultural Research, Education and Extension Organization (AREEO), Zanjan 31359-33151, Iran
*
Author to whom correspondence should be addressed.
Agronomy 2023, 13(11), 2730; https://doi.org/10.3390/agronomy13112730
Submission received: 23 September 2023 / Revised: 27 October 2023 / Accepted: 28 October 2023 / Published: 29 October 2023
(This article belongs to the Special Issue Crop Tolerance under Biotic and Abiotic Stresses—Volume II)

Abstract

:
Rice blast disease, caused by the fungus Magnaporthe oryzae, poses a significant threat to rice cultivation. One effective way to deal with this disease is to identify and introduce resistant varieties using different breeding methods. This study utilized a population of 153 recombinant inbred lines (RILs) derived from the crossing of the Shahpasand (SH) and IR28 varieties, characterized by susceptibility and resistance to leaf blast, respectively. In combination with 12 control varieties, these genotypes were subjected to an extensive evaluation of disease severity (5 stages), the area under the disease progress curve (AUDPC), type, and the infection rate in 2021 and 2022. Analysis of variance revealed significant genetic variation, highlighting the potential of the RIL population for identifying and selecting resistant lines. Employing cluster analysis and the multi-trait genotype-ideotype distance index (MGIDI), 17 lines were identified as the most resistant over a two-year evaluation period. The average AUDPC for these resistant lines was estimated at 2.435 ± 0.114, and lines 17 and 111 had the lowest AUDPC (1.526 and 1.630, respectively) and showed the least infection in two years. Conversely, lines 42 and 43 showed the highest AUDPC values (255.312 and 248.209) along with heightened sensitivity. The use of MGIDI yielded a substantial selection differential (SD) of −59.12% for traits related to leaf blast disease resistance, demonstrating the effectiveness of this method. Furthermore, new recombinant populations are expected to be developed in future plant breeding projects by crossing the most susceptible and resistant lines, which will be new sources of resistance to this disease.

1. Introduction

Rice (Oryza sativa L.) is one of the three largest grains in the world, providing nourishment for over half of the global population [1]. It is cultivated in 114 countries, with annual production exceeding 100,000 tons in more than 50 countries [2]. In Iran, rice cultivation has been an integral part of the Iranian people’s diet and a vital pillar of the agricultural economy, particularly in the northern provinces. It is the second most extensively grown crop in terms of land area, following wheat, with a cultivated area of approximately 622,000 hectares in 2018–2019. Over 70% of this area is concentrated in the provinces of Guilan and Mazandaran [3].
Rice growth, development, and yield are continually confronted with diverse biotic and abiotic stresses. Abiotic stresses encompass drought, salinity, and nutrient deficiencies, whereas biotic stresses manifest as insect infestations and viral, bacterial, and fungal diseases, posing challenges to rice production [4]. Rice breeding programs primarily focus on understanding plant responses to both biotic and abiotic stresses and achieving high yields [5]. Among these, diseases and pests are crucial limiting factors that impact rice production. More than 70 diseases caused by fungi, bacteria, viruses, or nematodes have been reported in rice [6]. Diseases resulting from living pathogens are contagious and can spread from infected plants to healthy ones, with fungal diseases being the most significant. Fungi exhibit a wide range of variations in terms of their form, mode of action, life cycle, and history [7].
Rice blast, sheath blight (SHB), and bacterial leaf blight (BLB) are major diseases reported in rice. Blast, recognized as the primary devastating disease [8], is caused by the fungus Magnaporthe oryzae B.C. Couch, formerly known as Magnaporthe grisea or Pyricularia grisea [9]. It is currently widespread in over 85 countries [4]. The fungus Pyricularia oryzae can cause damage to rice leaves and panicles, resulting in detrimental effects on both the vegetative and reproductive stages of the plant [10]. This can lead to an annual yield reduction of up to 30% [8]. Also, if favorable conditions for the fungus exist, such as cultivar susceptibility, high infection severity, fungicide usage timings, high humidity, drought, intense dew, high average temperature, high plant density, and excessive nitrogen fertilizer [11], the damage can escalate to 100% [8]. While the precise level of damage caused by blast disease in Iran is not known, it is substantial enough that every year, farmers only in Iran use tens of tons of fungicides, including tricyclazole, edifenphos, and carpropamid, for chemical management against the disease [12]. Leaf blast disease usually reaches its peak intensity around the maximum tillering stage and gradually diminishes thereafter, which is attributed to the resistance of adult plants. Leaf blasts primarily occur before flowering. This period is characterized by the formation of a source and a reservoir, while grain filling takes place after flowering. Thus, leaf blast indirectly causes a reduction in grain yield by affecting the source and a reservoir [13].
Although the utilization of fungicides and the adoption of resistant varieties are crucial strategies in managing rice blast disease due to the adverse environmental effects and application difficulties associated with fungicides, the identification and introduction of resistant varieties by breeders can be an effective approach to decreasing pesticide usage and minimizing rice losses resulting from this disease [6,14]. Numerous research studies have been conducted to assess the resistance of various rice genotypes against blast disease. These studies have successfully identified and introduced resistant genotypes [15,16,17,18,19]. Among the populations providing a suitable genetic background for selecting resistant genotypes, Recombinant Inbred Lines (RILs) stand out. The RIL population is created through the initial cross between two parents, followed by multiple generations of self-pollination. This crossing mechanism enables the exchange of genes between the parents, leading to a wide spectrum of diverse progeny in subsequent generations. From a breeding perspective, this diversity creates an opportunity for selection, enabling the choice of individuals who possess the best characteristics from both parents after purification. When forming RIL populations, selecting parents with noticeable genetic differences in the desired trait will result in increased effectiveness in selecting superior lines. It is even possible to identify offspring that surpass their parents [20,21].
Accordingly, a population of RILs was generated by crossing the IR28 and Shahpasand (SH) varieties. In the current study, a two-year evaluation of RILs (F11) was conducted under blast disease conditions to identify resistant RILs by cluster analysis and the MGIDI method.

2. Materials and Methods

2.1. Plant Materials

The plant materials of the current study include 153 RILs of the F11 generation, derived from crossing IR28 and SH, along with 12 control varieties, including parental varieties (SH and IR28), four aerobic rice genotypes (15A, 18A, 19A, and 26A), and the varieties Nona Bokra, Hashemi, Domsiah, Dorfak, Neda, and Sadri. The information on plant materials is presented in Table 1. Parental varieties IR28 and SH are blast-resistant and susceptible varieties, respectively [18].

2.2. Experimental Design

This study was carried out in the research field of the Faculty of Agricultural Sciences, University of Guilan, Iran, during the 2021 and 2022 rice growth seasons. The experiment was conducted as a randomized complete block design with three replications in both years. The meteorological data for the two growing seasons of 2021 and 2022 in Rasht are provided in Table 2. The genotype seeds were sown in a nursery in late spring, corresponding to the period of leaf blast occurrence in this study region. Four days before seed sowing, approximately 50 kg·ha−1 pure nitrogen from a urea source and 50 kg·ha−1 phosphorus from a P2O5 source, along with organic fertilizer, were incorporated into the soil in a linear pattern with 10 cm intervals. To help with the better development of the leaf blast disease in the nursery during this study, the Hashemi susceptible variety was planted in two rows as vertical lines on both sides of the studied varieties. Furthermore, in addition to natural infection, suspensions of the causal agent fungus virulent strain spores were provided three times at a concentration of 105 spores/mL and sprayed weekly on the genotypes leaves after 2–3 leaf growth stages of the seedlings [18].

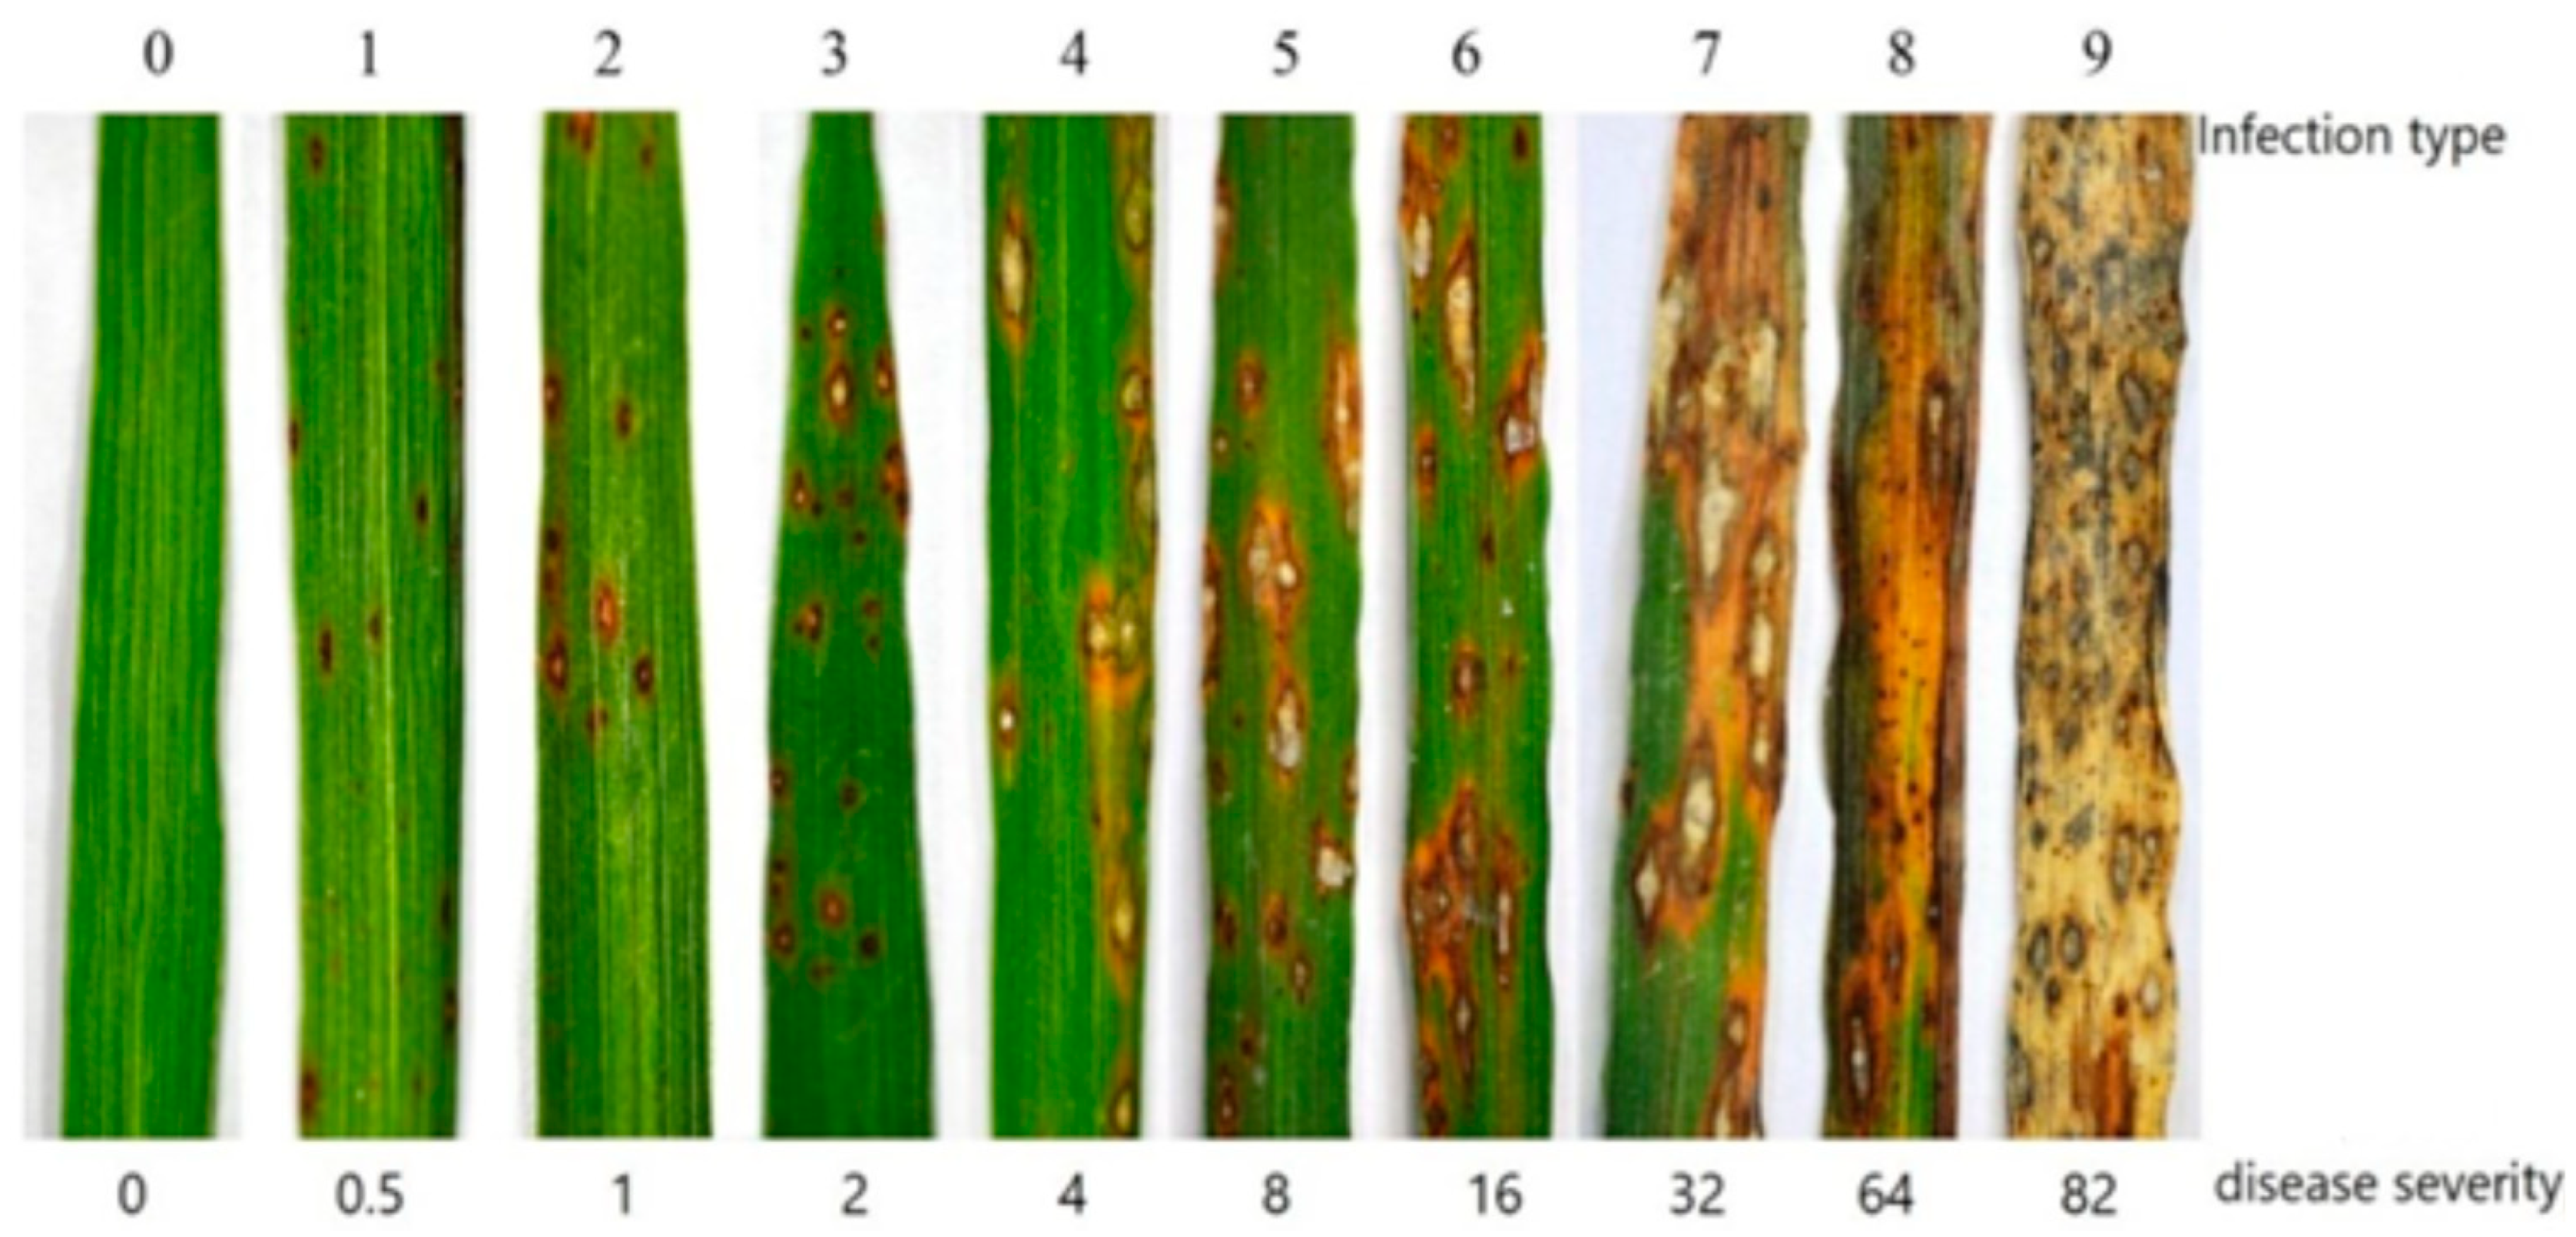
2.3. Measurement of Phenotypic Traits Related to the Disease

The disease-related phenotypic traits were evaluated upon the appearance of blast symptoms on the leaves of the seedlings. Disease severity and the infection type of the genotypes were evaluated using the international scale provided by IRRI [22] (http://www.knowledgebank.irri.org/images/docs/rice-standard-evaluation-system.pdf) (accessed on 22 September 2023), which is shown in the text as severity 1–5, respectively (Figure 1, Table 3). The first recording of disease severity was carried out 24 and 29 days after sowing in 2020 and 2021, respectively. The disease severity of genotypes was recorded at seven-day intervals across five stages in the vegetative phase.
The Area Under the Disease Progress Curve (AUDPC) was calculated using Equation (1) [23]:
AUDPC = i = 1 k X   i + 1 + X i 2   ( t i + 1 t i ) ,
where AUDPC is the area under the disease progress curve, Xi and Xi+1 are the disease severity recorded on the first and second evaluations, and “ti+1 − ti” is the number of days between the first and second evaluations.
The infection rate was calculated according to Equation (2) [24]:
r = [ ln   { X 2 ( 1 X 2 ) } ln   { X 1 ( 1 X 1 ) } ] / ( t 2 t 1 ) ,
where r is the infection rate, X1 and X2 are the disease severity recorded on the first and final evaluation, and t1 and t2 are the first and final severity of the disease recorded on the genotypes.

2.4. Statistical Analysis

Prior to conducting the analysis of variance, a logarithmic transformation was applied to disease severity and AUDPC data, while an Arcsine transformation was used for infection type (IT) data. Once the assumptions were validated, a combined analysis of variance was performed using SAS Version 9.0 software [25].
Cluster analysis was employed with the objective of grouping and identifying disease-resistant and disease-susceptible genotypes, utilizing the Euclidean distance measure and Ward’s minimum variance method in SPSS v.24 software [26]. Following the clustering, the Z-Score was calculated for various traits within each group using Equation (3).
Z _ S c o r e = X μ σ
In this Equation, μ and σ represent the mean and overall standard deviation, respectively [27]. After standardization, the group means are converted into relative values, enabling easy comparisons. It is important to note that a higher Z-Score for a group indicates a greater susceptibility of that group compared to the overall mean. This means that the group has assigned higher values to traits related to blast disease in comparison to the overall mean. Conversely, a more negative Z-Score for a group indicates a higher level of resistance.
Finally, after performing cluster analysis and identifying susceptible and resistant groups for each year, a Venn diagram was constructed using an online tool (https://bioinformatics.psb.ugent.be/webtools/Venn/ (accessed on 18 June 2023). This tool facilitated the identification of genotypes that were consistently among the most resistant and susceptible across both years.
Calculations of genetic parameters and the multi-trait genotype-ideotype distance index (MGIDI) with the best linear unbiased prediction (BLUP) for genotypes were performed as proposed in R using the ‘metan’ package [28] (https://github.com/TiagoOlivoto/metan, 22 September 2023). The polar plot was created using Polar Plot add-ins in Excel for MGIDI indices (https://andypope.info/charts/polarplot3.htm) (accessed on 22 September 2023).
The heritability on the mean basis ( h m g 2 ) was calculated according to Equation (4).
h m g 2 = σ g 2 σ g 2 + σ g × e 2 e + σ e 2 r e
where σ g 2 , σ g × e 2 , σ e 2 , r and e were the genotypic variance, the genotype × environment variance, the residual variance (error), the number of replicates, and the number of environments, respectively.
The selection accuracy was calculated according to Equation (5).
Accuracy = h m g 2
The selection differential for all traits was performed considering a selection intensity of 12%. Selection differential (SD) was computed as the difference between the mean of the selected genotypes ( X ¯ s )   and the original population ( X ¯ 0 ).
The predicted selection gain (SG) was computed using the MGIDI index for each trait using Equation (6).
S G ( % ) = ( X ¯ s X ¯ 0 ) h 2 X ¯ 0
where X ¯ s , and X ¯ 0 are the means of the selected genotypes and the original population, respectively, and h 2 is the heritability.

3. Results

3.1. Combined Analysis of Variance, Heritability, and Selection Accuracy

The results of the combined analysis of variance (Table 4) revealed a significant genotype effect for all assessed traits (p < 0.01). This indicates the existence of genetic diversity among the examined genotypes in terms of their response to blast disease on leaves. Hence, considering these observed variations, it is possible to select desirable genotypes based on the studied traits.
Identifying and selecting superior genotypes should be based on screening for specific traits with high heritability. In the present study, the majority of variables manifested high heritability. The robustness of high heritability was verified through accuracy. AUDPC and IT achieved the highest accuracy.

3.2. Grouping of Rice Genotypes

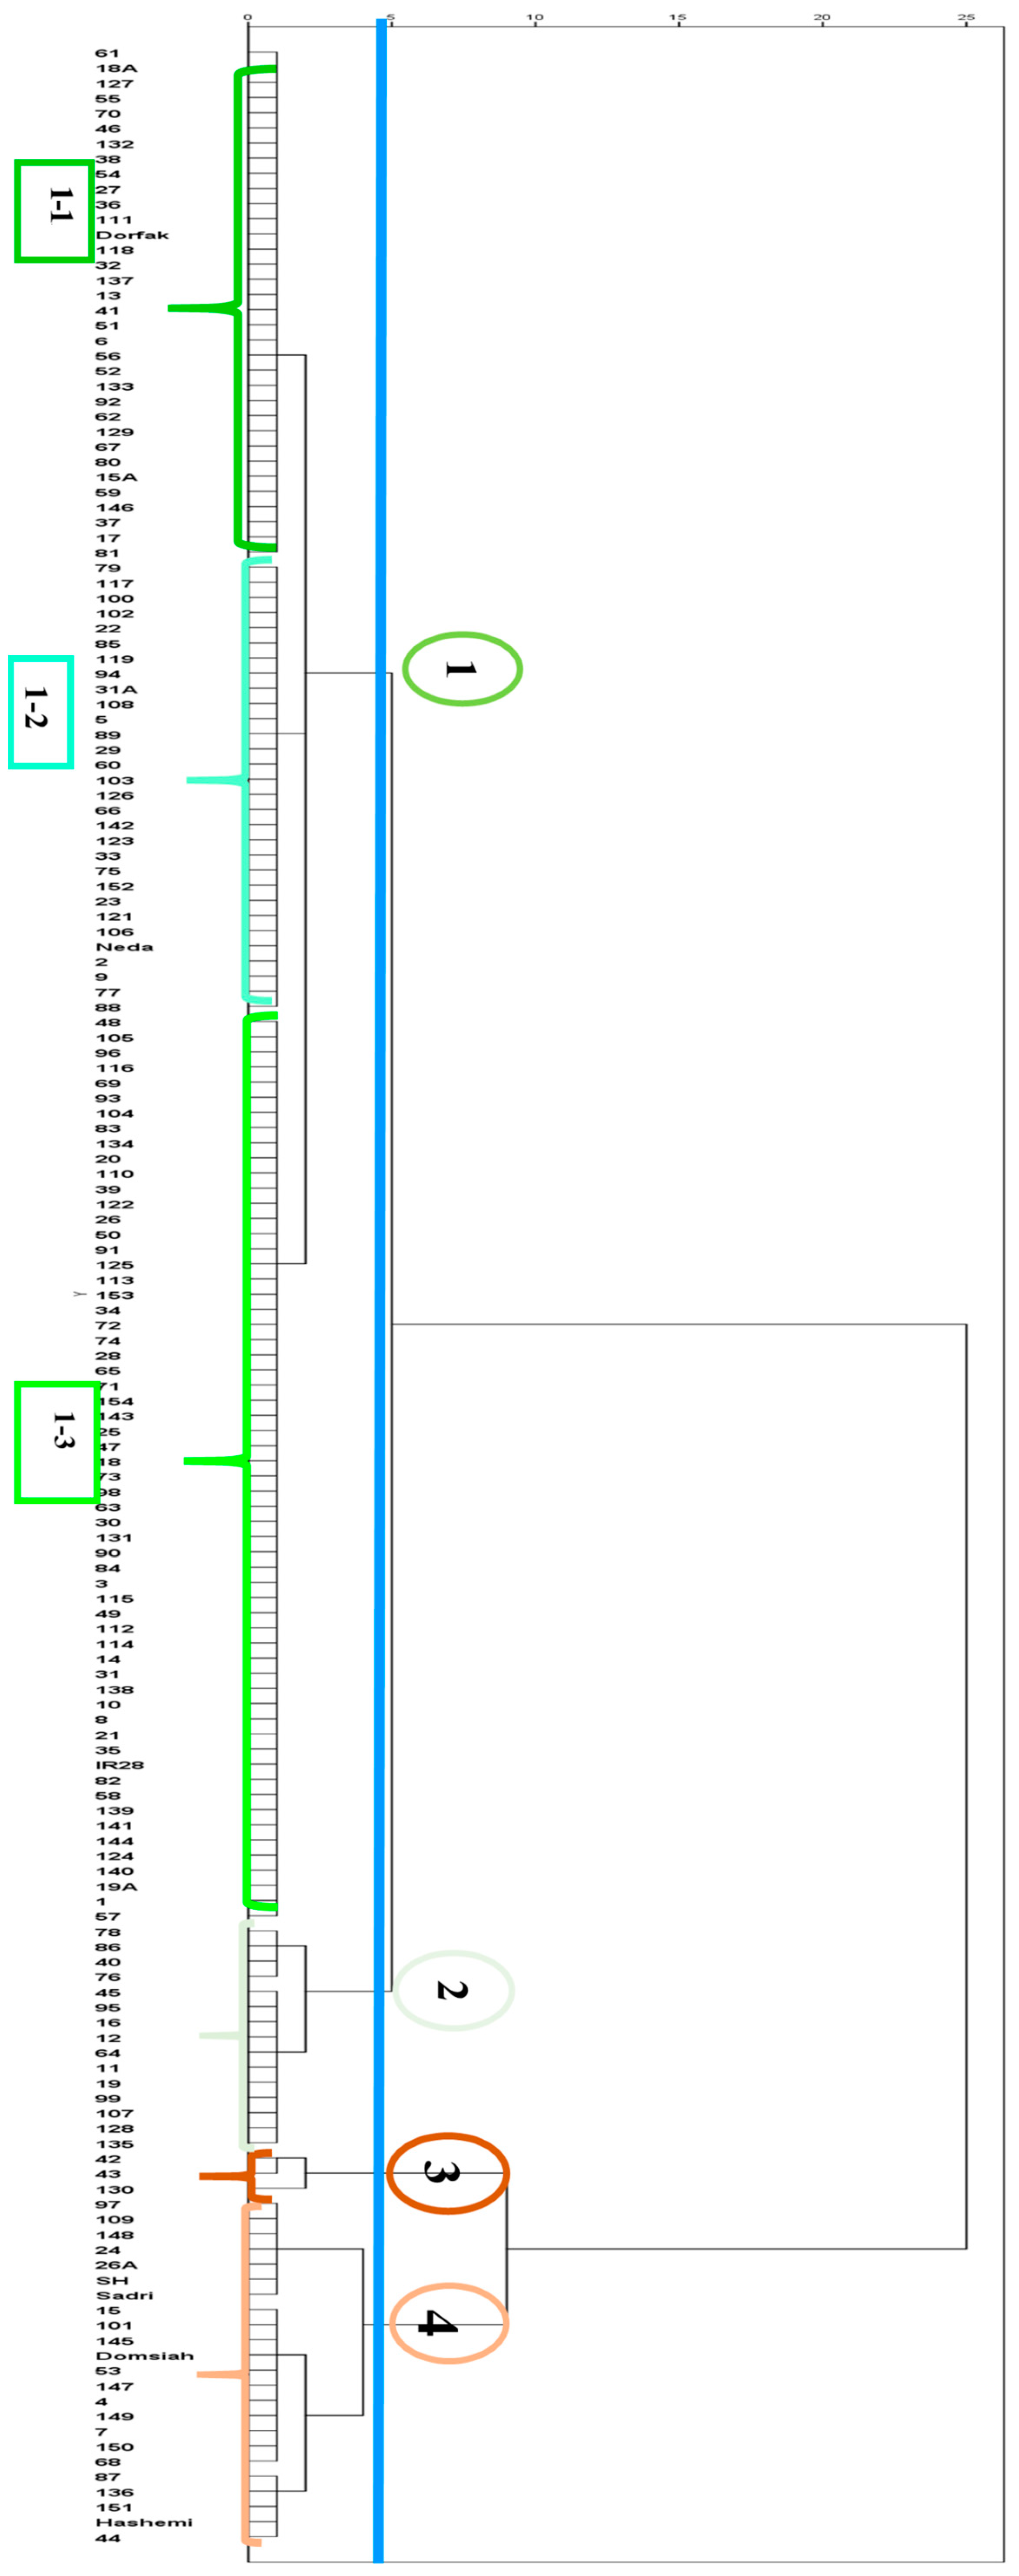
3.2.1. Cluster Analysis of the 2021 Dataset

The dendrogram in Figure 2 represents the result of cluster analysis of rice genotypes in the first year of the experiment (2021). To effectively classify the genotypes and assess their disease response, they were divided into four groups based on the cluster analysis results. Genotypes that exhibited similar responses within a group (similar intra-group characteristics) were placed in the same group, while genotypes that displayed distinct reactions were assigned to different groups, depending on the extent of their dissimilarity. To evaluate and compare the groups based on the studied traits, the mean values and Z-Scores have been presented (Table 5). A higher positive Z-Score indicates that the genotypes in that particular group have higher values for disease-related traits compared to the overall average. This suggests that they are more susceptible to blast disease. Conversely, a more negative Z-Score indicates resistance within that group.
Based on the cluster analysis results, all individuals were classified into four groups. Group 1, being the largest group, consisted of genotypes that showed greater resistance compared to others in the entire population. To identify the most resistant genotypes, Group 1 was further subdivided into three subgroups (1-1, 1-2, and 1-3). Among these subgroups, 1-1 comprised the most resistant genotypes, consisting of 34 members. As depicted in Table 5, the Z-Scores for all traits in this group were the most negative, indicating the lowest susceptibility and the greatest deviation from the overall average in terms of all the traits. The average AUDPC for subgroup 1-1 was estimated to be 2.442, with infection rates and types of 0.003 and 1.444, respectively. Subgroups 1-3, consisting of 60 members, ranked next, followed by subgroups 1-2 with 30 members. All three subgroups displayed negative Z-Scores for all traits. Group 3 and, subsequently, Group 4 were identified as the most susceptible genotypes. These groups had 3 and 23 members, respectively, and had the highest Z-Score values for all traits. The average AUDPC for these two groups was estimated to be 322.952 and 70.679, respectively. Additionally, these two groups exhibited the highest infection rate and type.

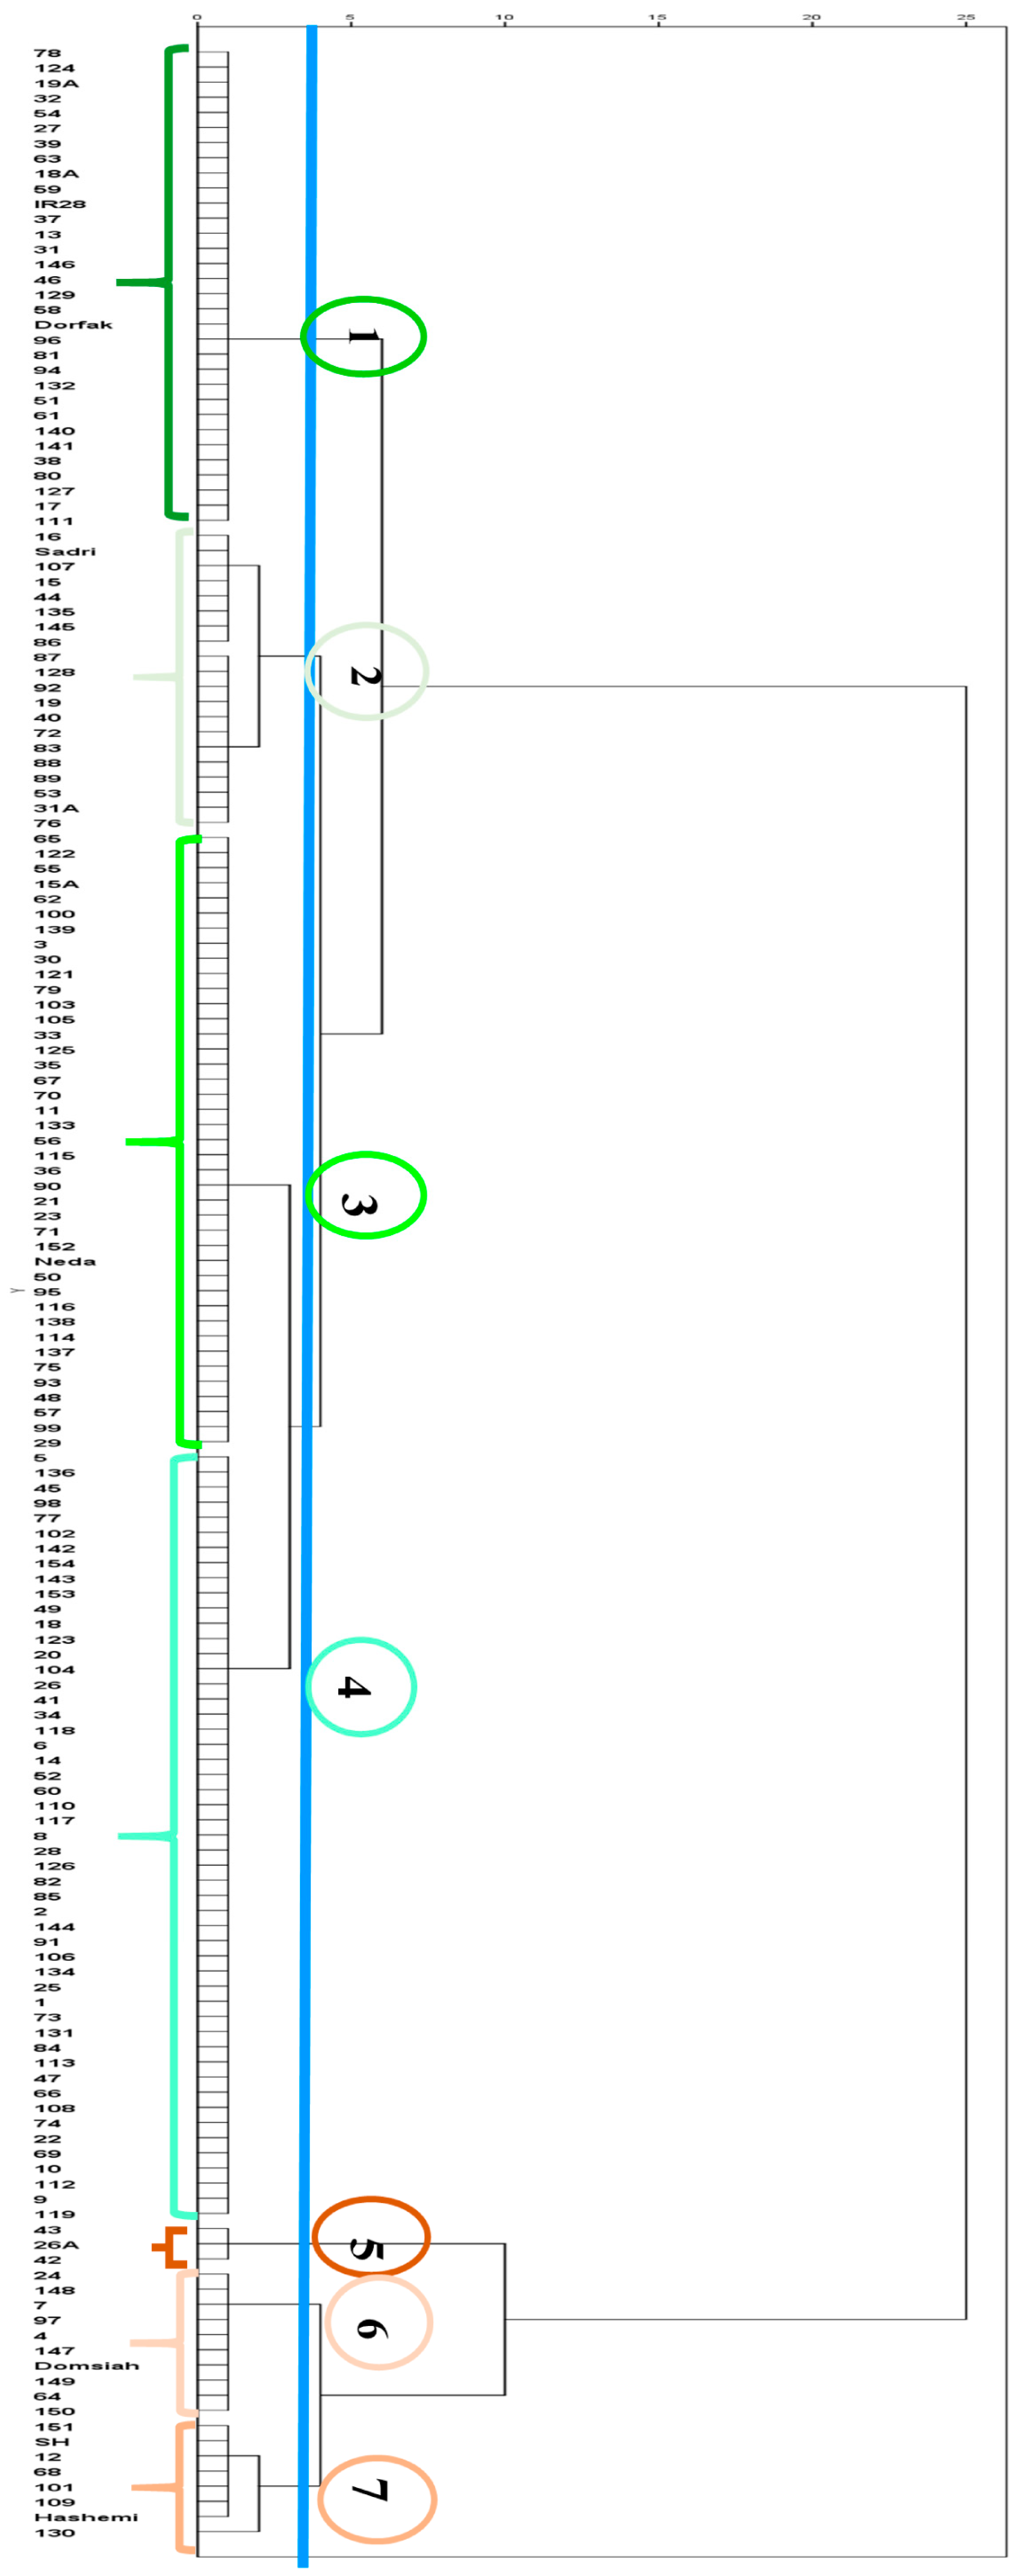
3.2.2. Cluster Analysis of the 2022 Dataset

Derived from the cluster analysis results from 2022, all individuals were categorized into seven groups (Figure 3, Table 6). Group 1, consisting of 32 genotypes, was identified as the most resistant group to blast disease that year. This group exhibited the lowest and most negative Z-Scores for all infection-related traits, and the average AUDPC for this group was estimated to be 3.068. The resistant control varieties, including Dorfak as a resistant verity and IR28 (a resistant parent), along with two aerobic rice varieties (18A and 19A), were included in this group. Following in terms of resistance were groups 3, 4, and 2 in the subsequent stages. The most susceptible genotypes were found in groups 5 and 7, with group 6 also showing susceptibility. Lines 42 and 43 were identified as the most susceptible lines in 2022. The aerobic rice 26A, along with these two lines, was placed in the most susceptible group, which had the highest average AUDPC of 172.627. Additionally, this group exhibited the highest Z-Score values for all traits. The next susceptible group was group 7, which included the Hashemi variety and the SH (susceptible parent), along with lines 12, 68, 101, 109, 130, and 151.

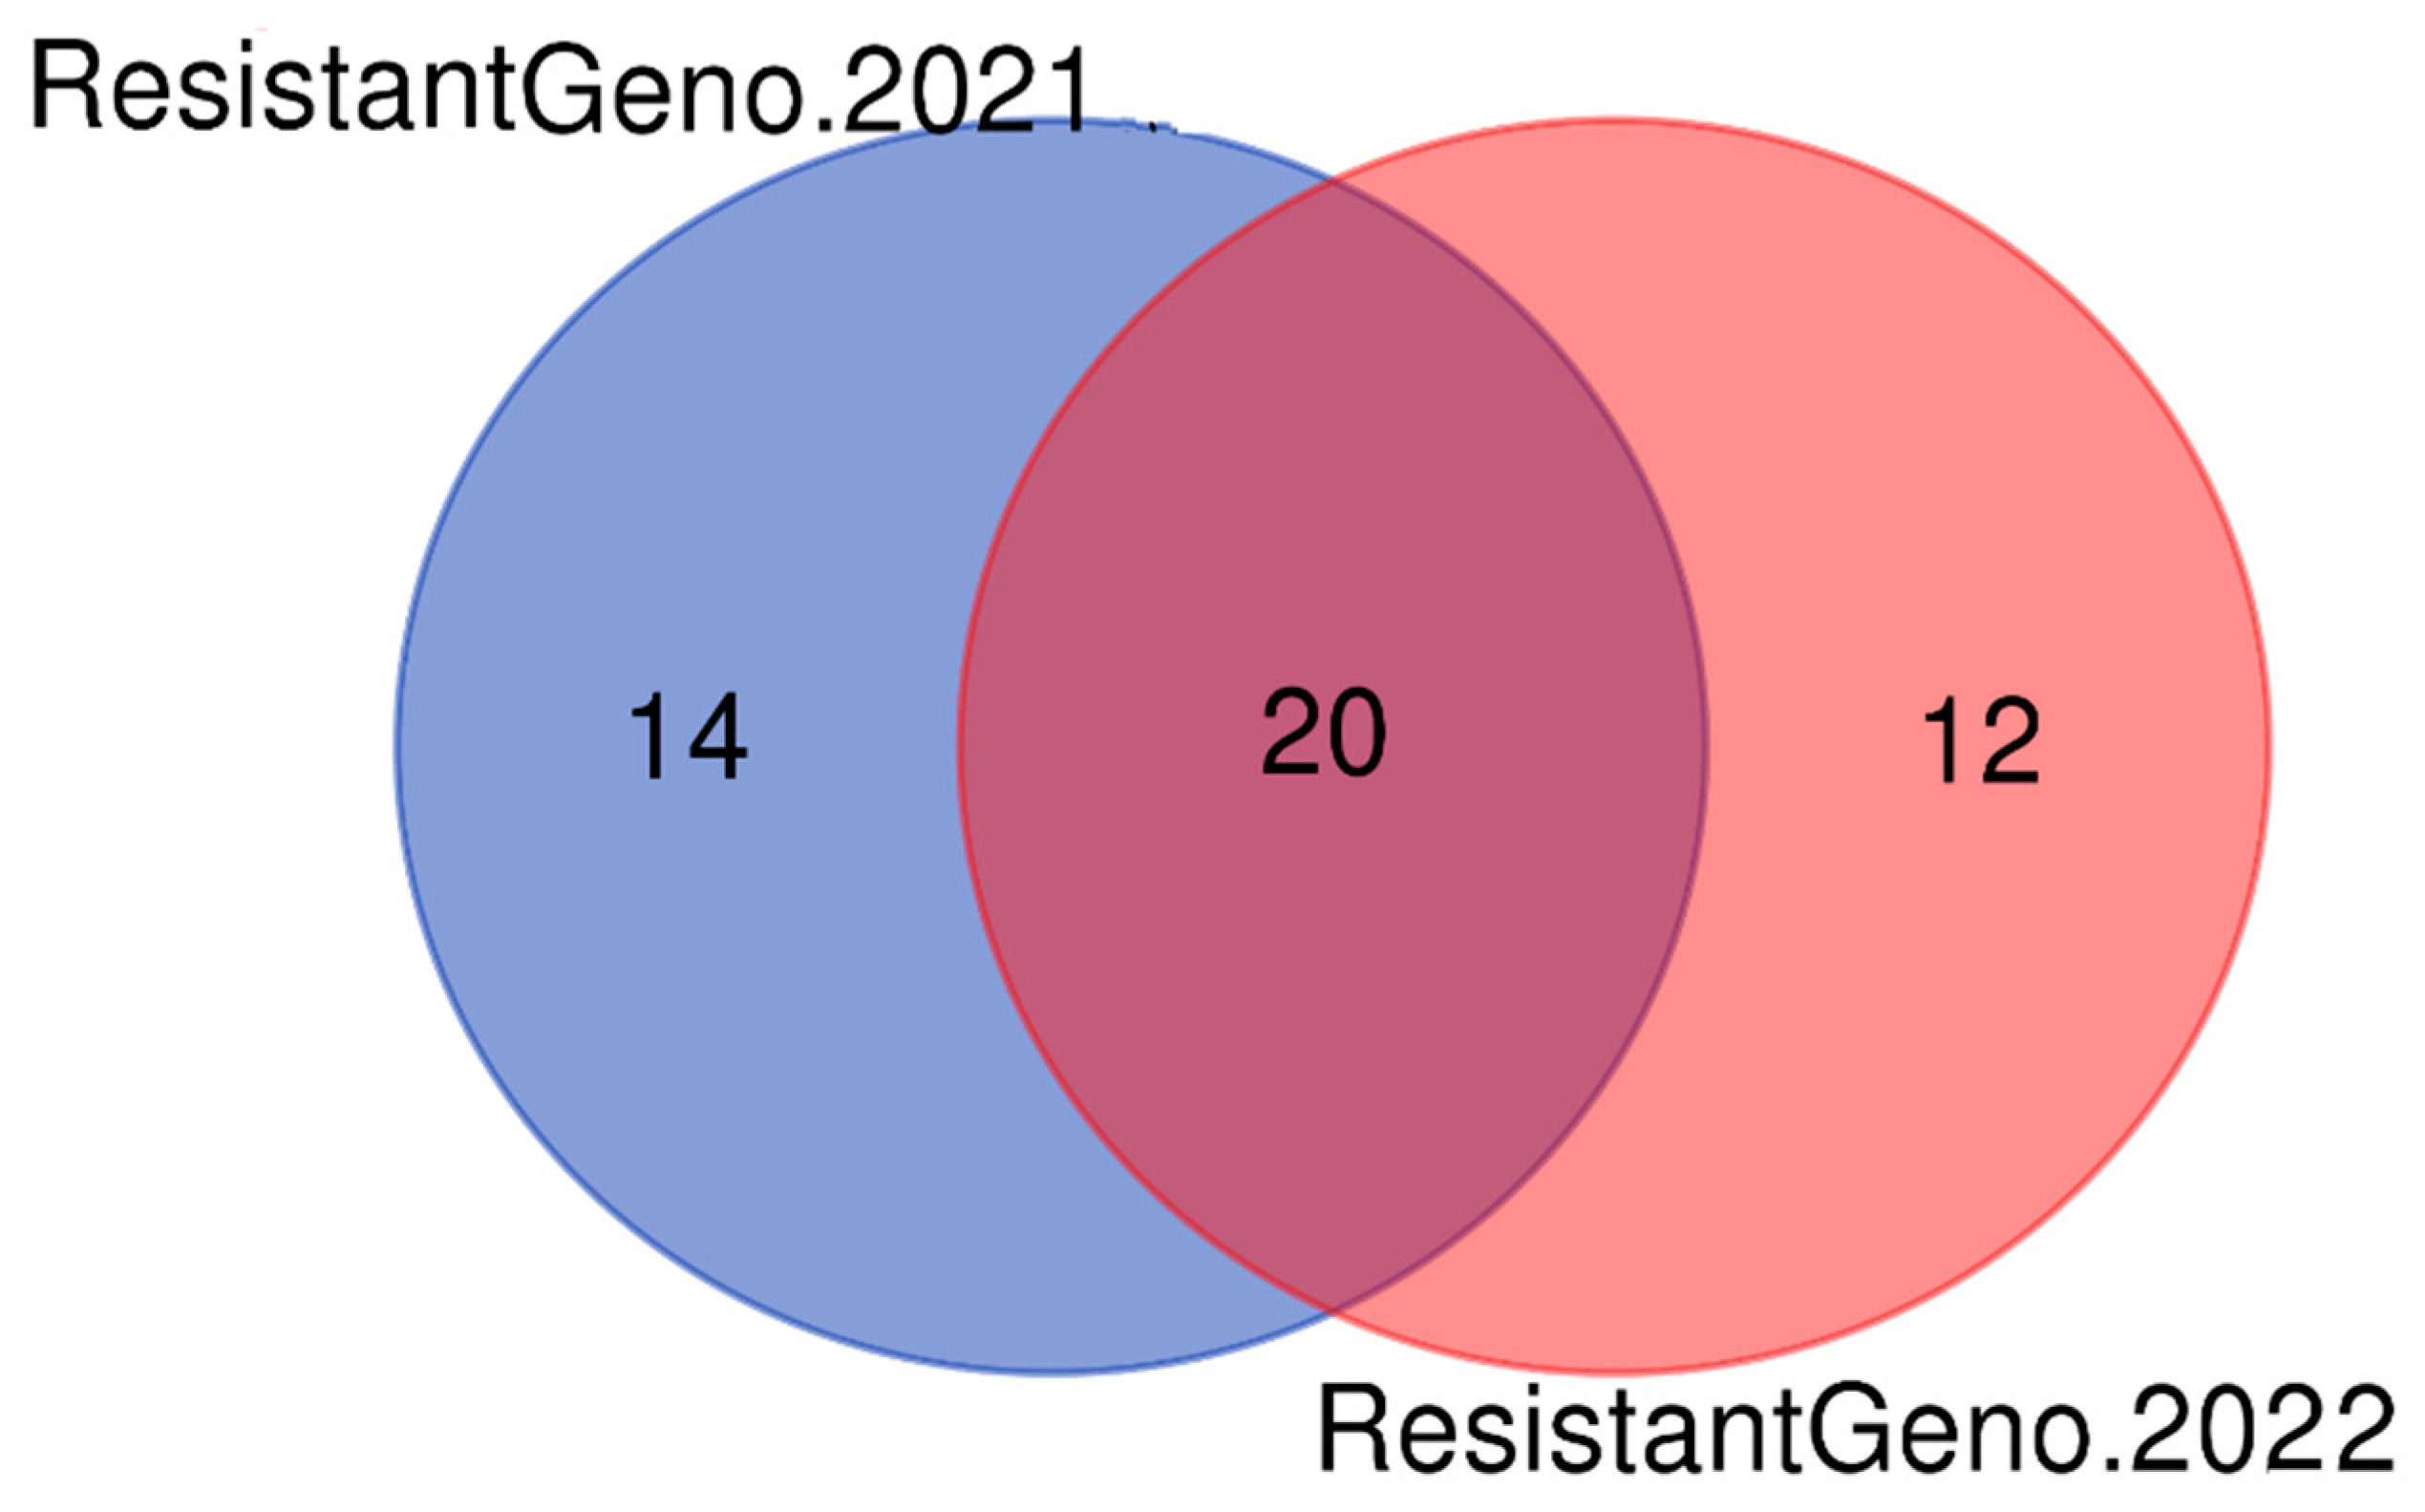
3.2.3. Identification of the Most Resistant and Susceptible Common Rice Genotypes over Two Years

In order to identify the rice genotypes that were most resistant and susceptible in both years, a Venn diagram was utilized. Figure 4 represents the Venn diagram of the most resistant genotypes, while Figure 5 shows the Venn diagram of the most susceptible genotypes.
A total of 34 and 32 genotypes were considered from the most resistant group in 2021 and 2022, respectively. The genotypes that exhibited overlap in both years were identified. Among two groups, 20 genotypes were found to be common across the two years, including lines 13, 17, 27, 32, 37, 38, 46, 51, 54, 59, 61, 80, 81, 111, 127, 129, 132, 146, aerobic rice 18A, and the Dorfak variety. The average trait values for these 20 genotypes are presented in Table 7. The average AUDPC for these genotypes was estimated to be 2.611 ± 0.144, indicating their high level of resistance.
To identify the genotypes that were both most susceptible and common between the two years, a total of 26 and 21 genotypes from the most susceptible group in 2021 and 2022 were considered, respectively (Figure 5). Among them, 19 genotypes showed overlap in both years, including lines 4, 7, 24, 42, 43, 68, 97, 101, 109, 130, 147, 148, 149, 150, 151, 26A, Domsiah, Hashemi, and the SH parent. The average trait values for these 19 genotypes are presented in Table 7. The average AUDPC for these genotypes was estimated to be 90.633±15.686, indicating their high resistance.
In each series of susceptible and resistant genotypes, the fifth sampling stage exhibited the highest levels of infection severity, 0.241% and 9.458%, respectively. Initially, during the first and second recording stages, no significant differences were observed as disease symptoms had not yet emerged. However, as the evaluation progressed, the variations between genotypes became increasingly noticeable. Upon comparing the average infection severity in the fourth and fifth stages, along with the AUDPC, infection rate, and infection type indices, it became evident that significant disparities existed between the most resistant and most susceptible genotypes that were identified.

3.3. MGIDI Index Selections

The heritability (h2) ranged from 0.461 (for Severity 1) to 0.844 (for AUDPC). The result of PCA showed that the first component with eigenvalues ≥ 1 (7.08) accounted for 88.45% of the total variation among the traits. The selection differential and gain ranged from −46.11 to −72.44 and −0.002 to −10.35 for Severity 1 and AUDPC, respectively (Table 8). AUDPC showed the highest selection differential and genetic gain percent (−72.44% and −61.13%, respectively). In general, the MGIDI index provided a total SD of −59.12% for traits that all tended to decrease.
Figure 6 shows the ranking of the 165 rice genotypes according to the MGIDI index. In total, 20 genotypes—17, 80, 111, 127, 81, 38, 37, 61, 132, 59, Dorfak, 58, 46, 141, 18A, 54, 27, 140, 51, and 32—were selected.

3.4. Comparison of RILs with Control Varieties and Population Parents

Table 9 presents the mean traits associated with blast resistance for control varieties, population parents, and RILs over two years.
The RILs demonstrated intermediate trait values, as they were derived from crossing the two parents (SH and IR28). Despite the genetic diversity within the population and the presence of resistant, susceptible, semi-resistant, and semi-susceptible lines, the number of lines exhibiting resistance outnumbered the susceptible ones overall. In comparison to the control varieties, Dorfak displayed the highest level of resistance, whereas genotype 26A proved to be the most susceptible control variety in both years.

4. Discussion

Studying rice blast disease is essential due to its primary impact on carbohydrate production. The main effect of blast disease is a reduction in carbohydrate synthesis caused by the damage inflicted on leaf photosynthesis and respiration. This decrease in carbohydrate production leads to a slowdown in crop growth and a decrease in leaf area. Consequently, there is a reduction in the amount of green leaf present during grain filling, resulting in decreased carbohydrate levels. This significant mechanism can negatively affect grain yield even before flowering occurs [13]. However, from a breeding perspective, using blast-resistant rice varieties has been proven to be an effective strategy to prevent damage caused by this disease [18]. Various research studies have been conducted to identify and develop resistant genotypes. A research study aimed at assessing the relative resistance of certain rice varieties to blast disease (Magnaporthe grisea (Hebert) Barr) and determining the AUDPC was conducted on 58 local rice varieties and promising lines under greenhouse and field conditions. The findings demonstrated that the IR24 variety, along with promising lines F125 and F120-2, exhibited the lowest levels of disease progression, as indicated by the smallest AUDPC ranging from 20 to 30. Conversely, the Domsiah and Hasani varieties, as well as promising lines F35-1 and F63-3, displayed the highest AUDPC values, ranging from 50 to 60. The genotypes were categorized into three groups following cluster analysis: resistant, tolerant, and susceptible to blast disease [16]. In another study that evaluated some of the resistance components to blast, it was reported that Iranian local varieties and lines, including C104-PKT and CO-39, were classified as susceptible based on the AUDPC and infection type. On the other hand, Iranian improved varieties, lines obtained from the International Rice Research Institute, and near-isogenic lines, except for the two lines mentioned above, were categorized as resistant. Varieties like Fuji-Minori, Onda, and Hassan-Saraei were placed in the moderate group (semi-susceptible) [15]. Results from another field experiment aimed at identifying and screening different rice genotypes against blast disease demonstrated that the genotype Shankharika exhibited high disease severity and AUDPC, indicating its increased susceptibility to blast disease. Conversely, the genotype Sabitri showed lower disease severity and AUDPC, indicating a higher resistance level to blast disease [17]. In a study conducted to identify resistant and susceptible rice genotypes by screening them against blast disease under field conditions, 72 genotypes were evaluated over two consecutive cropping seasons (2017 and 2018). The results revealed varying responses of the genotypes to blast disease between the two years. Eleven genotypes out of the 72 exhibited a wide range of AUDPC values from 1800 to 2550, indicating high susceptibility. Eight genotypes displayed AUDPC values ranging from 115 to 250, indicating susceptibility, while nine genotypes demonstrated AUDPC values between 55 and 115, indicating relative resistance [19]. The results of previous studies aimed at assessing the genetic diversity of blast resistance in different rice varieties have indicated that varieties like Domsiah, Sadri, and Hashemi are susceptible to blast disease, while Neda and Dorfak varieties are classified as genotypes showing relative resistance to blast disease [18,29,30], which aligns with the findings of this current study. However, the selection of resistant lines from the F11 recombinant inbred lines sets this study apart from previous research.
In this study, the accuracy values of the majority of variables, especially AUDPC and IT, were very high, as were the accuracy values of the rest of the variables; in general, estimates above 0.70 are sufficient to explicitly conclude the genetic value of genotypes [31,32]. In addition, AUDPC showed the highest selection genetic gain percent (−61.13%), and in general, the MGIDI provided a total SD of −59.12% for traits with decreased sense. According to the results, we found that the selection based on MGIDI provided satisfactory gain. The measured MGIDI, based on the BLUP data from multiple traits in two years, selected 20 resistant genotypes (17, 80, 111, 127, 81, 38, 37, 61, 132, 59, Dorfak, 58, 46, 141, 18A, 54, 27, 140, 51, and 32) that highly overlapped with selected genotypes using cluster analysis.
Since the selection of suitable genotypes has always been a challenge for plant breeders, the use of MGIDI has grown widely among breeders, helping to identify superior genotypes that combine desired different traits [33,34,35,36]. Amrate et al. [37] used the MGIDI method to identify high-yielding charcoal rot-resistant soybean genotypes.
The MGIDI is calculated based on BLUPs that have the ability to eliminate environmental variance and provide accurate estimations of individual breeding values. As a result, they are becoming more prevalent among plant breeders for precise genotypic value estimation [32]. Also, this method is free from the multi-collinearity problem [38].
Some lines, such as 17 and 111, demonstrated greater resistance with the lowest AUDPC values (1.526 and 1.630, respectively) compared to all the tested control varieties and the SH (resistant parent). The RILs are an ideal population for conducting breeding studies and can be generated using the single-seed descent (SSD) method. SSD enables the production of diverse genetic variations, enhances the chances of transgressive segregation, and facilitates the development of homozygous lines. According to previous research, resistance can be effectively achieved through transgressive segregation, in which a segregating hybrid exhibits novel phenotypes due to the epistatic interactions of genes ([39,40]). Transgressive segregation has also been observed for Verticillium wilt resistance in an F2 (resistant Pima S-7 × susceptible Acala 44) [41].
In addition, one notable advantage of RILs compared to F2 populations is their ability to generate an ample supply of seeds for experimental designs with replicates [42]. In the present study, the RILs population was developed through a cross between two parents, SH (susceptible) and IR28 (resistant). The selection of these parents was based on their distinct genetic and phenotypic responses to blast disease, enabling the creation of a population with maximal genetic diversity for targeted selection purposes. Through the implementation of cluster analysis and the MGIDI method, 17 genotypes, including 17, 111, Dorfak, 38, 127, 54, 81, 80, 18A, 27, 61, 46, 37, 59, 32, 132, and 51, were identified as the most resistant genotypes over two years. The mean value of the AUDPC for these resistant genotypes was determined to be 2.435 ± 0.114.
Furthermore, the identification of susceptible and resistant lines holds promising implications for the development of new populations and future breeding programs. By crossing highly susceptible and highly resistant lines, gene exchange between the parental lines can be facilitated, leading to the generation of a broad spectrum of diverse outcomes in subsequent generations. This approach provides a valuable genetic background for selecting new resistant lines possessing desirable phenotypic traits [20,21].

5. Conclusions

The research findings show significant diversity among the rice-inbred lines in their response to leaf blast. Specifically, certain genotypes displayed higher levels of resistance compared to others across both years of the study. Notably, 17 genotypes exhibited superior resistance. In this study, the selected genotypes, identified using cluster analysis and MGIDI, hold immense potential for utilization in breeding programs to develop recombinant populations by crossing highly susceptible and resistant lines. This approach will maximize the genetic diversity for selecting new blast-resistant lines.

Author Contributions

Conceptualization, A.S. and A.R.D.; methodology, R.J., A.S., A.R.D. and S.M.; formal analysis, A.S.; investigation, R.J. and A.R.D.; writing—original draft preparation, A.S. and R.J.; writing—review and editing, A.S., A.R.D. and S.M.; supervision, A.S.; project administration, A.S., A.R.D. and S.M. All authors have read and agreed to the published version of the manuscript.

Funding

This research received no external funding.

Data Availability Statement

All datasets generated for this study can be found in the article, tables, and figures shared.

Acknowledgments

The author would like to thank the University of Guilan for supporting this research.

Conflicts of Interest

The authors declare no conflict of interest.

References

  1. Jaiswal, S.; Gautam, R.K.; Singh, R.K.; Krishnamurthy, S.L.; Ali, S.; Sakthivel, K.; Iquebal, M.A.; Rai, A.; Kumar, D. Harmonizing technological advances in phenomics and genomics for enhanced salt tolerance in rice from a practical perspective. Rice 2019, 12, 89. [Google Scholar] [CrossRef] [PubMed]
  2. Mohamadi, S.F.; Bagheri, N.; Kiani, G.; Babaeian Jelodar, N. Evaluation of Reaction of some Rice Genotypes to Salinity Stress at Germination Stage. J. Crop Breed. 2018, 10, 20–30. [Google Scholar] [CrossRef]
  3. Ahmadi, K.; Ebadzadeh, H.R.; Hatami, F.; Hosseinpour, R.; Abdeshah, H. Volume I: Agricultural Crop Years 2018–2019. Deputy Director of Planning and Economic Affairs Center for Information and Communication Technology, Ministry of Jihad-e Agriculture. In Agricultural Statistics; Ministry of Jihad-e Agriculture: Tehran, Iran, 2022; Available online: https://www.maj.ir/Dorsapax/userfiles/Sub65/Amarnamehj1-97-98-site.pdf (accessed on 26 June 2023).
  4. Usama Younas, M.; Wang, G.; Du, H.; Zhang, Y.; Ahmad, I.; Rajput, N.; Li, M.; Feng, Z.H.; Hu, K.; Ullah Khan, N.; et al. Approaches to reduce rice blast disease using knowledge from host resistance and pathogen pathogenicity. Int. J. Mol. Sci. 2023, 24, 4985. [Google Scholar] [CrossRef] [PubMed]
  5. Kim, Y.; Suk Chung, Y.; Lee, E.; Tripathi, P.; Heo, S. Root response to drought stress in rice (Oryza sativa L.). Int. J. Mol. Sci. 2020, 21, 1513. [Google Scholar] [CrossRef] [PubMed]
  6. Gabriel, M.G.; Alhasan, U.; Mary, Y.; Munsur, Y.; Olufunmilayo, A. Screening of rice germplasm for blast resistance in Nigeria. Asian J. Agric. 2022, 6, 1–6. [Google Scholar] [CrossRef]
  7. Roustaee, A. Plant Disease Management, 1st ed.; Jahad Daneshgahi Publication: Tehran, Iran, 2002; 400p. [Google Scholar]
  8. Kumar, I.S.; Nadarajah, K. A meta-analysis of quantitative trait loci associated with multiple disease resistance in rice (Oryza sativa L.). Plants 2020, 9, 1491. [Google Scholar] [CrossRef] [PubMed]
  9. Agbowuro, G.O.; Afolabi, M.S.; Olamiriki, E.F.; Awoyemi, S.O. Rice blast disease (Magnaporthe oryzae): A menace to rice production and humanity. Int. J. Pathog. Res. 2020, 4, 32–39. [Google Scholar] [CrossRef]
  10. Rijala, S.; Devkota, Y. A review on various management method of rice blast disease. Malays. J. Sustain. Agric. 2020, 4, 29–33. [Google Scholar] [CrossRef]
  11. Sahu, P.K.; Sao, R.; Choudhary, D.K.; Thada, A.; Kumar, V.; Mondal, S.; Das, B.K.; Jankuloski, L.; Sharma, D. Advancement in the breeding, biotechnological and genomic tools towards development of durable genetic resistance against the rice blast disease. Plants 2022, 11, 2386. [Google Scholar] [CrossRef]
  12. Mahdian, S.A. Transferring of resistance genes Pi-1 and Pi-2 to blast in Tarom-dylamani rice cultivar. J. Crop Breed. 2009, 1, 67–77. [Google Scholar]
  13. Bastiaans, L. Effects of leaf blast on growth and production of a rice crop. 1. Determining the mechanism of yield reduction. Neth. J. Plant Pathol. 1993, 99, 323–334. [Google Scholar] [CrossRef]
  14. Korinsak, S.; Sriprakhon, S.; Sirithunya, K.; Sriwongchai, T.; Wongsaprom, C.; Pabpla, A.; Vanavichit, A.; Toonjinda, T. Resistance QTLs controlling leaf and neck blast disease identified in a doubled haploid rice population. Euphytica 2023, 219, 1–15. [Google Scholar] [CrossRef]
  15. Amanzadeh, M.; Moumeni, A.; Okhovat, M.; Javan Nikkhah, M.; Khosravi, V. Evaluation of Resistance of Rice to Leaf and Panicle Blast in Mazandaran Province. Agric. Sci. Tech. Nat. Res. 2008, 11, 209–2019. [Google Scholar]
  16. Abedi, F.; Babaeiyan, N.; Moumeni, A.; Nemat Zadeh, G.A. Evaluation of partial resistance to Magnaporthe grisea Sacc. in rice cultivars at the seedling stage under upland nursery and greenhouse conditions. Agric. Knowl. 2011, 4, 31–42. [Google Scholar]
  17. Ghimire, P.; Giri, B.; Gautam, P.; Shrestha, P.; Shrestha, S.H. Screening of different rice genotypes against rice blast (Pyricularia oryzae) at Gokuleshwor Baitadi. Int. J. Sci. Res. Publ. 2019, 9, 809–812. [Google Scholar] [CrossRef]
  18. Alinezhad, F.; Sabouri, A.; Mousanejad, S. Evaluation of genetic diversity of resistance to blast disease in some Iranian and aerobic rice genotypes. Iran. J. Field Crops Res. 2020, 51, 63–74. [Google Scholar]
  19. Arooj, S.; Ahmad, S.; Ejaz Ashraf, E.; Ehetisham Ul Haq, M.; Abdul Rehman, M.; Ali, Y.; Atiq, M.; Said, F.; Haq, I.; Raza, W. Field evaluation of rice germplasm for resistance against Pyricularia Oryzae, the cause of rice blast. Ann. Romanian Soc. Cell Biol. 2022, 26, 690–704. [Google Scholar]
  20. McCouch, S. Diversifying selection in plant breeding. PLoS Biol. 2004, 2, 1507–1512. [Google Scholar] [CrossRef]
  21. Bertan, I.; Carvalho, F.I.F.; Oliveira, A.C.D. Parental selection strategies in plant breeding programs. J. Crop Sci. Biotechnol. 2007, 10, 211–222. [Google Scholar]
  22. IRRI. Standard Evaluation System for Rice, 5th ed.; International Rice Research Institute: Los Baños, Philippines, 2013; 55p. [Google Scholar]
  23. Mukherjee, A.K.; Mohapatra, N.K.; Nayak, P. Assessment of partial resistance to rice blast disease. Oryza 2018, 55, 363–382. [Google Scholar] [CrossRef]
  24. Van der plank, J.E. Plant Diseases: Epidemics and Control; Academic Press: New York, NY, USA, 1963; 349p. [Google Scholar]
  25. SAS Institute Inc. SAS/STAT. User’s Guide, Version 9; SAS Institute Inc.: Cary, NC, USA, 2003. [Google Scholar]
  26. IBM Corp. IBM SPSS Statistics for Windows, Version 24.0; IBM Corp: Armonk, NY, USA, 2016. [Google Scholar]
  27. Rubin, A. Statistics for Evidence Based Practice and Evaluation; Cengage Learning: Boston, MA, USA, 2012; 368p. [Google Scholar]
  28. Olivoto, T.; Nardino, M. MGIDI: Toward an effective multivariate selection in biological experiments. Bioinformatics 2021, 37, 1383–1389. [Google Scholar] [CrossRef] [PubMed]
  29. Moumeni, A.; Mousanejad, S. Genetic analysis of resistance to races of Magnaporthe grisea the causal agent of blast disease in some Iranian rice cultivars. Seedl. Seed Breed. J. 2013, 1, 423–441. [Google Scholar]
  30. Sabouri, A.; Alinezhad, F.; Mousanejad, S. Association analysis using SSR markers and identification of resistant aerobic and Iranian rice cultivars to blast disease. Eur. J. Plant Pathol. 2020, 2, 561–570. [Google Scholar] [CrossRef]
  31. DeLacy, I.; Basford, K.; Cooper, M.; Bull, J.; McLaren, C. Analysis of multi-environment trials—An historical perspective. Plant Adapt. Crop Improv. 1996, 39124, 39–124. [Google Scholar]
  32. Triki, T.; Bennani, L.; Boussora, F.; Tlahig, S.; Ben Ali, S.; Gasmi, A.; Yahia, H.; Belhouchette, K.; Loumerem, M.; Guasmi, F. Characterization and Trait Association Analysis of 27 Pearl Millet Landraces in Southern Tunisia. Agronomy 2023, 13, 2128. [Google Scholar] [CrossRef]
  33. Mamun, A.A.; Islam, M.M.; Adhikary, S.K.; Sultana, M.S. Resolution of Genetic Variability and Selection of Novel Genotypes in EMS Induced Rice Mutants Based on Quantitative Traits through MGIDI. Int. J. Agric. Biol. 2022, 28, 100–112. [Google Scholar]
  34. Rani, R.; Raza, G.; Ashfaq, H.; Rizwan, M.; Shimelis, H.; Tung, M.H.; Arif, M. Analysis of genotype× environment interactions for agronomic traits of soybean (Glycine max [L.] Merr.) using association mapping. Front. Genet. 2023, 13, 1090994. [Google Scholar] [CrossRef]
  35. Patel, R.; Parmar, D.J.; Kumar, S.; Patel, D.A.; Memon, J.; Patel, M.B.; Patel, J.K. Dissection of genotype× environment interaction for green cob yield using AMMI and GGE biplot with MTSI for selection of elite genotype of sweet corn (Zea mays conva. Saccharata var. rugosa). Indian J. Genet. Plant Breed. 2023, 83, 59–68. [Google Scholar]
  36. Dias, A.H.; Spanholi, L.F.; Souza, A.L.K.D.; Brighenti, A.F.; Welter, L.J.; Nodari, R.O. Phenology and viticultural performance of different fungus-resistant grapevine advanced selections at three different altitudes in southern Brazil. Rev. Bras. Frutic. 2023, 45, e988. [Google Scholar] [CrossRef]
  37. Amrate, P.K.; Shrivastava, M.K.; Bhale, M.S.; Agrawal, N.; Kumawat, G.; Shivakumar, M.; Nataraj, V. Identification and genetic diversity analysis of high-yielding charcoal rot resistant soybean genotypes. Sci. Rep. 2023, 13, 8905. [Google Scholar] [CrossRef]
  38. Ahmed, S.R.; Ali, Z.; Ijaz, I.; Khan, Z.; Gul, N.; Ahmed, S.R.; Ali, Z.; Ijaz, I.; Khan, Z.; Gul, N.; et al. Multi-Trait Selection of Quinoa Ideotypes at Different Levels of Cutting and Spacing. Sustainability 2023, 15, 11446. [Google Scholar] [CrossRef]
  39. Rieseberg, L.H.; Widmer, A.; Arntz, A.M.; Burke, J.M. The genetic architecture necessary for transgressive segregation is common in both natural and domesticated populations. Philos. Trans. R. Soc. Lond. B Biol. Sci. 2003, 358, 1141–1147. [Google Scholar] [CrossRef]
  40. Ilyas, M.; Rafique, K.; Ahmed, S.; Zulfiqar, S.; Afzal, F.; Khalid, M.; Kazi, A.G.; Mujeeb-Kazi, A. Preventing potential diseases of crop plants under the impact of a changing environment. In Emerging Technologies and Management of Crop Stress Tolerance; Elsevier: Amsterdam, The Netherlands, 2014; pp. 193–214. [Google Scholar]
  41. Bolek, Y.; El-Zik, K.M.; Pepper, A.E.; Bell, A.A.; Magill, C.W.; Thaxton, P.M.; Reddy, O.U.K. Mapping of verticillium wilt resistance genes in cotton. Plant Sci. 2005, 168, 1581–1590. [Google Scholar] [CrossRef]
  42. Sabouri, A.; Dadras, A.R.; Azari, M.; Saberi Kouchesfahani, A.; Taslimi, M.; Jalalifar, R. Screening of rice drought-tolerant lines by introducing a new composite selection index and competitive with multivariate methods. Sci. Rep. 2022, 12, 2163. [Google Scholar] [CrossRef]
Figure 1. Infection type and disease severity of rice blast disease based on the scale of IRRI [22].
Agronomy 13 02730 g001
Figure 2. Dendrogram of cluster analysis of the recombinant inbred rice line population along with control varieties based on traits related to rice leaf blast disease using Ward’s method in 2021. Dark green and dark brown colors have been used to show the most resistant and susceptible groups to blasts, respectively. Lighter colors have less sensitivity and resistance. (Information on rice genotypes was presented in Table 1).
Agronomy 13 02730 g002
Figure 3. Dendrogram of cluster analysis of the recombinant inbred rice line population along with control varieties based on traits related to rice leaf blast disease using Ward’s method in 2022. Dark green and dark brown colors have been used to show the most resistant and susceptible groups to blasts, respectively. Lighter colors have less sensitivity and resistance. (Information on rice genotypes was presented in Table 1).
Agronomy 13 02730 g003
Figure 4. Venn diagram to identify the most resistant rice genotypes to leaf blast disease that were common in the two assessment years of 2021 and 2022. Thirty-four and 32 genotypes of the most resistant genotypes were selected in 2021 and 2022, respectively. Among these genotypes, 20 genotypes were common in two years.
Agronomy 13 02730 g004
Figure 5. Venn diagram to identify the most susceptible rice genotypes to leaf blast disease that were common in the two assessment years of 2021 and 2022. Twenty-six and 21 genotypes of the most susceptible genotypes were selected in 2021 and 2022, respectively. Among these genotypes, 19 genotypes were common in two years.
Agronomy 13 02730 g005
Figure 6. Polar plot based on the MGIDIs (multi-trait genotype-ideotype distance) indices. The selected superior genotypes as the most resistant genotypes are shown in green. The 43° cut angle represents the cut point according to the selection intensity of 12% (out of 165 genotypes). The selected resistant genotypes include 17, 80, 111, 127, 81, 38, 37, 61, 132, 59, Dorfak, 58, 46, 141, 18A, 54, 27, 140, 51, and 32. The dark green and dark red colors in the circle’s circumference have been used to show the most resistant and susceptible. Lighter colors have less sensitivity and resistance.
Agronomy 13 02730 g006
Table 1. Information on rice genotypes in this experiment includes 153 RILs and 12 control varieties.
Code or NameDesignationParentage or Origin
1-154 1F11 Recombinant inbred lines (RILs)Iran
15AIR 82635-B-B-82-2IR 78875-176-B-2/IR 78875-207-B-3
18AIR 82639-B-B-140-1IR 78875-176-B-2/IR 78908-143-B-4
19AIR 83749-B-B-46-1IR 71524-44-1-1/2*IR 74371-54-1-1
26AIR 82635-B-B-32-4IR 78875-176-B-2/IR 78875-207-B-3
31ANona BokraIndia
DomsiahDomsiahIran (native)
DorfakDorfakIran (improved)
NedaNedaIran (improved)
SadriSadriIran (native)
HashemiHashemiIran (native)
SHShaahpasandIran (native)
IR28IR28IRRI
1 One of the lines (line 120) did not germinate and was removed from the list.
Table 2. Meteorological data in Rasht for the cropping seasons of 2021 and 2022.
YearMonthRainfall (mm)Absolute Temperature (°C)Mean Temperature (°C)Relative Humidity (%)Evaporation (mm)
MinimumMaximum
2021April11.911.9424.071873.1792.1
May3816.4226.1221.2779.73104.6
June5.120.9631.1326.0575.77162.1
July108.122.3530.9326.6478.87117.2
August1.621.5534.7428.1468.31161.6
September80.918.8627.923.3879.3279.1
2022April18.910.822316.9271.6591
May46.713.4722.541880.6683
June1.220.230.7525.4771.42166.5
July35.720.6730.8225.7474.4135.7
August15.720.5633.0626.8171.53152.8
September129.318.4529.6724.0578.9890.7
Table 3. Scale of IRRI [22] for scoring rice leaf blast disease.
0No lesions were observed
1Small brown specks of pin-point size or larger brown specks without a sporulating center
2Small, roundish to slightly elongated, necrotic gray spots, about 1–2 mm in diameter, with a distinct brown margin
3The lesion type is the same as in scale 2, but a significant number of lesions are on the upper leaves
4Typical susceptible blast lesions are 3 mm or longer, infecting less than 4% of the leaf area
5Typical blast lesions infect 4–10% of the leaf area
6Typical blast lesions infect 11–25% of the leaf area
7Typical blast lesions infect 26–50% of the leaf area
8Typical blast lesions infect 51–75% of the leaf area, and many leaves are dead
9More than 75% of the leaf area affected
Table 4. Combined variance analysis and genetic parameters of evaluated traits of rice genotypes under blast treatment as a randomized complete block design across 2021 and 2022.
Mean Squares
S.O.VdfSeverity 1 2Severity 2Severity 3Severity 4Severity 5AUDPCrIT
Year 15.90 × 10⁻⁶ ns 17.67 × 10⁻⁴ ns2.27 × 10−3 ns3.38 × 10−3 ns1.70 × 10−1 **6.14 × 10⁻¹ ns4.70 × 10−4 **2.40 × 10⁻¹ **
Block(Year)43.58 × 10−61.81 × 10−41.37 × 10−33.56 × 10−31.28 × 10−38.26 × 10−11.72 × 10−51.97 × 10−3
Genotype1641.55 × 10−6 **1.75 × 10⁻⁴ **1.39 × 10⁻³ **4.37 × 10⁻³ **1.33 × 10⁻² **1.22 **8.1 × 10⁻⁵ **1.46 × 10⁻² **
Genotype×Year1648.30 × 10−7 ns7.86 × 10−5 **1.68 × 10⁻⁴ ns6.91 × 10−4 *4.74 × 10−3 **1.08 × 10⁻¹ **2.35 × 10⁻⁵ **1.87 × 10⁻³ *
Erorr6567.30 × 10−74.92 × 10−52.45 × 10−45.46 × 10−48.47 × 10−44.57 × 10−26.41 × 10−61.49 × 10⁻³
CV% 0.262.654.7413.645.04714.275.7717.65
h2mg 0.460.540.810.810.590.840.710.84
Accuracy 0.680.730.900.900.770.920.840.92
1 ns, * and ** indicate no significant difference or significance at the five and one percent level, respectively. 2 Severity 1–5: Disease Severity in the first-fifth recording, AUDPC: area under the disease progress curve, r, IT: rate and type of infection, CV: coefficient of variation, h2mg: heritability on the mean basis, and Accuracy: selection accuracy.
Table 5. The information on separate groups from cluster analysis includes the mean, the number of group members, and the Z-score of the groups in response to blast disease compared to the total average in 2021.
Group InformationTraitGroup MeanZ-Score
Group name: 1.1
Memberships: 34
Severity 1 10.0000−0.1793
Severity 20.0000−0.2144
Severity 30.0705−0.3105
Severity 40.1121−0.3400
Severity 50.3324−0.3962
AUDPC2.4419−0.3704
r0.0016−0.4856
IT0.5882−0.7183
Group name: 1.2
Memberships: 30
Severity 10.0013−0.1333
Severity 20.0114−0.1815
Severity 30.1877−0.2092
Severity 40.2592−0.2870
Severity 50.5702−0.3569
AUDPC5.2087−0.3136
r0.0026−0.4121
IT1.4444−0.2004
Group name: 1.3
Memberships 60
Severity 10.0005−0.1615
Severity 20.0024−0.2076
Severity 30.1316−0.2577
Severity 40.1790−0.3159
Severity 50.5321−0.3632
AUDPC4.0550−0.3373
r0.0026−0.4131
IT0.9944−0.4726
Group name: 2
Memberships: 15
Severity 10.0012−0.1381
Severity 20.0070−0.1944
Severity 30.3195−0.0954
Severity 41.06730.0042
Severity 52.97820.0416
AUDPC20.1839−0.0062
r0.01290.3477
IT2.51110.4448
Group name: 3
Memberships: 3
Severity 10.13854.7052
Severity 21.76934.8747
Severity 37.67646.2596
Severity 418.61846.3278
Severity 536.00525.5067
AUDPC322.95186.2097
r0.04282.5525
IT7.55563.4960
Group name: 4
Memberships: 23
Severity 10.01460.3367
Severity 20.27840.5864
Severity 31.18240.6499
Severity 43.47820.8728
Severity 510.30131.2533
AUDPC70.67861.0305
r0.03221.7733
IT4.76811.8100
1 Severity 1–5: Disease severity in the first-fifth recording (%), AUDPC: area under the disease progress curve, r and IT: rate and type of infection. Dark green and dark brown colors have been used to show the most resistant and susceptible groups to blasts, respectively. Lighter colors have less sensitivity and resistance.
Table 6. The information on separate groups from cluster analysis includes the mean, the number of group members, and the Z-score of the groups in response to blast disease compared to the total average in 2022.
Group InformationTraitGroup MeanZ-Score
Group name: 1
Memberships: 32
Severity 1 10.0009−0.2941
Severity 20.0113−0.3505
Severity 30.1534−0.4072
Severity 40.1934−0.3963
Severity 50.1595−0.3528
AUDPC3.0683−0.3944
r0.0014−0.4591
IT0.2188−0.9526
Group name: 2
Memberships: 20
Severity 10.03140.3594
Severity 20.24080.1190
Severity 30.62370.0106
Severity 40.77020.0187
Severity 50.5891−0.0854
AUDPC13.61490.0096
r0.00520.0766
IT1.35000.3214
Group name: 3
Memberships: 41
Severity 10.0022−0.2673
Severity 20.0248−0.3229
Severity 30.2391−0.3310
Severity 40.2934−0.3243
Severity 50.2080−0.3226
AUDPC4.6365−0.3343
r0.0021−0.3585
IT0.6667−0.4482
Group name: 4
Memberships: 51
Severity 10.0033−0.2426
Severity 20.0454−0.2806
Severity 30.2968−0.2798
Severity 40.3557−0.2795
Severity 50.2551−0.2933
AUDPC5.7907−0.2901
r0.0026−0.2959
IT1.0000−0.0728
Group name: 5
Memberships: 3
Severity 10.23594.7472
Severity 23.14166.0511
Severity 37.15215.8101
Severity 49.08225.9984
Severity 510.33435.9812
AUDPC172.62706.1013
r0.04465.6402
IT4.55563.9314
Group name: 6
Memberships: 8
Severity 10.06511.0821
Severity 20.72281.1045
Severity 32.71941.8723
Severity 43.48601.9725
Severity 54.07252.0831
AUDPC62.97901.9008
r0.02032.2066
IT3.25002.4611
Group name: 7
Memberships: 10
Severity 10.02700.2657
Severity 20.64220.9398
Severity 31.54030.8248
Severity 41.58980.6083
Severity 51.78160.6570
AUDPC32.73600.7422
r0.01060.8377
IT2.36671.4663
1 Severity 1–5: Disease severity in the first-fifth recording (%), AUDPC: area under the disease progress curve, r and IT: rate and type of infection. Dark green and dark brown colors have been used to show the most resistant and susceptible groups to blasts, respectively. Lighter colors have less sensitivity and resistance.
Table 7. The mean of traits related to resistance to leaf blast disease in the most susceptible and resistant rice genotypes in two years.
Traits Related to Resistance to Leaf Blast Disease
GenotypesSeverity 1 1Severity 2Severity 3Severity 4Severity 5AUDPCrIT
Most resistants 0.001 ± 0.0010.006 ± 0.0020.097 ± 0.0080.149 ± 0.0090.241 ± 0.0112.611 ± 0.1440.001 ± 0.0000.383 ± 0.024
Most susceptibles 0.050 ± 0.0160.789 ± 0.1642.541 ± 0.5064.863 ± 0.9129.458 ± 1.44690.633 ± 15.6860.028 ± 0.0024.272 ± 0.217
1 Severity 1–5: Disease Severity in the first-fifth recording (%), AUDPC: area under the disease progress curve, and r and IT: rate and type of infection.
Table 8. The predicted selection differentials and selection gain for traits related to resistance to leaf blast disease in the MGIDI (multi-trait genotype-ideotype distance) analysis.
GenotypesXoXsSDSD%h2SGSG%Sense
Severity 1 10.0100.005−0.005−46.1130.461−0.002−21.264decrease
Severity 20.1290.062−0.067−51.9480.539−0.036−28.005decrease
Severity 30.5210.169−0.352−67.5800.810−0.285−54.767decrease
Severity 40.9000.283−0.617−68.6050.808−0.499−55.456decrease
Severity 51.7270.846−0.880−50.9950.588−0.518−30.007decrease
AUDPC16.9244.665−12.259−72.4370.844−10.346−61.131decrease
r0.0060.003−0.004−54.6880.706−0.002−38.629decrease
IT1.4200.560−0.861−60.5910.843−0.726−51.106decrease
mean −59.120 −1.552−42.546
1 Severity 1–5: Disease Severity in the first-fifth recording (%), AUDPC: area under the disease progress curve, r, and IT: rate and type of infection. Xo: The original population mean. Xs: The mean of selected genotypes, SD, and SD%: The selection differential and selection differential in percentage, respectively, h2: The broad-sense heritability after selection, SG and SG%: The selection gains and selection gains in percentage, respectively, sense: The desired selection sense.
Table 9. The mean of traits related to the rice leaf blast RILs population, resistant and susceptible control varieties, and parents of the population in 2021 and 2022.
Resistant Control Varieties Susceptible Control Varieties
YearTraitRILsMean 15A18A19ANona BokraDorfakNedaIR28 2SH 3HashemiDomsiah26ASadri
Severity 1 10.0050.0000.0000.0000.0000.0000.0000.0000.0000.0000.0000.0000.000
2021Severity 20.0670.0000.0000.0000.0000.0000.0000.0000.5191.4990.0000.0000.000
Severity 30.4170.1540.0350.0330.1200.0000.0110.0181.1062.7760.2971.7200.867
Severity 40.9820.0430.0690.1540.1800.0580.3420.0208.0026.8341.1754.4362.604
Severity 52.4610.2800.1920.4911.0210.2960.6400.24517.0439.0984.38416.44523.262
AUDPC18.8982.3631.3993.0295.6781.4444.7101.116127.037109.60325.646100.653105.709
r0.0070.0020.0010.0020.0060.0020.0020.0020.0580.0140.0190.0460.076
IT1.6970.3330.6671.0001.3330.6671.3331.0005.0005.3334.6676.3335.667
2022Severity 10.0120.0000.0000.0000.0140.0000.0000.0000.0830.0000.1670.2000.177
Severity 20.1660.0000.0280.0080.1100.0330.0000.0000.8550.4840.6972.1490.369
Severity 30.5570.1890.1440.1550.5250.1000.2330.1752.8551.7891.3897.2360.933
Severity 40.6650.2390.2360.2050.9680.1470.2760.2653.8973.1101.3669.4230.887
Severity 50.6340.1390.1820.1350.4290.1180.2730.1803.8744.7612.14010.0640.544
AUDPC11.9773.4833.4943.05712.7752.3704.5173.70967.10154.34232.237167.58117.850
r0.0040.0020.0020.0020.0060.0010.0020.0020.0220.0200.0080.0460.005
IT1.0310.6670.3330.3330.6670.3330.6670.3332.6673.3332.3334.3332.000
1 Severity 1–5: Disease Severity in the first-fifth recording (%), AUDPC: area under the disease progress curve, r and IT: rate and type of infection, 2, 3 IR28, and SH (Shahpasand) are resistant and susceptible parents of the RIL population, respectively.
Disclaimer/Publisher’s Note: The statements, opinions and data contained in all publications are solely those of the individual author(s) and contributor(s) and not of MDPI and/or the editor(s). MDPI and/or the editor(s) disclaim responsibility for any injury to people or property resulting from any ideas, methods, instructions or products referred to in the content.

