Article

Application of a High-Density Single Nucleotide Polymorphism Genetic Map in Mapping Quantitative Trait Loci of Early-Maturing Traits in Upland Cotton

1
College of Life Sciences, Xinyang Normal University, Xinyang 464000, China
2
Zhengzhou Research Base, National Key Laboratory of Cotton Bio-Breeding and Integrated Utilization, Zhengzhou University, Zhengzhou 450001, China
3
National Key Laboratory of Cotton Bio-Breeding and Integrated Utilization, Institute of Cotton Research, Chinese Academy of Agricultural Sciences, Anyang 455000, China
4
College of Agronomy and Biotechnology, China Agricultural University, Beijing 100193, China
*
Authors to whom correspondence should be addressed.
Agronomy 2023, 13(11), 2716; https://doi.org/10.3390/agronomy13112716
Submission received: 10 September 2023 / Revised: 20 October 2023 / Accepted: 24 October 2023 / Published: 28 October 2023
(This article belongs to the Special Issue Analysis of Complex Traits and Molecular Selection in Annual Crops)

Abstract

:
(1) Background: Mapping QTLs for early-maturing traits is necessary for the development of early-maturing variety breeding. (2) Methods: In this research, a high-density genetic map (HDGM) was constructed using an F2 population with 100 individuals and single nucleotide polymorphism markers (SNPs) developed using the genotyping-by-sequencing (GBS) method. (3) Results: The HDGM, which covered a total distance of 3167.14 cM, harbored 5454 SNPs with an average marker interval of 0.58 cM. In total, 18 QTLs for four early-maturing characters were detected and explained 11.6–46.4% of phenotypic variation (PV). Two QTLs of the whole growing period (WGP) and height of the node of the first fruiting branch (HNFFB) were identified as stable QTLs. In total, 125 candidate genes were identified in the confidence intervals of these stable QTLs. Presumably, Gh_D03G0857 may play an important role in regulating earliness. (4) Conclusions: This research will provide new information about fine mapping of QTLs for earliness traits, molecular marker assisted selection (MAS) of earliness traits, and pyramiding breeding as well.

1. Introduction

Allotetraploid upland cotton (AD)1 (Gossypium hirsutum L., 2n = 4x = 52) with a genome size of 2.5 Gb is a very important cash crop in the world, providing most of the natural fiber for the textile industry [1,2]. With the growth of the industrial economy, and national planning and construction, the area of arable land available for agriculture is decreasing and the competition between grain and cotton for land is becoming increasingly prominent [3]. The area of arable land used to plant cotton shows a downward trend, and cotton production is facing a very serious situation in China [4]. Short-season cotton is one type of upland cotton, and its obvious characteristics are a short growth period, a fast growth and development process, and early maturation [5]. These characteristics are not only beneficial for the innovation of the cultivation system and the increase of the multiple crop index, but are also effective in reducing or avoiding the loss caused by the natural environment of low average temperature or short frost-free season. Therefore, earliness is one of the main breeding objectives and the key to improving cotton breeding.
The study on the genetic rule of characters related to earliness can provide a theoretical basis for breeding and improving early-maturing characters in upland cotton. The research results reported by Zhao et al. 1974 showed that broad-sense heritability of the time of a 50% “square” appearing, the time of 50% blossoming, the time of first boll opening, the time of 50% boll opening, the height of the node of the first fruiting branch (HNFFB), and the percentage of first picking was 66.1%, 57.3%, 55.2%, 73.3%, 68.7%, and 81.6%, respectively, and the time of a 50% “square” appearing and the time of 50% boll opening had a very significant correlation with the percentage of first picking [6]. The research results reported by Niu 1981 showed that broad-sense heritabilities of the whole growth period (WGP), plant height (PH), internode length of the main stem, and node of the first fruiting branch (NFFB) were 71.14–86.71%, 60.86–84.67%, 41.21–77.35%, and 33.98–53.75%, respectively, and NFFB had a very significant correlation with PH [7]. Yu and Huang 1990 performed an inheritance analysis on earliness components of short-season cotton varieties in upland cotton, and the research results showed that broad-sense heritabilities of seedling stage (SS), visible bud stage (VBS), boll stage (BS), WGP, NFFB, PH, yield percentage before frost (YPBF), and boll weight (BW) were 79.55%, 3.86%, 87.44%, 78.20%, 59.74%, 59.20%, 89.13%, and 73.99%, respectively; SS, VBS, BS, NFFB, and PH had significant positive correlations with WGP, and a significant negative correlation with YPBF [8]. Studies of genetic effects showed that the additive effect was significant in flowering time (FT), time of boll opening, NFFB, PH, WGP, and BS, and that the dominant effect was also significant in NFFB and PH, and that YPBF was controlled by significant dominant × environment effects and additive × additive epistasis effects [9,10]. Fan 2004 studied the inheritance of the WGP, VBS, FT, boll opening, NFFB, and PH traits of short-season cotton in upland cotton and found that, except for VBS and PH traits, the genetic effects and heritability of the major genes of other traits were greater than those of polygenes; the heritability of the major genes was 30.23–66.79% and that of polygenes was 2.83–35.07% [11]. Zhao et al. 2017 studied the genetic model of PH, NFFB, HNFFB, flowering and boll-setting period (FBP), time from sowing to flowering, and WGP, and the research results showed that the presence of major genes was detected in the six traits and two pairs of major genes were detected in the WGP trait [12]. In summary, some characters, such as WGP, FT, HNFFB, NFFB, and YPBF, of the above-mentioned characters can be inherited more stably, and these characters can be used as indicator characters for short-season upland cotton breeding.
With the rapid development of DNA molecular marker techniques, researchers began to study the genetic mechanism of precocity in cotton at the molecular level, and the main works were the construction of the genetic map and mapping QTLs related to the early-maturation traits, such as SS, VBS, FT, FBP, WGP, YPBF, NFFB, HNFFB, PH, and boll opening period (BOP) [13,14,15,16,17,18,19,20,21]. Although relatively important results have been achieved from these investigations, the common defects among them were that on the genetic maps the number of markers was small, the genetic distance (GD) of adjacent markers was large, the marker density was low, the precision was poor, the reference genome was lacking, and the site information on molecular markers was scarce. Therefore, it is difficult to perform molecular assisted selection (MAS) breeding of early-maturity characters and to determine the functions of candidate genes for precocious traits in upland cotton.
The development of high-density molecular markers helps construct HDGM which can be efficiently used for mapping and cloning genes which are the genetic basis for important agronomic traits and can also be efficiently used for the breeding of MAS in cotton. Through genome assemblies in G. hirsutum [1,22,23] and 18 other cotton species [24], and high-throughput sequencing technology, it is easy and inexpensive to develop SNP markers for the construction of HDGMs, which are used to efficiently map QTLs of important agronomic traits. Restriction site-associated DNA sequencing (RAD-seq) [25] and genotyping by sequencing (GBS) [26,27], two of several high-throughput sequencing technologies, are effective and inexpensive approaches, and were utilized to construct several HDGMs with SNP markers based on recombinant inbred line (RIL) and F2 populations, which could be effectively used to map QTLs for important early-maturation traits [28,29,30]. In addition, CottonSNP63K array and F2 populations were also used to construct an HDGM which could be used to map important agronomic characters [31,32]. Using the method of genome-wide association study (GWAS), natural population, and SNP markers, WGP, PH, FT, YPBF, FBP, NFFB, and HNNFB were mapped [32,33,34,35]. In the results mentioned above, higher density molecular markers in the chromosomes in cotton were used to correlate QTLs of early traits, which will further promote MAS breeding, fine mapping of QTLs determining early maturity, cloning, and functional studies of genes related to early traits in upland cotton.
Here, an F2 family, containing 100 individuals, and its F2: 3 family were developed from two upland cotton lines, vsp and TM-1. We attempted to use the F2 population to construct an HDGM to identify QTLs for precocious traits, and possibly candidate genes for WGP and HNNFB traits. Finally, 100 individuals in the F2 population were genotyped using 5454 SNP markers on the HDGM. This map was utilized to identify QTLs for FT, WGP, NFFB, and HNFFB across two environments.

2. Materials and Methods

2.1. Plant Materials and Mapping Populations

The upland cotton line TM-1 (genetic standard line) and virescent mutant by space mutation (vsp) were selected as crossing parents [36,37]. The vsp was obtained by space mutagenesis of Zhongmian Suo 58 seeds (CCRI58). CCRI58, an early-maturing cotton variety, was developed from the cross (SGKZhong27 × 92-047) [38]. In 2015, an intraspecific F2 population including 100 plants was developed by crossing TM-1 as a female with vsp as a male parent and self-producing F1 plants in the winter field in Sanya, Hainan Province, China [39]. In 2016, F2:3 was developed by selfing the 100 plants of the F2 population.

2.2. Field Experiments and Phenotypic Observations

In 2015, the three cotton lines (TM-1, CCRI58, vsp) and the F2 population were planted in the experimental field in Anyang, China (36°08′ N, 114°48′ E). In field experiments, the three cotton lines TM-1, CCRI58, and vsp were planted sequentially in adjacent plots. At least 20 plants were planted in each of the three cotton lines and at least 10 individuals were selected to detect the FT (days from sowing to first flowering), WGP (days from sowing to first boll opening), and NFFB. In 2016, the F2:3 family and the three cotton lines were cultivated under the same environmental conditions in Anyang, China (36°08′ N, 114°48′ E). Field experiments followed a complete block design with three biological replications. FT (days from sowing to first flowering), WGP (days from sowing to first boll opening), NFFB, and HNFFB were investigated. At least five plants in the three cotton lines for each replicate were randomly selected and used to investigate the four traits; the average was used in one replicate. In the F2 family, a single plant was investigated. In the F2:3 family, three independent biological replicates were carried out and each replicate included at least 10 plants.

2.3. DNA Extraction

The modified CTAB method was used to isolate genomic DNA from young leaf tissues of the two parents and the 100 individuals in the F2 population [40,41], and the method described by Dong et al. 2018 [42] was utilized to detect the concentration, purity, contamination, and degradation of extracted DNA.

2.4. GBS Library Construction and Illumina Sequencing

The GBS technique was used for the library construction of the two parents (vsp and TM-1) and 100 F2 progeny. After the distribution and number of restriction enzyme cutting sites were evaluated, various combinations of endonucleases were used to cut the reference genome of Gossypium hirsutum L. [1]; the genomic DNA of the samples was digested with MseI, NlaIII, and EcoRI endonucleases (New England Biolabs, Ipswich, MA, USA). The digested genomic DNA was then amplified in multiplex and 375–400 bp fragments were selected to construct the GBS library. Paired-end sequencing (PE) 150 was performed using the Illumina HiSeq TM2500 platform (Illumina, San Diego, CA, USA). The specific steps of the GBS refer to the method reported by Zhou et al. 2016 [43] and Zhang et al. 2016 [44].

2.5. SNP Development

To obtain clean data, raw paired reads with adapter contamination, low-quality bases, and unmeasured bases were removed in accordance with quality control (QC) standards. QC procedures were as follows: (1) removing reads with adapters; (2) removing reads with >50% bases having low quality (Q ≤ 5); and (3) removing reads with ≥10% unidentified nucleotides (N). By using BWA software (version: 0.7.12), clean reads of all samples were aligned to the reference genome [1,45]. Using SAM Tools software (version: 1.2), alignment files were converted to BAM files and alignment results were sorted [46]. The Perl script was used for the statistics of alignment rate and coverage. The reads that were aligned to a unique location on the reference genome were selected for subsequent analysis by filtering the results of the BWA alignment. SNP calling was carried out for each sample using GATK software (version: 3.4) [47] to detect SNPs between the TM-1 line and the vsp line, and to genotype 100 individuals from the F2 population, and the base support number of SNP was no less than 3 and no more than 1000. The segregation patterns of the SNPs included nn × np, lm × ll, hk × hk, ef × eg, cc × ab, ab × cd, ab × cc, and aa × bb.

2.6. Genetic Map Construction

The SNPs with aa × bb segregation pattern were used to construct the genetic map. These genetic markers were further screened by the following standards: (1) remove base types that were not present in the parents as a result of the progeny genotyping; (2) remove SNPs with integrity < 75% of all offspring; and (3) remove SNP markers with segregation distortion (p < 0.05). The SNP markers were sorted and divided into each LG according to the chromosomes of the reference genome. JoinMap® 4.0 and Perl SVG (https://metacpan.org/pod/SVG) were used to build the linkage map [48].

2.7. QTL Mapping

Based on the linkage map and the phenotypic data, QTLs were detected using WinQTLCart2.5 [49]. The permutation test of the MapQTL software (version: 5.0) was used to determine the logarithm of odds (LOD) thresholds for QTLs. A LOD threshold of 2.5 was utilized to declare the presence of QTLs. Composite interval mapping (CIM) was used to detect any significant association between marker loci and phenotypic traits in the data sets [50,51].

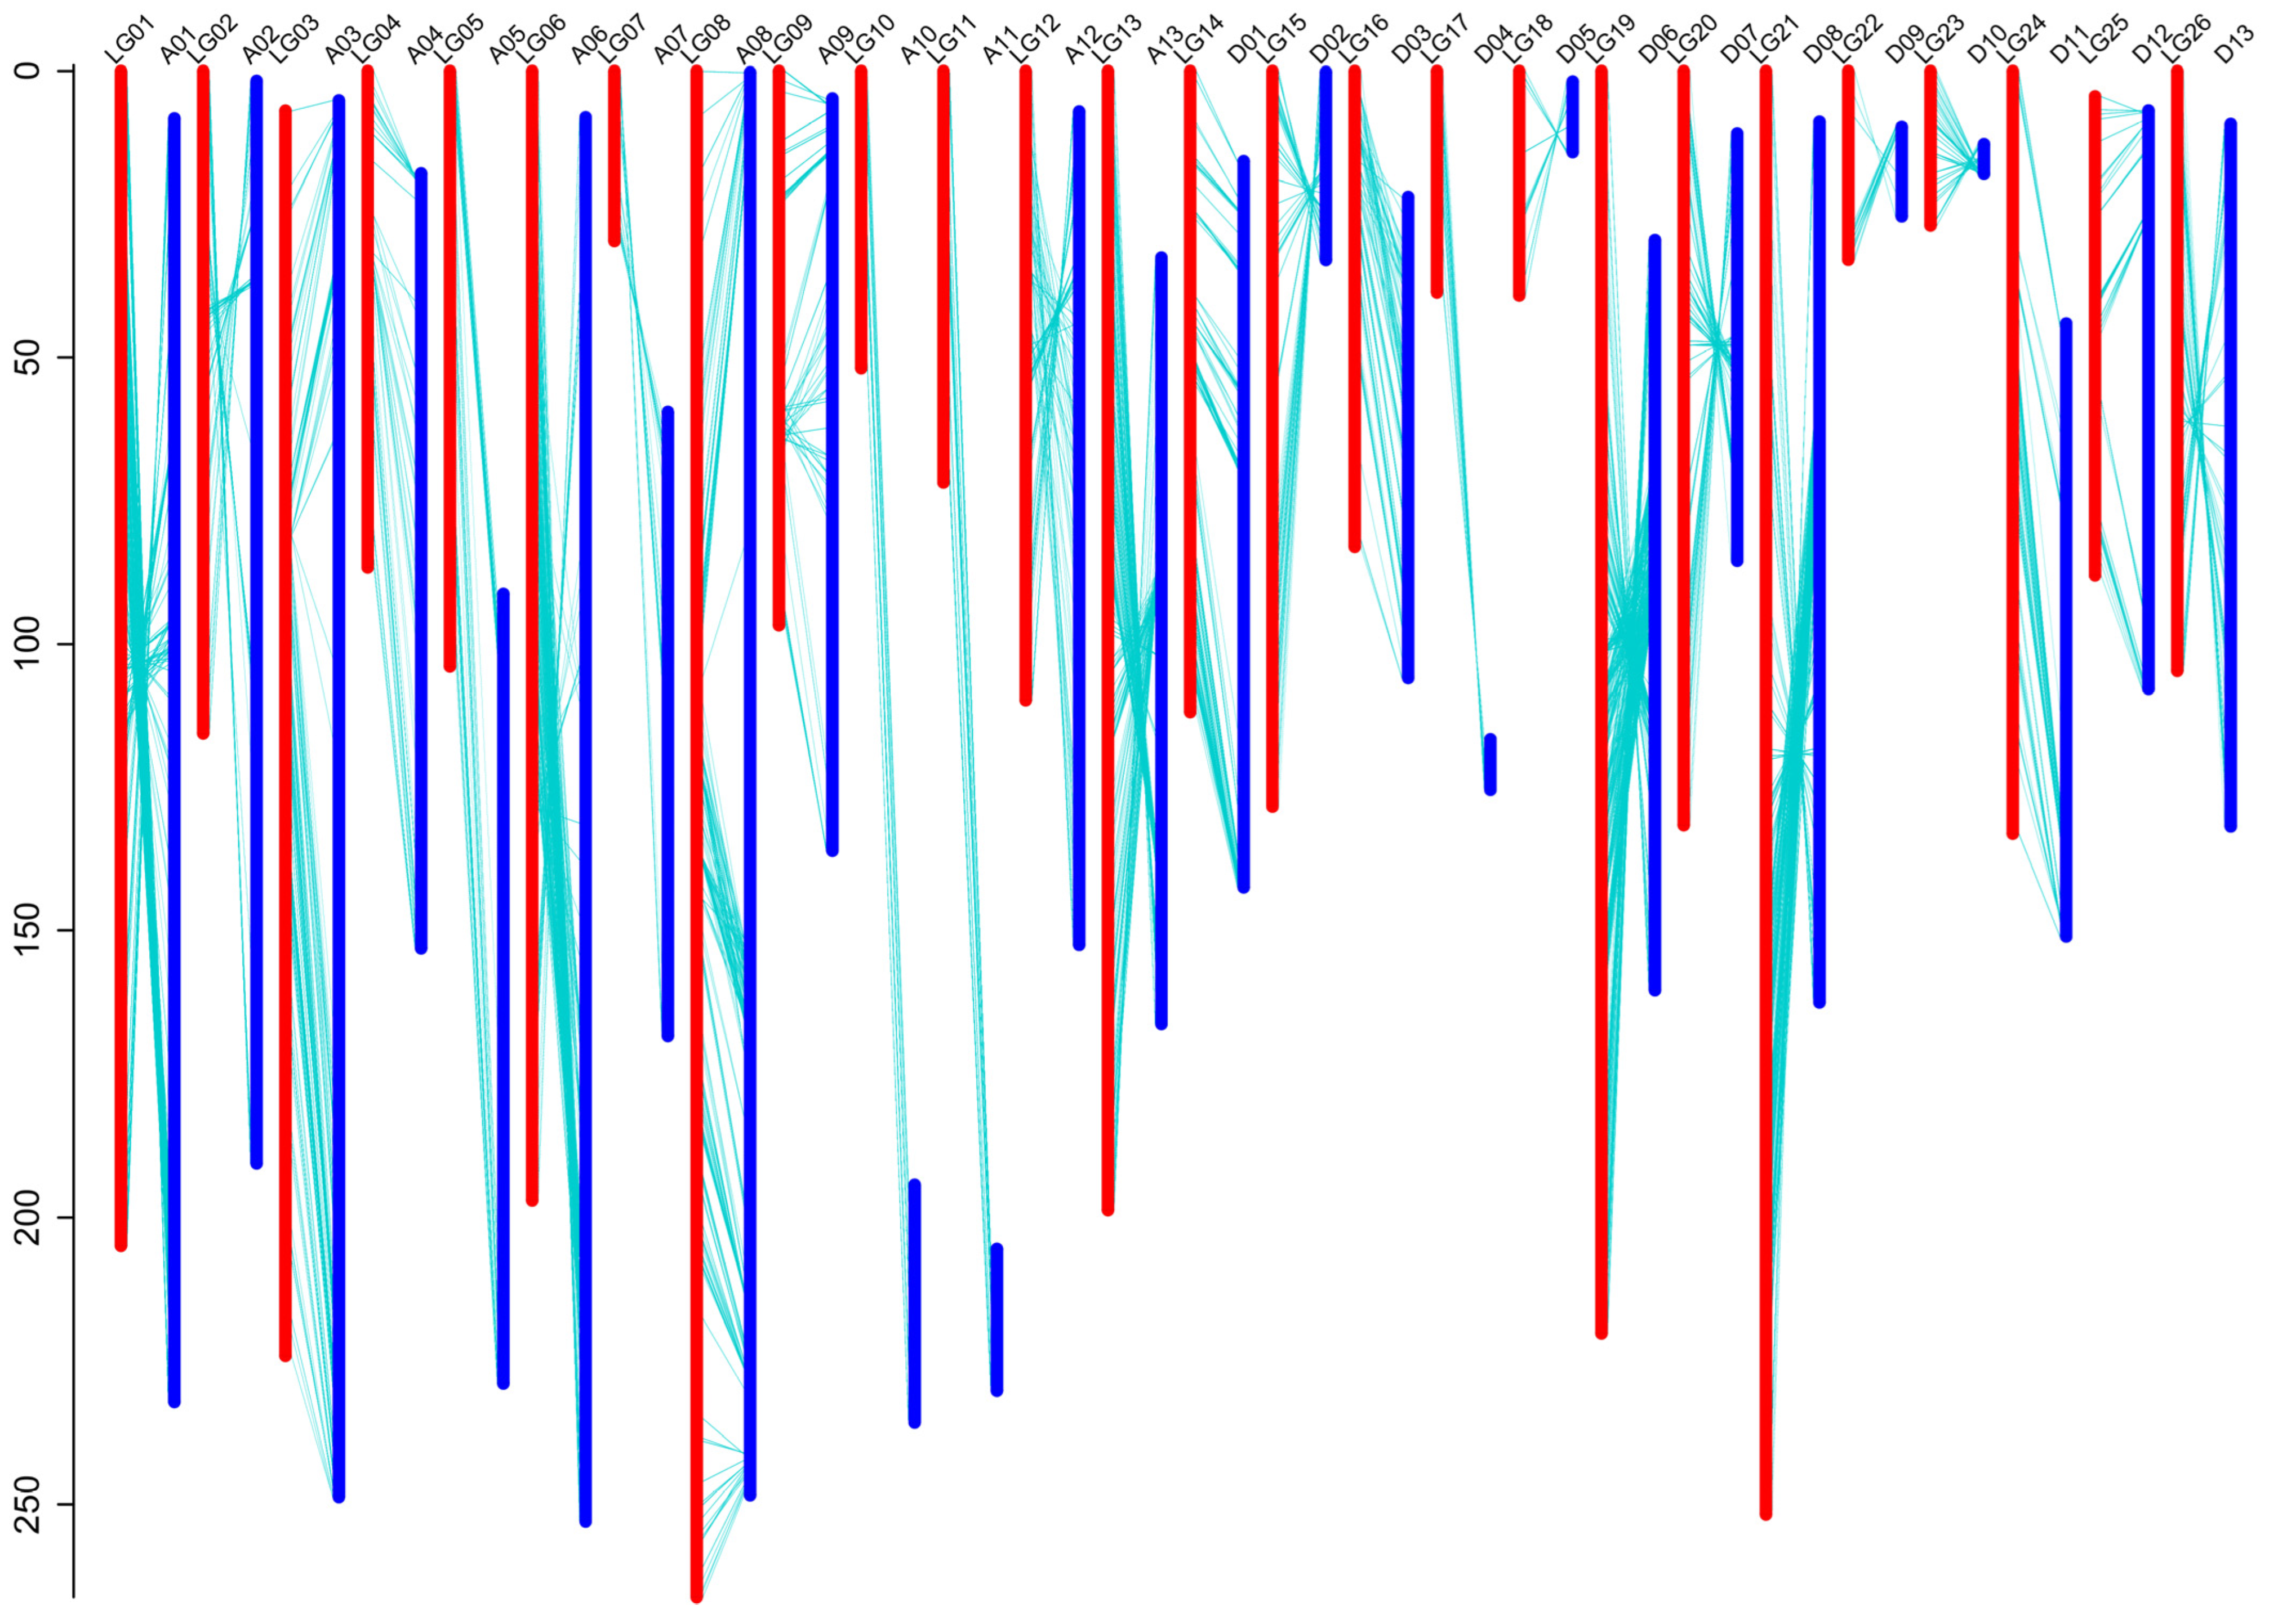
2.8. Comparison of the Physical Positions of SNP Markers Linked to QTLs

The 200 bp DNA sequences flanking the SNP markers were selected from the reference genome [1,22] using BLAST (NCBI). The selected DNA sequences were mapped on the reference genome in the upland cotton [23], and the subject identification (ID) corresponding to the query ID was identified using the selection criteria with the highest percentage identity, the longest alignment length, the minimum e-value, and the highest bit score.

2.9. Candidate Gene Annotation

The SNPs that flank the confidence intervals, including QTLs detected in the F2 and F2:3 populations, were used to identify candidate genes. According to the physical location of these markers, the identifications of the candidate genes were obtained and the coding sequences (CDS) of the candidate genes were extracted from the reference genome [1]. A gene ontology (GO) analysis was carried out to categorize candidate genes [52]. The hypergeometric test was carried out and the Benjamini and Hochberg correction was performed for the FDR correction; the terms were considered enriched terms according to the corrected p-value < 0.05.

3. Results

3.1. Phenotypic Characteristics of Traits Related to Early Maturity in the Two Parents, the F2 Population, and the F2:3 Population

On 25 May 2015 and on 19 May 2016, the three cotton lines were grown in the experimental fields in Anyang, China and the traits FT, WGP, NFFB, and HNFFB in TM-1, CCRI58, and vsp were analyzed (Supplementary File S1). The results of the phenotypic analysis showed that FT, WGP, NFFB, and HNFFB did not have obvious differences between CCRI58 and vsp, but significant differences were observed between TM-1 and CCRI58 or between TM-1 and vsp (Table 1). Therefore, TM-1 and vsp can be used to construct genetic populations that were used to map QTLs of early-maturity traits.
Significant variation in FT, WGP, NFFB, and HNNFB traits was revealed in the F2:3 and F2 populations (Table 2). The data distributions of four early-maturity traits in the F2 population and the F2:3 population are approximately symmetrical and the data distribution curve is high in the middle and low at both ends (Table 2, Figure 1). The average value of the four early-maturity traits fell between the values of the TM-1 and vsp lines; the absolute values of kurtosis and skewness for the traits of FT, WGP, and HNFFB in the F2 population, and the absolute values of kurtosis and skewness for the four traits in the F2:3 population were less than 1; the skewness value for the NFFB trait was less than 1 and the absolute kurtosis value for the NFFB was 1.21 in the F2 population (Table 1 and Table 2, Figure 1). The results of the hypothesis tests for the kurtosis coefficient and the skewness coefficient showed that the data distributions of FT and HNFFB in the population F2 and FT, WGP and NFFB in the population F2:3 corresponded to the normal distribution (Table 2). The results of a K-S test showed that the data distribution of HNFFB in the F2 population and in the F2:3 population corresponded to the normal distribution (Table 2). The results of a K-S test showed that the distribution of the FT, WGP, and NFFB data in the F2 population and in the F2:3 population was abnormal (Table 2). The results of hypothesis tests for the kurtosis coefficient showed that the WGP data in the F2 population corresponded to the normal distribution, but the hypothesis tests for the skewness coefficient did not correspond to the normal distribution (Table 2). The distribution of WGP and NFFB data in the F2 population is roughly symmetrical (Table 2, Figure 1). Pearson’s correlation coefficients of the four traits were analyzed in the F2 population and in the F2:3 population (Table 3). Except for the correlation coefficient between the WGP in the F2 population and the HNNFB in the F2:3 population, other correlation coefficients were positively correlated with each other (Table 3). The above-mentioned results showed that the data can be used for QTL mapping.

3.2. Genotyping by Sequencing (GBS)

In total, 152.20 Gb of clean data containing 922.02 Mb of clean reads from 100 individuals and two parents were obtained using GBS and the Illumina HiSeq TM2500 platform; each of the pair reads was approximately 150 bp (Table S1). Among these clean bases, on average 94.94% of them were of high quality with Q20 and 87.77% of them were of high quality with Q30; effective rate and error rate of the bases were 99.58% and 0.04%, respectively; guanine cytosine content of the bases was 36.58% (Table S1). The sequencing depth corresponded to 9.64-fold in the 100 progeny of the F2 population, 30.99-fold in the vsp cotton line, and 30.91-fold in the TM-1 cotton line (Table S1). The raw sequence data reported in this paper have been deposited in the Genome Sequence Archive (Genomics, Proteomics & Bioinformatics 2021) [53] in the National Genomics Data Center (Nucleic Acids Res 2022) [54], China National Center for Bioinformation/Beijing Institute of Genomics, Chinese Academy of Sciences (GSA: CRA012341) and are publicly accessible at https://ngdc.cncb.ac.cn/gsa accessed on 26 October 2023.
Clean reads were aligned with the reference genome to call SNP [1]. The mean mapping rate of clean reads was 99.83% in the two parents and 99.76% in the F2 progenies; the coverage (1×) and coverage (4×) were averagely 19.10% and 8.63% in the two parents, respectively, and were averagely 4.82% and 2.47% in the progenies, respectively (Table S1). The comparison results were normal, which could be used for subsequent SNP detection. In total, 94,758 polymorphic SNPs were detected between the two parents. The SNPs consisted mainly of aa × bb, nn × np, lm × ll, and hk × hk (Table 4). Among the four SNP types, the number of the aa × bb SNPs that were selected to construct the genetic map was 28,684 (Table 4).

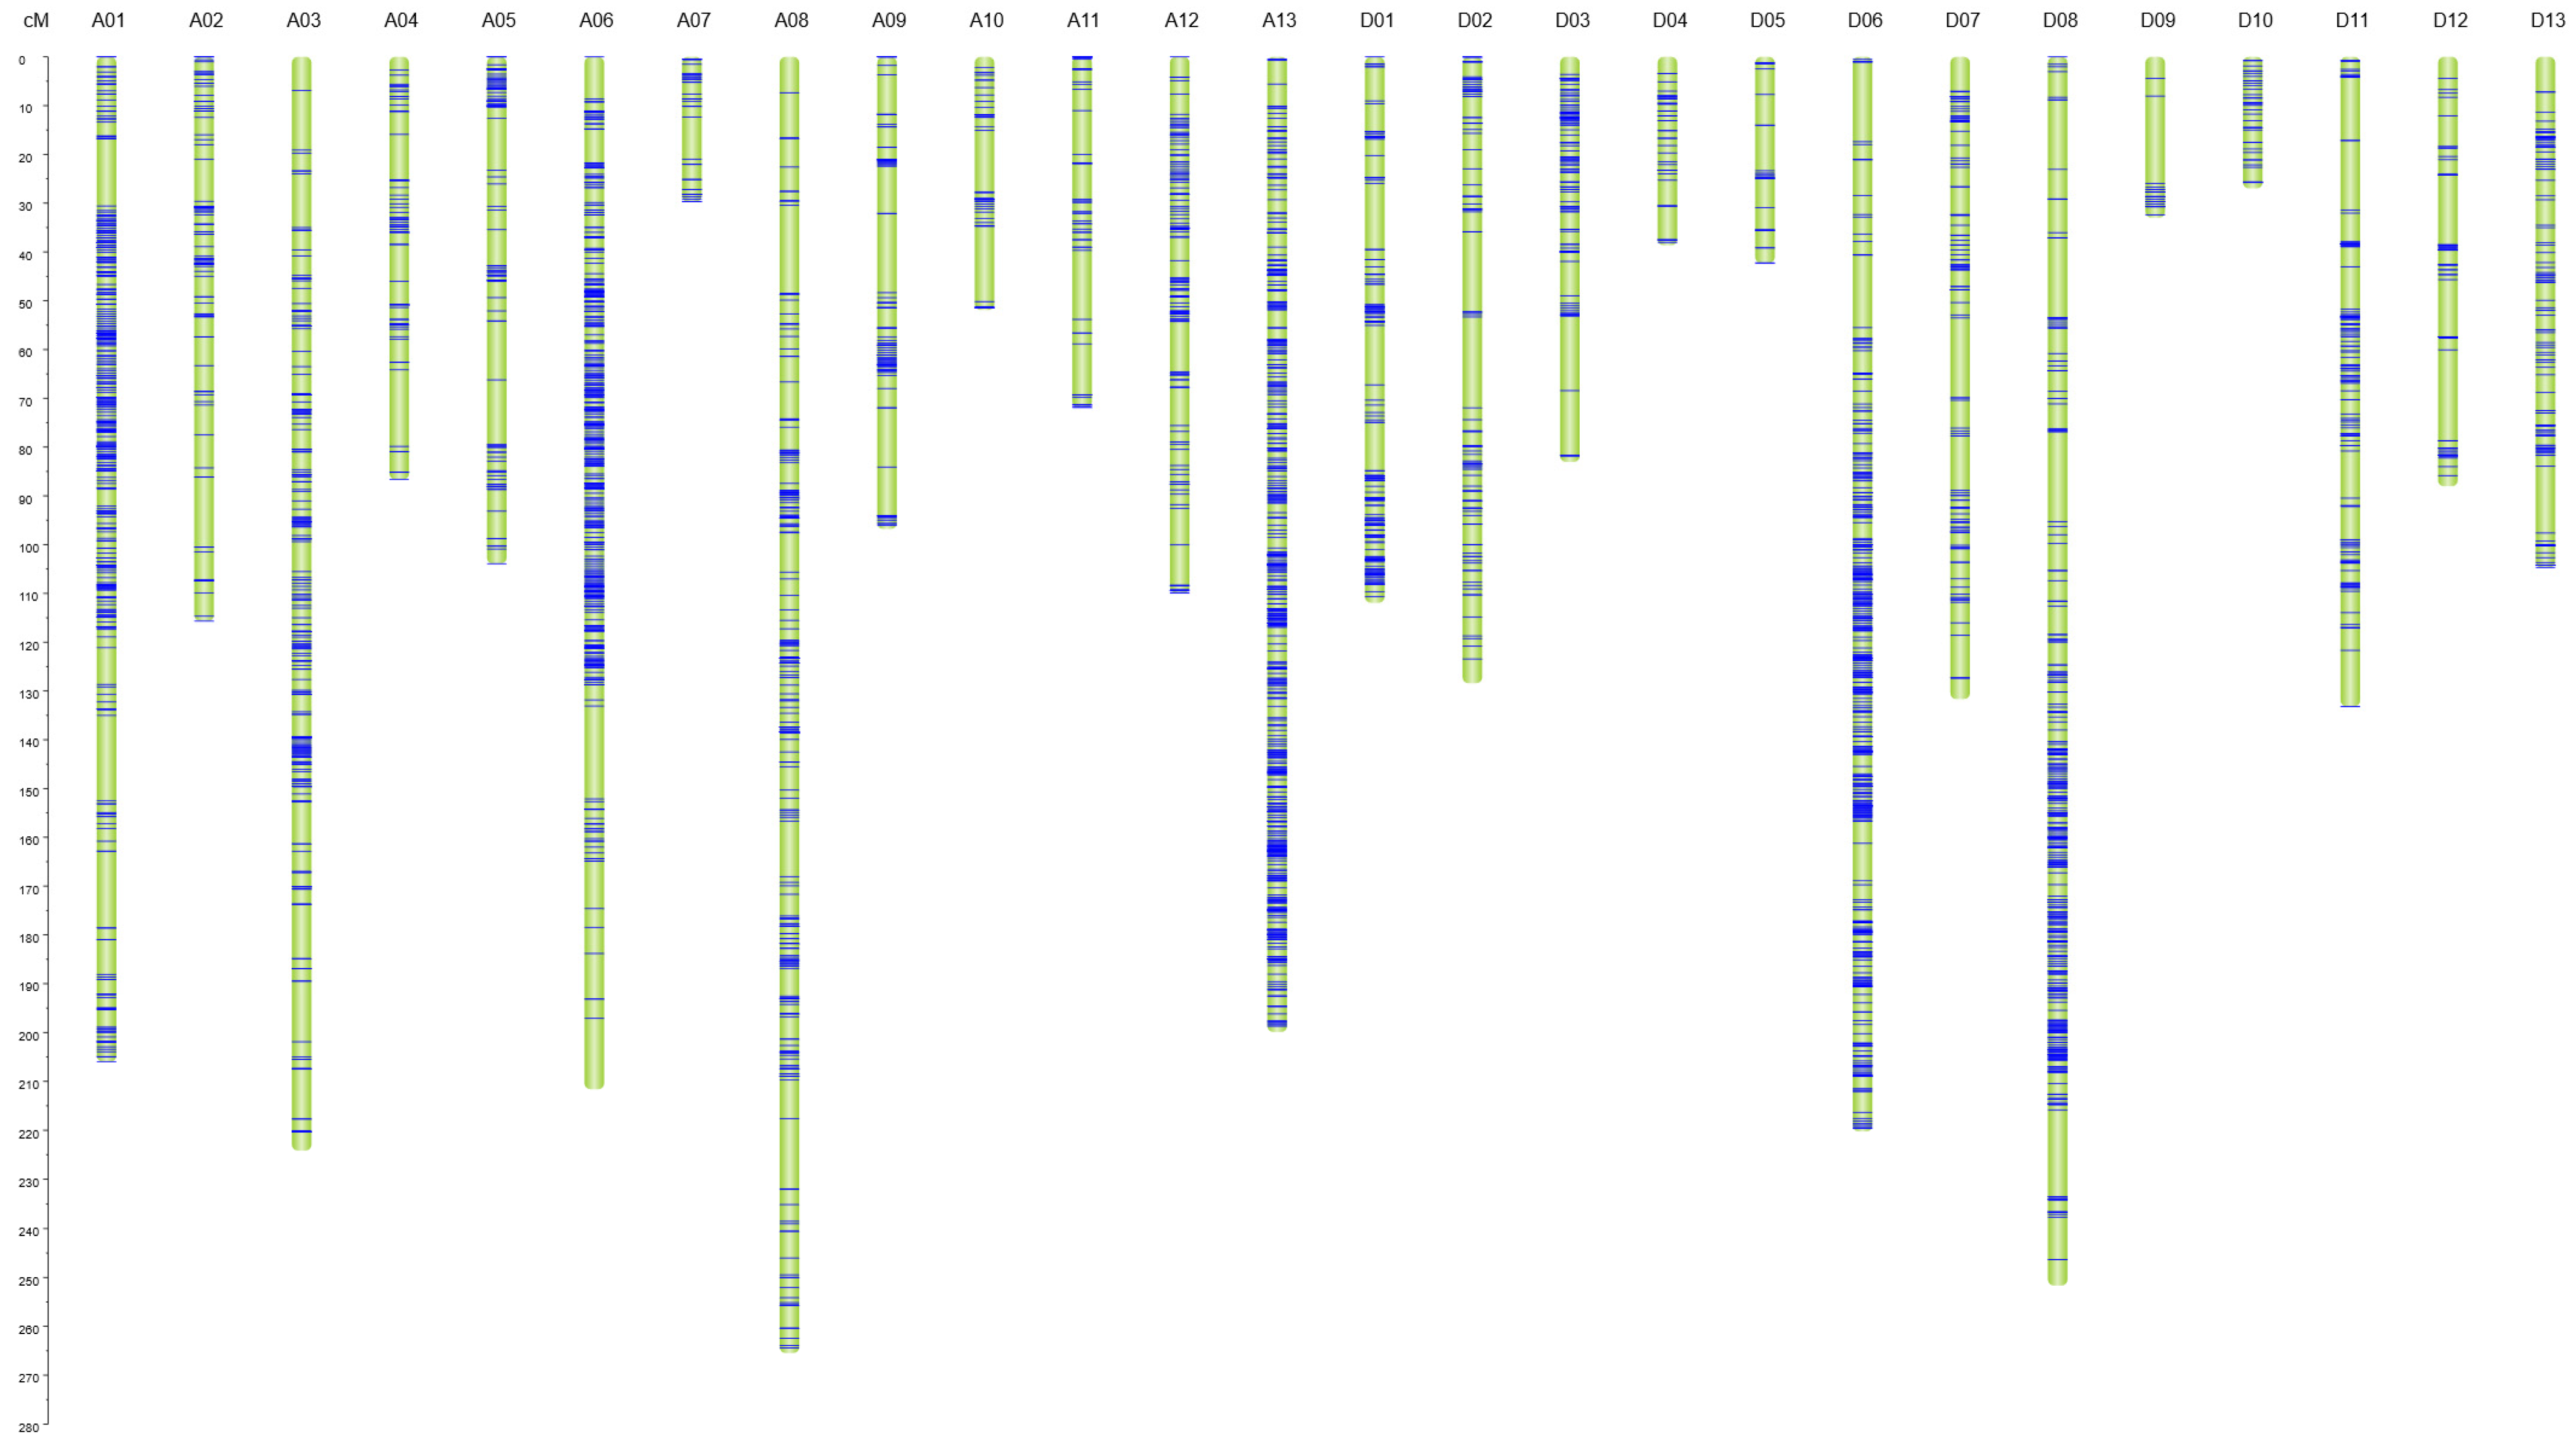
3.3. Construction of SNP-Based High Density Genetic Map

After removing abnormal base types and removing SNP markers with integrity < 75% of all offspring, 6724 SNP markers were obtained from the 28,684 SNPs detected. After removing SNPs with segregation distortion (p value < 0.05), 6072 SNPs were obtained. To eliminate the large gap of LG, 494 SNPs with segregation distortion (0.001 < p value < 0.05) and with integrity >65% and <75% of all offspring were kept. In total, 6566 SNPs could be used to build the genetic map. Then, JoinMap® 4.0 was used to sort the SNP markers, count GDs between markers, and remove SNP markers not linked to the LGs, and finally 5454 SNP markers could be utilized to construct the genetic map (Supplementary File S2). The overall length of the map with 26 LGs was 3167.14 cM, 3233 SNPs in the At subgenome and 2221 SNPs in the Dt subgenome (Figure 2, Table 5). The average GD between 5454 SNP markers was approximately 0.58 cM (Figure 2, Table 5). The GD of each LG ranged from 26.97 cM (LG23) to 265.47 cM (LG08), and the number of SNPs of each LG ranged from 31 SNPs on chromosome D05 to 667 SNPs on chromosome A13, with a mean of 210 SNP markers per LG (Table 5). Collinearity analysis between genetic and physical maps indicated that the linkages (LG03, LG04, LG05, LG06, LG08, LG09, LG10, LG11, LG14, LG16, LG17, LG24, and LG25) had good collinearity with the reference genome (A03, A04, A05, A06, A08, A09, A10, A11, D01, D03, D04, D11, and D12) and that the other linkage groups had partial collinearity with the reference genome in upland cotton (Figure 3, Supplementary File S2) [1].

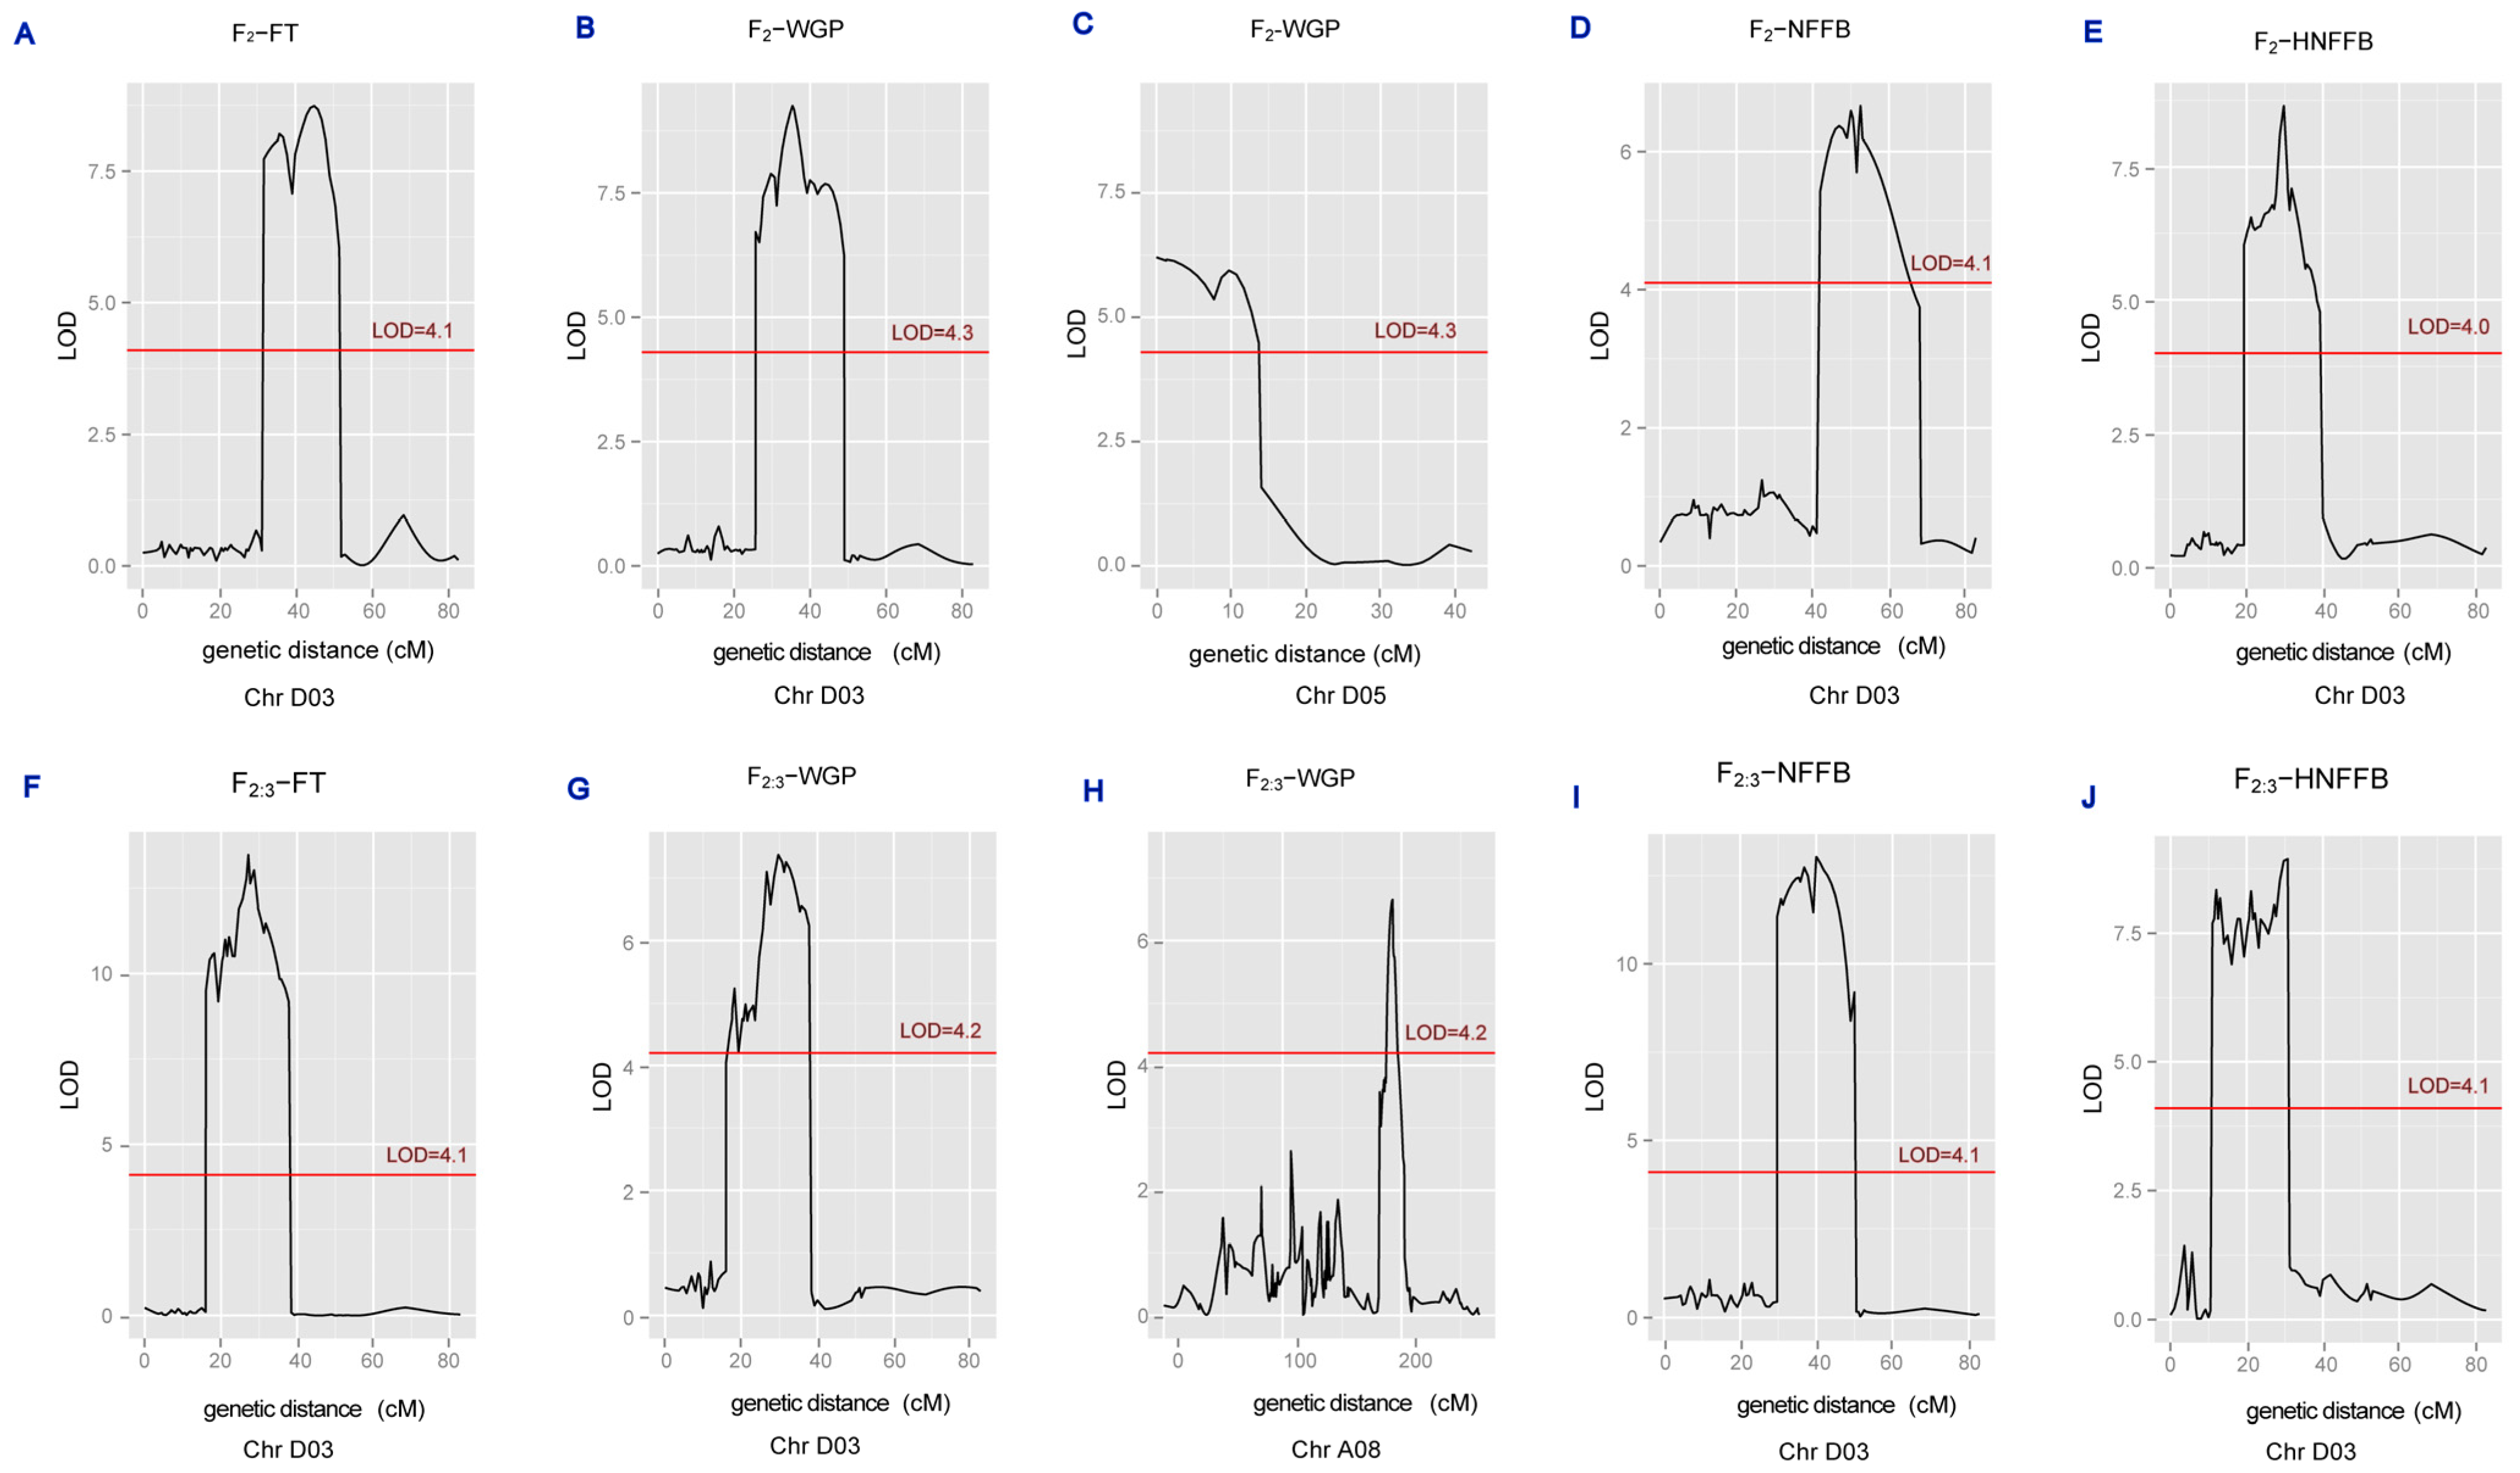
3.4. Mapping QTLs of Four Appearance Traits in the F2 and F2:3 Families

In total, 18 QTLs for WGP, FT, NFFB, and HNFFB were detected in the 26 LGs and explained 11.6–46.4% of phenotypic variation (PV); 8 QTLs were detected in generation F2 and 10 QTLs were detected in generation F2:3 (Figure 4, Table 6). All 18 QTLs accounted for more than 10% of the PV. Of all QTLs, 17 QTLs were assigned to the Dt subgenome and only 1 was assigned to the At subgenome; 15 out of all the QTLs were assigned to Chr D03. For the FT trait, the four QTLs were as follows: qFT-D03-1, qFT-D03-2, qFT-D03-3, and qFT-D03-4, which explained 35.3%, 46.4%, 30.7%, and 37.2% of the PV, respectively, with LOD scores of 10.99, 13.47, 8.21, and 8.74. For NFFB, the three identified QTLs were as follows: qNFFB-D03-1, qNFFB-D03-2, and qNFFB-D03-3, which explained 43.1%, 29.9%, and 21.4% of the PV, respectively, with LOD scores of 13.03, 9.19, and 6.66. Seven QTLs for the WGP trait were detected on the A08, D03, and D05 chromosomes; qWGP-A08-1 was located on Chr A08 and explained 15.9% of the PV, with LOD score 6.66; qWGP-D03-1, qWGP-D03-2, qWGP-D03-3, and qWGP-D03-4 were located on Chr D03 and explained 11.6%, 19.8%, 20.6%, and 27.9% of the PV, respectively, with LOD scores of 5.23, 7.10, 7.88, and 9.25; two QTLs were detected on Chr D05 and explained 23.1% and 26.5% of the PV, respectively, with LOD scores of 6.21 and 5.94. Four of the eighteen QTLs (qWGP-D03-2, qWGP-D03-3, qHNFFB-D03-3, and qHNFFB-D03-4) detected in the two environments were considered stable QTLs; moreover, the confidence interval (CI) and the physical interval showed overlap and partial overlap. In the CIs of the four stable QTLs, qWGP-D03-2 harbored 11 SNPs located between SNP mk3248 and SNP mk3258, and the markers tightly linked to qWGP-D03-2 were mk3252, mk3253, mk3254, mk3255, mk3256, and mk3257; qWGP-D03-3 harbored 11 SNPs located within the marker interval of mk3257-mk3268, the marker tightly linked to qWGP-D03-3 was mk3259; qHNFFB-D03-3 harbored 12 marks which located the interval between mk3258 and the mk3266, and the markers tightly linked to qHNFFB-D03-3 were mk3260, mk3261, mk3263, mk3264, mk3265, and mk5364; qHNFFB-D03-4 harbored 9 markers that located the interval between the mk3258 and the mk3267, and the marker tightly linked to qHNFFB-D03-4 was mk3259 (Table 6 and Table S3).

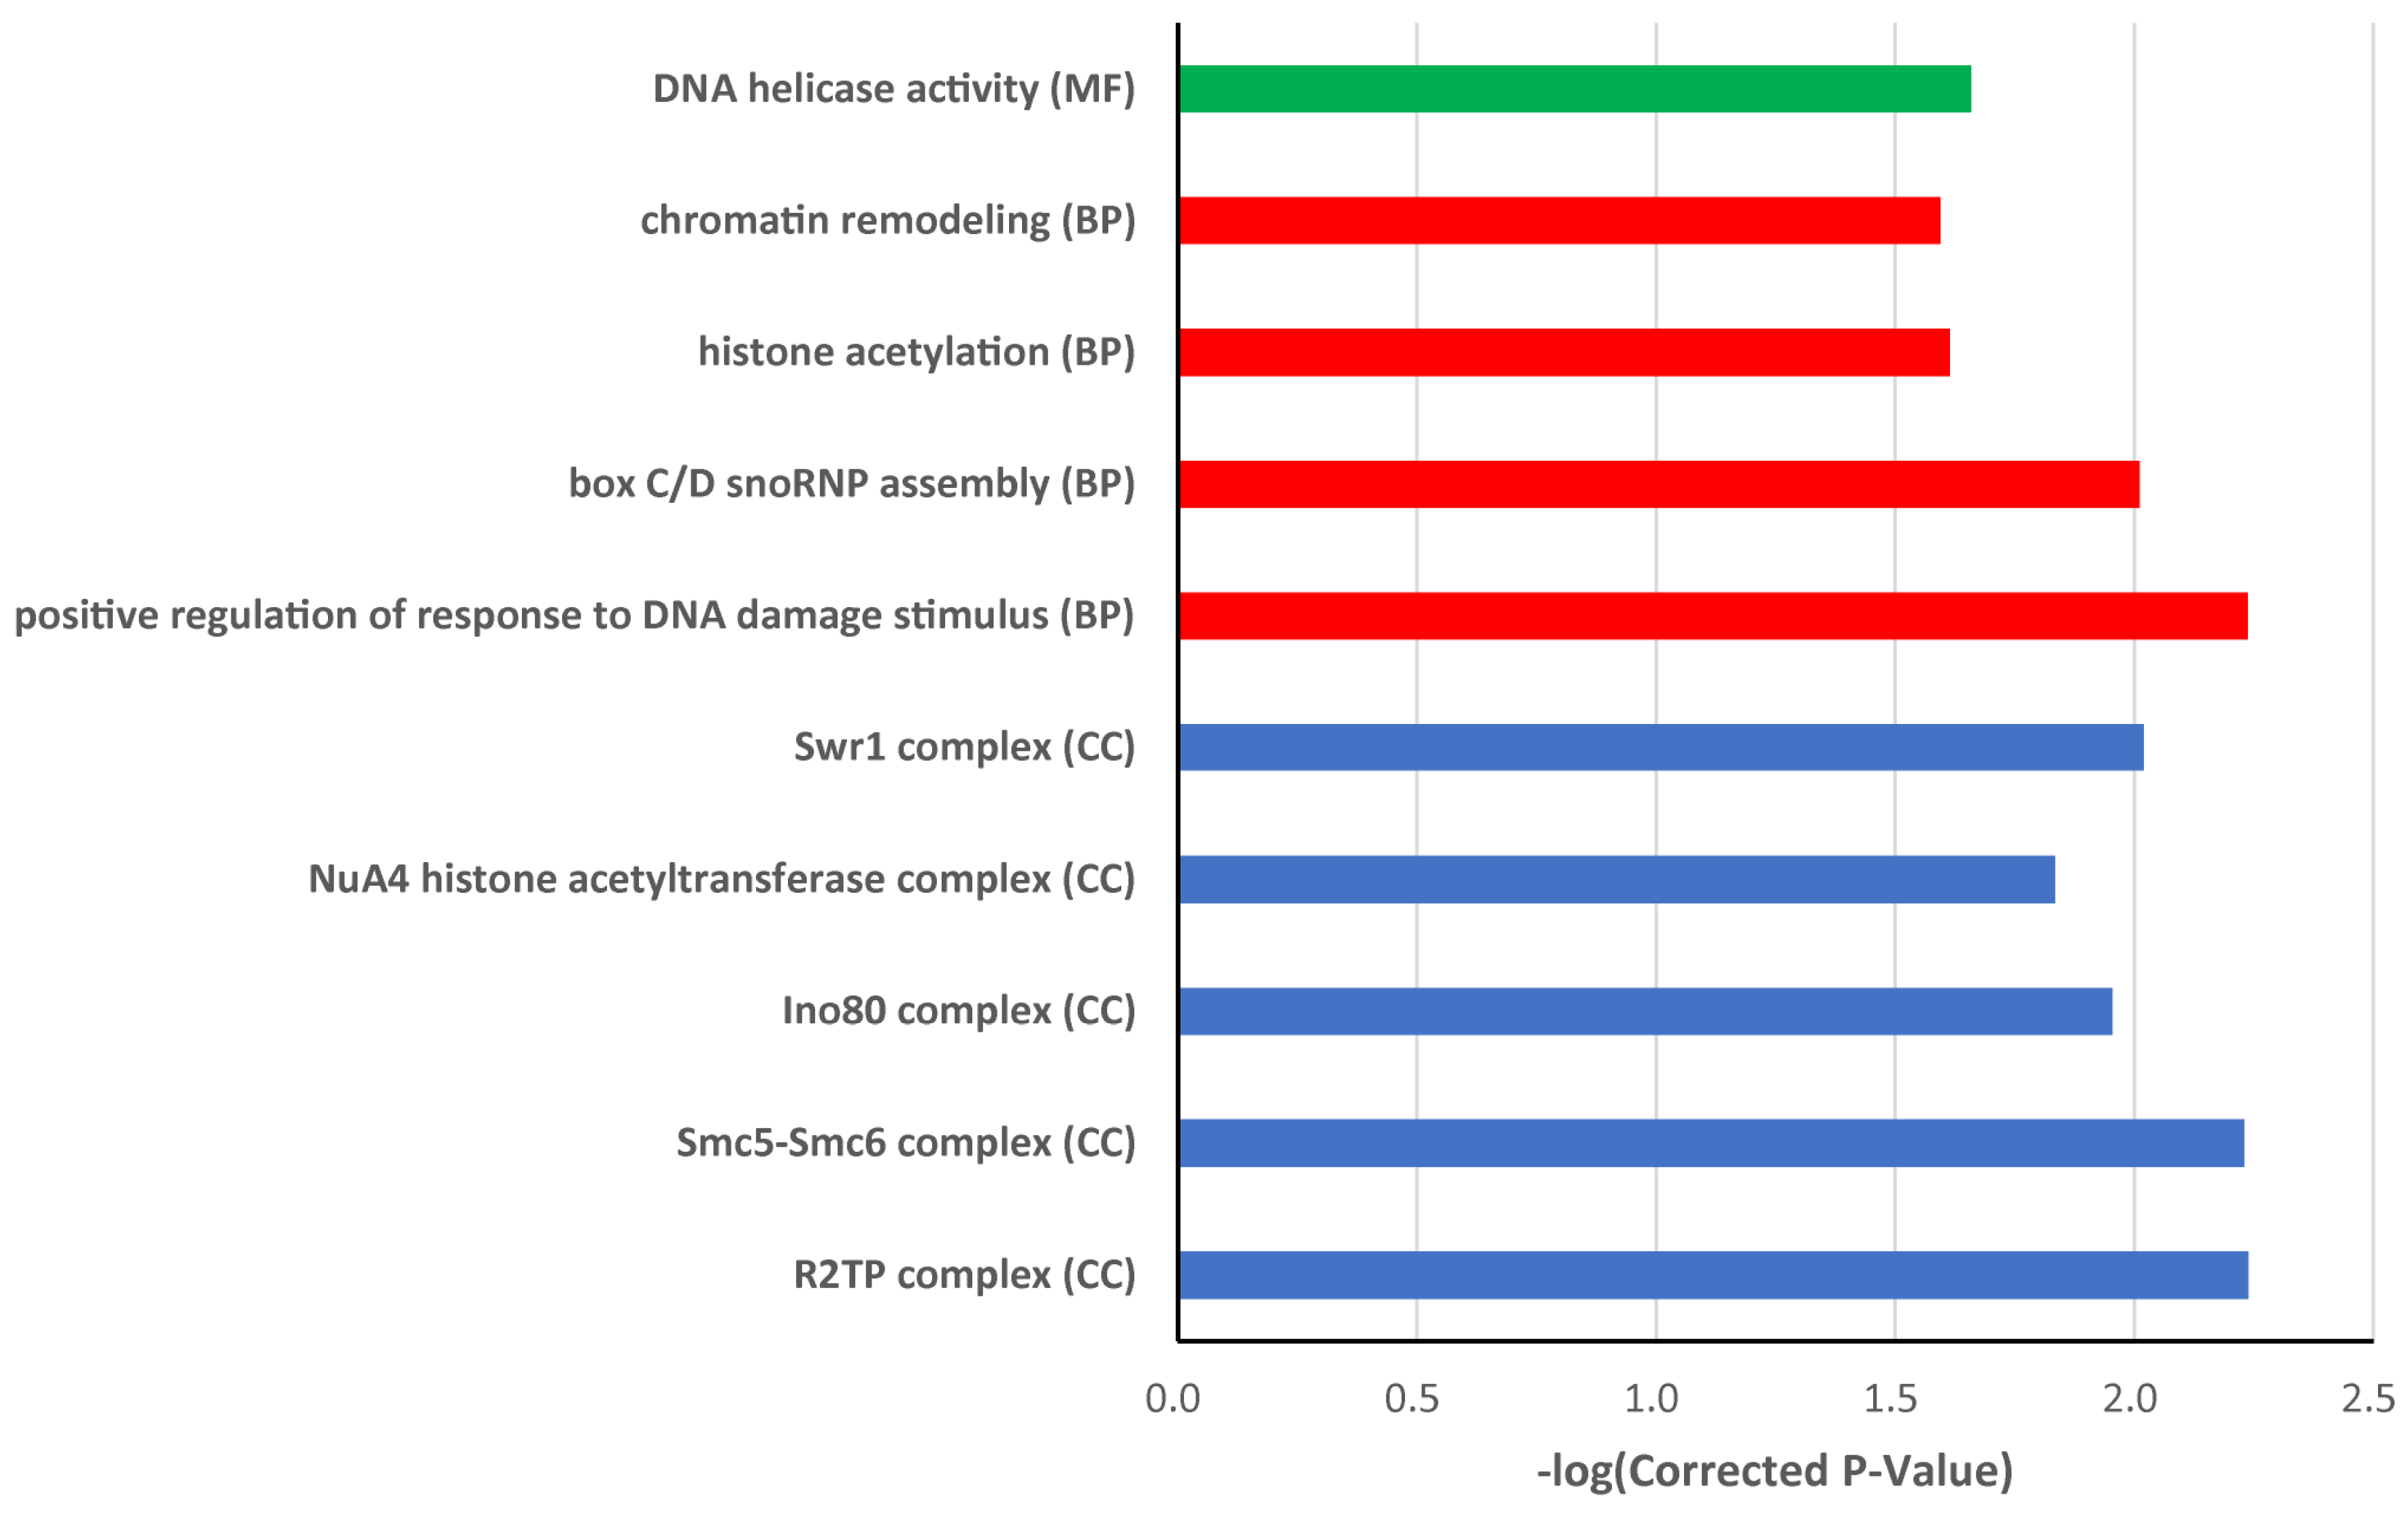
3.5. Candidate Gene Annotation

In total, 125 genes were identified within the CIs of the stable QTLs. The overlap between the CIs of qWGP-D03-2 and qWGP-D03-3 harbored 22 candidate genes; the overlap between the CI of qHNFFB-D03-3 and the CI of qHNFFB-D03-4 harbored 103 candidate genes (Figure S1). Of all candidate genes, 121 genes had annotation information and among them 114 genes had annotation information in GO (Table S2) [52]. The results of the GO analysis showed 73 genes identified in the category of cellular components (CC), 46 genes identified in the category of molecular functions (MF), and 54 genes identified in the category of biological process (BP); some of the genes had more than one function and could be divided into two or three baskets of functions. According to p-value < 0.05, 26 genes were significantly related to CC; 16 genes were significantly related to MF; and 27 genes were significantly related to BP. According to the corrected p-value < 0.05, four genes (Gh_D03G0841, Gh_D03G0842, Gh_D03G0857, and Gh_D03G0887) were significantly related to CC, which was involved in the R2TP complex, Swr1 complex, Smc5-Smc6 complex, Ino80 complex, and the NuA4 histone acetyltransferase complex; two genes (Gh_D03G0857 and Gh_D03G0887) were significantly related to MF, which was involved in DNA helicase activity; four genes (Gh_D03G0841, Gh_D03G0842, Gh_D03G0857, and Gh_D03G0887) were significantly related to BP, which was involved in positive regulation of response to stimulus of DNA damage, box C/D snoRNP assembly, histone acetylation, and chromatin remodeling (Table S2, Figure 5).

4. Discussion

For mapping QTLs of quantitative characters, parental selection is critical. In this research, the two upland cotton lines (TM-1, vsp) were selected as parents. The vsp is an early-maturing cotton line with a growth period of about 111 days and the growth period of the TM-1 was about 125 days [55]. Wang et al. 2022 reported that the growth period of TM-1 was 135 days [56]. No obvious differences were observed in the appearance traits (FT, NFFB, and WGP) between the CCRI58 line and the vsp line, and obvious differences were observed in the three traits between TM-1 and CCRI58, or between the TM-1 and the vsp [55]. The sowing to flowering, the flowering to boll opening, the PH, the boll weight and the location of the first branch all showed significant differences between the cotton line TM-1 and the cotton line vsp [55]. The phenotype value of the NFFB, the FT, and the WGP of the F2 population developed by crossing the two parents TM-1 and vsp exhibited a wide range of variations [41]. In this research, the four traits had significant differences between the TM-1 and vsp cotton lines (Table 1), and had no obvious differences between vsp and CCRI58. So, the selection of parents should be suitable.
The data distribution of quantitative characters is related to genes that control quantitative traits. For traits controlled by a few major genes or by both major genes and minor genes, the distribution of trait data does not necessarily conform to the normal distribution. In this study, based on the K-S test, only the HNFFB data distribution conformed to the normal distribution (Table 2). The reason may be that the inheritance of the traits FT, WGP, and NFFB is determined by major genes or minor polygenes [11,12]. According to the data distribution in Figure 1, NFFB traits are more likely to be controlled by a few major genes, and FT and WGP traits may be determined by both major genes and minor polygenes, and the HNFFB trait is probably determined by both a few major genes and many minor genes or by minor polygenes. In our research, the kurtosis of the data distribution of FT, WGP, and NFFB traits conforms to a normal distribution and data symmetry (Table 2, Figure 1). The data in this investigation can be used for QTL mapping [57].
To successfully map QTLs for precocious characters, it is necessary to construct genetic maps with high-density SNP markers. The assemblies of multiple cotton genomes and high-throughput sequencing can meet the need for the development of SNPs in large quantities. Compared with resequencing technology, simplified genome sequencing is a cost-effective method for the massive development of SNPs. The GBS-seq strategy, a simplified genome sequencing and an effective method based on second generation sequencing technology for high-density SNP development, has been successfully applied in a variety of species and was used in this research. Due to the genome specificity, the selection of suitable restriction endonuclease(s) is the key to making the simplified genome represent the whole genome. In this research, electron enzyme digestion was first used to evaluate the combinations of restriction endonucleases to obtain an even distribution of the cleavage sites in the reference genome [1], and eventually the combinations of MseI, NlaIII, and EcoRI were used to digest the upland cotton genome and SNP markers showed a relatively even distribution in the reference genome (Figure 6). Furthermore, the fragments digested by MseI, NlaIII, and EcoRI were connected to the P1 and P2 adapters, and the quality of sequencing data was rigorously evaluated (Table S1). These operations ensured simplified genome representation and sequencing data quality. Eventually, 94,758 SNP markers were developed and 28,684 SNPs with aa × bb type were selected to build a genetic map.
In cotton, most of the genetic maps without SNP markers had a low polymorphic rate and contained an insufficient number of molecular markers; this caused a low resolution and a low coverage of the reference genome. In most cases, possibly due to insufficient numbers and uneven distribution of molecular markers, the genetic maps have large and wide gaps, and the chromosome was divided into two or more LGs by the gap(s) [13,14,19,20]. In this research, using the SNPs mentioned above an HDGM with 5454 SNP markers was constructed, with an average GD of 0.58 cM. The resolution and coverage of the genetic map could be efficiently improved by using SNP markers. Although the number and distribution of SNP markers in the linked groups are uneven (Table 5, Figure 2), probably due to the GBS technique, the use of the aa × bb type of SNP markers with non-uniform distribution, gaps in the reference genome, and inhibition of exchange between non-sister chromatids [58], the genetic map did not contain gaps >20 cM, and the length of 98.70% of all gaps was less than 5 cM. Comparison of the position of the SNP markers between the physical map and the genetic map showed good collinearity, except for parts of several chromosomes according to the information in Figure 3, and the SNP marker positions in linkage groups and in physical maps are displayed in Supplementary File S2. In summary, HDGM with high-density SNPs could be used to map QTLs of early-maturing characters in this research.
In the results, 8 QTLs detected in generation F2 and 10 QTLs detected in generation F2:3 were mapped on chromosomes A08, D03, and D05 (Table 6). Two possible reasons for the change in the number of QTLs detected between generations F2 and F2:3 are as follows: environmental differences occurred in different years, especially temperature differences, which possibly affected the distribution of the phenotypic data; observations of phenotypic data may cause the change; earliness traits of a single individual were investigated in the F2 population and earliness traits of individuals in three biological repeats were investigated in the F2:3 population. Due to precocious traits controlled by multiple genes, only qWGP-D03-2, qWGP-D03-3, qHNFFB-D03-3, and qHNFFB-D03-4 appeared in the two environments and were considered stable QTLs; the qWGP-D03-2 in the F2:3 population corresponded to qWGP-D03-3 in the F2 population; the qHNFFB-D03-3 in the F2:3 population corresponded to qHNFFB-D03-4 in the F2 population. The intervals of the other QTLs did not overlap each other, possibly due to the differences in the data distribution of the traits under different environments (Figure 1). Using the upland cotton genome [23] as a reference genome, the physical positions of the SNPs linked to the QTLs in this study were compared with the physical positions of the SNPs linked to the QTLs reported by Jia et al. 2016 [28] and Su et al. 2016 [33]. Using the reference genome [1], SNPs linked to the four earliness traits in this research were compared with the SNPs reported by Huang et al. 2017 [32] and Li et al. 2021 [35]. The comparison results showed that some markers linked to the QTLs in this study were closely related to the reported markers linked to the QTLs of the four traits, and others had no link or had no obvious link mainly due to differences in experimental materials, selections of the reference genome and high-throughput sequencing methods (Table S3). The markers linked to qWGP-D03-1, qFT_D03-1, qFT_D03-2 and qNFFB-D03-2 were tightly linked to the reported markers linked to the loci for WGP, FT and NFFB, and qWGP-D03-3, qWGP-D03-4, qFT-D03-3, qHNFFB_D03-1, qHNNFB_D03-3, qHNNFB_D03-4 and qNFFB-D03-1 were tightly linked to the reported markers linked to the loci for WGP, FT, HNFFB and NFFB (Table S3). Markers linked to qWGP-A08-1, qWGP-D03-2, qWGP-D05-5, qWGP-D05-6, qFT_D03-4, qNFFB-D03-2, qNFFB-D03-3 and qHNNFB_D03-2 had no or no obvious link to the reported markers (Table S3). In summary, we uncover two new stable QTLs for WGP and HNFFB, new SNP markers related to the four traits, and further identified the reported QTLs for WGP, FT, and NFFB. Our study further enriched the molecular markers linked to early-maturity traits. Combined with phenotypic data of precocious traits, cotton breeding efficiency could be improved through the selection of these linkage markers.
One hundred and twenty-five candidate genes were predicted and annotated in the overlap interval (Figure S1). Among them, Gh_D03G0841, Gh_D03G0842, Gh_D03G0857, and Gh_D03G0887 caught our attention because they were significantly related to CC, BP, and MF in the GO analysis (Table S2). The functions of the four genes were annotated in TAIR, and the results showed that the function of Gh_D03G0887 was unknown. The protein encoded by Gh_D03G0841 and Gh_D03G0842 is homologous to the NSE4 encoded by AT1G51130 in Arabidopsis thaliana. The NSE4 is a component of the Smc5-Smc6 complex that positively regulates the response to a stimulus of DNA damage [59]. The protein encoded by Gh_D03G0857 is homologous to the nucleoside triphosphate hydrolase superfamily protein encoded by AT5G67630 in Arabidopsis thaliana. The nucleoside triphosphate hydrolase superfamily protein was involved in the biological processes of box C/D snoRNP assembly, chromatin remodeling, histone acetylation, and regulation of transcription by RNA polymerase II, and was a component of the Ino80 complex, NuA4 histone acetyltransferase complex, R2TP complex, and Swr1 complex, and its molecular function had ATP hydrolysis activity, ATP-dependent activity, acting on DNA, DNA helicase activity, and protein binding. Chromatin modifiers play an essential role in controlling gene expression and establishing epigenetic marks that can be inherited, and in controlling plant development, such as regulation of flowering time [60]. In Arabidopsis, homologs of components of the SWR1 complex, a member of the SWI2/SNF2 superfamily, have been reported to regulate flowering and plant development [61]. In this research, the homolog encoded by Gh_D03G0857 is a component of the SWR1 complex. So, we speculate that Gh_D03G0857 may play an important role in regulating earliness.

5. Conclusions

This research reported an HDGM constructed by using an F2 population and SNPs developed by GBS-seq. The genetic map contained 5454 SNPs and a total GD of 3167.14 cM with an average marker interval of 0.58 cM. We also identified QTLs for NFFB, FT, WGP, and HNNFB in two environments using the F2 family and the F2:3 family, and identified candidate genes for the WGP and HNNFB traits. In total, 18 QTLs for the four precocious traits were identified and in the two environments 2 were considered stable QTLs. One hundred and twenty-five candidate genes for the WGP and HNNFB traits were identified in the CIs of stable QTLs. We speculated that Gh_D03G0857 may play an important role in regulating earliness. The research results will provide significant information for further research such as fine mapping QTLs for earliness traits, gene cloning, gene functional research, MAS, and pyramiding breeding as well.

Supplementary Materials

The following supporting information can be downloaded at: https://www.mdpi.com/article/10.3390/agronomy13112716/s1, Figure S1: The physical map of the SNP markers and the candidate genes in the confidence intervals of the stable QTLs in D03 of Dt subgenome; Table S1: Information about sequencing and construction of the genetic map; Table S2: GO enrichment results; Table S3: Summary of SNP markers related to four early maturing traits and their physical position; Supplementary File S1: Data from four early traits of the three cotton lines and the populations; Supplementary File S2: Information of the genetic map and SNP markers.

Author Contributions

Conceptualization, G.M.; methodology, G.M. and H.W. (Hantao Wang); investigation, G.M. and P.C.; data curation, G.M. and F.X.; writing—original draft preparation, G.M.; writing—review and editing, G.M. and H.W. (Hantao Wang); and funding acquisition, G.M., H.W. (Hantao Wang), and H.W. (Hengling Wei). All authors have read and agreed to the published version of the manuscript.

Funding

This research was funded by the National Natural Science Foundation of China (32072112), Central Public-interest Scientific Institution Basal Research Fund (No. 1610162023003), Agricultural Science and Technology Innovation Program of Chinese Academy of Agricultural Sciences, China Agriculture Research System (CARS-15-06), and Nanhu Scholars Program for Young Scholars of Xinyang Normal University (XYNU) (2020B12).

Data Availability Statement

The data presented in this study are available on request from the corresponding author.

Conflicts of Interest

The authors declare no conflict of interest.

References

  1. Zhang, T.; Hu, Y.; Jiang, W.; Fang, L.; Guan, X.; Chen, J.; Zhang, J.; Saski, C.A.; Schefer, B.E.; Stelly, D.M.; et al. Sequencing of allotetraploid cotton (Gossypium hirsutum L. acc. TM-1) provides a resource for fiber improvement. Nat. Biotechnol. 2015, 33, 531–537. [Google Scholar] [CrossRef]
  2. Yu, S.; Zhang, L.; Feng, W. Study on Strategy of Large Scale, Mechanization, Informationization, Intelligence and Social Services for Cotton Production. Eng. Sci. 2016, 18, 137–148. [Google Scholar]
  3. Du, X. Effects of Wheat-Cotton Cropping Systems on Cotton Yield Formation and Resource Use Efficiency. Ph.D. Thesis, Nanjing Agricultural University, Nanjing, China, 2014. [Google Scholar]
  4. Shu, F. Prediction of Cotton Planting Area and Yield in China based on VAR. Cotton Sci. 2022, 44, 46–53. [Google Scholar]
  5. Yu, S.; Wang, H.; Wei, H.; Su, J. Research Progress and Application of Early Maturity in Upland Cotton. Cotton Sci. 2017, 29, 1–10. [Google Scholar]
  6. Zhao, L.; Chen, S.; Xu, S. An estimation of heritability of the indicative characters of earliness in upland cotton. Acta Genet. Sin. 1974, 1, 107–116. [Google Scholar]
  7. Niu, Y. Research of precocious hybrid second generation genetic parameters of main characters in upland cotton. Shanxi Agric. Sci. 1981, 6, 8–12. [Google Scholar]
  8. Yu, S.; Huang, Z. Inheritance analysis on earliness components of short season cotton varieties in G. hirsutum. Sci. Agric. Sin. 1990, 23, 48–54. [Google Scholar]
  9. Godoy, A.; Palomo, G. Genetic analysis of earliness in upland cotton (Gossypium hirsutum L.) Ⅰ. morphological and phonological variables. Euphytica 1999, 105, 155–160. [Google Scholar] [CrossRef]
  10. Song, M.; Yu, S.; Fan, S.; Yuan, R.; Huang, Z. Genetic Analysis of Main Agronomic Traits in Short Season Upland Cotton (G. hirsutum L.). Cotton Sci. 2005, 17, 94–98. [Google Scholar]
  11. Fan, S. Study on Inheritance of Earliness and It’s Relative Traits of Short-Season Cotton and QTLs Mapping. Ph.D. Thesis, Chinese Academy of Agricultural Sciences, Beijing, China, 2004. [Google Scholar]
  12. Zhao, S.; Pang, C.; Wei, H.; Wang, H.; Li, L.; Su, J.; Fan, S.; Yu, S. Genetic Inheritance of Earliness Traits in Upland Cotton (Gossypium hirsutum L.) Inferred by Joint Analysis of Multiple Generations. Cotton Sci. 2017, 29, 119–127. [Google Scholar]
  13. Fan, S.; Yu, S.; Song, M.; Yuan, R. Construction of Molecular Linkage Map and QTL Mapping for Earliness in Short Season Cotton. Cotton Sci. 2006, 18, 135–139. [Google Scholar]
  14. Guo, Y.; McCarty, J.C.; Jenkins, J.N.; Saha, S. QTLs for node of first fruiting branch in a cross of an Upland cotton (Gossypium hirsutum L.) cultivar with primitive accession Texas 701. Euphytica 2008, 163, 113–122. [Google Scholar] [CrossRef]
  15. Guo, Y.; McCarty, J.; Jenkins, J.; An, C.; Saha, S. Genetic detection of node of first fruiting branch in crosses of a cultivar with two exotic accessions of upland cotton. Euphytica 2009, 166, 317–329. [Google Scholar] [CrossRef]
  16. Liang, Y. Construction of Chromosome Segment Substitution Lines and Primary QTL mapping in Early-Maturing Upland Cotton. Master’s Thesis, Chinese Academy of Agricultural Sciences, Beijing, China, 2010. [Google Scholar]
  17. Cui, Q. QTL Location of Earliness and Fiber Quality in Cotton Using RILs. Master’s Thesis, Huazhong Agricultural University, Wuhan, China, 2011. [Google Scholar]
  18. Li, C.; Wang, C.; Dong, N.; Wang, X.; Zhao, H.; Converse, R.; Xia, Z.; Wang, R.; Wang, Q. QTL detection for node of first fruiting branch and its height in upland cotton (Gossypium hirsutum L.). Euphytica 2012, 188, 441–451. [Google Scholar] [CrossRef]
  19. Li, C.; Wang, X.; Dong, N.; Zhao, H.; Xia, Z.; Wang, R.; Converse, R.; Wang, Q. QTL analysis for early-maturing traits in cotton using two upland cotton (Gossypium hirsutum L.) crosses. Breed. Sci. 2013, 63, 154–163. [Google Scholar] [CrossRef]
  20. Li, C.; Song, L.; Zhao, H.; Xia, Z.; Jia, Z.; Wang, X.; Dong, N.; Wang, Q. Quantitative trait loci mapping for plant architecture traits across two upland cotton populations using SSR markers. J. Agric. Sci. 2014, 152, 275–287. [Google Scholar] [CrossRef]
  21. Liu, R.; Ai, N.; Zhu, X.; Liu, F.; Guo, W.; Zhang, T. Genetic analysis of plant height using two immortalized populations of “CRI12 × J8891” in Gossypium hirsutum L. Euphytica 2014, 196, 51–61. [Google Scholar] [CrossRef]
  22. Li, F.; Fan, G.; Lu, C.; Xiao, G.; Zou, C.; Kohel, R.J.; Ma, Z.; Shang, H.; Ma, X.; Wu, J.; et al. Genome sequence of cultivated Upland cotton (Gossypium hirsutum TM-1) provides insights into genome evolution. Nat. Biotechnol. 2015, 33, 524–530. [Google Scholar] [CrossRef]
  23. Wang, M.; Tu, L.; Yuan, D.; Zhu, D.; Shen, C.; Li, J.; Liu, F.; Pei, L.; Wang, P.; Zhao, G.; et al. Reference genome sequences of two cultivated allotetraploid cottons, Gossypium hirsutum and Gossypium barbadense. Nat. Genet. 2019, 51, 224–229. [Google Scholar] [CrossRef]
  24. Yang, Z.; Gao, C.; Zhang, Y.; Yan, Q.; Hu, W.; Yang, L.; Wang, Z.; Li, F. Recent progression and future perspectives in cotton genomic breeding. J. Integr. Plant Biol. 2023, 65, 548–569. [Google Scholar]
  25. Miller, M.R.; Dunham, J.P.; Amores, A.; Cresko, W.A.; Johnson, E.A. Rapid and cost-effective polymorphism identification and genotyping using restriction site associated DNA (RAD) markers. Genome Res. 2007, 17, 240–248. [Google Scholar] [CrossRef] [PubMed]
  26. Elshire, R.J.; Glaubitz, J.C.; Sun, Q.; Poland, J.A.; Kawamoto, K.; Buckler, E.S.; Mitchell, S.E. A robust, simple genotyping-by-sequencing (GBS) approach for high diversity species. PLoS ONE 2011, 6, e19379. [Google Scholar] [CrossRef] [PubMed]
  27. Sonah, H.; Bastien, M.; Iquira, E.; Tardivel, A.; Legare, G.; Boyle, B.; Normandeau, E.; Laroche, J.; Larose, S.; Jean, M.; et al. An improved genotyping by sequencing (GBS) approach offering increased versatility and efficiency of SNP discovery and genotyping. PLoS ONE 2013, 8, e54603. [Google Scholar] [CrossRef]
  28. Jia, X.; Pang, C.; Wei, H.; Wang, H.; Ma, Q.; Yang, J.; Cheng, S.; Su, J.; Fan, S.; Wusiman, N.; et al. High-density linkage map construction and QTL analysis for earliness-related traits in Gossypium hirsutum L. BMC Genom. 2016, 17, 909. [Google Scholar] [CrossRef]
  29. Li, L.; Zhao, S.; Su, J.; Fan, S.; Pang, C.; Wei, H.; Wang, H.; Gu, L.; Zhang, C.; Liu, G.; et al. High-density genetic linkage map construction by F2 populations and QTL analysis of early-maturity traits in upland cotton (Gossypium hirsutum L.). PLoS ONE 2017, 12, e0182918. [Google Scholar] [CrossRef]
  30. Qi, H.; Wang, N.; Qiao, W.; Xu, Q.; Zhou, H.; Shi, J.; Yan, G.; Huang, Q. Construction of a high-density genetic map using genotyping by sequencing (GBS) for quantitative trait loci (QTL) analysis of three plant morphological traits in upland cotton (Gossypium hirsutum L.). Euphytica 2017, 213, 83. [Google Scholar] [CrossRef]
  31. Hulse-Kemp, A.M.; Lemm, J.; Plieske, J.; Ashrafi, H.; Buyyarapu, R.; Fang, D.D.; Frelichowski, J.; Giband, M.; Hague, S.; Hinze, L.L.; et al. Development of a 63K SNP array for cotton and high-density mapping of intraspecific and Interspecific populations of Gossypium spp. G3 Genes Genome Genet. 2015, 5, 1187–1209. [Google Scholar] [CrossRef] [PubMed]
  32. Huang, C.; Nie, X.; Shen, C.; You, C.; Li, W.; Zhao, W.; Zhang, X.; Lin, Z. Population structure and genetic basis of the agronomic traits of upland cotton in China revealed by a genome-wide association study using high-density SNPs. Plant Biotechnol. J. 2017, 15, 1374–1386. [Google Scholar] [CrossRef] [PubMed]
  33. Su, J.; Pang, C.; Wei, H.; Li, L.; Liang, B.; Wang, C.; Song, M.; Wang, H.; Zhao, S.; Jia, X.; et al. Identification of favorable SNP alleles and candidate genes for traits related to early maturity via GWAS in upland cotton. BMC Genom. 2016, 17, 687. [Google Scholar] [CrossRef]
  34. Li, C.; Wang, Y.; Ai, N.; Li, Y.; Song, J. A genome-wide association study of early-maturation traits in upland cotton based on the CottonSNP8oK array. J. Integr. Plant Biol. 2018, 60, 970–985. [Google Scholar] [CrossRef]
  35. Li, L.; Zhang, C.; Huang, J.; Liu, Q.; Wei, H.; Wang, H.; Liu, G.; Gu, L.; Yu, S. Genomic analyses reveal the genetic basis of early maturity and identification of loci and candidate genes in upland cotton (Gossypium hirsutum L.). Plant Biotechnol. J. 2021, 19, 109–123. [Google Scholar] [CrossRef]
  36. Kohel, R.J.; Richmond, T.R.; Lewis, C.F. Texas Marker1. Description of a Genetic Standard for Gossypium hirsutum L. Crop Sci. 1970, 10, 670–671. [Google Scholar] [CrossRef]
  37. Song, M.; Yang, Z.; Fan, S.; Zhu, H.; Pang, C.; Tian, M.; Yu, S. Physiological and Biochemical Analysis and Identification of A Short Season Cotton Virescent Mutant. Sci. Agric. Sin. 2011, 44, 3709–3720. [Google Scholar]
  38. Yu, S.; Fan, S.; Song, M.; Huang, Z.; Yuan, R. A new short-season cotton variety-Zhongmian Suo 58. China Cotton 2007, 34, 16–19. [Google Scholar]
  39. Mao, G.; Wei, H.; Hu, W.; Ma, Q.; Zhang, M.; Wang, H.; Yu, S. Fine mapping and molecular characterization of the virescent gene vsp in Upland cotton (Gossypium hirsutum). Theor. Appl. Genet. 2019, 132, 2069–2086. [Google Scholar] [CrossRef]
  40. Paterson, A.H.; Brubaker, C.L.; Wendel, J.F. A rapid method for extraction of cotton (Gossypium spp.) genomic DNA suitable for RFLP or PCR analysis. Plant Mol. Biol. Rep. 1993, 11, 122–127. [Google Scholar] [CrossRef]
  41. Song, M. Genetic Analysis and Comparative Study on the Main Characteristics of Virescent Mutants in Upland Cotton (Gossypium hirsutum L.). Master’s Thesis, Graduate School of Chinese Academy of Agricultural Sciences, Beijing, China, 2014. [Google Scholar]
  42. Dong, W.; Wu, D.; Li, G.; Wu, D.; Wang, Z. Next-generation sequencing from bulked segregant analysis identifies a dwarfism gene in watermelon. Sci. Rep. 2018, 8, 2908. [Google Scholar] [CrossRef]
  43. Zhou, Z.; Zhang, C.; Zhou, Y.; Hao, Z.; Wang, Z.; Zeng, X.; Di, H.; Li, M.; Zhang, D.; Yong, H.; et al. Genetic dissection of maize plant architecture with an ultra-high density bin map based on recombinant inbred lines. BMC Genom. 2016, 17, 178. [Google Scholar] [CrossRef]
  44. Zhang, Z.; Wei, T.; Zhong, Y.; Li, X.; Huang, J. Construction of a high-density genetic map of Ziziphus jujuba Mill. using genotyping by sequencing technology. Tree Genet. Genomes 2016, 12, 76. [Google Scholar] [CrossRef]
  45. Li, H.; Durbin, R. Fast and accurate short read alignment with Burrows–Wheeler transform. Bioinformatics 2009, 25, 1754–1760. [Google Scholar] [CrossRef]
  46. Li, H.; Handsaker, B.; Wysoker, A.; Fennell, T.; Ruan, J.; Homer, N.; Marth, G.; Abecasis, G.; Durbin, R. 1000 Genome Project Data Processing Subgroup. The Sequence Alignment/Map format and SAMtools. Bioinformatics 2009, 25, 2078–2079. [Google Scholar] [CrossRef]
  47. McKenna, A.; Hanna, M.; Banks, E.; Sivachenko, A.; Cibulskis, K.; Kernytsky, A.; Garimella, K.; Altshuler, D.; Gabriel, S.; Daly, M.; et al. The Genome Analysis Toolkit: A MapReduce framework for analyzing next-generation DNA sequencing data. Genome Res. 2010, 20, 1297–1303. [Google Scholar] [CrossRef] [PubMed]
  48. Ooijen, J.W.V. JoinMap® 4.0, Software for the Calculation of Genetic Linkage Maps in Experimental Populations; Kyazma BV: Wageningen, The Netherland, 2006.
  49. Wang, S.; Basten, C.J.; Zeng, Z.B. Windows QTL Cartographer 2.5; Department of Statistics, North Carolina State University: Raleigh, NC, USA, 2011. [Google Scholar]
  50. Zeng, Z.B. Theoretical basis for separation of multipli linked gene effects in mapping quantitative trait loci. Proc. Natl. Acad. Sci. USA 1993, 90, 10972–10976. [Google Scholar] [CrossRef] [PubMed]
  51. Zeng, Z.B. Precision mapping of quantitative trait loci. Genetics 1994, 136, 1457–1468. [Google Scholar] [CrossRef]
  52. Bu, D.; Luo, H.; Huo, P.; Wang, Z.; Zhang, S.; He, Z.; Wu, Y.; Zhao, L.; Liu, J.; Guo, J.; et al. KOBAS-i: Intelligent prioritization and exploratory visualization of biological functions for gene enrichment analysis. Nucleic Acids Res. 2021, 49, W317–W325. [Google Scholar] [CrossRef]
  53. Chen, T.; Chen, X.; Zhang, S.; Zhu, J.; Tang, B.; Wang, A.; Dong, L.; Zhang, Z.; Yu, C.; Sun, Y.; et al. The Genome Sequence Archive Family: Toward Explosive Data Growth and Diverse Data Types. Genom. Proteom. Bioinform. 2021, 19, 578–583. [Google Scholar] [CrossRef]
  54. CNCB-NGDC Members and Partners. Database Resources of the National Genomics Data Center, China National Center for Bioinformation in 2022. Nucleic Acids Res. 2022, 50, D27–D38. [Google Scholar] [CrossRef] [PubMed]
  55. Song, M.; Fan, S.; Pang, C.; Wei, H.; Yu, S.; Song, M. Research on the Main Photosynthetic Characteristics and Agronomic Traits in Virescent Cotton Materials. Cotton Sci. 2014, 26, 531–538. [Google Scholar]
  56. Wang, J.; Lu, X.; Wang, Y.; Wang, S.; Yin, Z.; Fu, X.; Wang, D.; Chen, X.; Guo, L.; Chen, C.; et al. Characteristics and Cold Tolerance of Upland Cotton Genetic Standard Line TM-1. Sci. Agric. Sin. 2022, 58, 1503–1517. [Google Scholar]
  57. Li, H.; Zhang, L.; Wang, J. Analysis and Answers to Frequently Asked Questions in Quantitative Trait Locus Mapping. Acta Agron. Sin. 2010, 36, 918–931. [Google Scholar] [CrossRef]
  58. Mao, G. Fine Mapping and Candidate Genes Analysis of Two Virescent Genes (v1 and vsp) in Upland Cotton. Ph.D. Thesis, Huazhong Agricultural University, Wuhan, China, 2018. [Google Scholar]
  59. Jessberger, R. The many functions of SMC proteins in chromosome dynamics. Nat. Rev. Mol. Cell Biol. 2002, 3, 767–778. [Google Scholar] [CrossRef] [PubMed]
  60. Reyes, J.C. Chromatin modifiers that control plant development. Curr. Opin. Plant Biol. 2006, 9, 21–27. [Google Scholar] [CrossRef] [PubMed]
  61. Choi, K.; Park, C.; Lee, J.; Oh, M.; Noh, B.; Lee, I. Arabidopsis homologs of components of the SWR1 complex regulate flowering and plant development. Development 2007, 134, 1931–1941. [Google Scholar] [PubMed]
Figure 1. Frequency distribution and fit curve of four early-maturity traits in the F2 population and the F2:3 population.
Agronomy 13 02716 g001
Figure 2. Construction of the genetic map using 5454 SNP markers. The vertical direction indicates the cumulative distance of the LGs (cM), and the horizontal direction indicates the LGs of the At subgenome (A01–A13) and the Dt subgenome (D01–D13). LGs are represented in green and SNP markers are represented in blue.
Agronomy 13 02716 g002
Figure 3. Collinearity analysis based on chromosome level. The x-axis indicates physical maps (A01–A13, D01–D13) and linkage maps (LG01–LG26), and the y-axis indicates the genetic length (cM). The LGs are represented in red and the physical maps are represented in blue.
Agronomy 13 02716 g003
Figure 4. Mapping of QTLs controlling FT, WGP, NFFB, and HNFFB in the F2 and F2:3 populations. (AJ) The curves in the plots indicate the GD coordinate (X-axis) and LOD score (Y-axis) of identified QTLs in Chr D03, D05, and A08; red lines present the LOD threshold. The confidence level is 0.95.
Agronomy 13 02716 g004
Figure 5. Annotation of candidate genes in the confidence intervals of stable QTLs through GO analysis. Statistical method: hypergeometric test/Fisher’s exact test. Significance level: corrected p-value < 0.05. Green color represents molecular function (MF) of GO. Red color represents biological process (BP) of GO. Blue color represents celluar component (CC) of GO. The length of bar represents the value of—log (Corrected p-value).
Agronomy 13 02716 g005
Figure 6. Genome-wide distribution of SNPs throughout the vsp and TM-1 genomes. For detecting SNPs between the TM-1 line and the vsp line, the base support number of SNP was not less than 2 and not more than 2000.
Agronomy 13 02716 g006
Table 1. Analysis of early-maturity traits in the three cotton lines (TM-1, vsp, and CCRI58).
TraitsIn the Year 2015In the Year 2016
TM-1vspCCRI58TM-1VspCCRI58
FT (d)63.09 ± 2.8453.45 ± 1.4854.12 ± 1.9965.85 ± 0.2860.96 ± 0.2860.10 ± 0.26
WGP(d)119.2 ± 2.57104.9 ± 5.97100.7 ± 3.79123.57 ± 0.76105.70 ± 0.20105.31 ± 0.85
NFFB (num)7.71 ± 1.144.83 ± 0.474.71 ± 0.557.85 ± 0.226.44 ± 0.236.14 ± 0.17
HNFFB (cm)------18.64 ± 1.2412.2 ± 1.0612.67 ± 0.49
Note: (1) In 2015, a sample from TM-1, a sample from CCRI58, and a sample from vsp were investigated, respectively; each sample included at least 10 individuals who were randomly selected. The mean and standard deviation (SD) of each sample are listed in Table 1 according to the mean ± SD form. (2) In 2016, three biological replicates were obtained from the TM-1, the CCRI58, and the vsp, respectively; each biological replicate included at least 5 individuals and the mean data from these individuals was used for analysis. The mean and standard deviation (SD) of the three biological replicates are listed in Table 1 according to the mean ± SD form. (3) “--” in Table 1 denotes that the data was lost.
Table 2. Analysis of early-maturity traits in the F2 population and the F2:3 population.
TraitsPopulationRangeMean ± SDKSE|K|/SESSE|S|/SEK-S Test
FT (d)F251.0–67.060.42 ± 3.03−0.1300.4850.27−0.0650.2450.270.038
WGP (d)F298.0–131.0112.32 ± 7.150.1720.4880.350.6390.2462.600.000
NFFB (num)F24.0–10.06.40 ± 1.131.2070.4812.510.7370.2433.030.000
HNFFB (cm)F211.0–32.019.36 ± 4.63−0.1760.4830.360.4660.2441.910.200
FT (d)F2:362–6964.79 ± 1.48−0.3920.4810.810.1890.2430.780.000
WGP (d)F2:3105–124115.24 ± 4.22−0.7160.4811.49−0.1610.2430.660.009
NFFB (num)F2:35.9–8.26.94 ± 0.52−0.4160.4810.860.0370.2430.150.000
HNFFB (cm)F2:312.3–20.715.36 ± 1.710.3430.4810.710.6510.2432.680.098
Note: (1) In 2015, the four traits were investigated from 100 individuals in the F2 population; the mean and standard deviation (SD) listed in Table 2 were calculated according to the investigation. (2) In 2016, the four traits of the F2:3 families were investigated and three biological replicates were carried out; the mean of the three replicates was used for analysis. The mean and standard deviation (SD) of the F2:3 families were listed in Table 2 according to the mean ± SD form. (3) SE represents the standard error. S represents skewness. K represents kurtosis. K-S test represents the Kolmogorov–Smirnov test. (4) IBM SPSS statistics 26 software was used to calculate the skewness and kurtosis of data distributions of the four traits, and was used to carry out the kurtosis coefficient test, skewness coefficient test, and K-S test. (5) The significance level of the hypothesis test was 0.05.
Table 3. Correlation analysis of early-maturity traits in the F2 and F2:3 populations.
TraitsF2:3-NFFBF2:3-FTF2:3-WGPF2:3-HNNFBF2-NFFBF2-FTF2-WGPF2-HNFFB
F2:3-NFFB1
F2:3-FT0.57 **1
F2:3-WGP0.46 **0.70 **1
F2:3-HNNFB0.63 **0.40 **0.43 **1
F2-NFFB0.51 **0.38 **0.36 **0.36 **1
F2-FT0.30 **0.45 **0.37 **0.24 *0.39 **1
F2-WGP0.32 **0.45 **0.42 **0.180.39 **0.81 **1
F2-HNFFB0.41 **0.37 **0.41 **0.53 **0.66 **0.43 **0.30 **1
Note: Because partial data were missing, data from the 97 individuals of the F2 population and data from the 97 F2:3 families were used for the correlation analysis. r0.05(95) = 0.20, r0.01(95) = 0.26. * Indicates the correlation reaches significance at a significance level of 0.05. ** Indicates the correlation reaches significance at a significance level of 0.01.
Table 4. Statistics of marker type in the two parents.
Marker TypeNumbers
ef × eg116
nn × np8253
ab × cc8
aa × bb28,684
ab × cd0
lm × ll27,866
hk × hk29,825
cc × ab6
Total markers94,758
Table 5. Summary of the high-density SNP map based on the F2 population.
Linkage GroupChromosomeSNP NumberPhysical Distance
/Mb
Genetic Distance
/cM
Average Gap
/cM
Maximal Gap
/cM
LG01A0153799.88205.970.3817.46
LG02A0213283.45115.670.8814.38
LG03A03294100.26224.170.7612.44
LG04A049962.9186.650.8815.72
LG05A0512092.05103.910.8713.31
LG06A06617103.17211.610.3419.05
LG07A074978.2529.700.618.64
LG08A08328103.63265.470.8118.14
LG09A0910875.0096.790.9016.25
LG10A1057100.8751.910.9115.47
LG11A116893.3271.851.0614.16
LG12A1215787.48109.870.7010.44
LG13A1366779.96199.900.305.01
LG14D0121761.46111.930.5213.50
LG15D0212067.28128.411.0718.63
LG16D0314746.6983.050.5615.38
LG17D044751.4538.630.826.96
LG18D053161.9342.261.369.32
LG19D0657264.29220.240.3916.38
LG20D0714555.31131.660.9116.39
LG21D0845965.89251.660.5518.50
LG22D094651.0032.980.7217.93
LG23D105063.3726.970.542.98
LG24D1116266.09133.150.8214.24
LG25D128959.1188.050.9918.65
LG26D1313660.53104.690.7713.72
Total 54541934.633167.140.5819.05
Table 6. QTLs for early maturity identified in the F2 and F2:3 populations.
TraitQTLGenerationChrPosition
(cM)
LOD
R2
(%)
0.95% CI
/cM
Physical
Interval/Mb
Left
Marker
Right
Marker
NFFBqNFFB-D03-1F2:3D0340.0113.0343.139.5–44.735.29–38.17mk3284mk3293
NFFBqNFFB-D03-2F2:3D0350.019.1929.949.0–50.238.17–38.62mk3293mk3294
NFFBqNFFB-D03-3F2D0352.516.6621.451.5–57.638.66–38.79mk3295mk3299
FTqFT-D03-1F2:3D0321.1110.9935.320.6–21.613.27–14.44mk3199mk3209
FTqFT-D03-2F2:3D0327.2113.4746.426.2–27.725.70–30.27mk3250mk3259
FTqFT-D03-3F2D0335.818.2130.735.5–38.534.28–35.29mk3272mk3284
FTqFT-D03-4F2D0345.018.7437.244.2–48.535.87–38.17mk3292mk3293
WGPqWGP-A08-1F2:3A08192.616.6615.9188.8–194.485.10–89.08mk1822mk1825
WGPqWGP-D03-1F2:3D0318.215.2311.616.4–19.28.79–14.43mk3191mk3208
WGPqWGP-D03-2F2:3D0326.717.1019.825.5–27.725.57–27.06mk3248mk3258
WGPqWGP-D03-3F2D0329.717.8820.627.2–31.326.39–30.63mk3257mk3268
WGPqWGP-D03-4F2D0335.419.2527.932.5–37.830.60–35.01mk3262mk3273
WGPqWGP-D05-5F2D050.016.2123.10–7.75.50–5.68mk3402mk3398
WGPqWGP-D05-6F2D059.715.9426.57.7–135.68–39.48mk3398mk6383
HNFFBqHNFFB-D03-1F2:3D0312.018.3428.411–12.511.90–23.28mk3194mk3247
HNFFBqHNFFB-D03-2F2:3D0321.118.3128.620.1–21.614.43–14.44mk3208mk3209
HNFFBqHNFFB-D03-3F2:3D0330.718.9433.528.2–31.827.06–30.60mk3258mk3266
HNFFBqHNFFB-D03-4F2D0329.718.6438.928.3–30.827.06–30.63mk3258mk3267
Note: R2 represents the proportion in which QTL explains the phenotypic variation.
Disclaimer/Publisher’s Note: The statements, opinions and data contained in all publications are solely those of the individual author(s) and contributor(s) and not of MDPI and/or the editor(s). MDPI and/or the editor(s) disclaim responsibility for any injury to people or property resulting from any ideas, methods, instructions or products referred to in the content.

