Article

Evolving Soil Water Limitation Changes Maize Production Potential and Biomass Accumulation but Not Its Relationship with Grain Yield

1
State Key Laboratory of Severe Weather, Chinese Academy of Meteorological Sciences, Beijing 100081, China
2
Collaborative Innovation Center on Forecast Meteorological Disaster Warning and Assessment, Nanjing University of Information Science & Technology, Nanjing 210044, China
3
Joint Eco-Meteorological Laboratory of Chinese Academy of Meteorological Sciences and Zhengzhou University, Zhengzhou 450001, China
4
Hebei Gucheng Agricultural Meteorology National Observation and Research Station, Baoding 072656, China
5
College of Resources and Environmental Sciences, China Agricultural University, Beijing 100193, China
*
Authors to whom correspondence should be addressed.
Agronomy 2023, 13(10), 2637; https://doi.org/10.3390/agronomy13102637
Submission received: 9 September 2023 / Revised: 16 October 2023 / Accepted: 17 October 2023 / Published: 18 October 2023
(This article belongs to the Section Innovative Cropping Systems)

Abstract

:
As a key indicator of agricultural production capacity, crop production potential is critical to evaluate the impacts of climate variability on agriculture. However, less attention has been paid to the pattern of biomass accumulation in response to crop climatic production potential and its relation to grain yield formation at an intra-seasonal time scale, especially under evolving soil water limitation. In this study, we combined a mechanism-based empirical model with field experiments conducted at different growth stages of maize on the Northern China Plain (NCP) to assess the dynamic response of biomass accumulation to climatic production potential and its relation to grain yield. The results showed that the ability of climatic production potential to estimate biomass was significantly improved when a vapor pressure deficit (VPD) was incorporated, with the root mean square error (RMSE) reduced by 33.3~41.7% and 45.6~47.2% under rainfed and evolving soil water limitation conditions, respectively. Drought significantly decreased biomass accumulation mainly by decreasing the intrinsic growth rate and delaying the occurrence timing of maximum growth. Moreover, grain yield shared a nonlinear and saturating relationship with biomass across rainfed and water deficit conditions. The results imply that evolving soil water limitation changes the process of biomass accumulation but not its relationship with grain yield. These findings provide useful information to estimate crop production potential under abiotic stresses and improve the accuracy of crop yield prediction.

1. Introduction

Global climate change, characterized by increasing temperature, high spatial–temporal variation in precipitation, and growing numbers of extreme weather events, has been one of the major environmental problems facing humankind in the 21st century [1,2]. The impacts of global climate change on agriculture cannot only be reflected by crop growth and development at the plant scale but also by the shifts of agricultural climate zones and cropping systems at landscape scale, which induce great uncertainties in global food safety [3,4,5]. As a key index for quantifying the effects of climate change on crop production, crop production potential refers to the biomass production or grain yield of a crop when grown under optimum conditions [6,7]. Photosynthetic, light–temperature, and climatic production potential are the maximum crop outputs determined by solar radiation, light–temperature, and light–temperature–precipitation conditions, respectively, when soil and agricultural management (e.g., seed, insect, and disease) are suitable [8,9]. These measures provide important theoretical guidance for evaluating crop growth and development, assessing resource use efficiency [10,11,12], and predicting crop production under stresses.
Many studies have estimated the spatial–temporal changes in crop production potential with various statistical and simulation methods around the world [13]. Crop models, like WOFOST [14,15], DSSAT-CERES [16], APSIM [17,18], STICS [19], AquaCrop [20], and ORYZA [21], and mechanism-based empirical methods, e.g., Miami [22], Thornthwaite memorial [23], and GAEZ [24], have been widely applied in evaluating crop production potential in China, especially in the semiarid–humid regions [25,26,27,28,29,30,31]. Mostly, the above-mentioned methods often assume that grain yield is a fixed proportion of aboveground or total biomass, known as the harvest index (HI) [32,33]. In fact, HI varies with environmental changes, especially under extreme temperature and drought stress [34,35,36]. Therefore, it is not reliable to use a constant value of HI to estimate crop yield. An alternative approach for the HI method is to build a directly quantitative relationship between biomass and grain yield [37]. In addition, previous studies mainly focused on the gaps between grain yield potential and actual yield at inter-seasonal time scale [11,38,39,40], and less attention has been paid to the response of biomass accumulation to production potential at an intra-seasonal time scale, which plays an important role in final yield formation [33,41,42].
The Northern China Plain (NCP) is a major maize production region, accounting for 35% of maize planting areas and 40% of maize production in China [43]. Meanwhile, the NCP is one of the most vulnerable areas to the impacts of climate change in China. The average air temperature on the NCP increased by 0.30 °C per decade during 1961–2020, which was significantly higher than the global average level in the same period. Moreover, the precipitation amount, diurnal temperature range, and solar radiation within the crop growing season decreased by 5.8 mm per decade (1960–2019) [44], 0.12 °C per decade (1961–2014) [45], and 55 MJ per decade (1961–2015) [46], respectively. In addition, there is growing evidence that vapor pressure deficit ( V P D ), denoting the dryness of air, plays a vital role in crop growth, which is comparative to temperature and CO2 [4,47,48,49,50]. However, the effect of V P D on crop growth is often confounded with temperature because of their tight correlation [51]. With an increasing trend for temperature and decreasing trends for both radiation and rainfall within the growing season, climate change has posed a great challenge for the stability of maize production on the NCP [1,52]. Therefore, it is urgent to explore the response mechanism of plant growth to climatic production potential, particularly in the context of increasing extreme climate events.
In this study, a field experiment with various irrigation regimes at different growth stages was designed and conducted to explore biomass accumulation in response to crop production potential and its relation to grain yield and, further, to investigate their underlying mechanisms. Specifically, the objectives were to address the following questions. (1) Are there any differences in the dynamics of crop production potential affected by the droughts that happened at different growth stages? (2) What role does VPD play in determining crop production potential? (3) How does biomass accumulation respond to crop production potential under rainfed and evolving soil water limitation conditions? (4) Is there a unified relationship between biomass and grain yield across rainfed and evolving soil water limitation conditions?

2. Materials and Methods

2.1. Study Area Description

A two-year field experiment was conducted at the Hebei Gucheng Agricultural Meteorology National Observation and Research Station (39°08′ N, 115°40′ E and 15.2 m above sea level) in Baoding, Hebei Province, China [53]. The experimental region is in the central part of the NCP, which is a typical maize production area in China. The climate in this region is classified as warm continental and temperate monsoon. The 30-year (1981–2010) average annual temperature, annual active cumulative temperature (≥10 °C), and sunshine duration were 12.2 °C, 4910 °C d, and 2264 h, respectively. The average annual precipitation is 515.5 mm, and approximately 60~70% of it occurs in the summer. Within a depth of 50 cm, the soil is a sandy loam, with a soil bulk density of 1.37 g cm−3 and a pH of 8.19. In addition, the average field capacity and wilting point were 22.7% (cm3 cm−3) and 5.0% (cm3 cm−3), respectively. The average organic carbon, total nitrogen, total phosphorus, and total potassium contents were 13.67 g kg−1, 0.98 g kg−1, 1.02 g kg−1, and 17.26 g kg−1, respectively. The farming practice in this region is double cropping with a wheat–maize rotation system.

2.2. Experimental Design and Field Management

The field experiment was conducted with a randomized complete block design. The area of each plot was 8.0 m2 (4 m long and 2 m wide). A large electric-powered waterproof shelter (about 4.0 m high) over the experimental plots was applied to block the rainfall. When it was not raining, the waterproof shelter was moved away and the plots were exposed to the ambient conditions [53]. A concrete wall with a depth of 3.0 m was constructed to prevent horizontal soil water exchange between plots. The maize variety used for this study was a drought-tolerant cultivar named Zhengdan-958, which has been the most popular maize variety on the NCP since 2003. The soil moisture within a depth of 1.0 m was measured with the drying method before seeding. Then, each plot was irrigated and maintained to keep the same soil water moisture content. During the growing seasons of 2013 and 2014, the sowing dates were 27 June 2013 and 24 June 2014, respectively. Before the irrigation treatments, some irrigation was applied in each plot to improve seedling emergence. At the local scale, the average precipitation in July from 1981 to 2010 was 150 mm, which was the basic reference for the irrigation amounts in this study. Five different irrigation amounts were applied on 24 July 2013 (at the seven-leaf stage) and 2 July 2014 (at the three-leaf stage), respectively, as detailed in Table 1 [54,55]. After irrigation, no more water was applied, and the plots were sheltered from precipitation during the remaining growing season. At the same time, two rainfed treatments, T0 and W0 (not sheltered by waterproof shelter; the only input water was rainfall), were also established in 2013 and 2014, respectively. Each treatment had three replicate plots with a planting density of 6.5 plants m−2. The controlled-release fertilizer diammonium phosphate (CRP) was applied at a rate of 320 kg ha−1 in all the treatments. The yield harvest dates were 8 October 2013 and 9 October 2014, respectively. Weeds, insects, and diseases were well controlled during the entire maize growing season.

2.3. Measurements of Environmental Variables and Maize Productivity

2.3.1. Meteorological Conditions

The meteorological data during the maize growing seasons of 2013 and 2014 were collected by an on-site automated weather station (about 30 m away). The data included the daily air temperature ( T , °C), daily minimum air temperature ( T m i n , °C), daily maximum air temperature ( T m a x , °C), precipitation ( P , mm), photosynthetically active radiation ( P A R , MJ m−2), and air relative humidity ( R H , %). The V P D (kPa) was calculated using the T m i n , T m a x , and R H [56]:
V P D = e s e a
e s = e T m a x + e T m i n 2
e a = R H 100 × e s
e T m i n = 0.6108 × e 17.27   ×   T m i n T m i n   +   237.3
e T m a x = 0.6108 × e 17.27   ×   T m a x T m a x   +   237.3
where e s is the mean saturation vapor pressure (kPa), e a is the actual saturation vapor pressure (kPa), e T m a x and e T m i n are the saturation vapor pressure at the daily minimum and maximum air temperatures (kPa), respectively, and RH is air relative humidity (%).

2.3.2. Soil Water Availability

The soil water content was determined by the oven-drying method with an interval of 7–14 days throughout the growing season, with eight field observations each year. As more than 95% of the maize root biomass grew within a soil depth of 30 cm [57], the sampling depth was set to 50 cm. In each treatment, three different sampling sites were selected in the middle area of each plot. Soil samples were collected at every 10 cm soil depth with an auger, and then, the remaining soils were returned. The collected samples were dried in a ventilated oven at 105 °C until they reached a constant weight. The available soil water content ( A S W C , %) was calculated according to the following equation [58]:
A S W C = S W C W P F C W P × 100 %
where S W C (%) is the measured soil water content as a percentage of the dry soil weight, and F C (%) and W P (%) are the field capacity and wilting point, respectively.

2.3.3. Crop Biomass Production and Grain Yield

To obtain maize biomass, three healthy maize plants were randomly selected from each treatment and harvested during each observation. The sampling interval was identical to that of the soil water content measurements. All aboveground parts and root biomass within a depth of 35 cm were harvested and then weighed in timely manner. The fresh plant organs were placed in an oven with a temperature of 105 °C for one hour, followed by 80 °C until a constant dry weight was obtained. At maturity, maize ears were harvested in each plot and then dried at 80 °C to constant weight. In each plot, 10 representative ears were harvested to determine grain yield at 14% grain moisture content. The grain yield used for this analysis was averaged across three replications.

2.4. Maize Biomass Production Potential

Maize biomass production potential is calculated by the crop growth dynamics statistical method, which divided the production potential into three levels: photosynthetic, light–temperature, and climatic production potential [9,59].

2.4.1. Photosynthetic Production Potential of Biomass

Photosynthetic production potential of biomass ( B q ) refers to the biomass production potential determined by solar radiation, with optimal temperature, water, nutrient conditions, and field management. Based on radiation-use efficiency theory, Loomis and Williams [60] proposed a classic algorithm for daily photosynthetic production, which is calculated as follows:
B q = C × Q i × f ( Q )
where B q is the photosynthetic production potential of biomass (t ha−1), C is the unit conversion factor with a value of 10, and Q i is the total solar radiation reached above the maize canopy from sowing to physiological maturity (MJ m−2). f ( Q ) is the photosynthetic coefficient [59], as shown by Equation (8).
f ( Q ) = μ φ 1 α 1 β 1 ρ 1 γ 1 ω 1 ξ q × f L
Here, the values and meanings of μ , φ , α , β , ρ , γ , ω , f L , ξ , and q are detailed in Table 2 [59,61].

2.4.2. Light–Temperature Production Potential of Biomass

Light–temperature production potential of biomass ( B q t ) represents the production potential as a function of solar radiation and temperature with other environmental conditions (water, nutrients, etc.) being optimal. B q t is calculated as follows [59]:
B q t = f ( T ) × B q
f T = ( T T m i n p ) ( T m a x p T ) b T o p t T m i n p ( T m a x p T o p t ) b     T m i n p < T < T m a x p 0 T T m i n p   o r   T T m a x p
b = T m a x p T o p t T o p t T m i n p
where B q t is the light–temperature production potential of biomass (t ha−1), f T is the downregulating scalar for the effect of temperature on B q , T is the daily air temperature (°C), and b is a temperature coefficient. T m i n p , T o p t , and T m a x p are the minimum, optimum, and maximum air temperatures, respectively, for photosynthetic activity at different growth stages (Table 3), which were obtained from previous research across many different maize varieties based on the theory of three critical points of temperature [62,63].

2.4.3. Climatic Production Potential of Biomass

Climatic production potential of biomass ( B q t w ) is the production potential depending upon climatic conditions, such as solar radiation, temperature, and precipitation. In this study, we adopted A S W C to represent the effects of precipitation on crop production potential, which was in accordance with previous studies [61]. The climatic production potential of biomass was determined as follows:
B q t w = f ( w ) × B q t
f w = A S W C
where B q t w is the climatic production potential of biomass (t ha−1). f ( w ) is the downregulating scalar for the effect of soil water on B q t , which is represented by A S W C .
In addition, due to the impact mechanism of V P D on crop growth and development that differs from that of temperature [4,47,48], V P D was also taken into consideration in this study. Climatic production potential of biomass after being corrected by V P D ( B q t w v ) was calculated as follows:
B q t w v   = f ( V P D ) B q t w
f V P D = V P D 0 V P D + V P D 0
where B q t w v is the climatic production potential of biomass after being corrected by V P D (t ha−1). f ( V P D ) is the downregulating scalar for the effect of V P D on B q t w [47], and V P D 0 is the empirical coefficient of the V P D constraint equation.

2.5. Data and Statistical Analysis

Daily A S W C values were calculated via cubic spline interpolation between measured points of the A S W C , assuming that there is a linear relationship between subsequent sampling dates [64]. Cubic spline interpolation was performed by using the “stata” package in R 4.0.4 (R Core Team, 2021). One-way analysis of variance (ANOVA) was applied to evaluate the effects of evolving soil water limitations on biomass production and grain yield among the different treatments. The least significant difference (LSD) test was employed to distinguish the differences in biomass production and grain yield among treatments with Duncan’s test. The linear regression model was applied to compare observed biomass versus the climatic production potential of biomass corrected by V P D ( B q t w v ). In addition, the coefficient of determination (R2), mean absolute error (MAE), and square root mean square error (RMSE) were calculated to evaluate model performance.
Seasonal biomass dynamics were often simulated using linear, exponential, monomolecular, and logistic functions [65,66]. A logistic function (Equation (16)) was introduced to explore how the biomass responded to climatic production potential under evolving soil water limitation conditions during the growing season because this function is often used to quantify plant growth [67,68].
y = L 1 + e k × ( x a )
where y represents the crop biomass (t ha−1), and x is the production potential. L is the predicted maximum biomass (t ha−1), k indicates the intrinsic rate of plant growth, and a denotes the timing of maximum growth. In all cases, the differences were deemed to be significant if p < 0.05. All the figures were constructed with Origin 9.1 (Origin Lab Corporation, Northampton, MA, USA).

3. Results

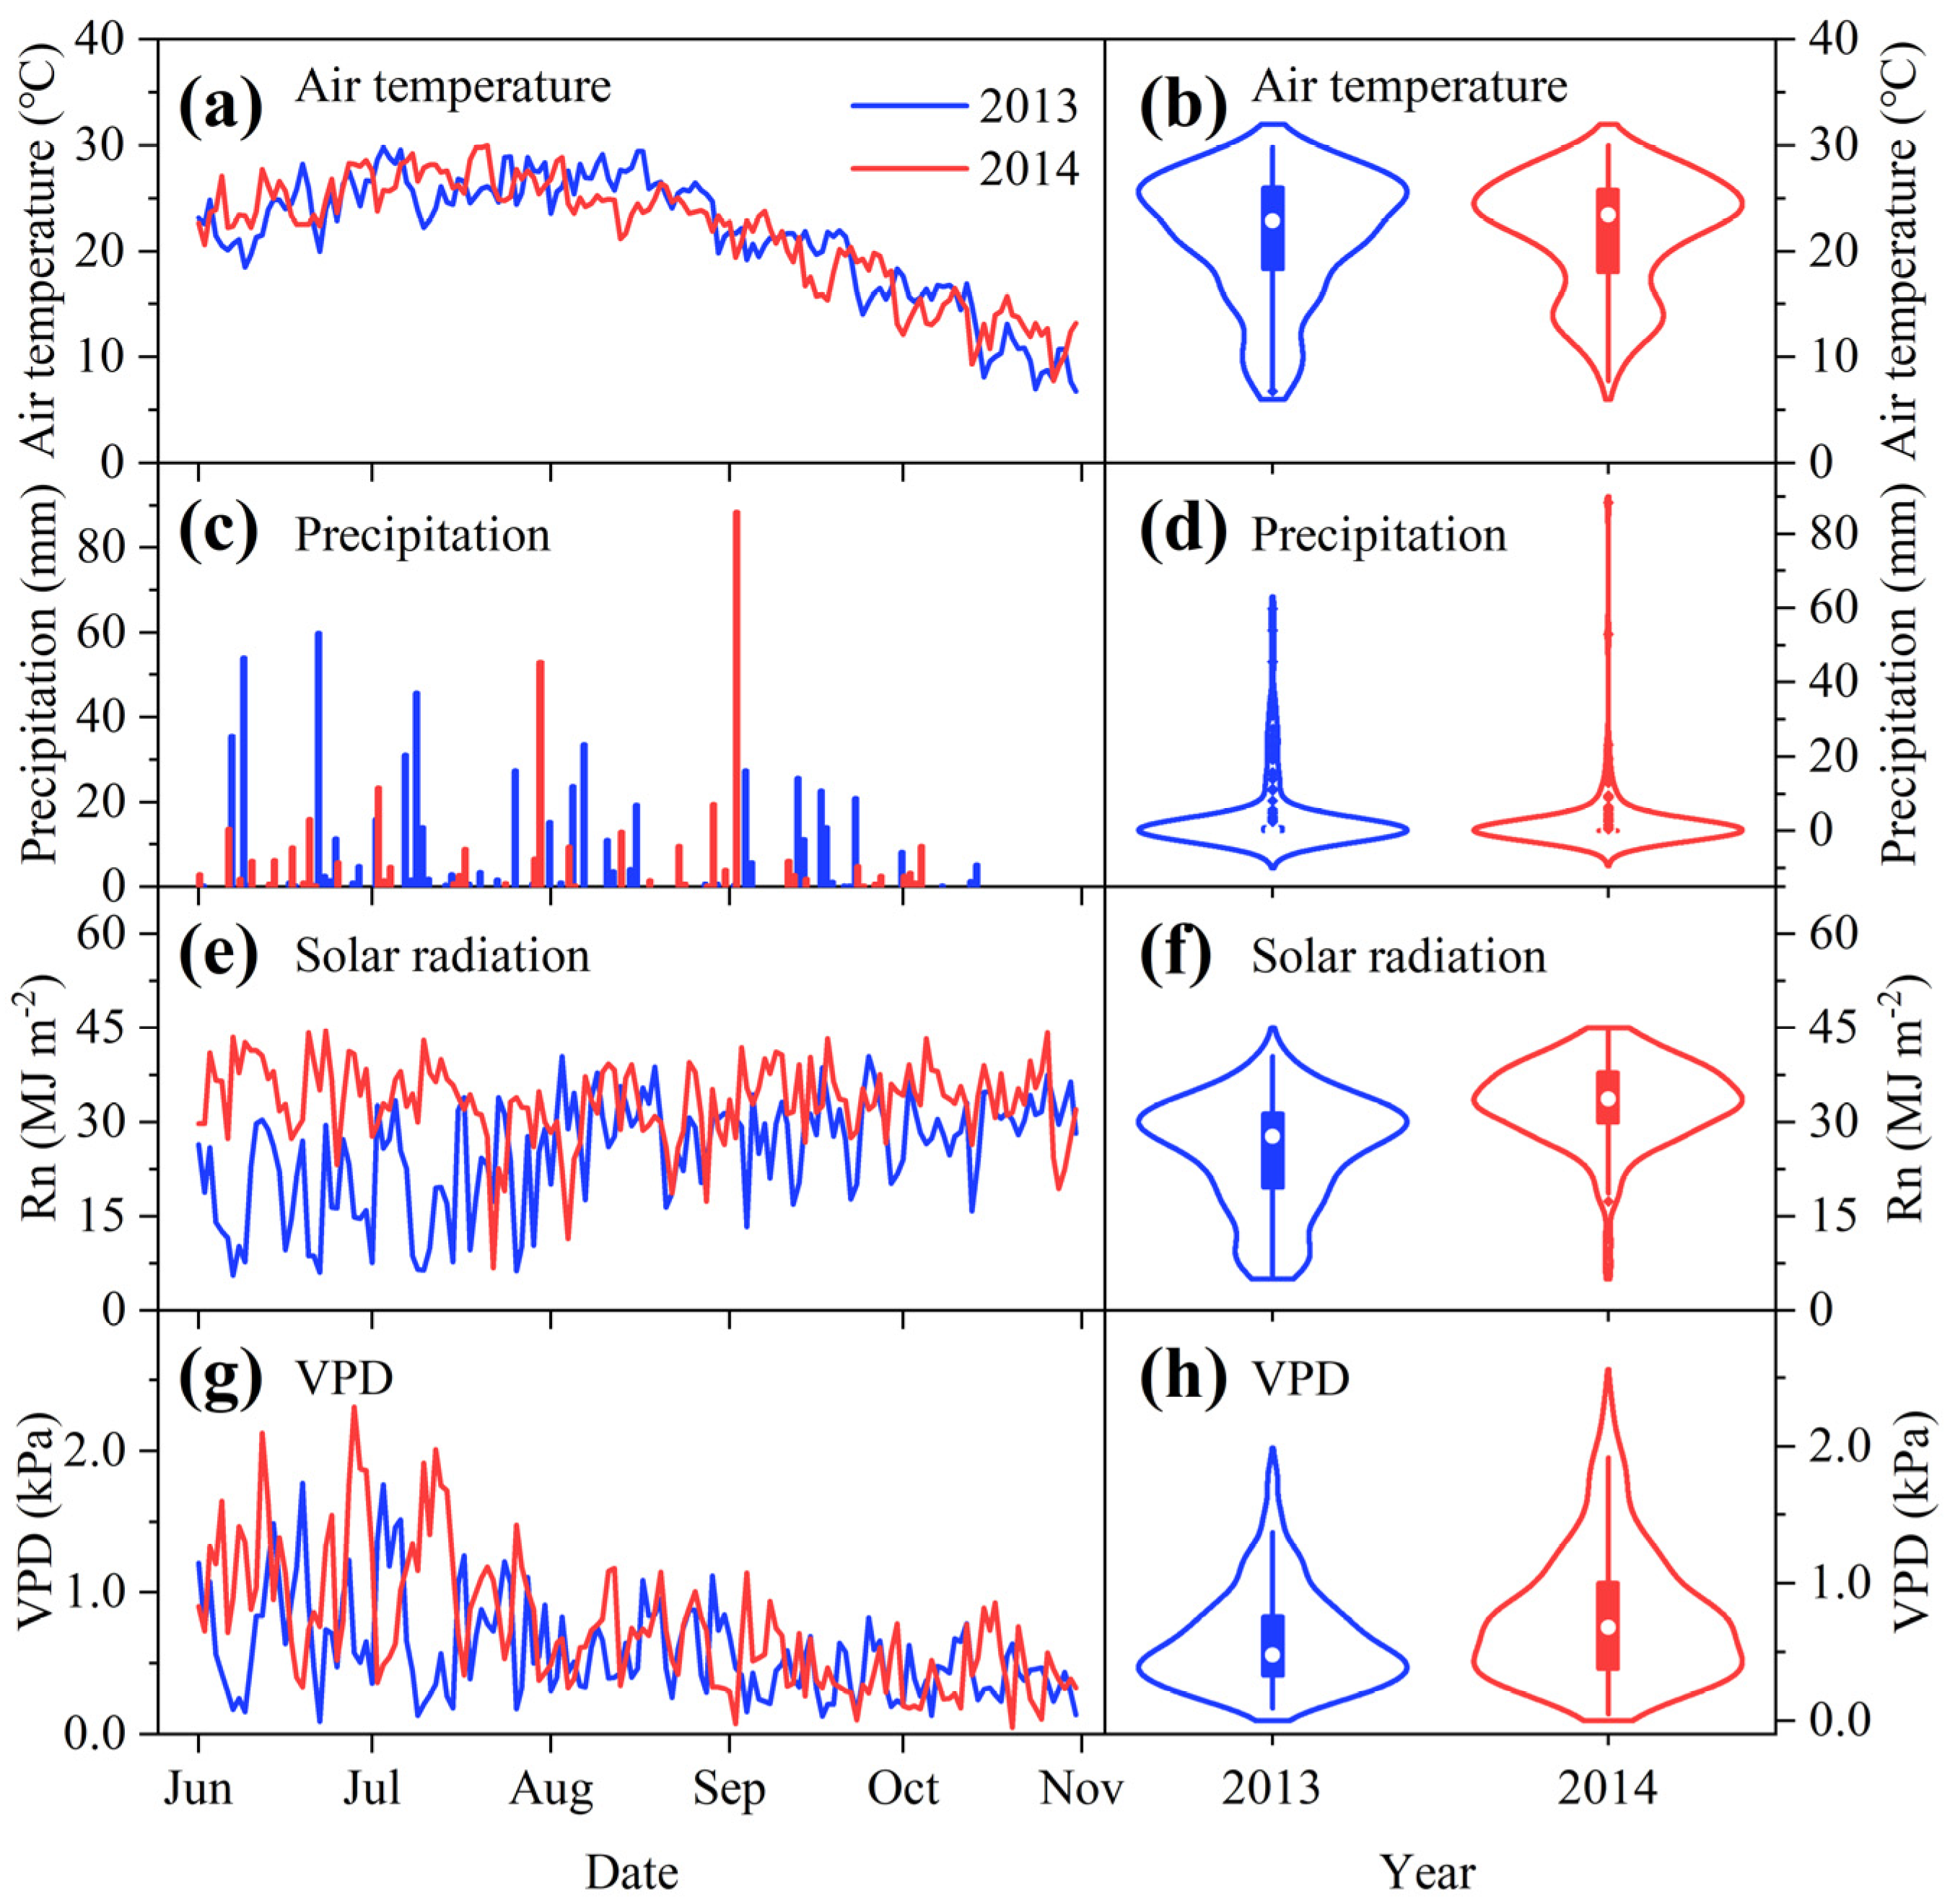
3.1. Meteorological Conditions during the Experimental Growing Seasons

Except for the daily air temperature, the other meteorological variables were significantly different between the two growing seasons. The daily air temperature showed a trend of first increasing and then decreasing, with a peak appearing in early August (Figure 1a). The mean temperatures in the 2013 and 2014 growing seasons were 23.6 °C and 23.2 °C, respectively, which were comparable (Figure 1b). Total precipitation of the ambient condition in 2013 was 401.9 mm, which was 1.4 times that of 287.2 mm in 2014 (Figure 1c,d). However, the cumulative solar radiation of 2678.4 MJ m−2 during the 2013 growing season was significantly less than the 3547.13 MJ m−2 in 2014 (Figure 1e,f). Moreover, the mean V P D was 0.58 kPa in 2013, which was significantly lower than the 0.75 kPa in 2014 (Figure 1g,h). Overall, the thermal conditions were analogous in the 2013 and 2014 growing seasons; the moisture conditions in 2013 were better than those in 2014, while the solar radiation conditions were the opposite.

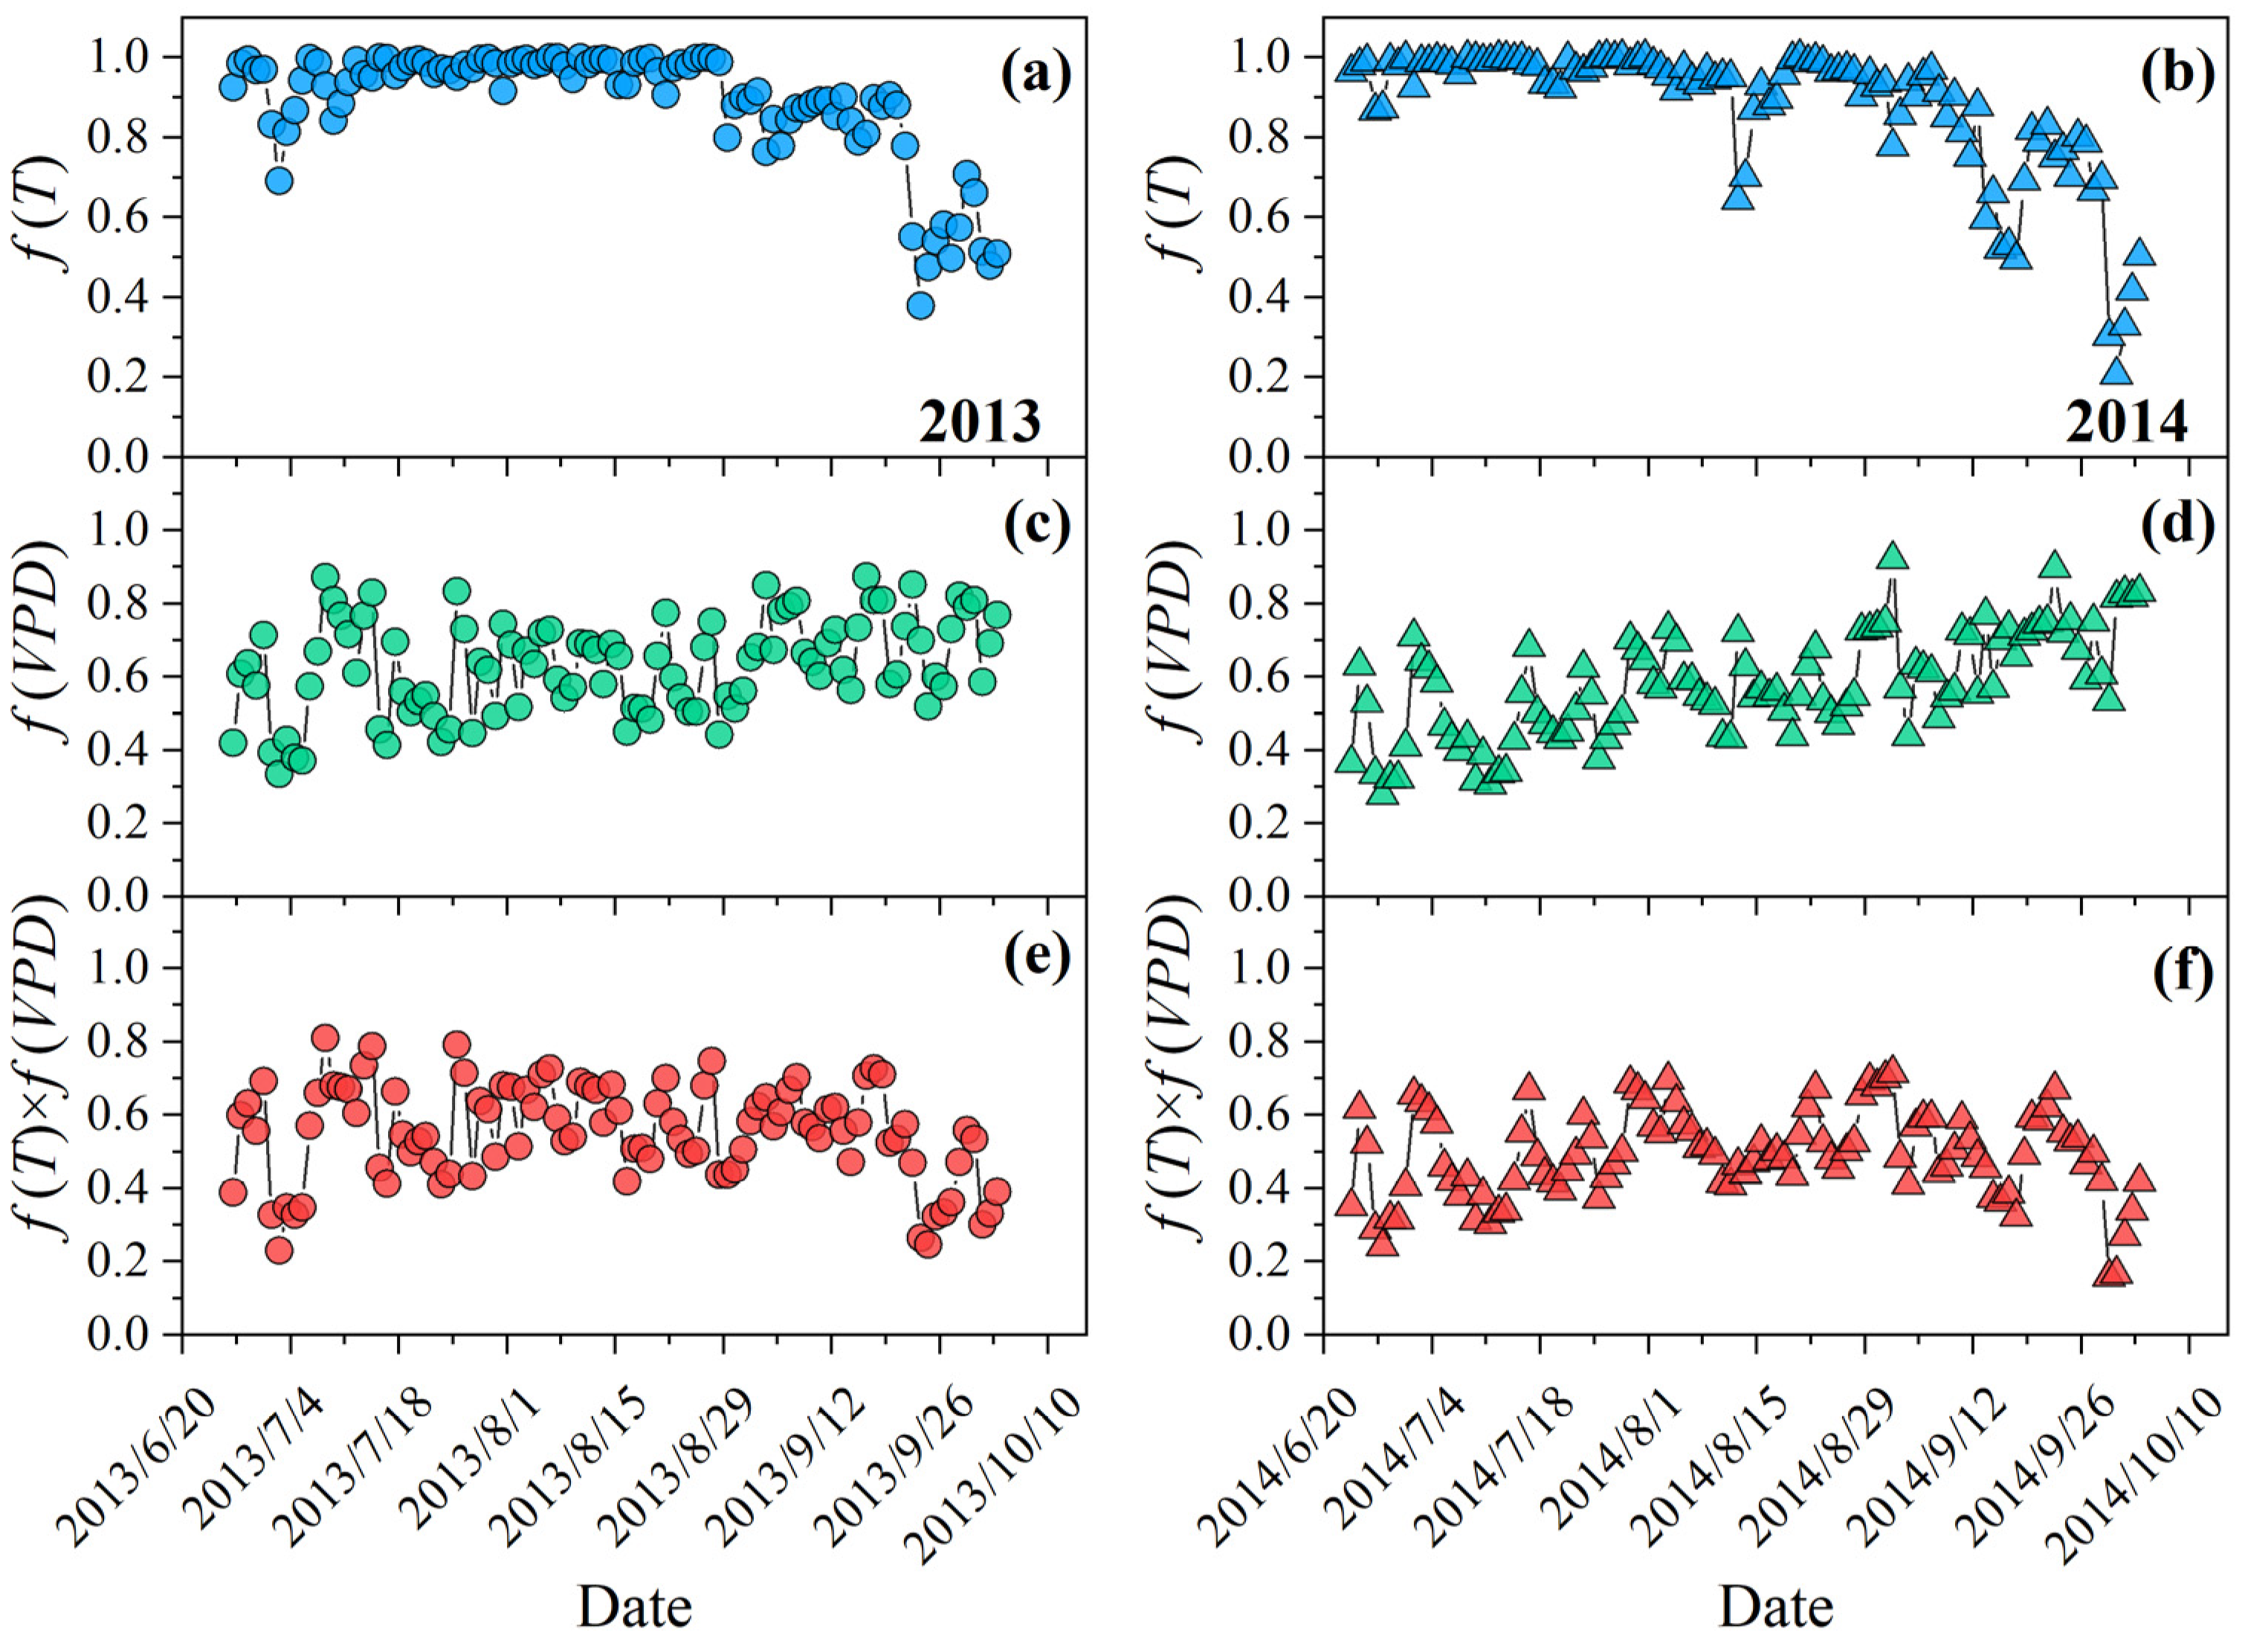
3.2. Dynamics of Downregulation Scalars for the Effects of Temperature and VPD on Climatic Production Potential

As the thermal conditions were similar in the 2013 and 2014 growing seasons, the downregulating scalars for the effect on climatic production potential were difficult to distinguish, and both showed a strong negative effect (indicated by lower positive values) in the later growth period (Figure 2a,b). The positive effect of V P D on climatic production potential roughly showed an increasing trend during the 2013 and 2014 growing seasons. In addition, the mean value of 0.63 was higher than the 0.57 in 2014 (p < 0.05), which suggested that the positive effect of V P D on climatic production potential was larger than that in 2014 (Figure 2c,d). The interaction scalar between temperature and V P D (represented by f T f ( V P D ) ) was 0.55 and 0.49 in 2013 and 2014, respectively (Figure 2e,f). Therefore, the relative effects of temperature and V P D on climatic production potential were more dominated by V P D .

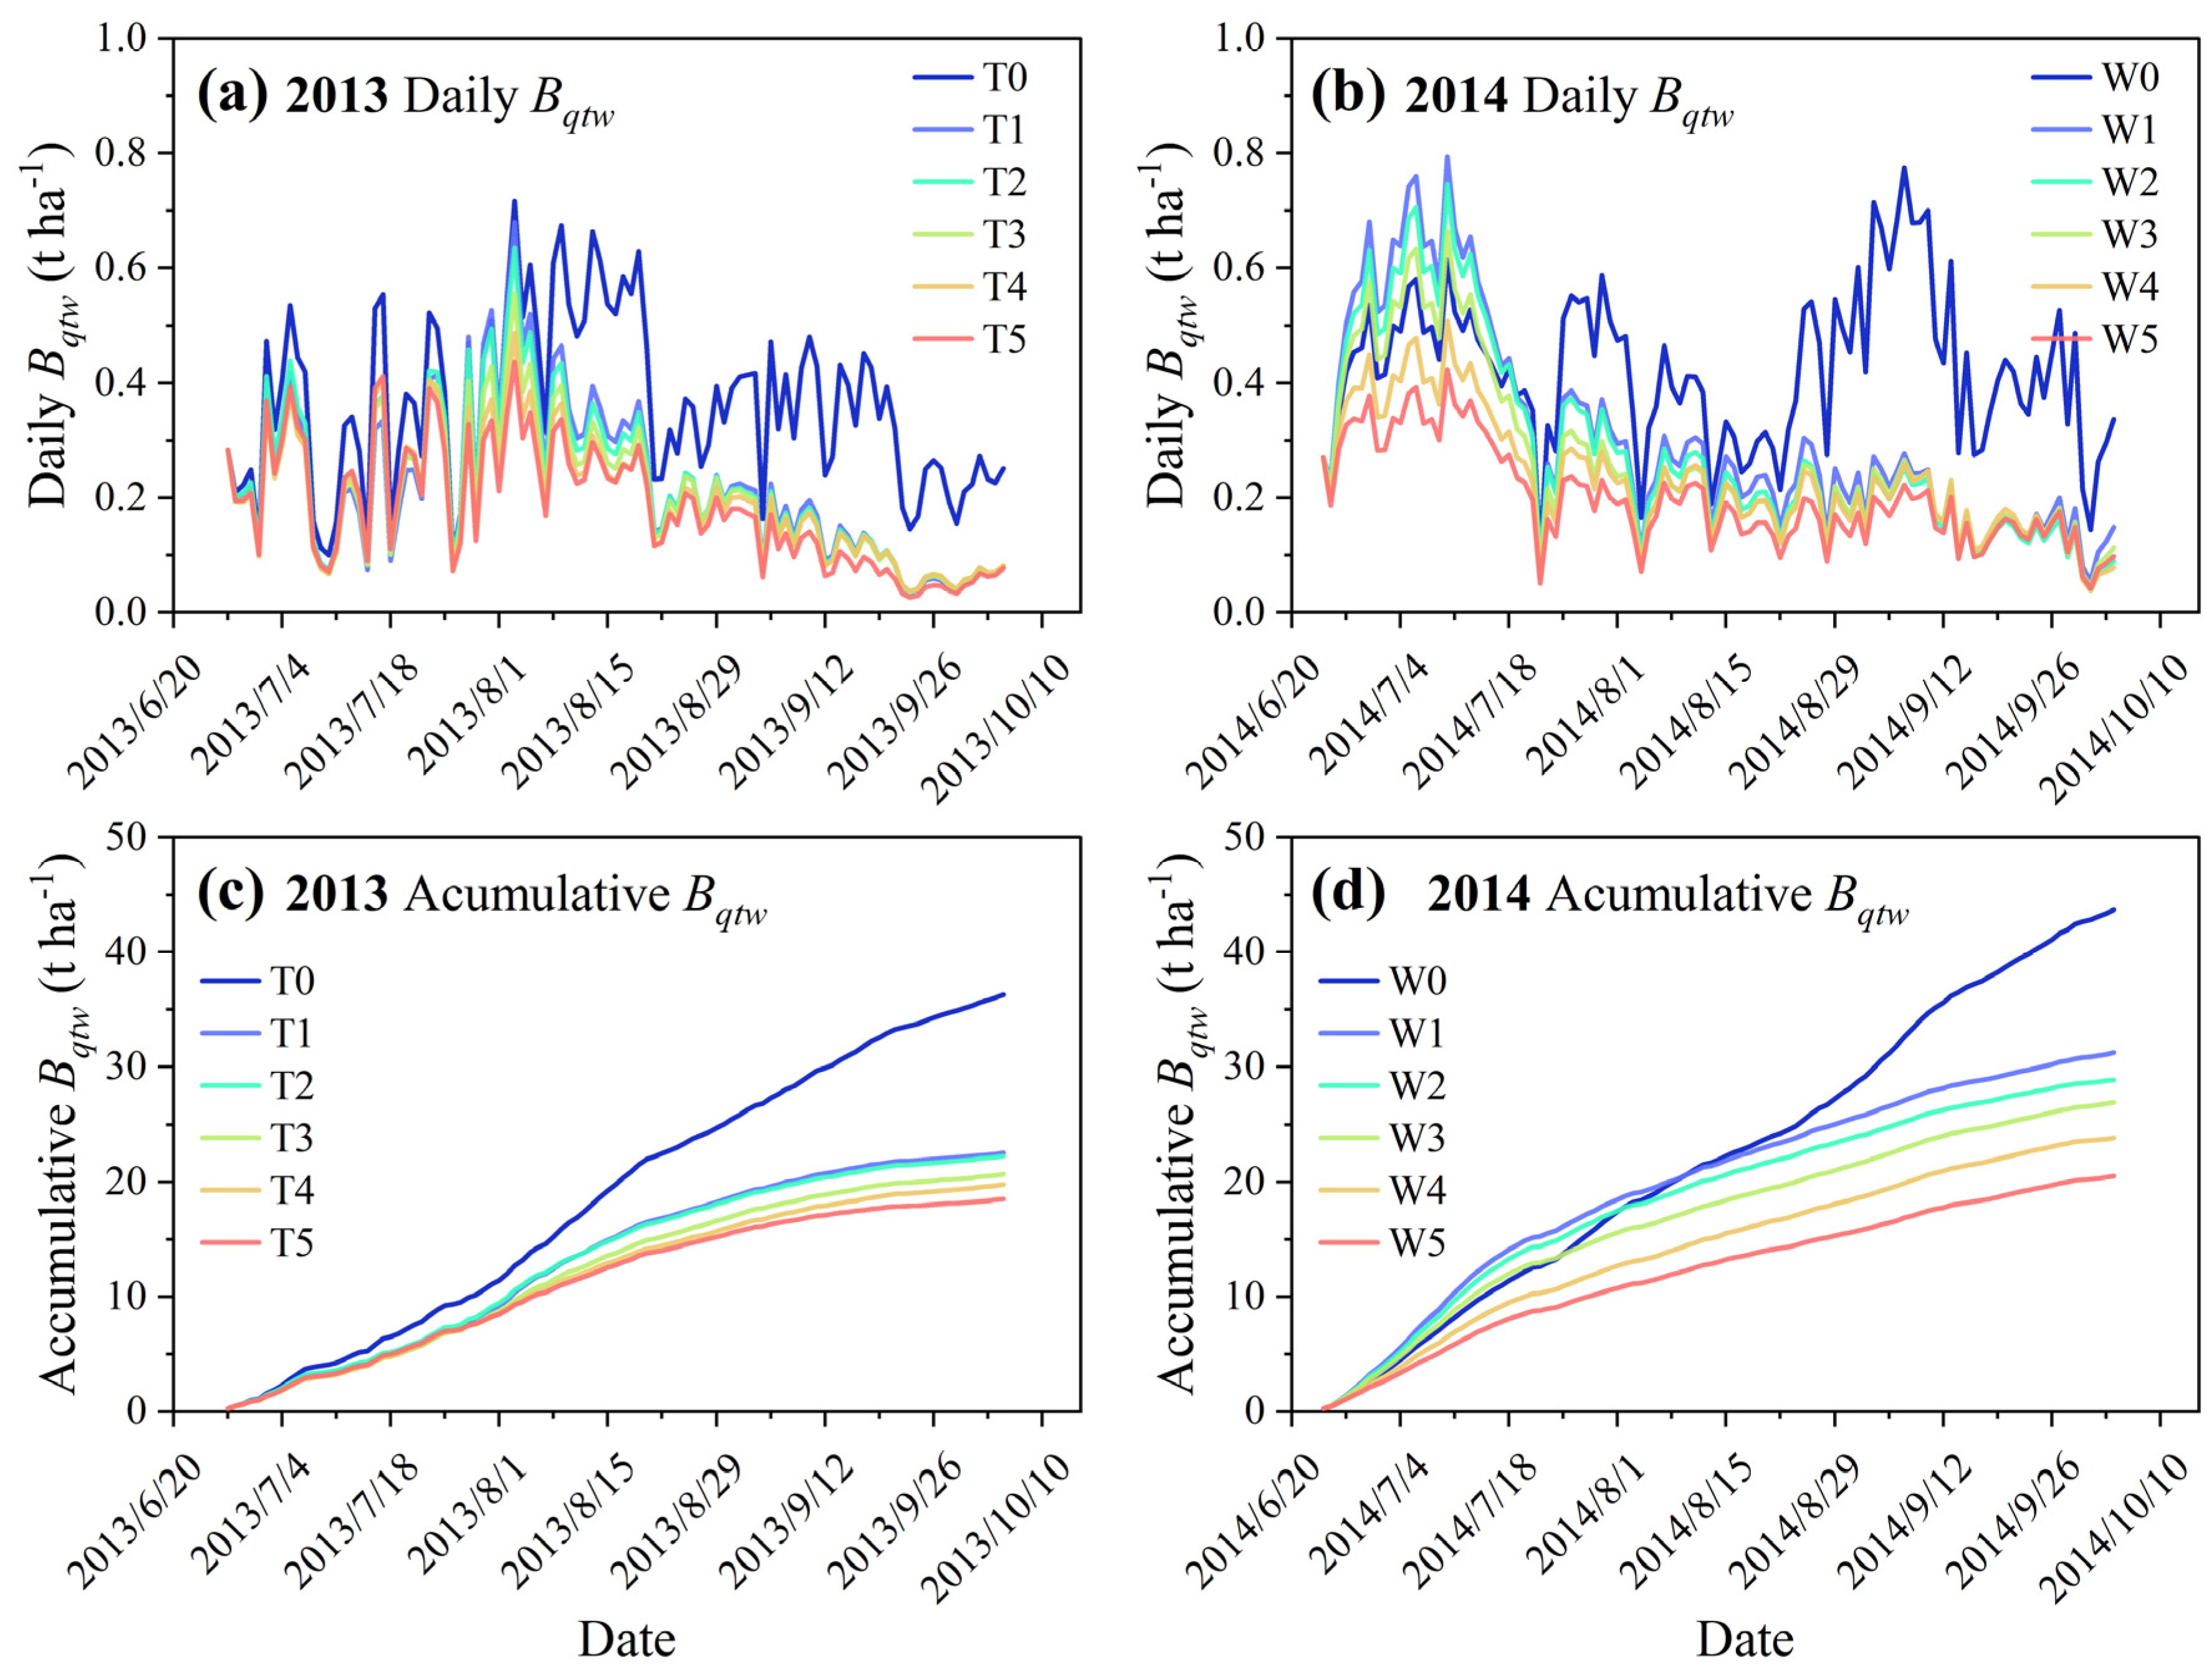
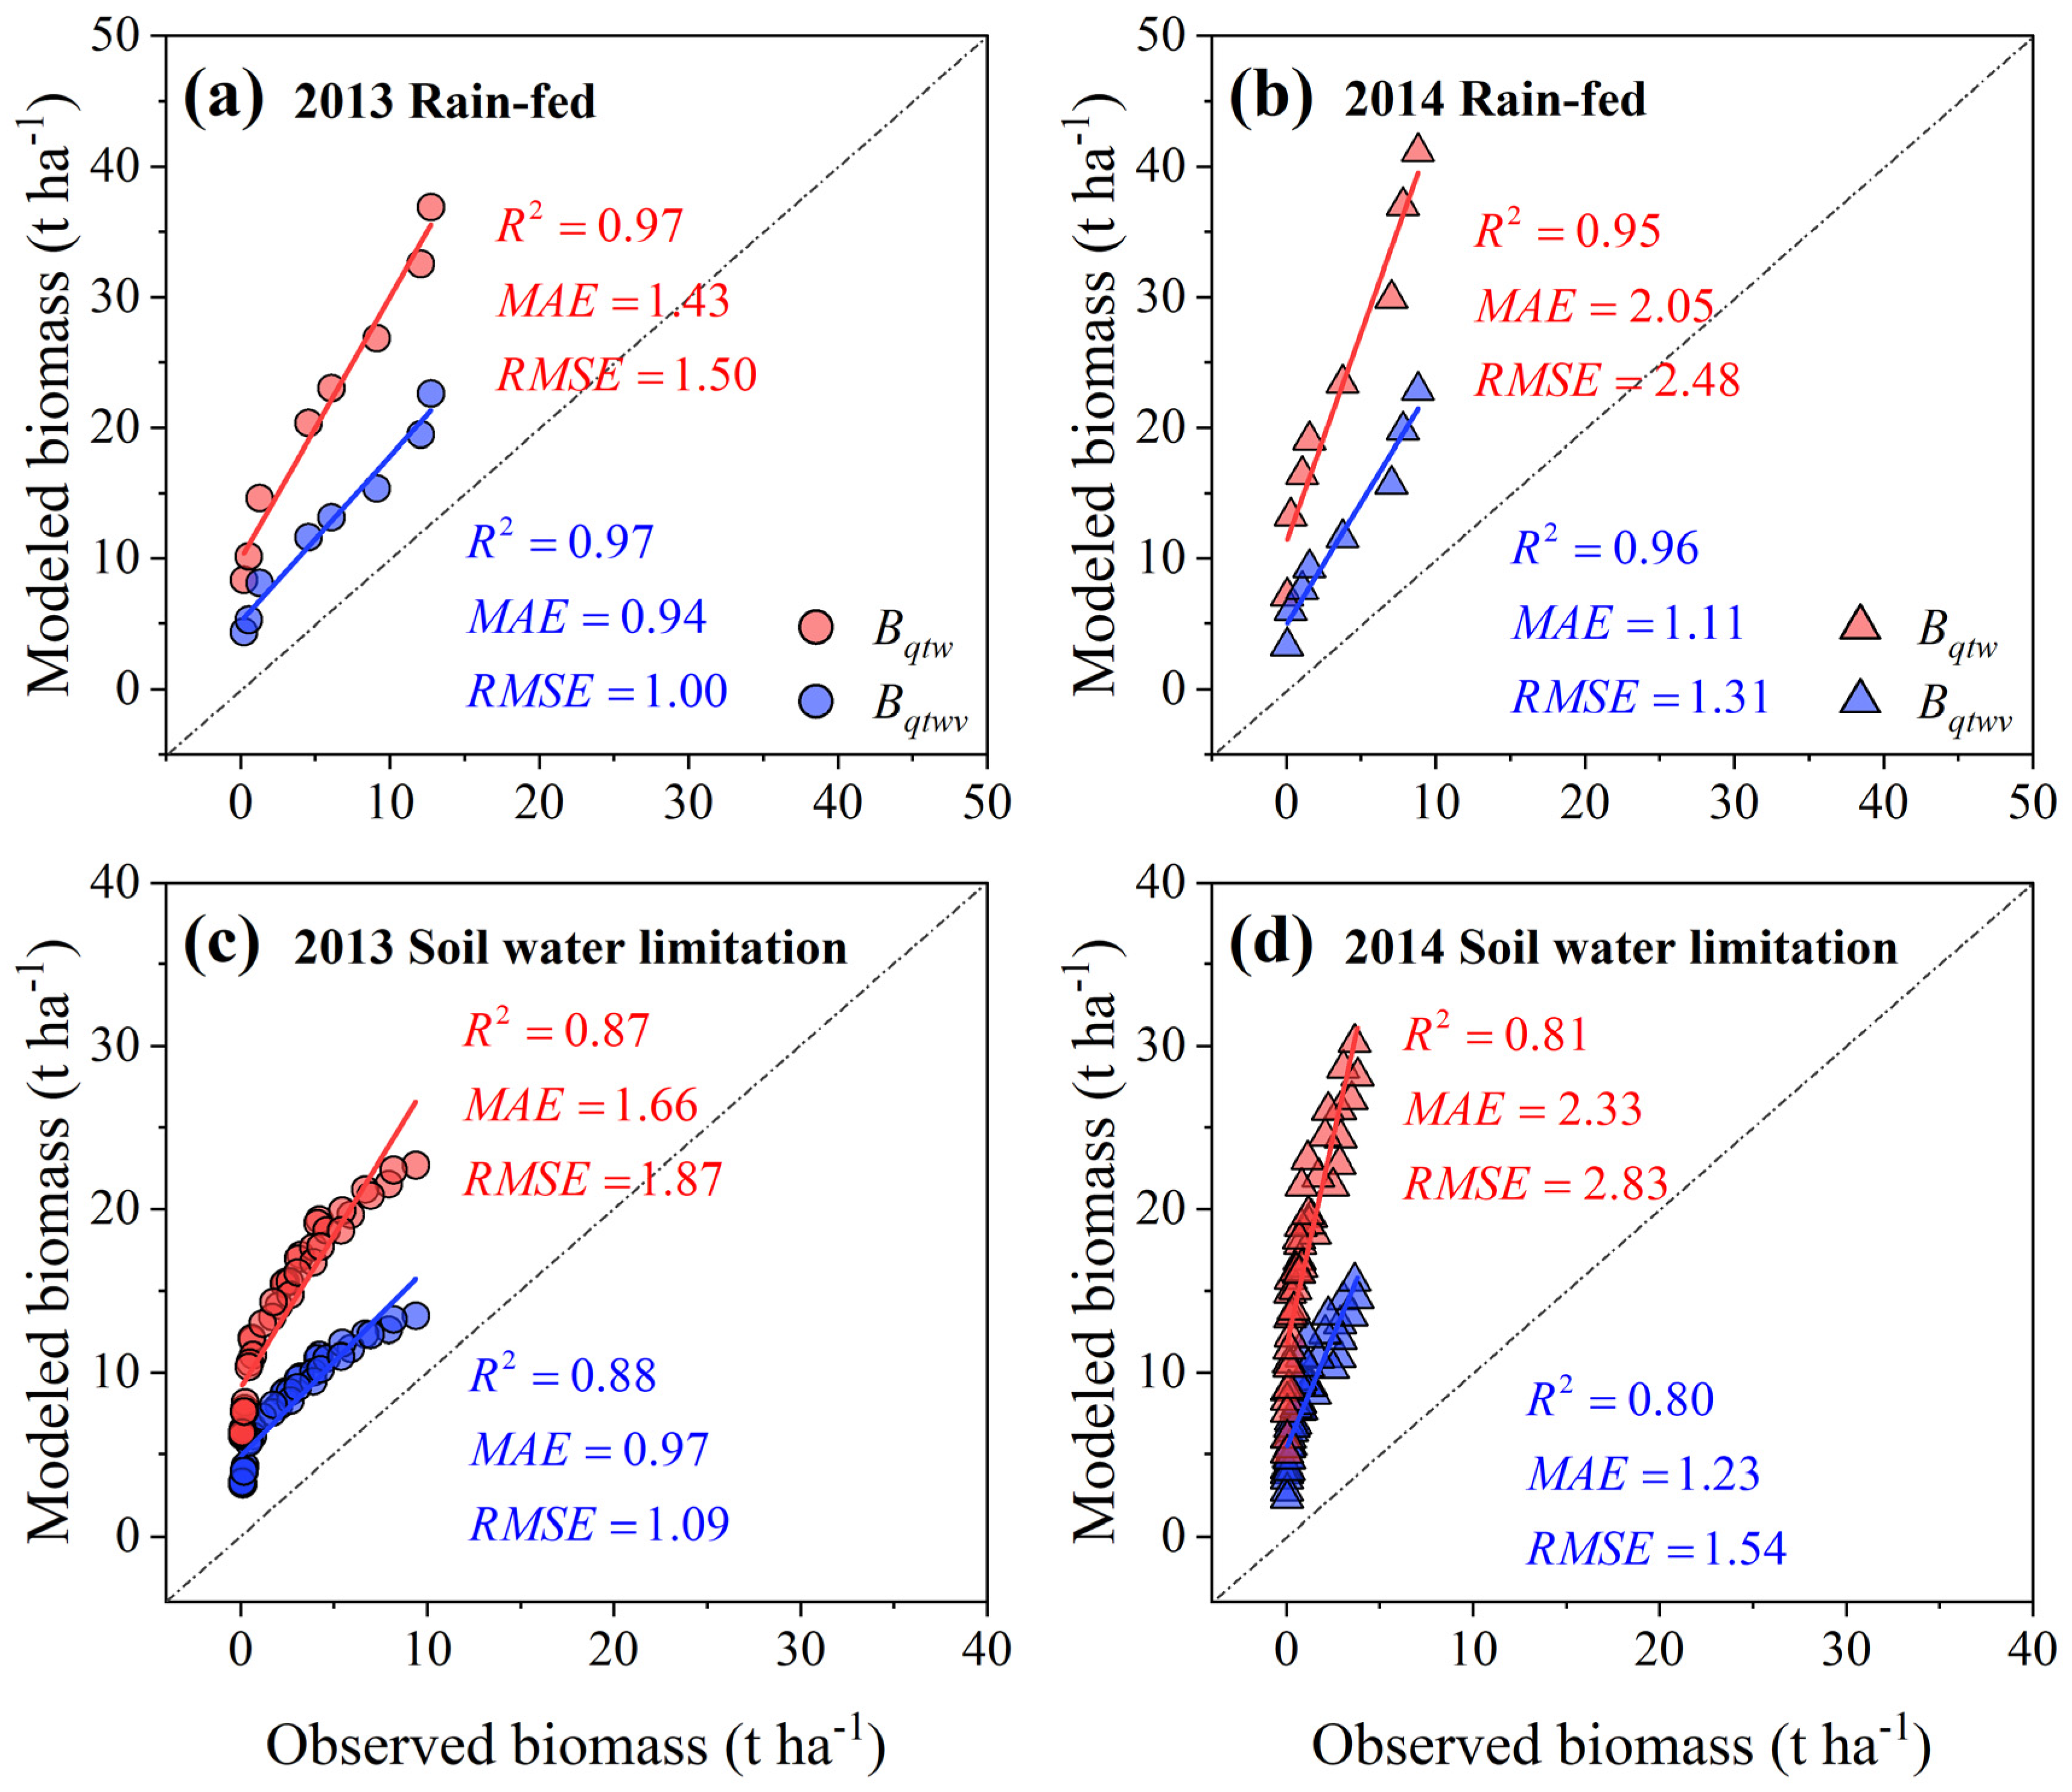
3.3. Climatic Production Potential across Rainfed and Soil Water Deficit Treatments

Due to the differences in soil water availability (Figure S1), the dynamics of B q t w among rainfed and evolving soil water limitation treatments were significantly different in both growing seasons (Figure 3). In 2013, daily B q t w of the rainfed treatment (T0) fluctuated significantly within 0.10~0.72 t ha−1, with a mean value of 0.36 t ha−1 (Figure 3a). Meanwhile, the daily B q t w among evolving soil water limitation treatments (T1–T5) shared similar patterns with an obvious declining trend after drought (applied on July 24, seven-leaf stage) (Figure 3a). In 2014, the rainfed treatment (W0) had a higher mean value of 0.42 t ha−1 compared with T0. The declining trend of the W1–W5 treatments was also observed after drought (applied on July 2, three-leaf stage) (Figure 3b). Both the T0 and W0 treatments had a higher accumulative B q t w than the evolving soil water limitation treatments across the growing seasons (p < 0.01). In addition, the accumulative B q t w of the evolving soil water limitation treatments showed a cut-off point after the limited water was applied, respectively, and the differences among treatments gradually increased with soil drying (Figure 3c,d).
After being corrected by V P D , the variations of B q t w v under rainfed and evolving soil water limitation treatments shared a similar trend with B q t w , although with smaller fluctuations (Figure 4a,b). In addition, the cumulative B q t w v also had a similar dynamic pattern to B q t w in the 2013 and 2014 growing seasons, respectively. However, the amount of accumulative B q t w v was about half of B q t w (Figure 4c,d).
Under rainfed conditions, linear regression analysis ( B q t w vs. Biomass and B q t w v vs. Biomass) indicated that the R2 value did not significantly increase, while the MAE and RMSE were significantly reduced after the production potential was corrected by V P D . The MAE and RMSE decreased by 34.3% and 33.3%, respectively, in 2013 (Figure 5a), compared to those of 45.9% and 47.2% in 2014 (Figure 5b). Similar results were also obtained for evolving soil water limitation treatments. There was no significant change in R2 according to linear regression; however, a 41.6% reduction in the MAE and a 41.7% reduction in the RMSE were obtained during the 2013 growing season (Figure 5c), while they were 47.2% and 45.6% during the 2014 growing season, respectively (Figure 5d).

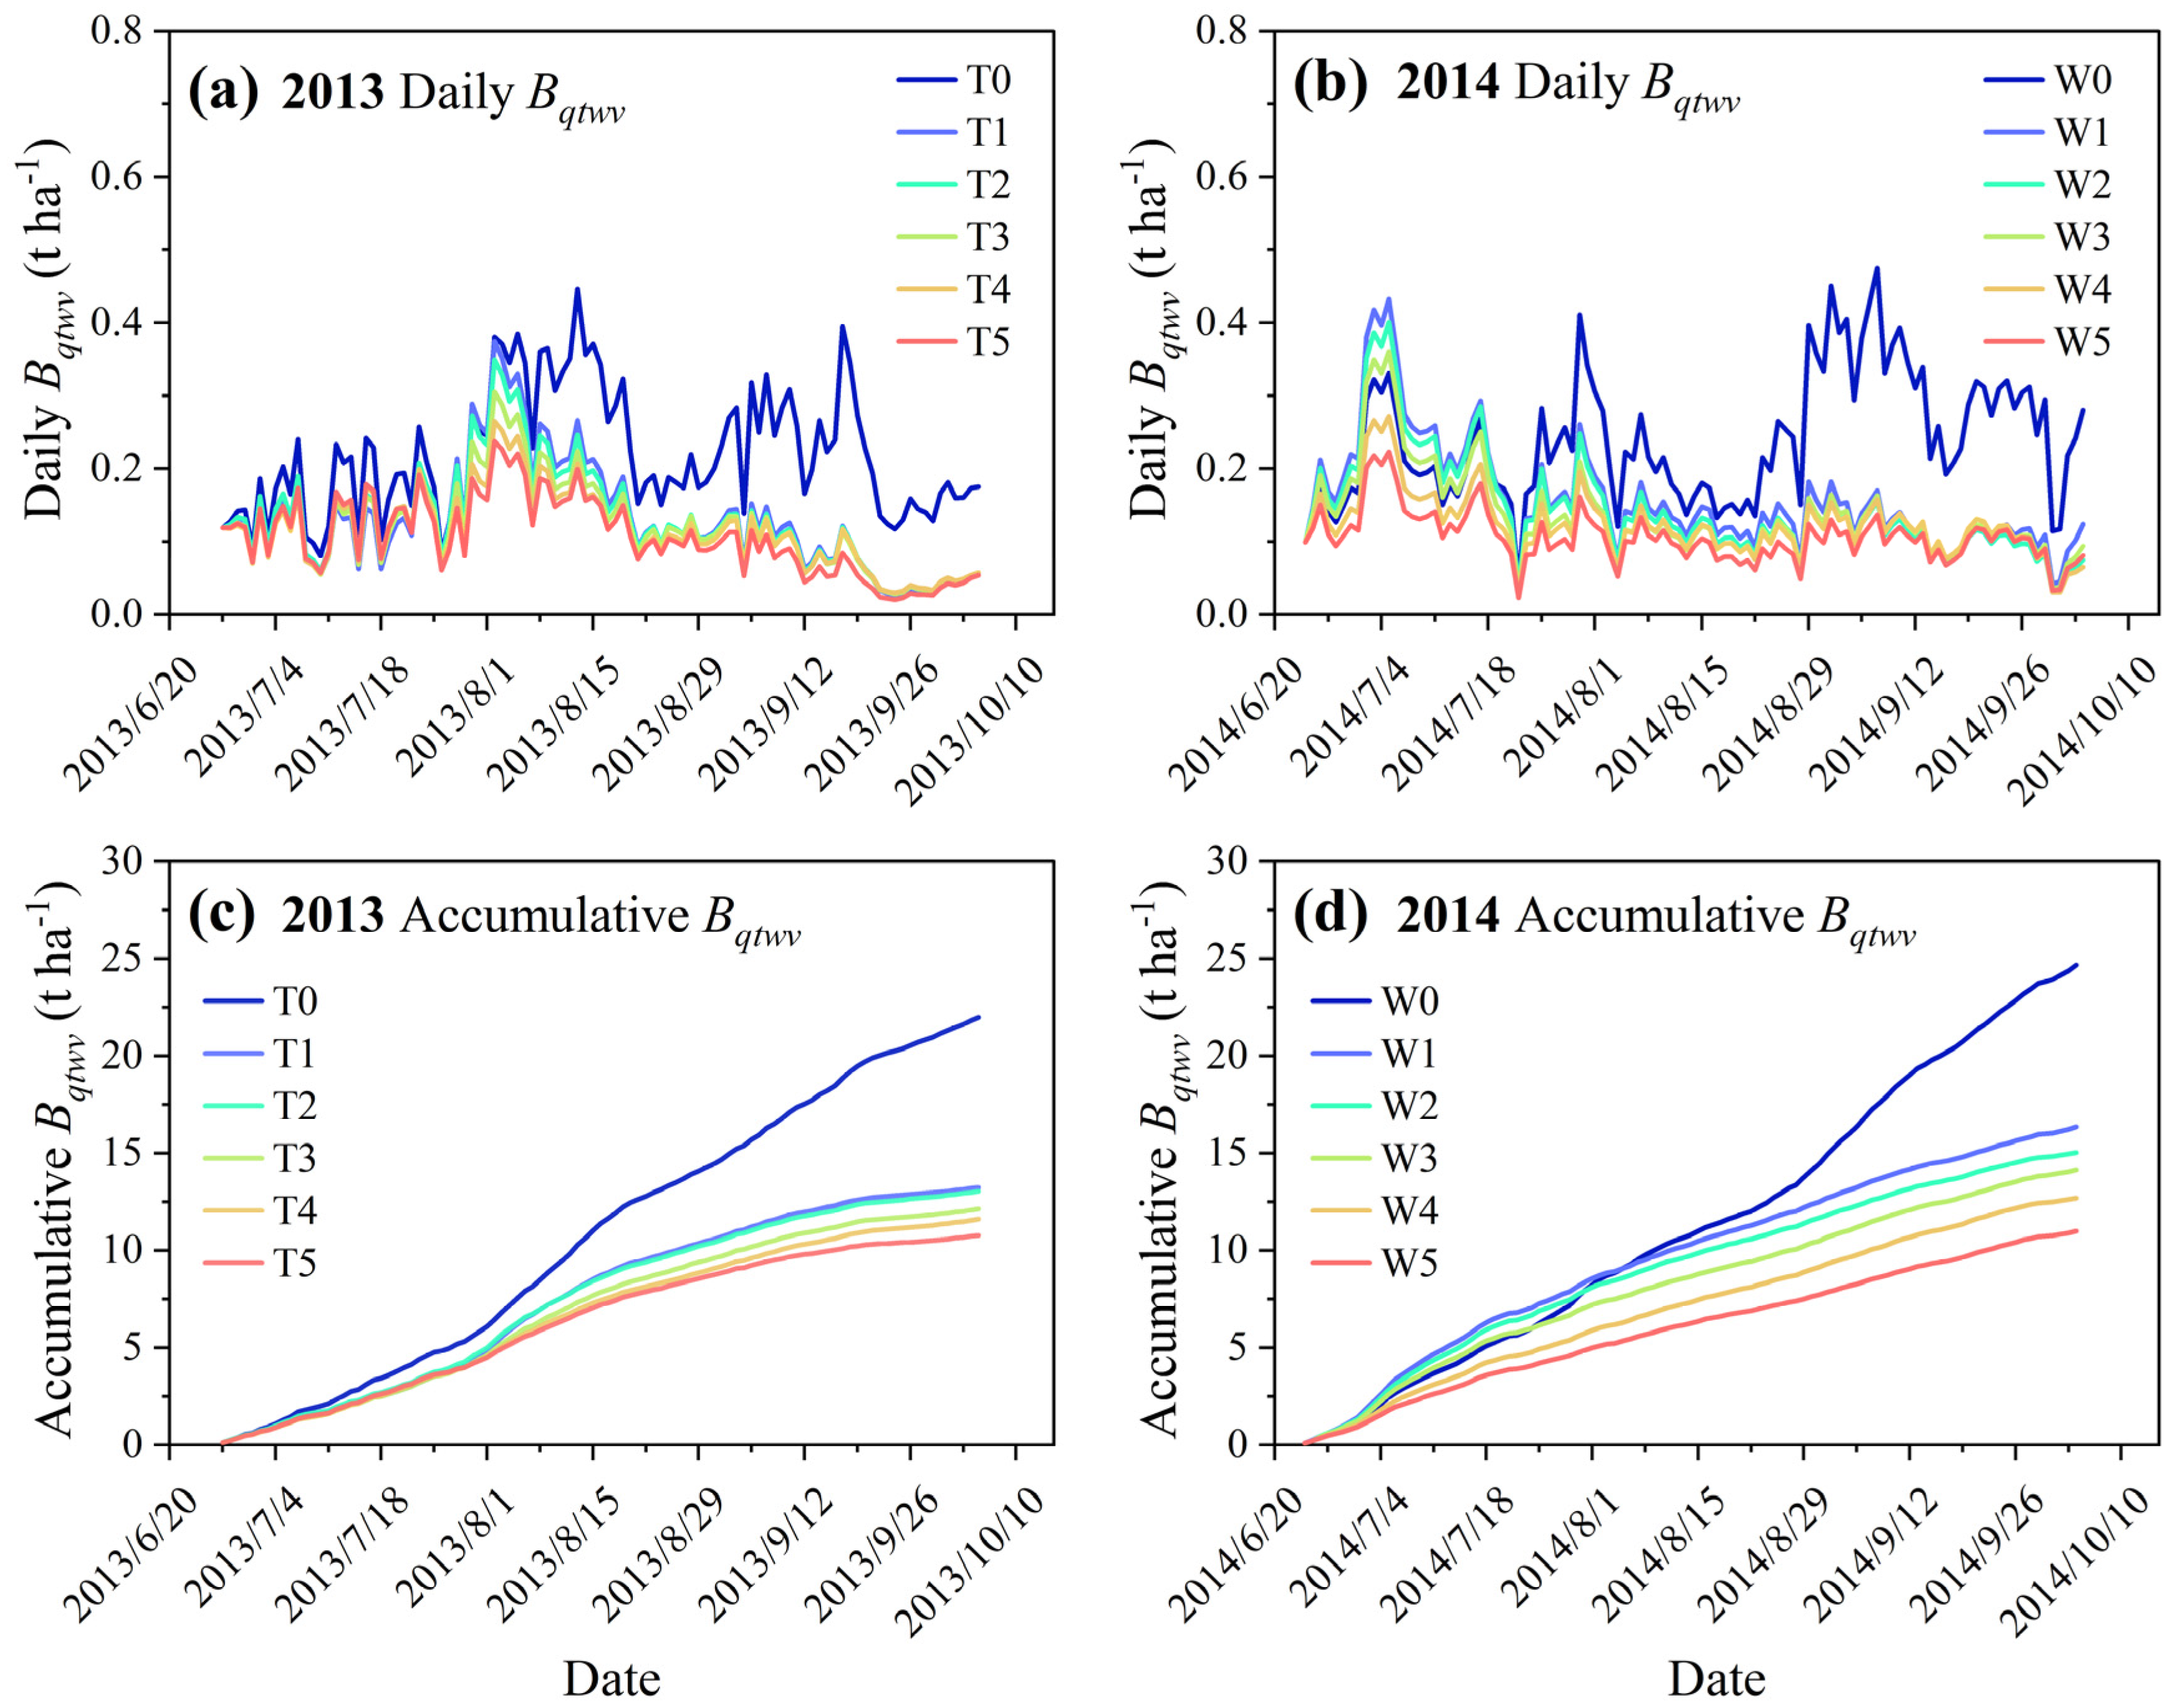
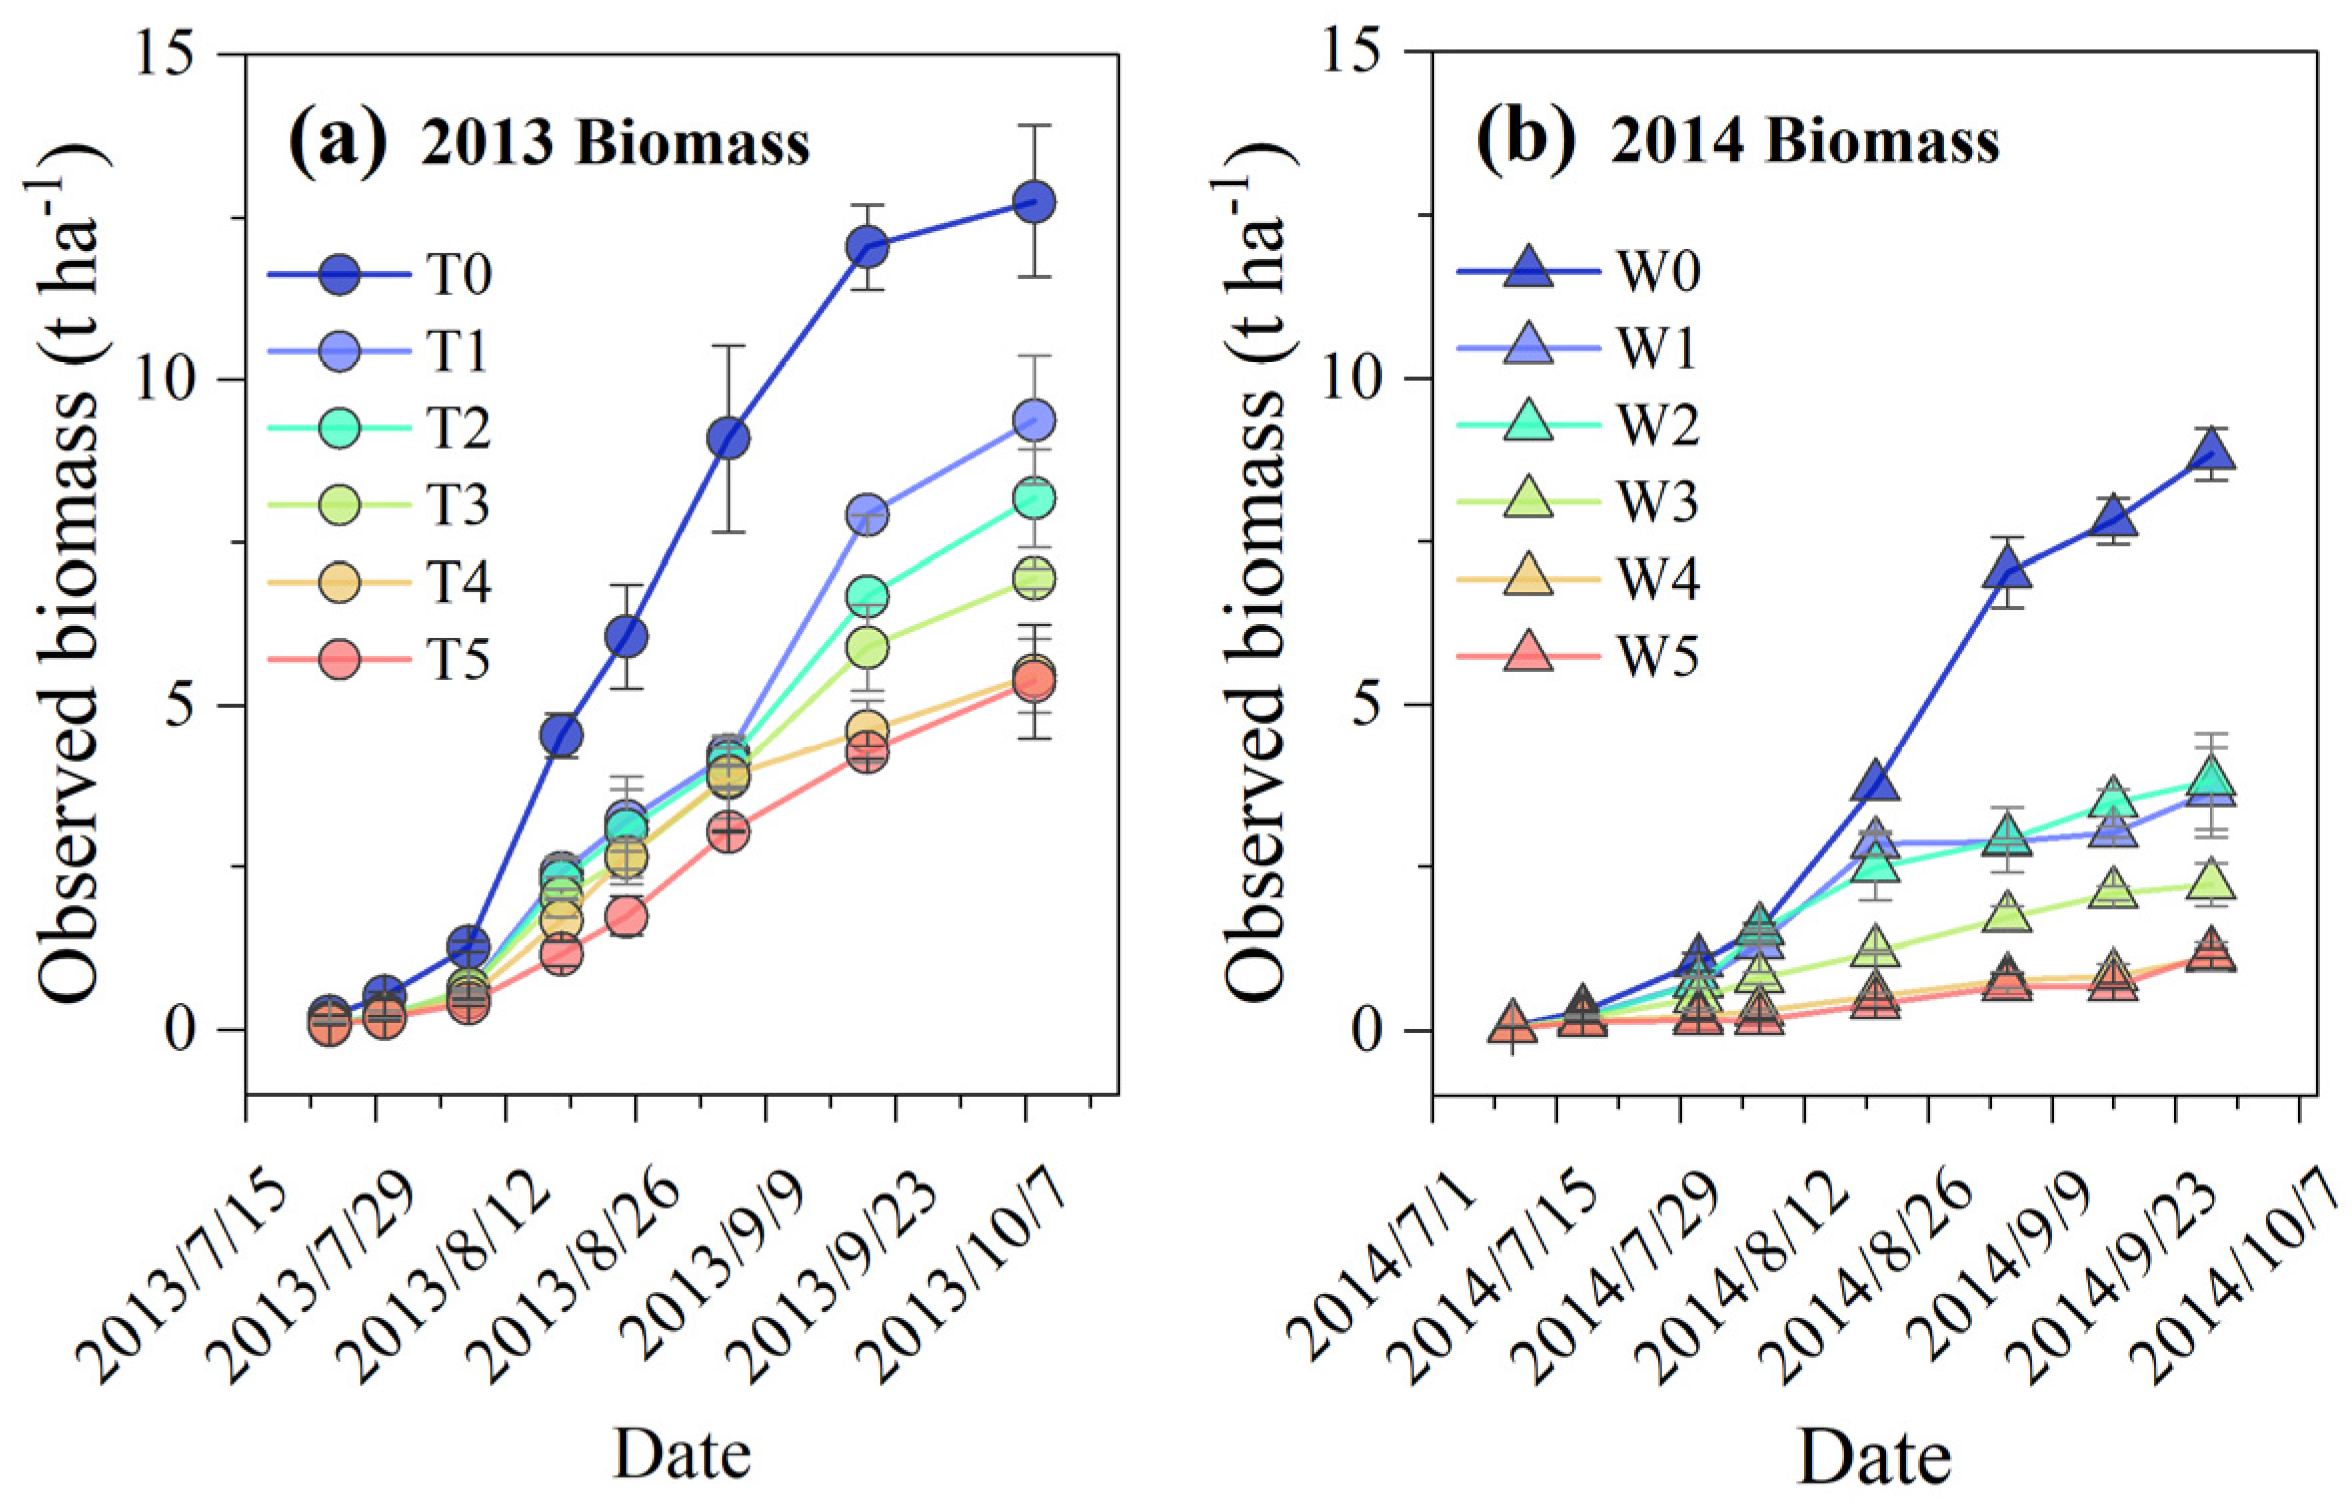
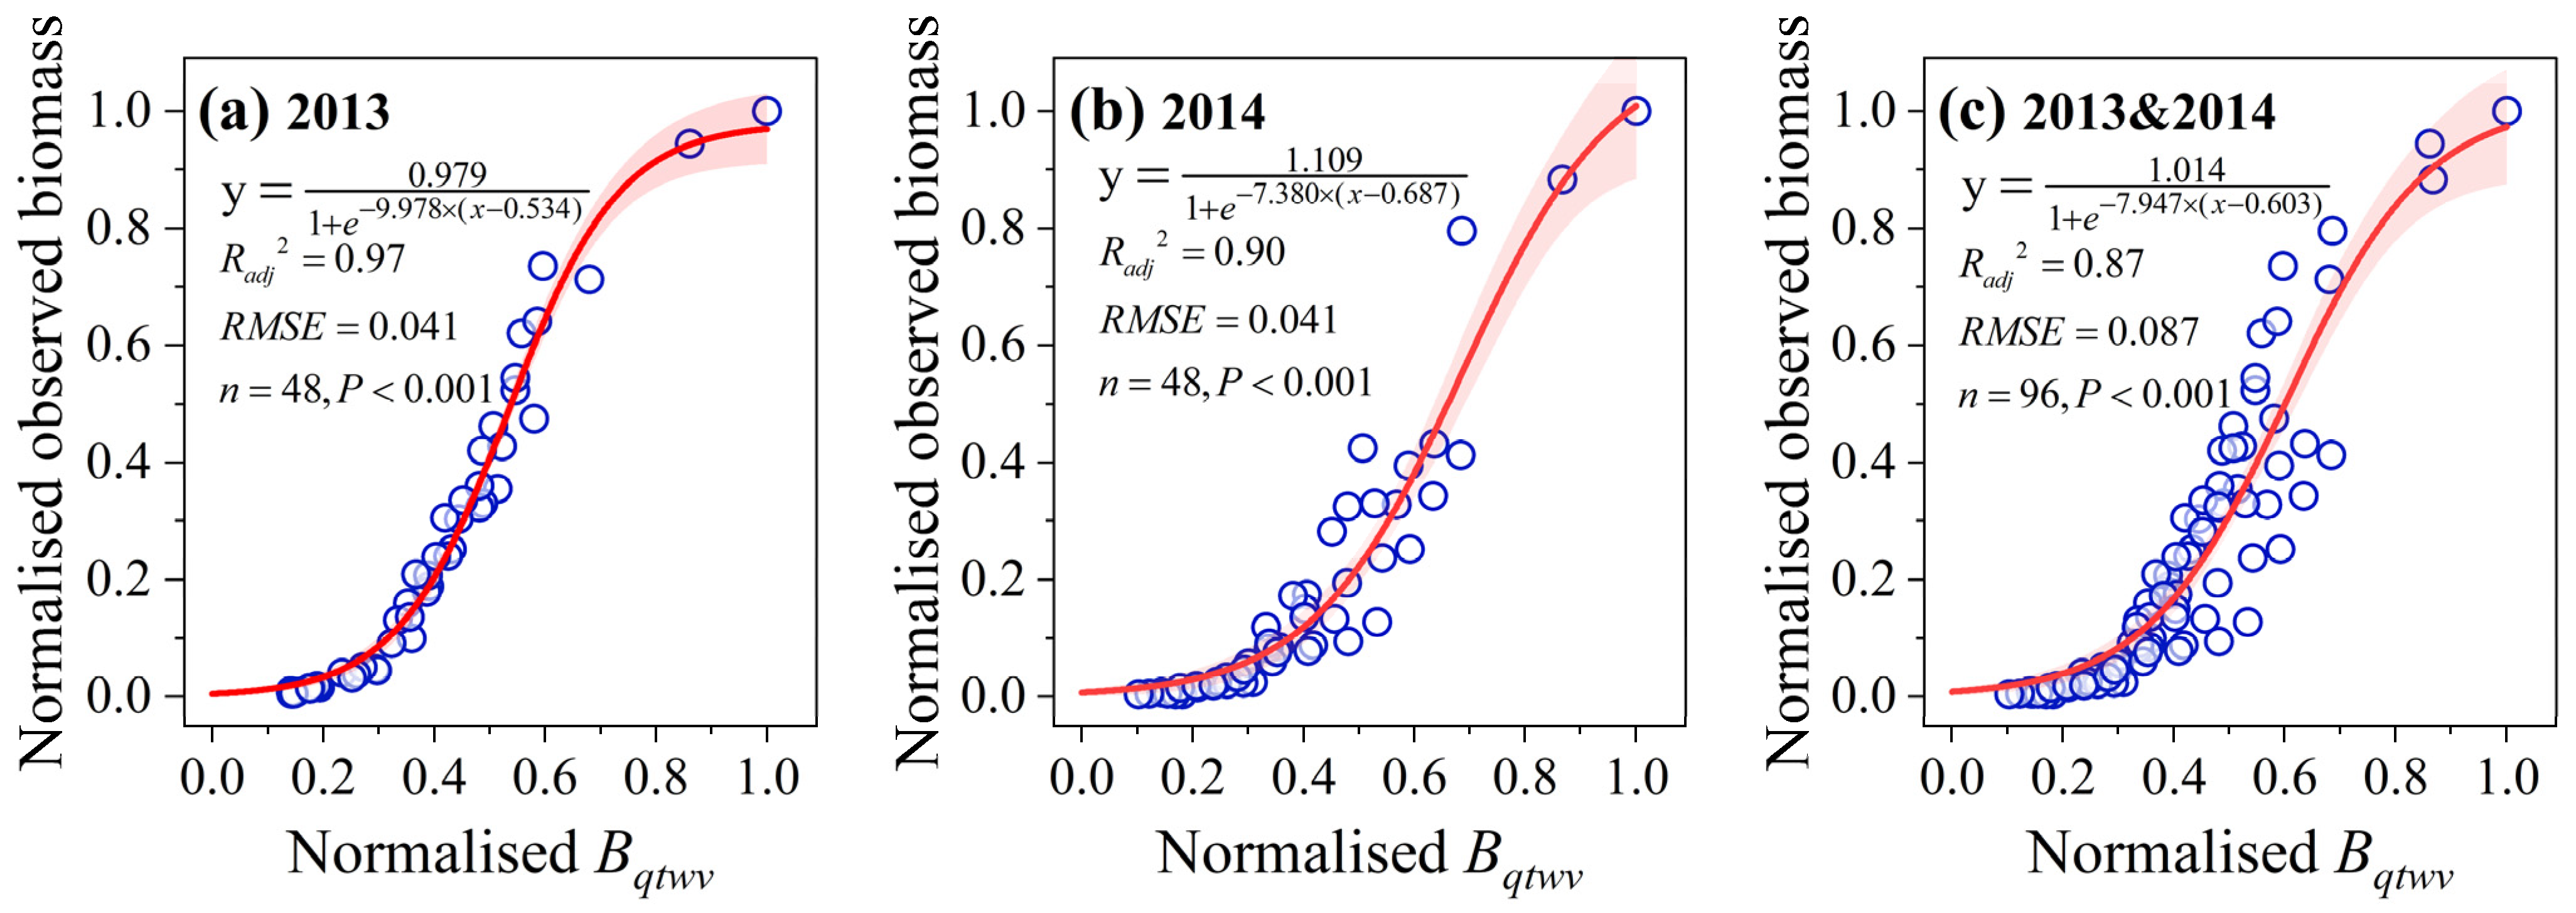
3.4. Effect of Evolving Soil Water Limitation on the Response Pattern of Biomass Accumulation to Climatic Production Potential

Compared with the rainfed conditions, evolving soil water limitation treatments significantly decreased biomass accumulation. In addition, biomass accumulation decreased with the reduction in irrigation in both years (Figure 6).
Using the final observed biomass and accumulative B q t w v under the rainfed treatment in 2013 and 2014 as references, respectively, we normalized the T1–T5 and W1–W5 treatments (Figure 7). Then, the response of the normalized biomass to normalized B q t w v was well represented by a three-parameter logistic function. The fitting results suggested that the standardized intrinsic growth rate of 9.98 in 2013 was significantly greater than the 7.38 in 2014 (Figure 7a,b). In addition, the standardized timing of maximum growth was 0.53 and 0.69 during the 2013 and 2014 growing seasons, respectively. In other words, the timing for maximum growth rate to occur in 2014 was also significantly postponed by the soil water limitation applied at the three-leaf stage, compared with that applied at the seven-leaf stage in 2013 (Figure 7a,b). These findings suggested that evolving soil water limitation significantly reduced the biomass accumulation of maize plants, as reflected by the decrease in the intrinsic growth rate response to climate production potential and delayed timing of the maximum growth.

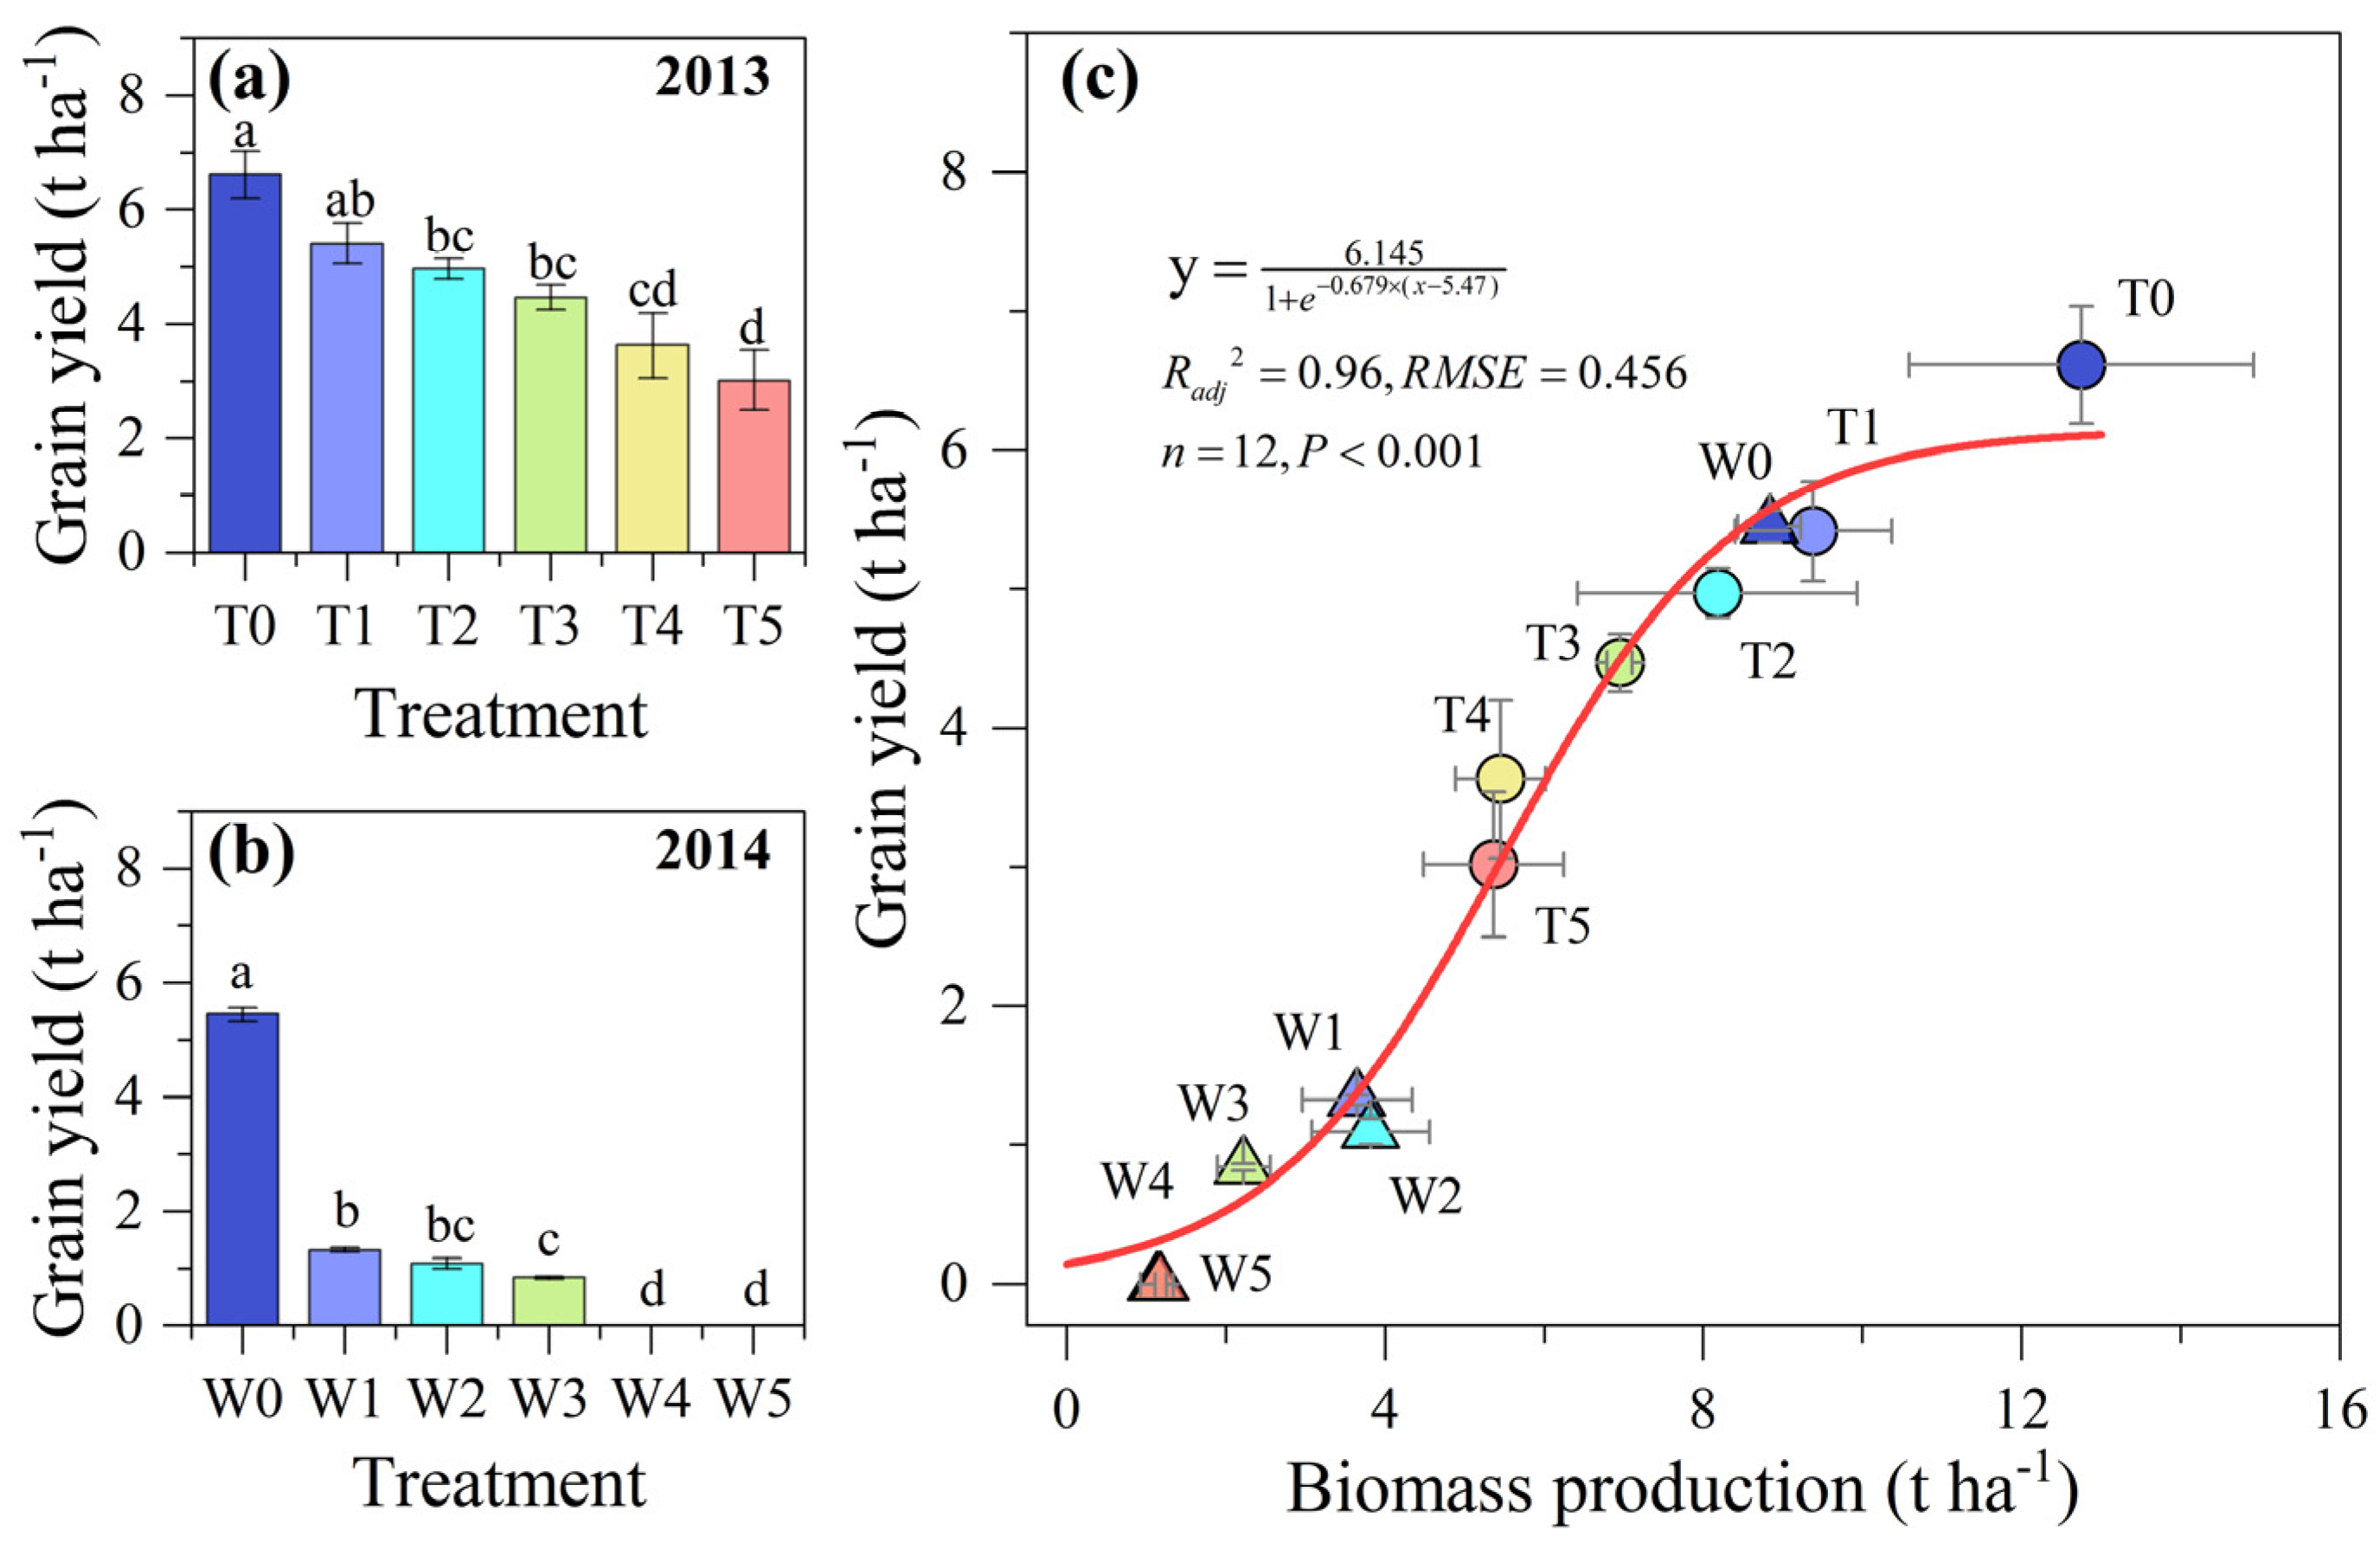
3.5. The Relationship between Biomass and Grain Yield across Rainfed and Evolving Soil Water Limitiation Conditions

The one-way ANOVA analysis showed that grain yields of evolving soil water limitation treatments were much lower compared to rainfed treatments (Figure 8a,b). In addition, evolving soil water limitation treatments applied at the three-leaf stage and seven-leaf stage significantly decreased maize yield (Figure 8a,b). In 2013, maize grain yield obviously decreased with the reduction in irrigation, such as the grain yield of the T5 treatment (3.02 t ha−1) being only 55.7% of the T1 treatment (5.22 t ha−1) (Figure 8a). In 2014, the grain yields of T1–T3 were 1.32 t ha−1, 1.09 t ha−1, and 0.84 t ha−1, respectively, while no yield was obtained in the T4–T5 treatments (Figure 8b). According to the pooled data (rainfed and evolving soil water limitation treatments), grain yield was shown to be a saturating function of biomass (Figure 8c). The response rate of grain yield to biomass first increased and then decreased. At the high end of biomass values, the increment in yield diminishes with the increment in biomass. The results indicate that the nonlinear, saturating relationship of grain yield to biomass applies across rainfed and soil water limitation conditions.

4. Discussion

4.1. Climate Change Influences Crop Growth and Production Potential

Climate change has profound impacts on global agriculture and will continue to have them [1,5]. Solar dimming or brightening can substantially change the net amount of radiation arriving at the crop vegetation canopies and then affect crop photosynthesis and growth and, ultimately, crop yields [46,69]. In recent years, there is increasing interest from researchers over the impact of solar radiation on agricultural production [70,71]. The approximately 27% increase in maize yield in the US Corn Belt from 1984–2013 could be attributed to solar brightening [72]; meanwhile, an approximately 19% decrease was induced by solar dimming on the NCP during 1960–2015 [46]. In this study, we found that the cumulative solar radiation during the growing season in 2013 was less than that in 2014, with a deficit of 868.7 MJ m−2 (Figure 1). These results suggested that the seasonal variation of solar radiation input needs to be addressed when studying the impacts of climate change on agriculture production.
Relative to wheat and rice, maize is more sensitive to climate warming. Each 1 °C increase in global mean temperature is predicted to reduce global yields of maize by 7.4%, of wheat by 6.0%, and of rice by 3.2% [73]. In addition, rainfed maize is more vulnerable to increasing temperatures than irrigated maize [74]. In general, maize tends to display a higher stomatal conductance, transpiration rate, and intercellular CO2 concentration under high V P D conditions, ultimately leading to reduced total biomass [48]. Each 100 Pa increase in V P D during the milking stage would reduce maize yield by 127 kg ha−1, and it decreased sharply by 82 kg ha−1 when the maximum temperature was higher than 29 °C [75]. The effect of heat damage caused by increased temperature on maize yield loss is mainly caused by decreased pollen vitality, resulting in a decrease in pollination, and ultimately, this decreases the number of grains and grain weight [68,76]. Interestingly, the impact mechanisms of temperature and V P D on crop growth and development are different. In detail, temperature influences plants primarily through the temperature dependence of biochemical and developmental processes, such as photosynthesis and respiration [51], whereas a V P D influences plants mainly by increasing atmospheric water demand and plant water loss [77]. Because of the intimate connection between temperature and V P D , the effect of V P D on crop growth and development is often neglected or attributed to temperature. In this study, the temperature conditions were found to be similar, while the V P D s were significantly different the during two growing seasons (Figure 1). If the effect of V P D on production potential was not incorporated (Figure 2), the climatic production potential would be largely overestimated (Figure 5). Therefore, it is necessary to consider the impact of V P D on climatic production potential, especially under severe weather and climatic conditions.

4.2. Effect of Evolving Soil Water Limitation on Biomass Accumulation and Its Relation to Climatic Production Potential

Crop biomass accumulation is a result of the growth of different organs (e.g., leaves, stems, roots, and ears), which is a complex and dynamic process regulated by interactions between genetic factors and the environment [55,78]. In addition, growth is also a reflection of intricate source–sink dynamics [78]. Source and sink strength are highly responsive to environmental changes, and they are particularly susceptible to drought conditions [79]. Reduced source and sink strengths during soil drying can lead to a large reduction in crop biomass accumulation and grain yield [80,81]. Prolonged drought decreased the growth rate of plant organs, reduced plant biomass accumulation, and delayed flowering time, although an extension of growth duration has been observed [78,82]. However, the highly organized succession of maximum growth rates of the distinct organs was proved to be unchanged in response to prolonged drought [78].
In this study, evolving soil water limitation was applied at the seven-leaf stage and three-leaf stage during the 2013 and 2014 growing seasons, respectively. The biomass accumulations of maize were significantly decreased with irrigation reductions. The highest recorded yield in this region was 15.4 t ha−1 (equivalent to 30.8 t ha−1  B q t w v ) [40], which was much higher than those obtained values of B q t w v among the T1–T5 treatments (3.19~22.60 t ha−1) and the W0–W5 treatments (2.35~22.85 t ha−1). According to the continuous observations and pooled data, a gradient of soil water limitations was obtained at the flowering–milking stage. The response patterns of biomass accumulation to climatic production potential were logistic, with three distinct stages under both evolving soil water limitation and rainfed conditions, implying that the biomass accumulation pattern was conservative. Moreover, the dynamic pattern of biomass accumulation suggested that the reduced biomass was achieved by lowering the intrinsic growth rate and delaying the timing of the maximum growth rate (Figure 7). These findings could be considered as a further confirmation and complement for the previous findings [78].

4.3. The Relationship between Biomass and Grain Yield Affected by Soil Water Condition

In recent years, the technology used for the genetic breeding of maize has significantly advanced, contributing to approximately 75% of the yield increase [83,84]. Genetic gains have been associated with improved stress tolerance related to a higher leaf area index and HI. Maize grain yield is strongly related to the number of kernels, which depends on the accumulation of ear biomass and the efficiency of using this biomass for kernel set [85]. Therefore, the impact of drought on the relationship between biomass and grain yield involved two aspects: the rate of plant biomass accumulation and the proportion of this biomass that is allocated to the grain after flowering [36]. In contrast to that of wheat, sorghum, and soybean [86,87,88], the proportion of biomass for maize allocated to the ear is not constant and even approaches zero under severe drought conditions. However, a constant HI is often adopted in most crop models [39], and it is not reliable for crop yield estimation, especially under drought or other abiotic stresses. An alternate way is to build a directly general relationship between biomass and grain yield. There is evidence that wheat grain yield is a saturation function of the above biomass within and across varieties [37]. Our results also indicated that the relationship between biomass and grain yield appeared to be nonlinear and saturating across rainfed and drought conditions (Figure 8). Therefore, quantifying the relationship between plant biomass and grain yields across climate environments, varieties, and agricultural management is necessary to optimize yield estimation in a future study.

4.4. Limitations and Future Perspectives

The data collected from the field experiments provided us with an opportunity to assess the dynamic response of biomass accumulation to climatic production potential and its relation to grain yield under a range of evolving soil water limitations applied at two different growth stages. However, there are still some limitations in the implication and generalization of the results, although the data were collected from standardized measurements and processed by strict data quality control and analysis. First, droughts occurring at the three-leaf and seven-leaf growth stages of maize were only evaluated in a single growing season, which did not capture the climate variability range over decades. Nonetheless, due to the field experimental design with various irrigation levels, the response differences in biomass accumulation among different treatments appeared gradually with soil drying, which covered a wide range of soil water content. Therefore, the findings in this study would be robust and reasonable. Second, the production potential calculated by the mechanism-based empirical model was susceptible to the selection of parameters and crop species. In this study, we only used one drought-tolerant maize cultivar, while different genetic characteristics (e.g., growth duration, canopy structure, and optimal temperature for photosynthetic activity) of crop species were not considered. In addition, there was still a large gap between climatic production potential after being corrected by V P D and observed biomass, which should be noticed and remained to be explained. Therefore, future studies are needed to correct the main parameters for production potential calculation with more field data of maize to improve the universality of the results and enhance the understanding of crop production potential response to climate change.

5. Conclusions

Crop climatic production potential is useful for identifying the critical factors limiting resource use efficiency and productivity. However, previous studies on this topic have mostly focused on crop grain yield at an inter-seasonal time scale, and less attention has been paid to the process of biomass accumulation and its relation to grain yield in response to climatic production potential within the growing season, especially under evolving soil water limitations. In addition, the effect of V P D on crop growth and development is often neglected or attributed to temperature. In this study, we used a mechanism-based empirical model and a set of field experiment data to explore the dynamic response of biomass accumulation to climatic production potential and its relation to grain yield. We found that the ability of climate production potential to estimate biomass was well improved when V P D was involved. Soil water limitation significantly inhibited the biomass accumulation of maize plants, mainly by reducing the intrinsic growth rate and delaying the timing of maximum growth. Grain yield showed a nonlinear and saturating relationship with biomass across rainfed and evolving soil water limitation conditions. Overall, V P D cannot be neglected in determining climatic production potential, and drought changed the biomass accumulation pattern but not the relationship between grain yield and biomass in maize. This study provides useful information to estimate crop production potential under soil water limitations and the optimization of maize farming and management under the background of climate change.

Supplementary Materials

The following supporting information can be downloaded at https://www.mdpi.com/article/10.3390/agronomy13102637/s1: Figure S1: Time series of available soil water content (ASWC, %) during two maize growing seasons of 2013 and 2014.

Author Contributions

Conceptualization, H.Z., G.Z. and Q.H.; methodology, H.Z. and G.Z.; formal analysis, H.Z., G.Z. and Q.H.; investigation, H.Z., X.S. and J.G.; writing—original draft, H.Z. and G.Z.; writing—review and editing, H.Z., G.Z. and Q.H. All authors have read and agreed to the published version of the manuscript.

Funding

This study was jointly supported by the National Natural Science Foundation of China (42130514, 42205126), the Fengyun Application Pioneering Project (FY-APP-2021.0401), and the Basic Research Fund of the Chinese Academy of Meteorological Sciences (2020Z004, 2022Y015, 2023Y005).

Data Availability Statement

Presented data in this study are available on request from the corresponding author.

Acknowledgments

We thank Xueyan Ma, Qiuling Wang, Minzheng Wang, Xiaoyu Feng, and Fan Wang from the Chinese Academy of Meteorological Sciences for their work assistance both in the field and in laboratory analysis. We also thank Feng Zhang and Zhenzhu Xu at the Institute of Botany, CAS for the technical assistance in field measurements. Sincere thanks also go to the editors and anonymous reviewers for their thoughtful comments that improved this manuscript.

Conflicts of Interest

The authors declare that the research was conducted in the absence of any commercial or financial relationships that could be construed as potential conflicts of interest.

References

  1. IPCC. Climate Change 2021: The Physical Science Basis. Contribution of Working Group I to the Sixth Assessment Report of the Intergovernmental Panel on Climate Change; Cambridge University Press: Cambridge, UK; New York, NY, USA, 2021. [Google Scholar]
  2. Saini, A.; Sahu, N.; Nayak, S. Determination of Grid-Wise Monsoon Onset and Its Spatial Analysis for India (1901–2019). Atmosphere 2023, 14, 1424. [Google Scholar] [CrossRef]
  3. Asseng, S.; Ewert, F.; Martre, P.; Rötter, R.P.; Lobell, D.B.; Cammarano, D.; Kimball, B.A.; Ottman, M.J.; Wall, G.W.; White, J.W.; et al. Rising temperatures reduce global wheat production. Nat. Clim. Chang. 2014, 5, 143–147. [Google Scholar] [CrossRef]
  4. Hsiao, J.; Swann, A.L.S.; Kim, S.-H. Maize yield under a changing climate: The hidden role of vapor pressure deficit. Agric. For. Meteorol. 2019, 279, 107692. [Google Scholar] [CrossRef]
  5. Lobell, D.B.; Gourdji, S.M. The influence of climate change on global crop productivity. Plant Physiol. 2012, 160, 1686–1697. [Google Scholar] [CrossRef] [PubMed]
  6. van Ittersum, M.K.; Rabbinge, R. Concepts in production ecology for analysis and quantification of agricultural input-output combinations. Field Crops Res. 1997, 52, 197–208. [Google Scholar] [CrossRef]
  7. Evans, L.T. Crop Evolution, Adaptation and Yield; Cambridge University Press: Cambridge, UK, 1993. [Google Scholar]
  8. Yang, X.; Cheng, C.; Li, Y. Effect of cropland occupation and supplement on light-temperature potential productivity in China from 2000 to 2008. Chin. Geogr. Sci. 2010, 20, 536–544. [Google Scholar] [CrossRef]
  9. He, D.; Wang, J.; Dai, T.; Feng, L.; Zhang, J.; Pan, X.; Pan, Z. Impact of climate change on maize potential productivity and the potential productivity gap in southwest China. J. Meteorolog. Res. 2015, 28, 1155–1167. [Google Scholar] [CrossRef]
  10. Rosenzweig, C.; Elliott, J.; Deryng, D.; Ruane, A.C.; Müller, C.; Arneth, A.; Boote, K.J.; Folberth, C.; Glotter, M.; Khabarov, N.; et al. Assessing agricultural risks of climate change in the 21st century in a global gridded crop model intercomparison. Proc. Natl. Acad. Sci. USA 2014, 111, 3268–3273. [Google Scholar] [CrossRef]
  11. van Wart, J.; Kersebaum, K.C.; Peng, S.; Milner, M.; Cassman, K.G. Estimating crop yield potential at regional to national scales. Field Crop. Res. 2013, 143, 34–43. [Google Scholar] [CrossRef]
  12. Wang, X.; Li, T.; Yang, X.; Zhang, T.; Liu, Z.; Guo, E.; Liu, Z.; Qu, H.; Chen, X.; Wang, L.; et al. Rice yield potential, gaps and constraints during the past three decades in a climate-changing Northeast China. Agric. For. Meteorol. 2018, 259, 173–183. [Google Scholar] [CrossRef]
  13. Saini, A.; Sahu, N.; Mishra, S.K.; Jain, S.; Behera, S.; Dash, S.K. The Spatio-Temporal Onset Characteristics of Indian Summer Monsoon Rainfall and Their Relationship with Climate Indices. Atmosphere 2022, 13, 1581. [Google Scholar] [CrossRef]
  14. de Wit, A.; Boogaard, H.; Fumagalli, D.; Janssen, S.; Knapen, R.; van Kraalingen, D.; Supit, I.; van der Wijngaart, R.; van Diepen, K. 25 years of the WOFOST cropping systems model. Agric. Syst. 2019, 168, 154–167. [Google Scholar] [CrossRef]
  15. van Diepen, C.A.; Wolf, J.; van Keulen, H.; Rappoldt, C. WOFOST: A simulation model of crop production. Soil Use Manag. 1989, 5, 16–24. [Google Scholar] [CrossRef]
  16. Jones, J.W.; Hoogenboom, G.; Porter, C.H.; Boote, K.J.; Batchelor, W.D.; Hunt, L.A.; Wilkens, P.W.; Singh, U.; Gijsman, A.J.; Ritchie, J.T. The DSSAT cropping system model. Eur. J. Agron. 2003, 18, 235–265. [Google Scholar] [CrossRef]
  17. Keating, B.A.; Carberry, P.S.; Hammer, G.L.; Probert, M.E.; Robertson, M.J.; Holzworth, D.; Huth, N.I.; Hargreaves, J.N.G.; Meinke, H.; Hochman, Z.; et al. An overview of APSIM, a model designed for farming systems simulation. Eur. J. Agron. 2003, 18, 267–288. [Google Scholar] [CrossRef]
  18. Holzworth, D.P.; Huth, N.I.; deVoil, P.G.; Zurcher, E.J.; Herrmann, N.I.; McLean, G.; Chenu, K.; van Oosterom, E.J.; Snow, V.; Murphy, C.; et al. APSIM—Evolution towards a new generation of agricultural systems simulation. Environ. Modell. Softw. 2014, 62, 327–350. [Google Scholar] [CrossRef]
  19. Brisson, N.; Gary, C.; Justes, E.; Roche, R.; Mary, B.; Ripoche, D.; Zimmer, D.; Sierra, J.; Bertuzzi, P.; Burger, P.; et al. An overview of the crop model stics. Eur. J. Agron. 2003, 18, 309–332. [Google Scholar] [CrossRef]
  20. Steduto, P.; Hsiao, T.C.; Raes, D.; Fereres, E. AquaCrop—The FAO crop model to simulate yield response to water: I. Concepts and underlying principles. Agron. J. 2009, 101, 426–437. [Google Scholar] [CrossRef]
  21. Li, T.; Angeles, O.; Marcaida, M.; Manalo, E.; Manalili, M.P.; Radanielson, A.; Mohanty, S. From ORYZA2000 to ORYZA (v3): An improved simulation model for rice in drought and nitrogen-deficient environments. Agric. For. Meteorol. 2017, 237–238, 246–256. [Google Scholar] [CrossRef]
  22. Lieth, H. Primary production: Terrestrial ecosystems. Hum. Ecol. 1973, 1, 303–332. [Google Scholar] [CrossRef]
  23. Lieth, H. Modeling the primary productivity of the world. In Primary Productivity of the Biosphere; Lieth, H., Whittaker, R.H., Eds.; Springer: Berlin/Heidelberg, Germany, 1975; pp. 237–263. [Google Scholar] [CrossRef]
  24. Fischer, G.; Sun, L. Model based analysis of future land-use development in China. Agric. Ecosyst. Environ. 2001, 85, 163–176. [Google Scholar] [CrossRef]
  25. Zhao, J.; Yang, X.; Sun, S. Constraints on maize yield and yield stability in the main cropping regions in China. Eur. J. Agron. 2018, 99, 106–115. [Google Scholar] [CrossRef]
  26. Liang, S.; Li, Y.; Zhang, X.; Sun, Z.; Sun, N.; Duan, Y.; Xu, M.; Wu, L. Response of crop yield and nitrogen use efficiency for wheat-maize cropping system to future climate change in northern China. Agric. For. Meteorol. 2018, 262, 310–321. [Google Scholar] [CrossRef]
  27. Gao, Z.; Feng, H.-Y.; Liang, X.-G.; Zhang, L.; Lin, S.; Zhao, X.; Shen, S.; Zhou, L.-L.; Zhou, S.-L. Limits to maize productivity in the North China Plain: A comparison analysis for spring and summer maize. Field Crop. Res. 2018, 228, 39–47. [Google Scholar] [CrossRef]
  28. Zhang, S.; Zhang, X.; Qiu, X.; Tang, L.; Zhu, Y.; Cao, W.; Liu, L. Quantifying the spatial variation in the potential productivity and yield gap of winter wheat in China. J. Integr. Agric. 2017, 16, 845–857. [Google Scholar] [CrossRef]
  29. Liu, B.; Chen, X.; Meng, Q.; Yang, H.; van Wart, J. Estimating maize yield potential and yield gap with agro-climatic zones in China—Distinguish irrigated and rainfed conditions. Agric. For. Meteorol. 2017, 239, 108–117. [Google Scholar] [CrossRef]
  30. Yang, X.; Chen, F.; Lin, X.; Liu, Z.; Zhang, H.; Zhao, J.; Li, K.; Ye, Q.; Li, Y.; Lv, S.; et al. Potential benefits of climate change for crop productivity in China. Agric. For. Meteorol. 2015, 208, 76–84. [Google Scholar] [CrossRef]
  31. Wang, J.; Wang, E.; Yin, H.; Feng, L.; Zhang, J. Declining yield potential and shrinking yield gaps of maize in the North China Plain. Agric. For. Meteorol. 2014, 195–196, 89–101. [Google Scholar] [CrossRef]
  32. Hay, R.K.M. Harvest index: A review of its use in plant breeding and crop physiology. Ann. Appl. Biol. 1995, 126, 197–216. [Google Scholar] [CrossRef]
  33. Bassu, S.; Fumagalli, D.; Toreti, A.; Ceglar, A.; Giunta, F.; Motzo, R.; Zajac, Z.; Niemeyer, S. Modelling potential maize yield with climate and crop conditions around flowering. Field Crop. Res. 2021, 271, 108226. [Google Scholar] [CrossRef]
  34. Unkovich, M.; Baldock, J.; Forbes, M. Variability in harvest index of grain crops and potential significance for carbon accounting: Examples from australian agriculture. Adv. Agron. 2010, 105, 173–219. [Google Scholar]
  35. Prihar, S.S.; Stewart, B.A. Using upper-bound slope through origin to estimate genetic harvest index. Agron. J. 1990, 82, 1160–1165. [Google Scholar] [CrossRef]
  36. Hütsch, B.W.; Schubert, S. Harvest Index of Maize (Zea mays L.): Are There Possibilities for Improvement? Adv. Agron. 2017, 146, 37–82. [Google Scholar]
  37. Qiao, S.; Wang, H.; Prentice, I.C.; Harrison, S.P. Extending a first-principles primary production model to predict wheat yields. Agric. For. Meteorol. 2020, 287, 107932. [Google Scholar] [CrossRef]
  38. Fischer, R.A. Definitions and determination of crop yield, yield gaps, and of rates of change. Field Crop. Res. 2015, 182, 9–18. [Google Scholar] [CrossRef]
  39. van Ittersum, M.K.; Cassman, K.G.; Grassini, P.; Wolf, J.; Tittonell, P.; Hochman, Z. Yield gap analysis with local to global relevance—A review. Field Crop. Res. 2013, 143, 4–17. [Google Scholar] [CrossRef]
  40. Meng, Q.; Hou, P.; Wu, L.; Chen, X.; Cui, Z.; Zhang, F. Understanding production potentials and yield gaps in intensive maize production in China. Field Crop. Res. 2013, 143, 91–97. [Google Scholar] [CrossRef]
  41. Liu, X.; Yu, Y.; Huang, S.; Xu, C.; Wang, X.; Gao, J.; Meng, Q.; Wang, P. The impact of drought and heat stress at flowering on maize kernel filling: Insights from the field and laboratory. Agric. For. Meteorol. 2022, 312, 108733. [Google Scholar] [CrossRef]
  42. Gabaldón-Leal, C.; Webber, H.; Otegui, M.E.; Slafer, G.A.; Ordóñez, R.A.; Gaiser, T.; Lorite, I.J.; Ruiz-Ramos, M.; Ewert, F. Modelling the impact of heat stress on maize yield formation. Field Crop. Res. 2016, 198, 226–237. [Google Scholar] [CrossRef]
  43. Tian, B.; Zhu, J.; Nie, Y.; Xu, C.; Meng, Q.; Wang, P. Mitigating heat and chilling stress by adjusting the sowing date of maize in the North China Plain. J. Agron. Crop Sci. 2019, 205, 77–87. [Google Scholar] [CrossRef]
  44. Ling, M.; Han, H.; Wei, X.; Lv, C. Temporal and spatial distributions of precipitation on the Huang-Huai-Hai Plain during 1960–2019, China. J. Water Clim. Chang. 2021, 12, 2232–2244. [Google Scholar] [CrossRef]
  45. Xue, W.; Guo, J.; Zhang, Y.; Zhou, S.; Wang, Y.; Miao, Y.; Liu, L.; Xu, H.; Li, J.; Chen, D.; et al. Declining diurnal temperature range in the North China Plain related to environmental changes. Clim. Dyn. 2019, 52, 6109–6119. [Google Scholar] [CrossRef]
  46. Meng, Q.; Liu, B.; Yang, H.; Chen, X. Solar dimming decreased maize yield potential on the North China Plain. Food Energy Secur. 2020, 9, e235. [Google Scholar] [CrossRef]
  47. Yuan, W.; Zheng, Y.; Piao, S.; Ciais, P.; Lombardozzi, D.; Wang, Y.; Ryu, Y.; Chen, G.; Dong, W.; Hu, Z.; et al. Increased atmospheric vapor pressure deficit reduces global vegetation growth. Sci. Adv. 2019, 5, eaax1396. [Google Scholar] [CrossRef] [PubMed]
  48. Shrestha, R.K.; Lei, P.; Shi, D.; Hashimi, M.H.; Wang, S.; Xie, D.; Ni, J.; Ni, C. Response of maize (Zea mays L.) towards vapor pressure deficit. Environ. Exp. Bot. 2021, 181, 104293. [Google Scholar] [CrossRef]
  49. Fu, Z.; Ciais, P.; Prentice, I.C.; Gentine, P.; Makowski, D.; Bastos, A.; Luo, X.; Green, J.K.; Stoy, P.C.; Yang, H.; et al. Atmospheric dryness reduces photosynthesis along a large range of soil water deficits. Nat. Commun. 2022, 13, 989. [Google Scholar] [CrossRef]
  50. Li, Q.; Wei, M.; Li, Y.; Feng, G.; Wang, Y.; Li, S.; Zhang, D. Effects of soil moisture on water transport, photosynthetic carbon gain and water use efficiency in tomato are influenced by evaporative demand. Agric. Water Manag. 2019, 226, 105818. [Google Scholar] [CrossRef]
  51. Craufurd, P.Q.; Wheeler, T.R. Climate change and the flowering time of annual crops. J. Exp. Bot. 2009, 60, 2529–2539. [Google Scholar] [CrossRef]
  52. Tao, F.; Zhang, Z. Adaptation of maize production to climate change in North China Plain: Quantify the relative contributions of adaptation options. Eur. J. Agron. 2010, 33, 103–116. [Google Scholar] [CrossRef]
  53. Ma, X.; He, Q.; Zhou, G. Sequence of Changes in Maize Responding to Soil Water Deficit and Related Critical Thresholds. Front. Plant Sci. 2018, 9, 511. [Google Scholar] [CrossRef]
  54. Zhou, H.; Zhou, G.; Song, X.; He, Q. Dynamic characteristics of canopy and vegetation water content during an entire maize growing season in relation to spectral-based indices. Remote Sens. 2022, 14, 584. [Google Scholar] [CrossRef]
  55. Zhou, H.; Zhou, G.; He, Q.; Zhou, L.; Ji, Y.; Zhou, M. Environmental explanation of maize specific leaf area under varying water stress regimes. Environ. Exp. Bot. 2020, 171, 103932. [Google Scholar] [CrossRef]
  56. Campbell, G.S.; Norman, J.M. Water Vapor and Other Gases. In An Introduction to Environmental Biophysics; Campbell, G.S., Norman, J.M., Eds.; Springer: New York, NY, USA, 1998; pp. 37–51. [Google Scholar] [CrossRef]
  57. Wang, S.; Huang, Y.; Sun, W.; Yu, L. Mapping the vertical distribution of maize roots in China in relation to climate and soil texture. J. Plant Ecol. 2018, 11, 899–908. [Google Scholar] [CrossRef]
  58. Anyia, A.O.; Herzog, H. Water-use efficiency, leaf area and leaf gas exchange of cowpeas under mid-season drought. Eur. J. Agron. 2004, 20, 327–339. [Google Scholar] [CrossRef]
  59. Yuan, B.; Guo, J.; Ye, M.; Zhao, J. Variety distribution pattern and climatic potential productivity of spring maize in Northeast China under climate change. Chin. Sci. Bull. 2012, 57, 3497–3508. [Google Scholar] [CrossRef]
  60. Loomis, R.S.; Williams, W.A. Maximum crop productivity: An estimate. Crop Sci. 1963, 3, 67–72. [Google Scholar] [CrossRef]
  61. Jiang, X.; Tang, L.; Liu, X.; Cao, W.; Zhu, Y. Spatial and temporal characteristics of rice potential productivity and potential yield increment in main production regions of China. J. Integr. Agric. 2013, 12, 45–56. [Google Scholar] [CrossRef]
  62. Zhao, J.; Guo, J.; Xu, Y.; Mu, J. Effects of climate change on cultivation patterns of spring maize and its climatic suitability in Northeast China. Agric. Ecosyst. Environ. 2015, 202, 178–187. [Google Scholar] [CrossRef]
  63. Qing, L.; Jianping, G.; Yali, M.; Xiangnan, M.; Limin, Z.; Mengwei, L. Evaluation of climate resource utilization rate of main grain crops in Shanxi Province. Chin. J. Ecol. 2021, 40, 1386–1396. [Google Scholar] [CrossRef]
  64. Cosentino, S.L.; Patanè, C.; Sanzone, E.; Testa, G.; Scordia, D. Leaf gas exchange, water status and radiation use efficiency of giant reed (Arundo donax L.) in a changing soil nitrogen fertilization and soil water availability in a semi-arid Mediterranean area. Eur. J. Agron. 2016, 72, 56–69. [Google Scholar] [CrossRef]
  65. Wang, H.; Liu, H.; Cao, G.; Ma, Z.; Li, Y.; Zhang, F.; Zhao, X.; Zhao, X.; Jiang, L.; Sanders, N.J.; et al. Alpine grassland plants grow earlier and faster but biomass remains unchanged over 35 years of climate change. Ecol. Lett. 2020, 23, 701–710. [Google Scholar] [CrossRef] [PubMed]
  66. Paine, C.E.T.; Marthews, T.R.; Vogt, D.R.; Purves, D.; Rees, M.; Hector, A.; Turnbull, L.A. How to fit nonlinear plant growth models and calculate growth rates: An update for ecologists. Methods Ecol. Evol. 2012, 3, 245–256. [Google Scholar] [CrossRef]
  67. Huang, L.; Koubek, T.; Weiser, M.; Herben, T.; Cornelissen, H. Environmental drivers and phylogenetic constraints of growth phenologies across a large set of herbaceous species. J. Ecol. 2018, 106, 1621–1633. [Google Scholar] [CrossRef]
  68. Lizaso, J.I.; Ruiz-Ramos, M.; Rodríguez, L.; Gabaldon-Leal, C.; Oliveira, J.A.; Lorite, I.J.; Sánchez, D.; García, E.; Rodríguez, A. Impact of high temperatures in maize: Phenology and yield components. Field Crop. Res. 2018, 216, 129–140. [Google Scholar] [CrossRef]
  69. Wild, M.; Gilgen, H.; Roesch, A.; Ohmura, A.; Long, C.N.; Dutton, E.G.; Forgan, B.; Kallis, A.; Russak, V.; Tsvetkov, A. From dimming to brightening: Decadal changes in solar radiation at Earth’s surface. Science 2005, 308, 847–850. [Google Scholar] [CrossRef]
  70. Gupta, R.; Somanathan, E.; Dey, S. Global warming and local air pollution have reduced wheat yields in India. Clim. Chang. 2017, 140, 593–604. [Google Scholar] [CrossRef]
  71. Zhang, Z.; Sun, S.; Zhang, F.; Guo, S.; Guo, E.; Liu, Z.; Zhao, J.; Zhao, C.; Li, T.; Yang, X. Using estimated radiation in crop models amplified the negative impacts of climate variability on maize and winter wheat yields in China. Agric. For. Meteorol. 2022, 318, 108914. [Google Scholar] [CrossRef]
  72. Tollenaar, M.; Fridgen, J.; Tyagi, P.; Stackhouse, P.W., Jr.; Kumudini, S. The Contribution of Solar Brightening to the US Maize Yield Trend. Nat. Clim. Chang. 2017, 7, 275–278. [Google Scholar] [CrossRef]
  73. Zhao, C.; Liu, B.; Piao, S.; Wang, X.; Lobell, D.B.; Huang, Y.; Huang, M.; Yao, Y.; Bassu, S.; Ciais, P.; et al. Temperature increase reduces global yields of major crops in four independent estimates. Proc. Natl. Acad. Sci. USA 2017, 114, 9326–9331. [Google Scholar] [CrossRef]
  74. Schauberger, B.; Archontoulis, S.; Arneth, A.; Balkovic, J.; Ciais, P.; Deryng, D.; Elliott, J.; Folberth, C.; Khabarov, N.; Müller, C.; et al. Consistent negative response of US crops to high temperatures in observations and crop models. Nat. Commun. 2017, 8, 13931. [Google Scholar] [CrossRef]
  75. L Hoffman, A.; R Kemanian, A.; E Forest, C. The response of maize, sorghum, and soybean yield to growing-phase climate revealed with machine learning. Environ. Res. Lett. 2020, 15, 094013. [Google Scholar] [CrossRef]
  76. Hatfield, J.L.; Prueger, J.H. Temperature extremes: Effect on plant growth and development. Weather Clim. Extrem. 2015, 10, 4–10. [Google Scholar] [CrossRef]
  77. Monteith, J.L. A reinterpretation of stomatal responses to humidity. Plant Cell Environ. 1995, 18, 357–364. [Google Scholar] [CrossRef]
  78. Verbraeken, L.; Wuyts, N.; Mertens, S.; Cannoot, B.; Maleux, K.; Demuynck, K.; De Block, J.; Merchie, J.; Dhondt, S.; Bonaventure, G.; et al. Drought affects the rate and duration of organ growth but not inter-organ growth coordination. Plant Physiol. 2021, 186, 1336–1353. [Google Scholar] [CrossRef] [PubMed]
  79. Lemoine, R.; La Camera, S.; Atanassova, R.; Dédaldéchamp, F.; Allario, T.; Pourtau, N.; Bonnemain, J.-L.; Laloi, M.; Coutos-Thévenot, P.; Maurousset, L.; et al. Source-to-sink transport of sugar and regulation by environmental factors. Front. Plant Sci. 2013, 4, 00272. [Google Scholar] [CrossRef] [PubMed]
  80. Rodrigues, J.; Inze, D.; Nelissen, H.; Saibo, N.J.M. Source-Sink Regulation in Crops under Water Deficit. Trends Plant Sci. 2019, 24, 652–663. [Google Scholar] [CrossRef]
  81. Fahad, S.; Bajwa, A.A.; Nazir, U.; Anjum, S.A.; Farooq, A.; Zohaib, A.; Sadia, S.; Nasim, W.; Adkins, S.; Saud, S.; et al. Crop Production under Drought and Heat Stress: Plant Responses and Management Options. Front. Plant Sci. 2017, 8, 01147. [Google Scholar] [CrossRef]
  82. Farooq, M.; Hussain, M.; Wahid, A.; Siddique, K.H.M. Drought Stress in Plants: An Overview. In Plant Responses to Drought Stress: From Morphological to Molecular Features; Aroca, R., Ed.; Springer: Berlin/Heidelberg, Germany, 2012; pp. 1–33. [Google Scholar] [CrossRef]
  83. Araus, J.L.; Serret, M.D.; Edmeades, G.O. Phenotyping maize for adaptation to drought. Front. Physiol. 2012, 3, 00305. [Google Scholar] [CrossRef]
  84. Zhang, X.; Chen, S.; Sun, H.; Shao, L.; Wang, Y. Changes in evapotranspiration over irrigated winter wheat and maize in North China Plain over three decades. Agric. Water Manag. 2011, 98, 1097–1104. [Google Scholar] [CrossRef]
  85. Borras, L.; Vitantonio-Mazzini, L.N. Maize reproductive development and kernel set under limited plant growth environments. J. Exp. Bot. 2018, 69, 3235–3243. [Google Scholar] [CrossRef]
  86. Rotundo, J.L.; Borrás, L.; De Bruin, J.; Pedersen, P. Physiological strategies for seed number determination in soybean: Biomass accumulation, partitioning and seed set efficiency. Field Crop. Res. 2012, 135, 58–66. [Google Scholar] [CrossRef]
  87. van Oosterom, E.J.; Hammer, G.L. Determination of grain number in sorghum. Field Crop. Res. 2008, 108, 259–268. [Google Scholar] [CrossRef]
  88. Miralles, D.J.; Katz, S.D.; Colloca, A.; Slafer, G.A. Floret development in near isogenic wheat lines differing in plant height. Field Crop. Res. 1998, 59, 21–30. [Google Scholar] [CrossRef]
Figure 1. Time series and range of air temperature (a,b), precipitation (c,d), radiation (e,f), and vapor pressure deficit ( V P D ; (g,h)) during the 2013–2014 growing seasons.
Agronomy 13 02637 g001
Figure 2. Variations of the downregulation scalars for the respective effects of temperature (a,b), vapor pressure deficit ( V P D ; (c,d)), and their interaction (e,f) on climatic production potential during the 2013–2014 growing seasons. f(T) and f(VPD) denote the downregulating scalars for the effects of temperature and VPD on crop climatic production potential, respectively; meanwhile, f(T) × f(VPD) means the interaction effects of temperature and VPD on crop climatic production potential.
Agronomy 13 02637 g002
Figure 3. Daily and accumulative climatic production potential of biomass ( B q t w ) during the 2013–2014 growing seasons. Daily B q t w in 2013 (a) and 2014 (b), accumulative B q t w in 2013 (c) and 2014 (d). T0, rainfed treatment in 2013; T1–T5, evolving soil water limitation treatments with different irrigation amounts applied at seven-leaf stage in 2013. W0, rainfed treatment in 2014; W1–W5, evolving soil water limitation treatments with different irrigation amounts applied at three-leaf stage in 2014. B q t w , climatic production potential of biomass.
Agronomy 13 02637 g003
Figure 4. Daily and cumulative climatic production potential of biomass after being corrected by V P D ( B q t w v ) during the 2013–2014 growing seasons. Daily B q t w v in 2013 (a) and 2014 (b); accumulative B q t w v in 2013 (c) and 2014 (d). T0, rainfed treatment in 2013; T1–T5, evolving soil water limitation treatments applied at seven-leaf stage in 2013. W0, rainfed treatment in 2014; W1–W5, evolving soil water limitation treatments applied at three-leaf stage in 2014. B q t w v , climatic production potential of biomass after being corrected by V P D .
Agronomy 13 02637 g004
Figure 5. Comparison of the climatic production potential of biomass ( B q t w ) and climatic production potential of biomass after being corrected by V P D ( B q t w v ) with observed biomass under rainfed (a,b) and drought treatments (c,d) during the 2013–2014 growing seasons.
Agronomy 13 02637 g005
Figure 6. Variations of observed biomass under rainfed and evolving soil water limitation treatments during the 2013 (a) and 2014 (b) growing seasons. The error bars denote the standard errors of three or five replications.
Agronomy 13 02637 g006
Figure 7. Response of normalized climatic biomass production potential after being corrected by V P D (normalized B q t w v ) to normalized observed biomass during the 2013–2014 growing seasons: (a) 2013; (b) 2014; (c) 2013 and 2014. The colored areas are the 95% confidence bands of the nonlinear fitting. The error bars denote the standard errors for three replications.
Agronomy 13 02637 g007
Figure 8. Grain yield under different treatments and its relationship to biomass during the 2013–2014 growing seasons. Grain yields among different treatments in 2013 (a) and 2014 (b), respectively; the relationship between grain yield and biomass production under rainfed and evolving soil water limitation treatments (c). The error bars denote the standard errors of three or five replications. The different lowercase letters indicate a significant difference between treatments (p < 0.05).
Agronomy 13 02637 g008
Table 1. Experimental design of evolving soil water limitations treatments during the 2013–2014 maize growing seasons.
TreatmentT0T1T2T3T4T5
2013Irrigation amount (mm)No, with 421 mm rainfall8060402515
Proportion of precipitation in July (%)280.753.34026.716.710
TreatmentW0W1W2W3W4W5
2014Irrigation amount (mm)No, with 292 mm rainfall150120906030
Proportion of precipitation in July (%)194.710080604020
Table 2. Values and meanings of photosynthetic production potential parameters for maize.
ParameterValueMeaningUnit
μ 49Fraction of photosynthetically active radiation%
φ 22.4Light quantum efficiency%
α 8Plant population reflectance%
β 6Plant population transmittance%
ρ 10Fraction of radiation intercepted by crop nonphotosynthetic organs%
γ 1Ratio of light beyond the light saturation point%
ω30Fraction of photosynthetic products consumed by respiration%
q 17.2Heat content per unit dry matterMJ kg−1
f L 0.58Revised factor for dynamic change in crop leaf area-
ξ 8Crop ash content%
Table 3. The minimum, optimum, and maximum temperatures for the photosynthetic activity of maize at different growth stages.
Growth Stages T m i n p (°C) T o p t (°C) T m a x p (°C)
Sowing–emergence142532
Emergence–jointing142735
Jointing–tasseling172735
Tasseling–maturity102632
Disclaimer/Publisher’s Note: The statements, opinions and data contained in all publications are solely those of the individual author(s) and contributor(s) and not of MDPI and/or the editor(s). MDPI and/or the editor(s) disclaim responsibility for any injury to people or property resulting from any ideas, methods, instructions or products referred to in the content.

