Article

Soil Microbial Community Composition and Diversity Are Insusceptible to Nitrogen Addition in a Semi-Arid Grassland in Northwestern China

1
College of Grassland Agriculture, Northwest A&F University, Xianyang 712100, China
2
School of Agriculture and Environment, Massey University, Palmerston North 4442, New Zealand
3
College of Chemistry and Chemical Engineering, Ningxia Normal University, Guyuan 756000, China
4
Institute of Soil and Water Conservation, CAS & MWR, Xianyang 712100, China
5
University of Chinese Academy of Sciences, Beijing 100049, China
6
Institute of Soil and Water Conversion, Northwest A&F University, Xianyang 712100, China
*
Author to whom correspondence should be addressed.
These authors contributed equally to this work.
Agronomy 2023, 13(10), 2593; https://doi.org/10.3390/agronomy13102593
Submission received: 19 September 2023 / Revised: 4 October 2023 / Accepted: 8 October 2023 / Published: 11 October 2023

Abstract

:
Human-caused nitrogen (N) deposition is a global environmental issue that can change community composition, functions, and ecosystem services. N deposition affects plants, soil, and microorganisms regionally and is linked to ecosystem, soil, and climate factors. We examined the effects of six N addition levels (0, 2.34 g, 4.67, 9.34,18.68, and 37.35 g N m−2 yr−1) on aboveground vegetation, surface soil properties, and microbial community. Alterations in microbial communities in response to N addition were monitored using 16S rRNA (16S ribosomal ribonucleic acid, where S donates a sedimentation coefficient) and ITS (internal transcribed spacer) regions for bacterial and fungal communities, respectively. N addition positively affected aboveground vegetation traits, such as biomass and community weighted mean of leaf nitrogen. N addition also limited phosphorus (P) availability and altered the microbial community assembly process from random processes to deterministic processes. The microbial community diversity and composition, however, were not sensitive to N addition. Partial least squares structural equation models showed that the composition of bacterial communities was mainly driven by the composition of plant communities and total nitrogen, while the composition of fungal communities was driven by soil pH and community weighted mean of leaf nitrogen. Taken together, the results of this research improved our understanding of the response of grassland ecosystems to N deposition and provided a theoretical basis for grassland utilization and management under N deposition.

1. Introduction

Human activities (e.g., fertilization and fossil fuel burning) have increased emissions of reactive nitrogen (N), with atmospheric N deposition having increased up to fivefold over the course of the 20th century [1]. China is one of the hot spots of N deposition, with N deposition fluxes of 1.32 g N m−2 yr−1, 2.11 g N m−2 yr−1, 3.78 g N m−2 yr−1, and 4.00 g N m−2 yr−1 in the 1980s, the 2000s, 2006–2014, and 2011–2018, respectively [2,3,4]. N deposition may affect fundamental community processes and ecosystem services [5,6]. N deposition can improve plant productivity [7] and carbon (C) sequestration in some ecosystems [8]. However, excess N inputs may have negative effects on ecosystems, through increasing soil acidification [9], decreasing plant diversity [10], and decreasing soil microbial biomass and diversity [11,12]. In addition, N deposition can also reduce microbial community stability and microbial activity [13] and change microbial community structure [14] and the utilization efficiency of microbial C and N [15]. A meta-analysis of 151 studies showed that N addition reduced total microbial biomass, fungal biomass, bacterial biomass, biomass carbon, and microbial respiration and changed microbial community composition in terrestrial ecosystems around the world [16]. It has also been noted that N addition increases the relative abundance of copiotrophic phyla (Ascomycota and Proteobacteria) and decreases that of oligotrophic phyla (Basidiomycota, Acidobacteria, and Firmicutes) [17,18,19].
Microorganisms play an important role in ecosystems by contributing to climate regulation [20], element cycling [21,22,23], basic soil processes [24], crop yields [25], and ecosystem sustainability [26]. However, the global soil microbial community is threatened by N deposition, with N deposition negatively affecting soil microbial community structure and ecosystem function. These changes in the microbial community are related to the differences in the community assembly process. At present, niche theory and neutral theory are considered the two theories explaining community composition mechanisms in community ecology [27]. Niche theory asserts that the formation of microbial communities is influenced by deterministic factors (e.g., environmental filters, including biological and abiotic factors). The neutral theory, however, holds that microbial community assembly is a random diffusion process and is not affected by niche differences [28]. Microbial community assembly mechanisms are influenced by several factors, such as land use [29], salinity [30], type of rhizosphere minerals, and soil depth [31]. However, the effect of N deposition on the soil microbial community assembly mechanism in semi-arid grassland is still unclear. Understanding the assembly mechanisms of the soil microbial community under N deposition is of great importance for the sustainability of grassland systems.
The drivers of microbial community changes are complex and difficult to disentangle because these changes can occur through changes in soil properties (e.g., soil pH, soil dissolved organic carbon, available nitrogen) [17,19], plant communities (e.g., biomass, structure) [32], interactions between microorganisms or between microorganisms and plants [33,34], and other factors (e.g., phage) [35]. N addition usually leads to a decrease in soil pH [9,19,36]. Nitrate leaching caused by excess N input is usually accompanied by some soil cations (K+, Ca2+, Mg2+), leading to an increase in soil acidification [11]. Soil eutrophication and acidification inhibit the growth and reproduction of fungi, especially arbuscular mycorrhizal fungi (AMF), leading to a significant reduction in their relative abundance [16,32]. Temperate grasslands are generally considered to be limited by N [7,11,37], and N addition can alleviate N limitation on plants and microorganisms, resulting in changes in community compositions. Changes in the plant community composition, plant community diversity, and plant biomass (aboveground and belowground) caused by N deposition strongly influenced microbial community compositions [13,19,38,39]. Therefore, understanding how long-term N deposition affects soil properties and microbial community is crucial for understanding the appropriate management and conservation of N deposition in the semi-arid grasslands of northwest China.
Changes in plant community and soil properties caused by N addition directly or indirectly affect the species diversity, community assembly process, community compositions, microbial biomass, and functional activities of the soil microbial community [40]. Here, we sought to determine whether experimental N deposition altered the diversity, composition, and assembly processes of the bacterial and fungal communities in the semi-arid steppe in China. Further, we explored the drivers changing microbial community composition to understand the links between N addition and microbial communities. We hypothesized that (i) N addition altered bacterial and fungal community diversity, composition, and assembly processes. (ii) We expected these alterations in bacterial and fungal community composition to be primarily caused by alterations in soil properties and vegetation characteristics under N addition. To address our objectives, 16S ribosomal ribonucleic acid (16S rRNA) sequencing technology was used to assess the dynamic changes of soil microbial communities on the Loess Plateau in China.

2. Materials and Methods

2.1. Study Sites

This research was carried out in the NingXia Yunwu Mountain grassland ecosystem national permanent scientific research base (106°21′–106°27′ E, 36°10′–36°19′ N), which is located in Guyuan City, Ningxia Hui Autonomous Region, China. The region is dominated by a middle temperate semi-arid climate, with an annual average temperature of 7.0 °C and with an annual average of 425 mm. The altitude of this area is 1800–2100 m, with the highest peak of 2148.4 m. According to the general soil classification system of China, the soil type of the region is montane grey-cinnamon soil, which is equivalent to Haplic Calcisol in the FAO/UNESCO system. There are more than 297 plant species in the area, but the main species are Stipa grandis, Thymus mongolicus, and Artemisia sacrorum [41].

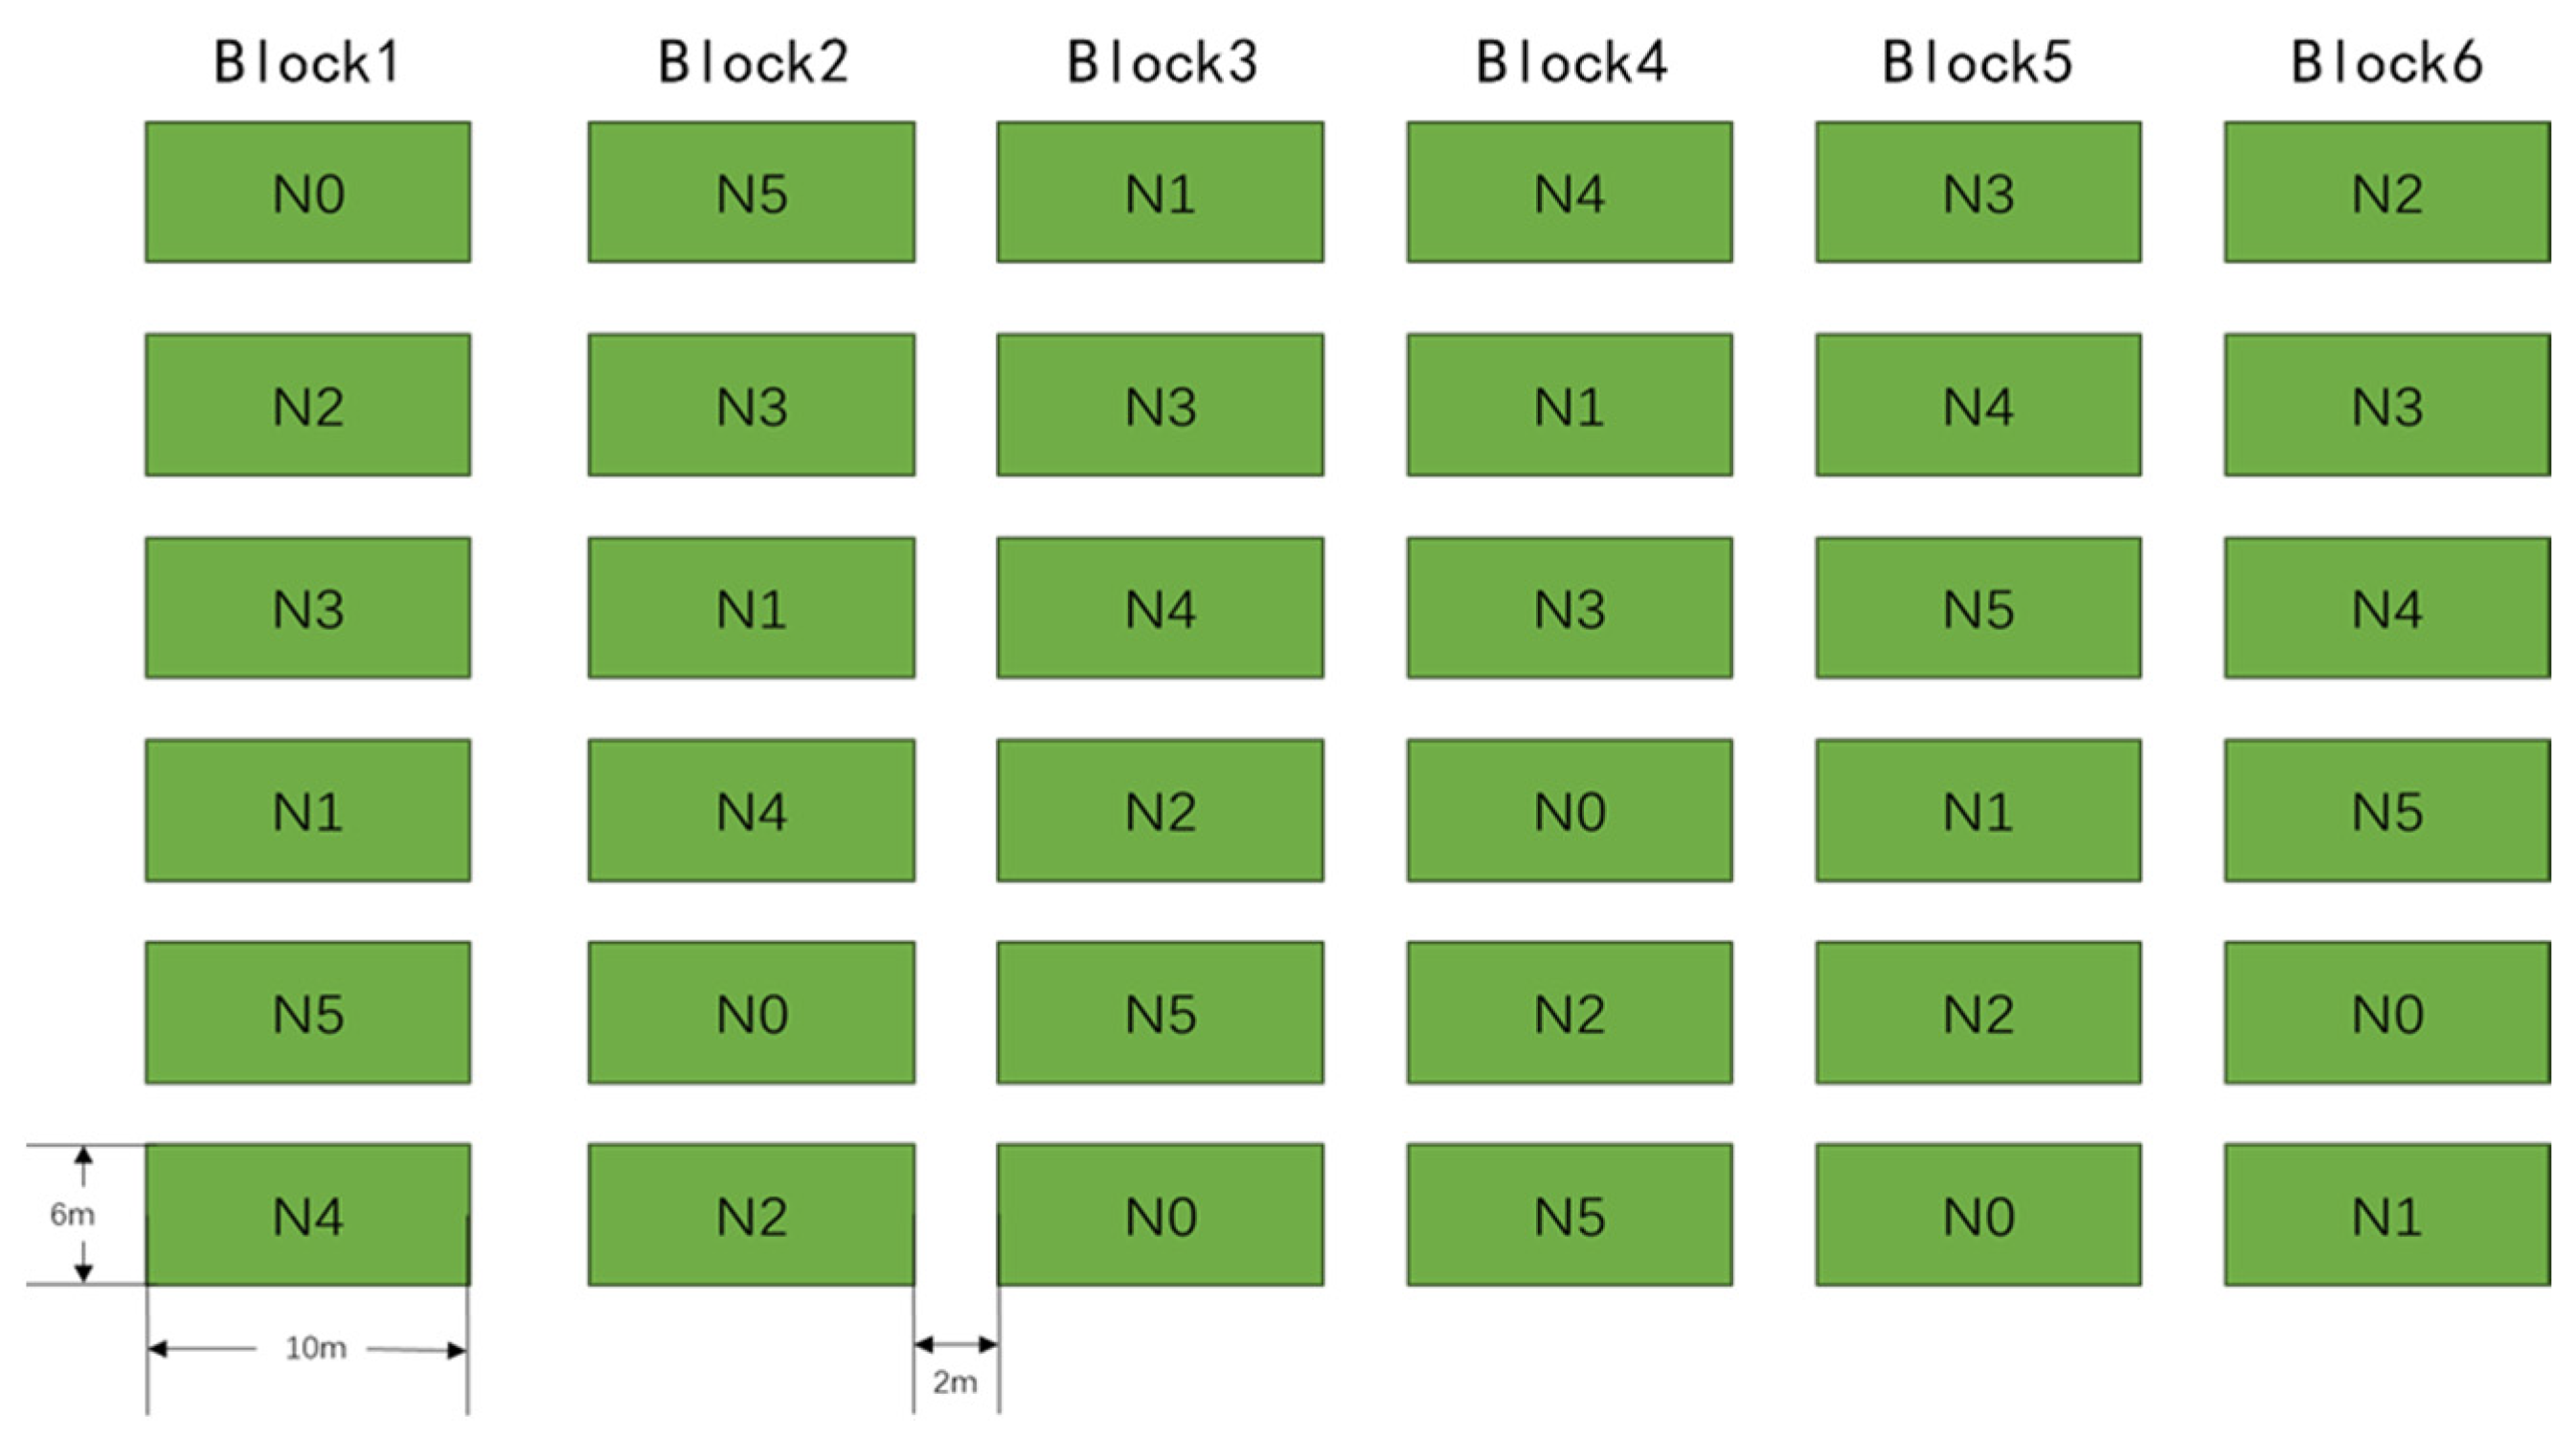
2.2. Experimental Design and Sampling

Thirty-six 6 × 10-m2 plots composed of six N addition levels with six replicates were distributed in six columns and six rows with a randomized block design (Figure 1). Each plot was separated from the others by a 2 m buffer strip. The fertilizer was applied at the beginning of the growing season (usually at the end of April) from 2013 to 2022, during a moderate rain event to avoid artificial watering. The fertilization treatments consisted of different amounts of (CO(NH2)2, N = 46%), namely, 0, 5, 10, 20, 40, and 80 g m−2 yr−1 are hereafter referred to as N0, N1, N2, N3, N4, and N5, which corresponds to 0, 2.34, 4.67, 9.34, 18.68, and 37.35 g N m−2 yr−1, respectively. The N addition gradient was determined using the local N deposition rate index and international and domestic fertilization on the same grassland type [3,4,5]. Each plot was separated into two subplots: a 4 m × 6 m subplot for vegetation monitoring, and a 6 m × 6 m subplot for individual plant sampling. One 1 m × 1 m quadrat was randomly selected from the 4 m × 6 m subplot in each plot. The quadrat was placed at least 0.5 m away from the edge to avoid the edge effect. The coverage, mean height, and abundance of each species were measured and recorded in each quadrat. Above-ground material for all species was cut off at ground level and placed in envelopes categorized by species. All biomass samples were dried to constant weight at 80 °C and weighed.
Three soil samples were collected from harvesting quadrat at a soil depth of 0–10 cm using a 5 cm diameter cylinder auger, and the samples of the same depth were then mixed together to make a pooled soil sample. Visible debris was removed from each soil sample and divided into two subsamples. One of the subsamples was air-dried and used for chemical analysis, while the other was immediately stored in an ice box and brought back to the laboratory, where it was stored in a −80 °C refrigerator prior to DNA analysis.

2.3. Leaf functional Trait Sample and Measurements

Differences in plant functional traits can reflect the survival strategies of plants to adapt to environmental changes. In our study, four plant leaf functional traits, LC (leaf carbon), LN (leaf nitrogen), LP (leaf phosphorus), and SLA (specific leaf area), were assessed. Leaf samples from 5 to 30 healthy medium individuals of dominant species were collected in each N treatment area. For this, 10 healthy (disease- and pest-free) and fully stretched leaves were collected from the upper canopy of each individual plant. The leaf samples collected from the same species were pooled to form a single leaf sample. We collected about 20 g of leaves to measure leaf traits of the dominant species, Artemisia sacrorum, Stipa bungeana, Stipa grandis, Thymus mongolicus, Heteropappus altaicus, Potentilla bifurca, Dendranthema lavandulifolium, and Carex duriuscula. The leaf samples were put into bags and transferred to the laboratory, where they were dried at 65 °C for 48 h. The dried leaf samples were subsequently used to determine the content of leaf carbon (LC), leaf nitrogen (LN), and leaf phosphorus (LP).

2.4. Determination Index and Method

Soil organic carbon (OC) content and LC and soil total nitrogen (TN) content and LN were determined by the dichromate oxidation method and the Kjeldahl method, respectively. Soil total phosphorus (TP) content and LP were determined using the ammonium molybdate colorimetric method. The soil alkali-hydrolyzable nitrogen (AN) content was determined by the alkali hydrolysis diffusion method, and the soil available phosphorus (AP) content was measured using the Olsen method. The pH of the soils was measured by an automatic titrator (Metrohm 702, Herisau, Swiss). To assess SLA, images of leaf samples were obtained using a scanner (Yaxin-1242, Beijing Yaxinlily Science and Technology Company, Beijing, China), and the images were analyzed using Image J to measure the leaf area [41]. Subsequently, the leaf samples were dried at 65 °C for 48 h and weighed using a balance with a precision of 10−4 g. SLA was calculated using the equation below:
SLA = l e a f   a r e a / d r y   l e a f   w e i g h t .
The community weighted mean trait values (CWM) were calculated using equation CWM = i = 1 S p i × t r a i t i , where t r a i t i was the trait value of species i. Plant community richness was expressed by the number of species.

2.5. DNA Extractions and High-Throughput Sequencing

Soil samples stored at −80 °C were sent on dry ice to Beijing Novogene Bioinformatics Technology Co., Ltd. (Beijing, China) for high-throughput DNA analysis (Illumina NovaSeq PE250, San Diego, CA, USA). Total genome DNA from samples was extracted using the CTAB (cetyl trimethyl ammonium bromide) method. DNA concentration and purity were assessed on 1% agarose gels. The bacterial 16S rRNA gene of the V4 region was amplified using the primer pairs 515F (CCTAYGGGRBGCASCAG) and 806R (GGACTACNNGGGTATCTAAT). The ITS1 region of fungi was amplified by primers ITS5-1737F (GGAAGTAAAAGTCGTAACAAGG) and ITS2-2043R (GCTGCGTTCTTCATCGATGC). Sequencing libraries were generated using TruSeq® DNA PCR-Free Sample Preparation Kit (Illumina, USA) following the manufacturer’s instructions. The library quality was assessed using the Qubit@ 2.0 Fluorometer (Thermo Scientific, Waltham, MA, USA) and Agilent Bioanalyzer 2100 system. The libraries were sequenced using Illumina NovaSeq PE250.

2.6. Data Analysis

FLASH (v1.2.7) and Qiime (v1.9.1) were used to splice and filter the original data to obtain the effective tags. OTUs (operational taxonomic units) clustering and species classification were analyzed based on the effective tags. Sequence analyses were performed by Uparse software (Uparse v7.0.1001), and sequences with ≥97% similarity were assigned to the same OTUs. The representative sequence for each OTU was screened for further annotation. For each representative sequence, the Silva Database based on the Mothur algorithm was used to annotate taxonomic information.
All data processing without special instructions was carried out in R software 4.1.1. Alpha diversity was applied to analyze the complexity of soil microbial diversity through three indices (Chao1, Shannon, and ACE). All of these indices were calculated using QIIME (Version 1.7.0). Plant community diversity components, including species diversity (Richness and Shannon) and functional diversity (CWM.LC, CWM.LN, CWM.LP, CWM.SLA, and FDis), were calculated using Microsoft Excel (version 2013). The functional diversity indices were calculated using the FD software package (vegan 2.6). SPSS (Version 24.0) was used for independent sample t-test, one-way ANOVA, and LSD test. Pearson’s coefficient was used to calculate the correlation between microbial diversity and biological and abiotic factors, and a correlation heatmap with signs was performed using the OmicStudio tools at https://www.omicstudio.cn (accessed on 11 July 2022) [42]. The null model was used to assess whether the assembly process of the microbial community was random or non-random. The EcoSimR package was used to calculate the checkerboard score (C-score) zero model method. The coefficient of niche width was calculated using the spaa package. Similarity percentage (SIMPER) was used to analyze the contribution species of microbial community differences (vegan package). Principal coordinates analysis (PCoA) and permutational multivariate analysis of variance (PERMANOVA) were used to assess whether microbial community composition had changed. We used the Kruskal–Wallis rank-sum test in the linear discriminant analysis effect size (LEfSe) method to identify microbial taxa with significantly different N addition gradients. The linear discriminant analysis (LDA) (LDA > 4) was performed to estimate the effect size of each N gradient. LEfSe was performed using the OmicStudio tools at https://www.omicstudio.cn/tool/ (accessed on 20 July 2022) [43]. The images were processed in R software and Origin (version 2021). We evaluated the relationship between selected biological and abiotic predictors and microbial community compositions using partial least squares structural equation models (PLS-SEM). We used the first axis of PCoA as the microbial composition in the PLS-SEM model. The goodness of fit of the SEM models was determined using several criteria, including coefficient of determination (R2, R2weak = 0.19, R2moderate = 0.33, R2substantial = 0.67), effect sizes (f2, f2low = 0.020, f2medium = 0.150, f2large = 0.350) [44], and predictive relevance (Q2, Q2 > 0, the higher the Q2 value, the stronger the prediction correlation) [45]. PLS-SEM analyses were conducted with SmartPLS (version 3).

3. Results

3.1. The Vegetation Characteristics and Soil Properties across N Addition Gradients

The results showed that N addition influenced all vegetative characteristics but FDis showed no apparent changes (Table 1). N addition had a positive effect on CWM.LN, foliar N/P, and community aboveground biomass, and this positive effect was positively correlated with the amount of N application. The increase of foliar N/P indicates that dominant species gradually shifted from N-limited to P-limited in the grassland communities. Low levels of N led to a reduction in the CWM.LP, CWM.SLA, and species diversity (S_plant and H_plant); however, the above-mentioned components reached a stable level at high levels of N (N3-N5). At low levels of N (No-N3), a reduction trend was recorded for the CWM.LC; however, higher levels of N promoted the CWM.LC. The results of PCoA and PERMANOVA showed that N addition did not cause significant changes in the plant community composition (Figure S2a, Table S1). Surprisingly, N addition had a small effect on most soil properties, with AP being the only property significantly affected by N addition (Table 2).

3.2. The Microbial Communities across N Addition Gradients

3.2.1. Diversity of Microbial Communities

After quality control of all soil samples, we obtained a total of 1,064,911 bacterial sequences, with an average of 59,162 sequences per sample and a total of 10,650 OTUs. A total of 1,079,258 fungal sequences (59,959 on average) were clustered into 6900 OTUs. Our results showed no significant change in bacterial α-diversity (ACE, Chao 1, and Shannon) across N addition gradients (Table 3). For fungal α-diversity, only the Shannon index at the N2 and N3 sites showed significant differences, while ACE and Chao 1 showed no significant differences across all N levels. Overall, these results indicate that there was no significant change in fungal α-diversity across all N levels. Spearman’s correlation coefficient showed that soil microbial α-diversity was weakly correlated with soil properties and vegetation characteristics (Figure S1). Changes in soil bacterial richness (ACE and Chao1 index) exhibited negative correlations with CWM.SLA (R2 = −0.58, p = 0.014; R2 = −0.60, p = 0.011) (Figure S1a). However, soil fungal diversity (ACE and Chao1 and Shannon indices) was weakly correlated with all factors (Figure S1b).

3.2.2. Composition of Microbial Communities

The dominant phyla of the bacterial community were Proteobacteria (34.3–40.5%), Acidobacteria (22.5–25.2%), Actinobacteria (9.6–15.5%), and Gemmatimonadetes (6.3–7.9%) (Figure 2a). The relative abundance of the bacterial community changed little across N addition gradients. The dominant phyla of the fungal community were Ascomycetes (21.7–42.8%), Mortierellomycota (9.6–22.0%), and Basidiomycetes (5.9–24.2%) (Figure 2b). N addition increased the relative abundance of Ascomycetes, while it decreased the relative abundance of Basidiomycetes compared with the control.
LEfSe was further used to study the taxa with the largest differences in microbial abundance at varying N addition gradients. For fungal communities, the significantly abundant taxa were Periconiaceae (at the family level) and Periconia (at the genus level) at the N4 site (Figure 3). Helotiales (at the order level) and Roesleria (at the genus level) were abundant at the N5 site. The biomarkers of the fungal community all belong to Ascomycetes. However, no biomarkers were observed in the bacterial community across all N levels (Figure S2).
PCoA was used to analyze changes in the microbial community composition across N addition gradients, and PERMANOVA analysis was used to detect significant differences in the microbial community composition. PCoA showed that all sites were clustered together without significant separations (Figure S3). PERMANOVA analysis showed that there was no significant change in bacterial (p = 0.879) and fungal (p = 0.060) community compositions across N gradients (Table S1). Therefore, N addition did not change the microbial community composition.

3.2.3. Assembly and Species Turnover of Microbial Communities

The niche width of microbial communities remained almost unchanged under N addition (Figure S4). However, N addition caused a change in the balance between random and deterministic processes in the microbial community (Figure 4). C-score results showed that the value of the standardized effect size (SES) changed significantly at high N levels. Bacterial (N5, p < 0.001) (Figure 4a, Table S2) and fungal (N3, p < 0.005; N4, p < 0.001; N5, p < 0.001) (Figure 4b, Table S2) communities were transformed from random to deterministic processes at high N levels.
Richness-based species exchange rate (SERr) was used to quantify species turnover in the microbial communities (Figure 5a). SERrs of bacterial and fungal communities were 0.40–0.41 and 0.56–0.63, respectively. SERrs of fungal communities were larger than those of bacterial communities, indicating that fungi were more susceptible to N addition than bacteria. To explore the effects of species turnover on microbial community formation, the contribution of extinct and immigrated OTUs to microbial richness and community structure changes was assessed. In the bacterial communities with N addition, the immigrated OTUs accounted for more than 23% of the OTU richness, with the lowest proportion (23.91%) and highest proportion (29.59%) recorded at the N1 and N3 sites, respectively (Figure 5b). The OTU extinction rate in the bacterial community ranges between 22.18% and 25.48%, with the lowest and highest proportions recorded at the N4 and N1 sites, respectively. In the fungal communities with N addition, the proportion of immigrated OTUs in OTU richness varied from 28.04% to 52.00%, with the lowest and highest proportions recorded at the N2 and N3 sites, respectively. The OTU extinction rates ranged between 30.17% to 52.93%, with the lowest and highest proportions recorded at the N3 and N2 sites, respectively. These results indicated that nitrogen addition could cause changes in the OTU richness of the microbial communities, and the proportions of immigrated and extinct OTUs in fungal communities were higher than those in bacterial communities, indicating that fungal community composition was more sensitive to nitrogen addition. However, the immigrated and extinct OTUs accounted for only a small proportion of the relative abundance in the microbial communities, and the proportions in bacterial and fungal communities were 1.25–1.85% and 2.13–5.56%, respectively. A high proportion of microbial richness and a low proportion of community compositions confirmed that species turnover had a higher contribution to microbial richness, but its contribution to microbial community structure was negligible. This result was further confirmed by a similar percentage analysis (SIMPER), which showed that the immigrated and extinct OTUs contributed no more than 8% of the variation in microbial communities between fertilization treatments and controls (Figure 5c).

3.2.4. Drivers of Microbial Communities

PLS-SEM explained 81.0% and 41.70% of the variance in the bacterial and fungal community compositions, respectively (Figure 6). For R2, R2 = 0.810 indicates substantial and R2 = 0.417 indicates moderate; f 2 (f2 > 0.35) values indicate that exogenous variables (plant community composition, TN, pH, CWM.SLA) have a large influence on endogenous variables (bacterial and fungal community composition) (Table S3); and Q2 with a Q2 range from 0.306–0.701 indicates variables in the model have a strong predictive correlation. PLS-SEM results showed that the plant community composition (p < 0.001) and TN (p < 0.001) were identified as important driving factors for the bacterial community compositions, and the fungal community composition was predominantly driven by pH (p < 0.01) and CWM.SLA (p < 0.001).

4. Discussion

We studied the relationship between changes in microbial communities and N deposition using a simulated N deposition experiment. These relationships help us understand the response of grassland ecosystems to N deposition, as well as grassland management, utilization, and conservation under N deposition in the future. We found that N addition only affected microbial assembly but did not affect microbial diversity and compositions. We found that both vegetation characteristics and soil properties affect microbial community compositions under N addition.

4.1. Changes in Vegetation Characteristics and Soil Properties under N Addition

Although plant community compositions did not change significantly under N addition, biomass, leaf functional traits, and species diversity did change, indicating that plant community functions may have changed, as found in other studies [1,46,47,48]. In general, N addition increases the rate of N mineralization, leading to a faster turnover of N in the soil and higher utilization of N by plants, thereby increasing plant biomass [5]. However, increased availability of N may lead to decreased availability of other elements, such as P [49]. Our results showed that N addition reduced CWM.LP and AP and increased foliar N/P ratios of dominant species, which is an indication of P limitation caused by N addition. Changes in the level of P in plants and soils can be explained by the following mechanisms. N addition significantly increased the LN of dominant species, causing a large amount of LP to be consumed to promote plant growth [50]. N addition can accelerate the P circulation rate, enhance soil phosphatase activity, and release phosphate from organic matter to alleviate P deficiency. However, the released P is rapidly absorbed by plants and microorganisms, and this replenishment is insufficient to balance the decline in AP (this may also be the reason for the slight decrease in OC in our results) [48,51,52]. In addition, we observed a decrease in CWM.SLA. The limitation of the photosynthetic capacity of leaves caused by P deficiency might be the reason for the decrease in CWM.SLA.
N addition did not cause strong changes in soil pH, TN, and AN, which could be explained by the following reasons. The study area belongs to calcareous soil, which can buffer reductions in pH caused by N addition [10]. Urea is hydrolyzed to produce NH4+-N, and NH4+ can be absorbed by plants. NH4+ can also be adsorbed by soil colloids or can be lost through nitrification, denitrification, N2O emission, NO3-N leaching, dissolved inorganic N leaching, and dissolved organic N leaching [11,53]. Overall, the dynamic balance between soil N input and output may be the reason why TN and AN do not change significantly. Nevertheless, further studies are needed in order to explain the mechanisms underlying alterations in soil N change and the transformation process of N under N addition in natural grassland ecosystems.

4.2. Changes in Microbial Community Diversity and Assembly under N Addition

N deposition has been recognized as one of the major threats to global biodiversity, inhibiting terrestrial biodiversity at all system levels [54]. Previous studies have shown that N addition reduces microbial diversity [55,56,57]. However, in this research, it was noted that N addition did not cause significant changes in microbial diversity. These inconsistent results suggest the effects of N addition on microbial diversity can vary across different local environments, ecosystem types, soil types, and vegetation compositions. Similar to our observation, results from a global experiment on N addition at 25 grassland sites showed that N addition had small impacts on microbial diversity [31], indicating that grassland has the ability to maintain microbial diversity under N deposition. Our results showed that almost all key vegetation characteristics and soil properties were weakly correlated with changes in microbial diversity. It was, however, noted that CWM.SLA was significantly negatively correlated with bacterial diversity. Previous studies have reported a significant correlation between soil properties (e.g., soil pH) and microbial diversity [58,59], but we did not observe such a result, suggesting that the response of microbial diversity to soil properties depends on environmental habitats, soil types, the range of pH, and the size of samples [60].
The assembly of microbial communities is driven by both deterministic and stochastic processes, but the relative importance of either process may vary with environmental heterogeneity [61]. We used the null model to assess the response of microbial community assembly to N addition. The microbial community was initially dominated by stochastic processes, and the relative importance of deterministic processes increased with elevating N levels [62]. This is consistent with our observation that microbial communities are controlled by random processes in the control group, whereas deterministic processes dominate under high N inputs. Our results are in agreement with several previously conducted studies [14,63]. The fungal community is more susceptible to N than the bacterial community because the assembly process of the fungal community changes at lower N levels.

4.3. Microbial Community Composition and Its Driving Factors under N Addition

In addition, microbial community composition did not change significantly under N deposition. The relative abundance of dominant bacterial community phyla, such as Proteobacteria, Acidobacteria, Actinobacteria, Gemmatimonadetes, Firmicutes, Chloroflexi, and Rokubacteria, did not change significantly under N addition, which is inconsistent with the copiotrophic hypothesis [18]. Fungi are more sensitive to N addition than bacteria [64]. Although the composition of the fungal community did not change, the relative abundance of the dominant phylum and some taxa of the fungal community changed significantly under N addition. Compared with the control group, N addition increased the relative abundance of Ascomycota while it decreased the relative abundance of Basidiomycetes. This is consistent with the copiotrophic hypothesis that the abundance of oligotrophic taxa decreases while the abundance of copiotrophic taxa increases due to nutrient inputs [65]. Some species of the two genera (Periconia, and Roesleria) whose relative abundance increased significantly under high N inputs were considered plant-pathogenic fungi [66,67]. This suggests that N addition may increase the risk of plant diseases. The high OTU migration and extinction rates and a low relative abundance of OTUs suggested that N addition may have caused changes in rare taxa rather than in rich taxa. In addition, migrating and extinct OTUs had a low contribution to variation in the community compositions. Therefore, we observed no significant change in the bacterial community composition.
Our results showed that the diversity and composition of bacterial and fungal communities were insensitive to N addition. The insensitive response of microbial communities to N addition has also been observed in other semi-arid grasslands [68,69]. Most of the previous studies on the changes in microbial community compositions caused by N addition indicated that N addition primarily affected microbial community composition by changing soil pH [12,19]. Some studies with no significant change in soil pH reported no change in microbial community compositions under N addition [32,70]. There was no significant change in soil pH in our study area, possibly due to the high buffering capacity of the soil to offset soil acidification or plant assimilation [71]. It is also possible that excess N inputs limit the availability of other resources (such as C, P, and water), and thus limit the ability of microorganisms to utilize additional N [72,73], causing N to be lost from the system.
According to PLS-SEM, plant community compositions, TN, soil pH, and CWM.SLA were important factors affecting bacterial and fungal community compositions, respectively. Plant community compositions influence microbial community compositions through litter input [74]. The characteristics of foliar litter have also been shown to correlate with microbial community composition since they play a role in the selection of microbial communities with specific catabolic pathways [75]. In addition, different soil microbes have preferences for specific host plants [76]. The microbial community was closely related to TN and soil pH, indicating that N addition affected the microbial community primarily through changing soil properties [77,78,79,80].

5. Conclusions

Collectively, our results showed changes in vegetation characteristics, soil properties, and microbial communities under different N-addition gradients. Plants were more susceptible to N deposition than soils and microorganisms. N addition increased plant biomass, CWM.LN, and foliar N/P ratio. However, N inputs led to P limitation, resulting in reduced CWM.LP, AP, and CWM.SLA. Soil OC, TN, AN, TP, pH, and SWC were not affected by N addition. N addition affected microbial community assembly but not microbial diversity and compositions. The composition of the microbial community is regulated by both vegetation characteristics and soil properties. PLS-SEM showed that the driving factors of bacterial community compositions were plant community compositions and TN, while the composition of the fungal community was predominantly controlled by pH and CWM.SLA. Further work is needed to elucidate the potential mechanisms underlying shifts in soil microbial communities under N addition in grassland ecosystems.

Supplementary Materials

The following supporting information can be downloaded at: https://www.mdpi.com/article/10.3390/agronomy13102593/s1, Figure S1: Spearman’s correlation coefficients between some factors (soil properties and vegetation characteristics) and soil bacterial and fungal diversity. The diversity indices include ACE, Chao1, and Shannon indices; AN, soil alkali-hydrolytic nitrogen, AP, soil available phosphorus, CWM.LC, community weighted mean of leaf carbon, CWM.LN, community weighted mean of leaf nitrogen, CWM.LP, community weighted mean of leaf phosphorus, CWM.SLA, community weighted mean of specific leaf area, FDis, Functional Divergence index, H_plant, Shannon index of plants, OC, soil organic carbon, S_plant, the species richness of plants, SMC, soil moisture content, TN, soil total nitrogen, TP, soil total phosphorus. Figure S2: The relative abundance of bacterial taxa across the N gradients. The most differentially abundant taxa of bacteria at varying N gradients based on linear discriminant analysis effect size method. The taxa with significantly different abundances among N gradients are represented by colored dots. From the center outward the kingdom, phylum, class, order, family, genus, and species levels are presented, respectively. The colored nodes in the diagram represent the significantly discriminant taxon with other N gradients. Yellow circles represent nonsignificant differences in abundance between N gradients. Only taxa meeting the linear discriminant analysis significance threshold of >4 are shown. Figure S3: PCoA of plant (a), bacterial (b), and fungal (c) communities (species or OTU level) based on Bray-Curtis distances. Figure S4: Comparison of average habitat niche width of dominant bacterial (a) and fungal (b) taxa (relative abundance > 0.01%) under different N addition gradients. The ns means no significant difference (p > 0.05). Table S1: Differences in microbial community composition were examined by Permutational multivariate analysis of variance (PERMANOVA) on N gradient. Table S2: The significance analysis of C-score in bacterial (B) and fungi (F) community. Table S3: The fitness details of PLS-SEM. TN, total nitrogen, CWM.SLA, community weighted mean of specific leaf area, Plant, Bacterial and Fungal represent the composition of plants, bacteria and fungi respectively.

Author Contributions

Conceptualization, W.L.; methodology, W.L.; software, H.T. (Hanghang Tuo) and M.L.; validation, H.T. (Hanghang Tuo), M.L., J.H. and M.Y.; formal analysis, Z.W.; investigation, H.T. (Huihui Tian) and Y.W.; resources, H.T. (Hanghang Tuo), M.L. and H.G.; data curation, F.Y.; writing—original draft preparation, H.T. (Hanghang Tuo), M.L. and H.G.; writing—review and editing, H.G.; visualization, H.T. (Hanghang Tuo), M.L. and Y.W.; supervision, H.T. (Hanghang Tuo), M.L. and H.T. (Huihui Tian); project administration, W.L.; funding acquisition, W.L. All authors have read and agreed to the published version of the manuscript.

Funding

This work was financially supported by the National Natural Sciences Foundation of China (42277464), the National Key Research and Development Program of China (2022YFF1302805), and the Natural Sciences Foundation of Ningxia (2023AAC03350).

Data Availability Statement

The data presented in this study are available upon request from the corresponding authors.

Conflicts of Interest

The authors declare that they have no known competing financial interests or personal relationships that could have influenced the work reported in this paper.

References

  1. Zhang, H.X.; Li, W.B.; Adams, H.D.; Wang, A.Z.; Wu, J.B.; Jin, C.J.; Guan, D.; Yuan, F.H. Responses of woody plant functional traits to nitrogen addition: A meta-analysis of leaf economics, gas exchange, and hydraulic traits. Front. Pant Sci. 2018, 9, 683. [Google Scholar] [CrossRef] [PubMed]
  2. Liu, X.J.; Zhang, Y.; Han, W.X.; Tang, A.; Shen, J.L.; Cui, Z.L.; Vitousek, P.; Erisman, J.W.; Goulding, K.; Christie, P.; et al. Enhanced nitrogen deposition over China. Nature 2013, 494, 459–462. [Google Scholar] [CrossRef] [PubMed]
  3. Wen, Z.; Xu, W.; Li, Q.; Han, M.J.; Tang, A.; Zhang, Y.; Luo, X.S.; Shen, J.L.; Wang, W.; Li, K.H.; et al. Changes of nitrogen deposition in China from 1980 to 2018. Environ. Int. 2020, 144, 106022. [Google Scholar] [CrossRef] [PubMed]
  4. Xu, W.; Luo, X.S.; Pan, Y.P.; Zhang, L.; Tang, A.H.; Shen, J.L.; Zhang, Y.; Li, K.H.; Wu, Q.H.; Yang, D.W.; et al. Quantifying atmospheric nitrogen deposition through a nationwide monitoring network across China. Atmos. Chem. Phys. Discuss. 2015, 15, 18365–18405. [Google Scholar] [CrossRef]
  5. Jones, L.; Provins, A.; Holland, M.; Mills, G.; Hayes, F.; Emmett, B.; Hall, J.; Sheppard, L.; Smith, R.; Sutton, M.; et al. A review and application of the evidence for nitrogen impacts on ecosystem services. Ecosyst. Serv. 2014, 7, 76–88. [Google Scholar] [CrossRef]
  6. Zhu, J.X.; Chen, Z.; Wang, Q.F.; Xu, L.; He, N.P.; Jia, Y.L.; Zhang, Q.Y.; Yu, G.R. Potential transition in the effects of atmospheric nitrogen deposition in China. Environ. Pollut. 2020, 258, 113739. [Google Scholar] [CrossRef]
  7. Avolio, M.L.; Koerner, S.E.; La Pierre, K.J.; Wilcox, K.R.; Wilson, G.W.T.; Smith, M.D.; Collins, S.L. Changes in plant community composition, not diversity, during a decade of nitrogen and phosphorus additions drive above-ground productivity in a tallgrass prairie. J. Ecol. 2014, 102, 1649–1660. [Google Scholar] [CrossRef]
  8. Lu, X.K.; Vitousek, P.M.; Mao, Q.G.; Gilliam, F.S.; Luo, Y.Q.; Turner, B.L.; Zhou, G.Y.; Mo, J.M. Nitrogen deposition accelerates soil carbon sequestration in tropical forests. Proc. Natl. Acad. Sci. USA 2021, 118, e2020790118. [Google Scholar] [CrossRef]
  9. Sun, R.B.; Chen, Y.; Han, W.X.; Dong, W.X.; Zhang, Y.M.; Hu, C.S.; Liu, B.B.; Wang, F.H. Different contribution of species sorting and exogenous species immigration from manure to soil fungal diversity and community assemblage under long-term fertilization. Soil Biol. Biochem. 2020, 151, 108049. [Google Scholar] [CrossRef]
  10. Yang, H.J.; Li, Y.; Wu, M.Y.; Zhang, Z.; Li, L.H.; Wan, S.Q. Plant community responses to nitrogen addition and increased precipitation: The importance of water availability and species traits. Glob. Chang. Biol. 2011, 17, 2936–2944. [Google Scholar] [CrossRef]
  11. Liu, X.J.; Duan, L.; Mo, J.M.; Du, E.Z.; Shen, J.L.; Lu, X.K.; Zhang, Y.; Zhou, X.B.; He, C.; Zhang, F.S. Nitrogen deposition and its ecological impact in China: An overview. Environ. Pollut. 2011, 159, 2251–2264. [Google Scholar] [CrossRef] [PubMed]
  12. Wang, C.; Lu, X.K.; Mori, T.; Mao, Q.G.; Zhou, K.J.; Zhou, G.Y.; Nie, Y.X.; Mo, J.M. Responses of soil microbial community to continuous experimental nitrogen additions for 13 years in a nitrogen-rich tropical forest. Soil Biol. Biochem. 2018, 121, 103–112. [Google Scholar] [CrossRef]
  13. Lv, F.L.; Xue, S.; Wang, G.L.; Zhang, C. Nitrogen addition shifts the microbial community in the rhizosphere of Pinus tabuliformis in northwestern China. PLoS ONE 2017, 12, e0172382. [Google Scholar] [CrossRef]
  14. Liu, C.; Yao, M.J.; Stegen, J.C.; Rui, J.P.; Li, J.B.; Li, X.Z. Long-term nitrogen addition affects the phylogenetic turnover of soil microbial community responding to moisture pulse. Sci. Rep. 2017, 7, 17492. [Google Scholar] [CrossRef] [PubMed]
  15. Li, J.; Sang, C.P.; Yang, J.Y.; Qu, L.R.; Xia, Z.W.; Sun, H.; Jiang, P.; Wang, X.G.; He, H.B.; Wang, C. Stoichiometric imbalance and microbial community regulate microbial elements use efficiencies under nitrogen addition. Soil Biol. Biochem. 2021, 156, 108207. [Google Scholar] [CrossRef]
  16. Zhang, T.A.; Chen, H.Y.H.; Ruan, H.H. Global negative effects of nitrogen deposition on soil microbes. ISME J. 2018, 12, 1817–1825. [Google Scholar] [CrossRef] [PubMed]
  17. Cui, J.Y.; Yuan, X.C.; Zhang, Q.F.; Zhou, J.C.; Lin, K.M.; Xu, J.G.; Zeng, Y.Z.; Wu, Y.; Cheng, L.; Zeng, Q.X.; et al. Nutrient availability is a dominant predictor of soil bacterial and fungal community composition after nitrogen addition in subtropical acidic forests. PLoS ONE 2021, 16, e0246263. [Google Scholar] [CrossRef]
  18. Fierer, N.; Lauber, C.L.; Ramirez, K.S.; Zaneveld, J.; Bradford, M.A.; Knight, R. Comparative metagenomic, phylogenetic and physiological analyses of soil microbial communities across nitrogen gradients. ISME J. 2012, 6, 1007–1017. [Google Scholar] [CrossRef]
  19. Widdig, M.; Heintz-Buschart, A.; Schleuss, P.M.; Guhr, A.; Borer, E.T.; Seabloom, E.W.; Spohn, M. Effects of nitrogen and phosphorus addition on microbial community composition and element cycling in a grassland soil. Soil Biol. Biochem. 2020, 151, 108041. [Google Scholar] [CrossRef]
  20. Birrer, S.C.; Dafforn, K.A.; Sun, M.Y.; Williams, R.B.H.; Potts, J.; Scanes, P.; Kelaher, B.P.; Simpson, S.L.; Kjelleberg, S.; Swarup, S.; et al. Using meta-omics of contaminated sediments to monitor changes in pathways relevant to climate regulation. Environ. Microbiol. 2019, 21, 389–401. [Google Scholar] [CrossRef]
  21. Nelson, M.B.; Martiny, A.C.; Martiny, J.B.H. Global biogeography of microbial nitrogen-cycling traits in soil. Proc. Natl. Acad. Sci. USA 2016, 113, 8033–8040. [Google Scholar] [CrossRef]
  22. Trivedi, P.; Delgado-Baquerizo, M.; Trivedi, C.; Hu, H.W.; Anderson, I.C.; Jeffries, T.C.; Zhou, J.Z.; Singh, B.K. Microbial regulation of the soil carbon cycle: Evidence from gene-enzyme relationships. ISME J. 2016, 10, 2593–2604. [Google Scholar] [CrossRef] [PubMed]
  23. Yevdokimov, I.; Larionova, A.; Blagodatskaya, E. Microbial immobilisation of phosphorus in soils exposed to drying-rewetting and freeze-thawing cycles. Biol. Fertil. Soils 2016, 52, 685–696. [Google Scholar] [CrossRef]
  24. Chen, Q.L.; Ding, J.; Li, C.Y.; Yan, Z.Z.; He, J.Z.; Hu, H.W. Microbial functional attributes, rather than taxonomic attributes, drive top soil respiration, nitrification and denitrification processes. Sci. Total Environ. 2020, 734, 139479. [Google Scholar] [CrossRef] [PubMed]
  25. Liang, Y.T.; Xiao, X.; Nuccio, E.E.; Yuan, M.T.; Zhang, N.; Xue, K.; Cohan, F.M.; Zhou, J.Z.; Sun, B. Differentiation strategies of soil rare and abundant microbial taxa in response to changing climatic regimes. Environ. Microbiol. 2020, 22, 1327–1340. [Google Scholar] [CrossRef] [PubMed]
  26. Toju, H.; Peay, K.G.; Yamamichi, M.; Narisawa, K.; Hiruma, K.; Naito, K.; Fukuda, S.; Ushio, M.; Nakaoka, S.; Onoda, Y.; et al. Core microbiomes for sustainable agroecosystems. Nat. Plants 2018, 4, 247–257. [Google Scholar] [CrossRef] [PubMed]
  27. Chen, W.D.; Ren, K.X.; Isabwe, A.; Chen, H.H.; Liu, M.; Yang, J. Stochastic processes shape microeukaryotic community assembly in a subtropical river across wet and dry seasons. Microbiome 2019, 7, 138, Erratum in Microbiome 2019, 7, 148. [Google Scholar] [CrossRef]
  28. Perronne, R.; Munoz, F.; Borgy, B.; Reboud, X.; Gaba, S. How to design trait-based analyses of community assembly mechanisms: Insights and guidelines from a literature review. Perspect. Plant Ecol. Evol. Syst. 2017, 25, 29–44. [Google Scholar] [CrossRef]
  29. Osburn, E.D.; Aylward, F.O.; Barrett, J.E. Historical land use has long-term effects on microbial community assembly processes in forest soils. ISME Commun. 2021, 1, 48. [Google Scholar] [CrossRef]
  30. Mo, Y.Y.; Peng, F.; Gao, X.F.; Xiao, P.; Logares, R.; Jeppesen, E.; Ren, K.X.; Xue, Y.Y.; Yang, J. Low shifts in salinity determined assembly processes and network stability of microeukaryotic plankton communities in a subtropical urban reservoir. Microbiome 2021, 9, 128. [Google Scholar] [CrossRef]
  31. Luan, L.; Liang, C.; Chen, L.J.; Wang, H.T.; Xu, Q.S.; Jiang, Y.J.; Sun, B. Coupling Bacterial Community Assembly to Microbial Metabolism across Soil Profiles. mSystems 2020, 5, e00298-20. [Google Scholar] [CrossRef]
  32. Leff, J.W.; Jones, S.E.; Prober, S.M.; Barberán, A.; Borer, E.T.; Firn, J.L.; Harpole, W.S.; Hobbie, S.E.; Hofmockel, K.S.; Knops, J.M.H.; et al. Consistent responses of soil microbial communities to elevated nutrient inputs in grasslands across the globe. Proc. Natl. Acad. Sci. USA 2015, 112, 10967–10972. [Google Scholar] [CrossRef]
  33. Bahram, M.; Hildebrand, F.; Forslund, S.K.; Anderson, J.L.; Soudzilovskaia, N.A.; Bodegom, P.M.; Bengtsson-Palme, J.; Anslan, S.; Coelho, L.P.; Harend, H.; et al. Structure and function of the global topsoil microbiome. Nature 2018, 560, 233–237. [Google Scholar] [CrossRef]
  34. Romdhane, S.; Spor, A.; Aubert, J.; Bru, D.; Breuil, M.-C.; Hallin, S.; Mounier, A.; Ouadah, S.; Tsiknia, M.; Philippot, L. Unraveling negative biotic interactions determining soil microbial community assembly and functioning. ISME J. 2022, 16, 296–306. [Google Scholar] [CrossRef] [PubMed]
  35. Chevallereau, A.; Pons, B.J.; van Houte, S.; Westra, E.R. Interactions between bacterial and phage communities in natural environments. Nat. Rev. Microbiol. 2022, 20, 49–62. [Google Scholar] [CrossRef] [PubMed]
  36. Wang, H.; Liu, S.R.; Zhang, X.; Mao, Q.G.; Li, X.Z.; You, Y.M.; Wang, J.X.; Zheng, M.H.; Zhang, W.; Lu, X.K.; et al. Nitrogen addition reduces soil bacterial richness, while phosphorus addition alters community composition in an old-growth N-rich tropical forest in southern China. Soil Biol. Biochem. 2018, 127, 22–30. [Google Scholar] [CrossRef]
  37. Vitousek, P.M.; Porder, S.; Houlton, B.Z.; Chadwick, O.A. Terrestrial phosphorus limitation: Mechanisms, implications, and nitrogen-phosphorus interactions. Ecol. Appl. 2010, 20, 5–15. [Google Scholar] [CrossRef] [PubMed]
  38. Qin, C.; Zhu, K.; Chiariello, N.R.; Field, C.B.; Peay, K.G. Fire history and plant community composition outweigh decadal multi-factor global change as drivers of microbial composition in an annual grassland. J. Ecol. 2020, 108, 611–625. [Google Scholar] [CrossRef]
  39. Xiao, Y.M.; Li, C.B.; Yang, Y.; Peng, Y.F.; Yang, Y.H.; Zhou, G.Y. Soil fungal community composition, not assembly process, was altered by nitrogen addition and precipitation changes at an alpine steppe. Front. Microbiol. 2020, 11, 579072. [Google Scholar] [CrossRef]
  40. Craig, H.; Antwis, R.E.; Cordero, I.; Ashworth, D.; Robinson, C.H.; Osborne, T.Z.; Bardgett, R.D.; Rowntree, J.K.; Simpson, L.T. Nitrogen addition alters composition, diversity, and functioning of microbial communities in mangrove soils: An incubation experiment. Soil Biol. Biochem. 2021, 153, 108076. [Google Scholar] [CrossRef]
  41. Guo, Q.; Wen, Z.M.; Ghanizadeh, H.; Fan, Y.M.; Zheng, C.; Yang, X.; Yan, X.H.; Li, W. Stochastic processes dominate assembly of soil fungal community in grazing excluded grasslands in northwestern China. J. Soils Sediments 2023, 23, 156–171. [Google Scholar] [CrossRef]
  42. Friedman, J.; Alm, E.J. Inferring correlation networks from genomic survey data. PLoS Comput. Biol. 2012, 8, e1002687. [Google Scholar] [CrossRef]
  43. Segata, N.; Izard, J.; Waldron, L.; Gevers, D.; Miropolsky, L.; Garrett, W.S.; Huttenhower, C. Metagenomic biomarker discovery and explanation. Genome Biol. 2011, 12, R60. [Google Scholar] [CrossRef]
  44. Urbach, N.; Ahlemann, F. Structural equation modeling in information systems research using partial least squares. J. Inf. Technol. Theory Appl. JITTA 2010, 11, 5–40. [Google Scholar]
  45. Hair, J.F.; Ringle, C.M.; Sarstedt, M. PLS-SEM : Indeed a silver bullet. J. Mark. Theory Pract. 2011, 19, 139–152. [Google Scholar] [CrossRef]
  46. Tatarko, A.R.; Knops, J.M.H. Nitrogen addition and ecosystem functioning: Both species abundances and traits alter community structure and function. Ecosphere 2018, 9, e02087. [Google Scholar] [CrossRef]
  47. Xu, L.C.; Xing, A.J.; Du, E.Z.; Shen, H.H.; Yan, Z.B.; Jiang, L.; Tian, D.; Hu, H.F.; Fang, J.Y. Effects of nitrogen addition on leaf nutrient stoichiometry in an old-growth boreal forest. Ecosphere 2021, 12, e03335. [Google Scholar] [CrossRef]
  48. Zheng, L.L.; Zhao, Q.; Yu, Z.Y.; Zhao, S.Y.; Zeng, D.H. Altered leaf functional traits by nitrogen addition in a nutrient-poor pine plantation: A consequence of decreased phosphorus availability. Sci. Rep. 2017, 7, 7415. [Google Scholar] [CrossRef] [PubMed]
  49. Sardans, J.; Alonso, R.; Janssens, I.A.; Carnicer, J.; Vereseglou, S.; Rillig, M.C.; Fernández-Martínez, M.; Sanders, T.G.M.; Peñuelas, J. Foliar and soil concentrations and stoichiometry of nitrogen and phosphorous across European Pinus sylvestris forests: Relationships with climate, N deposition and tree growth. Funct. Ecol. 2016, 30, 676–689. [Google Scholar] [CrossRef]
  50. You, C.M.; Wu, F.Z.; Yang, W.Q.; Xu, Z.F.; Tan, B.; Yue, K.; Ni, X.Y. Nutrient-limited conditions determine the responses of foliar nitrogen and phosphorus stoichiometry to nitrogen addition: A global meta-analysis. Environ. Pollut. 2018, 241, 740–749. [Google Scholar] [CrossRef]
  51. Deng, Q.; Hui, D.F.; Dennis, S.; Reddy, K.C. Responses of terrestrial ecosystem phosphorus cycling to nitrogen addition: A meta-analysis. Glob. Ecol. Biogeogr. 2017, 26, 713–728. [Google Scholar] [CrossRef]
  52. Marklein, A.R.; Houlton, B.Z. Nitrogen inputs accelerate phosphorus cycling rates across a wide variety of terrestrial ecosystems. New Phytol. 2012, 193, 696–704. [Google Scholar] [CrossRef] [PubMed]
  53. Lu, M.; Yang, Y.H.; Luo, Y.Q.; Fang, C.M.; Zhou, X.H.; Chen, J.K.; Yang, X.; Li, B. Responses of ecosystem nitrogen cycle to nitrogen addition: A meta-analysis. New Phytol. 2011, 189, 1040–1050. [Google Scholar] [CrossRef] [PubMed]
  54. Yang, Y.; Cheng, H.; Gao, H.; An, S.S. Response and driving factors of soil microbial diversity related to global nitrogen addition. Land. Degrad. Dev. 2020, 31, 190–204. [Google Scholar] [CrossRef]
  55. Dai, Z.M.; Su, W.Q.; Chen, H.H.; Barberán, A.; Zhao, H.C.; Yu, M.J.; Yu, L.; Brookes, P.C.; Schadt, C.W.; Chang, S.X.; et al. Long-term nitrogen fertilization decreases bacterial diversity and favors the growth of Actinobacteria and Proteobacteria in agro-ecosystems across the globe. Glob. Chang. Biol. 2018, 24, 3452–3461. [Google Scholar] [CrossRef]
  56. Wang, C.; Liu, D.W.; Bai, E. Decreasing soil microbial diversity is associated with decreasing microbial biomass under nitrogen addition. Soil Biol. Biochem. 2018, 120, 126–133. [Google Scholar] [CrossRef]
  57. Wu, J.P.; Liu, W.F.; Zhang, W.X.; Shao, Y.H.; Duan, H.L.; Chen, B.D.; Wei, X.H.; Fan, H.B. Long-term nitrogen addition changes soil microbial community and litter decomposition rate in a subtropical forest. Appl. Soil Ecol. 2019, 142, 43–51. [Google Scholar] [CrossRef]
  58. Zeng, J.; Liu, X.J.; Song, L.; Lin, X.G.; Zhang, H.Z.; Shen, C.C.; Chu, H.Y. Nitrogen fertilization directly affects soil bacterial diversity and indirectly affects bacterial community composition. Soil Biol. Biochem. 2016, 92, 41–49. [Google Scholar] [CrossRef]
  59. Zhou, Z.H.; Wang, C.K.; Luo, Y.Y. Meta-analysis of the impacts of global change factors on soil microbial diversity and functionality. Nat. Commun. 2020, 11, 3072. [Google Scholar] [CrossRef]
  60. Li, H.; Xu, Z.W.; Yang, S.; Li, X.B.; Top, E.M.; Wang, R.Z.; Zhang, Y.G.; Cai, J.P.; Yao, F.; Han, X.G.; et al. Responses of soil bacterial communities to nitrogen deposition and precipitation increment are closely linked with aboveground community variation. Microb. Ecol. 2016, 71, 974–989. [Google Scholar] [CrossRef]
  61. Liu, J.W.; Meng, Z.; Liu, X.Y.; Zhang, X.H. Microbial assembly, interaction, functioning, activity and diversification: A review derived from community compositional data. Mar. Life Sci. Technol. 2019, 1, 112–128. [Google Scholar] [CrossRef]
  62. Dini-Andreote, F.; Stegen, J.C.; Van Elsas, J.D.; Salles, J.F. Disentangling mechanisms that mediate the balance between stochastic and deterministic processes in microbial succession. Proc. Natl. Acad. Sci. USA 2015, 112, E1326–E1332. [Google Scholar] [CrossRef] [PubMed]
  63. Dai, W.F.; Zhang, J.J.; Tu, Q.C.; Deng, Y.; Qiu, Q.F.; Xiong, J.B. Bacterioplankton assembly and interspecies interaction indicating increasing coastal eutrophication. Chemosphere 2017, 177, 317–325. [Google Scholar] [CrossRef]
  64. Freedman, Z.B.; Romanowicz, K.J.; Upchurch, R.A.; Zak, D.R. Differential responses of total and active soil microbial communities to long-term experimental N deposition. Soil Biol. Biochem. 2015, 90, 275–282. [Google Scholar] [CrossRef]
  65. Li, J.; Li, Z.A.; Wang, F.M.; Zou, B.; Chen, Y.; Zhao, J.; Mo, Q.F.; Li, Y.W.; Li, X.B.; Xia, H.P. Effects of nitrogen and phosphorus addition on soil microbial community in a secondary tropical forest of China. Biol. Fertil. Soils 2015, 51, 207–215. [Google Scholar] [CrossRef]
  66. Markovskaja, S.; Kačergius, A. Morphological and molecular characterisation of Periconia pseudobyssoides sp. nov. and closely related P. byssoides. Mycol. Prog. 2014, 13, 291–302. [Google Scholar] [CrossRef]
  67. Neuhauser, S.; Huber, L.; Kirchmair, M. Is Roesleria subterranea a primary pathogen or a minor parasite of grapevines? Risk assessment and a diagnostic decision scheme. Eur. J. Plant Pathol. 2011, 130, 503–510. [Google Scholar] [CrossRef]
  68. Carey, C.J.; Michael Beman, J.; Eviner, V.T.; Malmstrom, C.M.; Hart, S.C. Soil microbial community structure is unaltered by plant invasion, vegetation clipping, and nitrogen fertilization in experimental semi-arid grasslands. Front. Microbiol. 2015, 6, 466. [Google Scholar] [CrossRef]
  69. McHugh, T.A.; Morrissey, E.M.; Mueller, R.C.; Gallegos-Graves, L.V.; Kuske, C.R.; Reed, S.C. Bacterial, fungal, and plant communities exhibit no biomass or compositional response to two years of simulated nitrogen deposition in a semiarid grassland. Environ. Microbiol. 2017, 19, 1600–1611. [Google Scholar] [CrossRef]
  70. She, W.W.; Bai, Y.X.; Zhang, Y.Q.; Qin, S.G.; Feng, W.; Sun, Y.F.; Zheng, J.; Wu, B. Resource availability drives responses of soil microbial communities to short-term precipitation and nitrogen addition in a desert shrubland. Front. Microbiol. 2018, 9, 186. [Google Scholar] [CrossRef]
  71. Huang, J.Y.; Xu, Y.X.; Yu, H.L.; Zhu, W.W.; Wang, P.; Wang, B.; Na, X.F. Soil prokaryotic community shows no response to 2 years of simulated nitrogen deposition in an arid ecosystem in northwestern China. Environ. Microbiol. 2021, 23, 1222–1237. [Google Scholar] [CrossRef] [PubMed]
  72. Cui, Y.X.; Zhang, Y.L.; Duan, C.J.; Wang, X.; Zhang, X.C.; Ju, W.L.; Chen, H.S.; Yue, S.C.; Wang, Y.Q.; Li, S.Q.; et al. Ecoenzymatic stoichiometry reveals microbial phosphorus limitation decreases the nitrogen cycling potential of soils in semi-arid agricultural ecosystems. Soil Tillage Res. 2020, 197, 104463. [Google Scholar] [CrossRef]
  73. Ramirez, K.S.; Lauber, C.L.; Knight, R.; Bradford, M.A.; Fierer, N. Consistent effects of nitrogen fertilization on soil bacterial communities in contrasting systems. Ecology 2010, 91, 3463–3470. [Google Scholar] [CrossRef] [PubMed]
  74. Sagova-Mareckova, M.; Omelka, M.; Cermak, L.; Kamenik, Z.; Olsovska, J.; Hackl, E.; Kopecky, J.; Hadacek, F. Microbial communities show parallels at sites with distinct litter and soil characteristics. Appl. Environ. Microbiol. 2011, 77, 7560–7567. [Google Scholar] [CrossRef]
  75. Bani, A.; Pioli, S.; Ventura, M.; Panzacchi, P.; Borruso, L.; Tognetti, R.; Tonon, G.; Brusetti, L. The role of microbial community in the decomposition of leaf litter and deadwood. Appl. Soil Ecol. 2018, 126, 75–84. [Google Scholar] [CrossRef]
  76. Wippel, K.; Tao, K.; Niu, Y.L.; Zgadzaj, R.; Kiel, N.; Guan, R.; Dahms, E.; Zhang, P.F.; Jensen, D.B.; Logemann, E.; et al. Host preference and invasiveness of commensal bacteria in the Lotus and Arabidopsis root microbiota. Nat. Microbiol. 2021, 6, 1150–1162. [Google Scholar] [CrossRef]
  77. Nie, Y.X.; Wang, M.C.; Zhang, W.; Ni, Z.; Hashidoko, Y.; Shen, W.J. Ammonium nitrogen content is a dominant predictor of bacterial community composition in an acidic forest soil with exogenous nitrogen enrichment. Sci. Total Environ. 2018, 624, 407–415. [Google Scholar] [CrossRef]
  78. Niu, G.X.; Hasi, M.; Wang, R.Z.; Wang, Y.L.; Geng, Q.Q.; Hu, S.Y.; Xu, X.H.; Yang, J.J.; Wang, C.H.; Han, X.G.; et al. Soil microbial community responses to long-term nitrogen addition at different soil depths in a typical steppe. Appl. Soil Ecol. 2021, 167, 104054. [Google Scholar] [CrossRef]
  79. Yao, M.J.; Rui, J.P.; Li, J.B.; Dai, Y.M.; Bai, Y.F.; Heděnec, P.; Wang, J.M.; Zhang, S.H.; Pei, K.Q.; Liu, C.; et al. Rate-specific responses of prokaryotic diversity and structure to nitrogen deposition in the Leymus chinensis steppe. Soil Biol. Biochem. 2014, 79, 81–90. [Google Scholar] [CrossRef]
  80. Zhou, J.; Guan, D.W.; Zhou, B.K.; Zhao, B.S.; Ma, M.C.; Qin, J.; Jiang, X.; Chen, S.F.; Cao, F.M.; Shen, D.L.; et al. Influence of 34-years of fertilization on bacterial communities in an intensively cultivated black soil in northeast China. Soil Biol. Biochem. 2015, 90, 42–51. [Google Scholar] [CrossRef]
Figure 1. Distribution of experimental sample plots.
Agronomy 13 02593 g001
Figure 2. Changes in the relative abundances of bacteria (a) and fungi (b) across the N gradients (at the phylum level). The data for the average relative abundances from three replicates were calculated as the ratio between the abundance of the sequence type and the total number of sequences. All calculations used normalized data. Different letters indicate significant differences (p < 0.05). The ns means no significant difference (p > 0.05).
Agronomy 13 02593 g002
Figure 3. The relative abundance of fungal taxa across the N gradients. The most differentially abundant taxa of fungal at varying N gradients based on linear discriminant analysis effect size method. The taxa with significantly different abundances among N gradients are represented by colored dots. From the center outward, the kingdom, phylum, class, order, family, genus, and species levels are presented, respectively. The colored nodes in the diagram represent the significantly discriminant taxon with other N gradients. Yellow circles represent nonsignificant differences in abundance between N gradients. Only taxa meeting the linear discriminant analysis significance threshold of >4 are shown.
Agronomy 13 02593 g003
Figure 4. Ecological processes shaping the bacterial (a) and fungal (b) community assemblies based on the C-score metric using null models. No significant difference between the values of observed C-scores (C-scoreobs) and simulated C-scores (C-scoresim) indicates a random co-occurrence pattern. The significant difference between the values of C-scoreobs and C-scoresim indicates a non-random co-occurrence pattern. Standardized effect size (SES) < −2 and >2 represent aggregation and segregation, respectively. For more details on the significance analysis of C-score in these communities, see Supplementary Table S2.
Agronomy 13 02593 g004
Figure 5. Effects of N addition on microbial community extinction and migration. (a) Bivariate plot between SExR (species-extinct ratio) and SImR (species-immigration ratio). (b) The contribution of extinct and immigrated OTUs to bacterial and fungal OTU abundance and community compositions under different N addition treatments. The bar charts show the percentage of extinct and immigrated OTUs in total OTU numbers, and the pie charts show the relative abundance of extinct and immigrated OTUs in the soil bacterial and fungal communities. (c) The contribution of extinct and immigrated OTUs to the dissimilarity of the bacterial and fungal communities between N addition treatments and control.
Agronomy 13 02593 g005
Figure 6. The structural equation model shows the effects of soil properties (TN and pH) and vegetation characteristics (plant community composition and CWM.SLA) on soil microbial compositions. Numbers adjacent to arrows are standardized path coefficients, and the width of the arrow is proportional to the strength of the path coefficient. R2 is the proportion of variance explained by the model. Significance levels: ** indicates p < 0.01 and *** indicates p < 0.001. See Supplementary Table S3 for model fitness details (Q2 values for the bacterial community compositions, fungal community compositions, and TN were 0.701, 0.306, and 0.377, respectively).
Agronomy 13 02593 g006
Table 1. The vegetation characteristics across N addition gradients. Values are means ± standard error (n = 6). Different letters indicate significant differences (p < 0.05). S_plant represents the species richness of plants; H_plant represents the Shannon index of plants.
ParametersN0N1N2N3N4N5Fp
CWM.LC (g kg−1)490.28 ± 3.30 a480.29 ± 5.05 abc474.46 ± 3.78 bc470.01 ± 3.85 c486.73 ± 5.54 ab482.96 ± 7.23 abc2.3180.068
CWM.LN (g kg−1)14.96 ± 0.30 d17.93 ± 0.83 c18.30 ± 0.51 c20.27 ± 0.41 b21.81 ± 0.57 ab23.11 ± 1.09 a19.240<0.001
CWM.LP (g kg−1)1.32 ± 0.04 a1.22 ± 0.11 ab1.16 ± 0.03 ab1.09 ± 0.05 b1.08 ± 0.06 b1.08 ± 0.10 b2.0130.105
CWM.SLA (cm−2 g−1)143.17 ± 11.02 a126.75 ± 8.52 ab131.21 ± 5.18 ab116.24 ± 5.98 b109.62 ± 2.78 b113.69 ± 9.76 b2.2630.074
Foliar N/P ratio11.29 ± 0.49 d14.97 ± 1.75 c15.79 ± 1.67 c18.84 ± 2.21 b20.33 ± 1.56 ab21.79 ± 2.62 a26.845<0.001
FDis1.43 ± 0.111.34 ± 0.071.28 ± 0.111.55 ± 0.101.29 ± 0.161.19 ± 0.220.8690.513
S_plant13.33 ± 1.02 a11.50 ± 1.12 ab13.33 ± 0.95 a9.50 ± 1.15 b9.67 ± 0.88 b8.67 ± 1.17 b3.7040.010
H_plant2.27 ± 0.10 a2.01 ± 0.10 ab2.21 ± 0.09 a1.88 ± 0.13 b1.81 ± 0.10 b1.73 ± 0.12 b4.0230.007
Aboveground biomass (g m−2)202.02 ± 17.73 b279.95 ± 36.95 b304.64 ± 41.77 b296.11 ± 71.13 b484.54 ± 108.55 a491.15 ± 23.48 a2.4920.041
Note: Bold indicates significant differences at 0.05 level.
Table 2. Soil properties across N application gradients. Values are means ± standard error (n = 3). Different letters indicate significant differences (p < 0.05).
ParametersN0N1N2N3N4N5Fp
OC (g kg−1)24.90 ± 1.5524.88 ± 1.9127.80 ± 1.4326.37 ± 2.5827.13 ± 1.1426.38 ± 0.490.5080.765
TN (g kg−1)2.63 ± 0.322.60 ± 0.332.93 ± 0.302.77 ± 0.362.61 ± 0.582.71 ± 0.150.3670.862
AN (mg kg−1)67.90 ± 4.2870.00 ± 4.5078.40 ± 5.3082.37 ± 5.7577.70 ± 2.5272.37 ± 6.961.1770.376
TP (g kg−1)0.62 ± 0.040.61 ± 0.030.62 ± 0.010.60 ± 0.040.62 ± 0.010.61 ± 0.020.2600.926
AP (mg kg−1)4.15 ± 0.06 a3.18 ± 0.40 b3.12 ± 0.30 b2.17 ± 0.08 c2.21 ± 0.35 c2.82 ± 0.32 bc6.6380.003
pH8.25 ± 0.058.26 ± 0.048.22 ± 0.048.30 ± 0.038.27 ± 0.048.26 ± 0.050.3930.845
SWC (%)21.55 ± 0.9021.53 ± 0.7523.95 ± 0.5123.34 ± 1.4323.41 ± 1.2122.52 ± 1.880.6770.649
Note: Bold indicates significant differences at 0.05 level.
Table 3. Soil bacterial (B) and fungal (F) α-diversity of different N application gradients. Values are means ± standard error (n = 3). Different letters indicate significant differences (p < 0.05).
ParametersN0N1N2N3N4N5Fp
B_ACE4139.95 ± 61.124115.67 ± 166.224270.66 ± 54.504312.69 ± 26.444266.26 ± 83.524125.14 ± 162.720.6700.654
B_Chao14034.67 ± 59.344000.78 ± 160.244158.49 ± 46.594193.21 ± 42.894184.37 ± 71.904041.05 ± 159.530.6920.639
B-Shannon9.70 ± 0.029.53 ± 0.169.71 ± 0.059.72 ± 0.069.69 ± 0.079.66 ± 0.100.6500.667
F_ACE2460.94 ± 207.222051.16 ± 272.712109.25 ± 158.802738.53 ± 445.162508.74 ± 253.722263.51 ± 298.780.8330.551
F_Chao12382.11 ± 195.042005.34 ± 306.952024.51 ± 142.492699.50 ± 469.472453.67 ± 264.522206.98 ± 267.110.8430.545
F-Shannon7.30 ± 0.43 ab6.74 ± 0.30 ab6.52 ± 0.13 b7.81 ± 0.30 a6.93 ± 0.55 ab6.84 ± 0.55 ab1.3040.325
Disclaimer/Publisher’s Note: The statements, opinions and data contained in all publications are solely those of the individual author(s) and contributor(s) and not of MDPI and/or the editor(s). MDPI and/or the editor(s) disclaim responsibility for any injury to people or property resulting from any ideas, methods, instructions or products referred to in the content.

