
Nitrogen Mineralization of Apple Orchard Soils in Regions of Western and South-Eastern Norway

 , , ,
, , ,
Abstract
:1. Introduction
- To give an overview of the nitrogen mineralization potential in Norwegian orchard soils.
- To examine the possibilities of using existing soil extraction methods to estimate the N supplying capacity of the soil.
- To evaluate soil nitrogen data given by commercial laboratories as a tool for fertilization planning in Norwegian orchards.
2. Materials and Methods
2.1. Sampling of Soils
2.2. Soil Characherization
2.3. Soil Incubation
3. Results
4. Discussion
4.1. Nutrient Status of the Soils
4.2. Mineralization of Nitrogen
4.3. Soil Analysis for Available N
5. Conclusions
Author Contributions
Funding
Data Availability Statement
Acknowledgments
Conflicts of Interest
References
- Salisbury, F.B.; Ross, C.W. Plant Physiology, Hormones and Plant Regulators: Auxins and Gibberellins; Wadsworth Publishing: Belmont, CA, USA, 1992. [Google Scholar]
- Faust, M. Physiology of Temperate Zone Fruit Trees; John Wiley and Sons, Inc.: Hoboken, NJ, USA, 1989. [Google Scholar]
- Kvåle, A. Fruktdyrking, 3rd ed.; Landbruksforlaget: Oslo, Norway, 1995. [Google Scholar]
- Zekri, M.; Obreza, T. Nitrogen (N) for Citrus Trees; A Series of the Department of Soil and Water Sciences; University of Florida: Gainesville, FL, USA, 2013. [Google Scholar]
- Keeney, D.R.; Nelson, D.W. Nitrogen -Inorganic forms. In Methods of Soil Analysis. Part 2; Page, A.L., Ed.; Agronomy: Madison, WI, USA; pp. 642–698.
- Lågbu, R.; Nyborg, Å.; Svendgård-Stokke, S. Jordsmonnstatistikk i Norge; NIBIO Rapport; NIBIO: Ås, Norway, 2018; Volume 13, p. 75. [Google Scholar]
- Paulsen, K.N. Soil Qulity and Fertiliser Application in Norwegian Apple Orchards. Master’s Thesis, Norwegian University of Life Sciences (NMBU), Ås, Norway, 15 May 2019. [Google Scholar]
- Dessureault-Rompre, J.; Zebarth, B.J.; Burton, D.L.; Georgallas, A. Predicting soil nitrogen supply from soil properties. Can. J. Soil Sci. 2015, 95, 63–75. [Google Scholar] [CrossRef]
- Risch, A.C.; Zimmermann, S.; Ochoa-Hueso, R.; Schuts, M.; Frey, B.; Firn, J.L.; Fay, P.A.; Hagedorn, F.; Borer, E.T.; Seabloom, E.W.; et al. Soil net nitrogen mineralisation across global grasslands. Nat. Commun. 2019, 10, 4981. [Google Scholar] [CrossRef] [PubMed]
- Cassity-Duffey, K.; Cabrera, M.; Franklin, D.; Gaskin, J.; Kissel, D. Effect of soil texture on nitrogen mineralization from organic fertilizers in four common southeastern soils. Soil Sci. Soc. Am. J. 2020, 84, 534–542. [Google Scholar] [CrossRef]
- Zhang, B.; Jingyi, L.; Craig, F.D.; Woodley, A.L.; Yang, X. Effect of crop rotation and cropping history on net nitrogen mineralization dynamics of a clay loam soil. Can. J. Soil Sci. 2022, 102, 445–456. [Google Scholar] [CrossRef]
- Mulder, E.G. Effect of liming an acid peat soil on microbial activity. Trans. 4th Int. Congr. Soil Sci. 1950, 2, 117–121. [Google Scholar]
- Edmeades, D.C.; Judd, M.; Sarathchandra, S.U. The Effect of Lime on Nitrogen Mineralization as measured by Grass growth. Plant Soil 1981, 60, 177–186. [Google Scholar] [CrossRef]
- Adams, F.; Martin, J.B. Liming Effects on Nitrogen Use and Efficiency. In Nitrogen in Crop Production; Hauck, R.D., Ed.; ASA, CSSA, SSSA: Madison, WI, USA, 1984; pp. 417–426. [Google Scholar]
- Lyngstad, I. Effect of Liming on Mineralization of Soil Nitrogen as Measured by Plant Uptake and Nitrogen Released during Incubation. Plant Soil 1992, 144, 247–253. [Google Scholar] [CrossRef]
- Miller, K.A.; Aegerter, B.J.; Clark, N.E.; Leinfelder-Miles, M.; Miyao, E.M.; Smith, R.; Wilson, R.; Geisseler, D. Relationship Between Soil Properties and Nitrogen Mineralization in Undisturbed Soil Cores from California Agroecosystems. Commun. Soil Sci. Plant Anal. 2019, 50, 77–92. [Google Scholar] [CrossRef]
- Carroll, J.E.; Robinson, T.L. New York Integrated Fruit Production Protocol for Apples; Cornell University: New York, NY, USA, 2006; p. 31. [Google Scholar]
- Kowalczyk, W.; Wrona, D.; Przybylko, S. Effect of Nitrogen Fertilization of Apple Orchard on Soil Mineral Nitrogen Content, Yielding of the Apple Trees and Nutritional Status of Leaves and Fruits. Agriculture 2022, 12, 17. [Google Scholar] [CrossRef]
- Vangdal, E. Gjødsling til Frukthagar; NIBIO: Ås, Norway, 2017. [Google Scholar]
- NIBIO. Fertilization Handbook; Norwegian Institute of Bioeconomy Research: Ås, Norway, 2023; Available online: https://www.nibio.no/tema/jord/gjodslingshandbok (accessed on 1 January 2023).
- Benbi, D.K.; Richter, J. A critical review of some approaches to modelling nitrogen mineralization. Biol. Fertil. Soils 2002, 35, 168–183. [Google Scholar] [CrossRef]
- Ros, G.H.; Temminghoff, E.J.M.; Hoffland, E. Nitrogen mineralization: A review and meta-analysis of the predictive value of soil tests. Eur. J. Soil Sci. 2011, 62, 162–173. [Google Scholar] [CrossRef]
- Øien, A.; Selmer-Olsen, A.R. A Laboratory method for evaluation of available nitrogen in soil. Acta Agric. Scand. 1980, 30, 149–156. [Google Scholar] [CrossRef]
- Bærug, R.; Lyngstad, I.; Selmer-Olsen, A.R.; Øien., A. Studies on Soil Nitrogen. I. An Evaluation of Laboratory Methods for Available Nitrogen in Soils from Arable and Ley-arable Rotations. Acta Agric. Scand. 1973, 23, 173–181. [Google Scholar] [CrossRef]
- Øien, A.; Selmer-Olsen, A.R.; Bærug, R.; Lyngstad, I. Studies on Soil Nitrogen. III. Effects of Drying, Deep-freezing and Storage on Moist Soil on Nitrogen Mineralization. Acta Agric. Scand. 1974, 24, 222–226. [Google Scholar] [CrossRef]
- Cabrera, M.L.; Kissel, D.E. Potentially Mineralizable Nitrogen in Disturbed and Undisturbed Soil samples. Soil Sci. Soc. Am. J. 1988, 52, 1010–1015. [Google Scholar] [CrossRef]
- Westerplate, J.; Norwegian Agricultural Advisory Service, NLR Østafjells, Gvarv, Norway. Soil chemical analysis from Eurofins laboratory in Netherlands. Personal communication, 2017. [Google Scholar]
- Selmer-Olsen, A.R.; Øien, A.; Bærug, R.; Lyngstad, I. Evaluation of a KCI-Hydrolyzing method for available nitrogen in soil by pot experiment. Acta Agric. Scand. 1981, 31, 251–255. [Google Scholar] [CrossRef]
- Linden, B.; Lyngstad, I.; Sippola, J.; Soegaard, K.; Kjellerup, V. Nitrogen Mineralization during the Growing Season. 2. Influence of soil organic matter content, and effect on optimum nitrogen fertilization of spring barley. Swed. J. Agric. Res. 1992, 22, 49–60. [Google Scholar]
- Elonen, P. Particle-Size Analysis of Soil. Ph.D. Thesis, University of Helsinki, Helsinki, Finland, 1971. [Google Scholar]
- Nelson, D.W.; Sommers, L.E. Total carbon, organic carbon, and organic matter. In Methods of Soil Analysis. Part 3. Chemical Methods; Sparks, D.L., Ed.; SSSA Book series; Wiley: Madison, WI, USA, 1996; pp. 961–1010. [Google Scholar]
- Egnér, H.; Domingo, W.R. Untersuchungen über die chemische Boden-Analyse als Grundlage für die Beurteilung des Nährstoffzustandes der Boden. Kung. Landbr. Ann. 1960, 26, 196–215. [Google Scholar]
- Institute, S. SAS for Windows, Version 9.4; SAS Support: Cary, NC, USA, 2016. [Google Scholar]
- Lourens, F. Kinoch- Volhoubare Landbou; RSA: Haifa, Israel, 1999. [Google Scholar]
- NIBIO. Agronomic Meteorological Service, 13 July 2023. Available online: https://lmt.nibio.no (accessed on 13 July 2023).
- Selmer-Olsen, A.R.; Øien, A.; Bærug, R.; Lyngstad, I. Studies on Soil Nitrogen. II. Anaerobic Incubation of Soil in Potassium Cloride Solution. Acta Agric. Scand. 1974, 27, 217–221. [Google Scholar] [CrossRef]
- Øien, A. Jordanalyser for vurdering av tilgjengelig nitrogen. Jord Og MyrundersøKelser 1985, 5, 259–265. [Google Scholar]
- Havelin, J.L.; Tisdale, S.L.; Nelson, W.L. Soil Fertility and Fertilizers. An Introduction to Nutrient Managment, 8th ed.; Prentice Hall: Pearson, NJ, USA, 2014. [Google Scholar]
- Licina, V.; Krogstad, T.; Simic, A.; Aksic, M.F.; Meland, M. Nutrition and Fertilizer Application to Apple Trees—A Review; NIBIO Report; NIBIO: Ås, Norway, 2021; Volume 7, pp. 1–79. [Google Scholar]
- Curtin, D.; Campbell, C.A.; Jalil, A. Effects of acidity on mineralization: pH-dependence of organic matter mineralization in weakly acidic soils. Soil Biol. Biochem. 1998, 30, 57–64. [Google Scholar] [CrossRef]
- Weil, R.R.B.; Brady, N.C. The Nature and Properties of Soils, 15th ed.; Pearson: New York, NY, USA, 2017. [Google Scholar]
- Vlassak, K. Total Soil Nitrogen and Nitrogen Mineralization. Plant Soil 1970, 32, 27–32. [Google Scholar] [CrossRef]
- Hanssen-Bauer, I.; Førland, E.J.; Haddeland, I.; Hisdal, H.; Lawrence, D.; Mayer, S.; Nesje, A.; Nilsen, J.E.Ø.; Sandven, S.; Sandø, A.B.; et al. Climate in Norway 2100—A Knowledge Base for Climate Adaption. Miljødirektoratet: Oslo, Norway, 2017; pp. 1–48. [Google Scholar]
- Vimic, A.V.; Mandic, M.V.; Aksic, M.F.; Vukicevic, K.; Meland, M. Climate potential for apple growing in Norway—Part 1: Zoning of areas with heat conditions favorable for apple growing under obsered climate change. Atmosphere 2023, 14, 993. [Google Scholar] [CrossRef]
- Matar, A.E.; Beck, D.P.; Pala, M.; Garabet, S. Nitrogen Mineralization Potentials of selected Mediterranean Soils. Commun. Soil Sci. Plant Anal. 1991, 22, 23–36. [Google Scholar] [CrossRef]
- Vigil, M.F.; Eghball, B.; Cabrera, M.L.; Jakubowski, B.R.; Davis, J.G. Accounting for seasonal nitrogen mineralization: An overview. J. Soil Water Conserv. 2002, 57, 464–469. [Google Scholar]
- Wade, J.; Horwath, W.R.; Burger, M.B. Integrating Soil Biological and Chemical Indices to Predict Net Nitrogen Mineralization across California Agricultural Systems. Soil Sci. Soc. Am. J. 2016, 80, 1675–1687. [Google Scholar] [CrossRef]
- Lazicki, P.; Geisseler, D.; Lloyd, M. Nitrogen mineralization from organic amendments is variable but predictable. J. Environ. Qual. 2020, 49, 483–495. [Google Scholar] [CrossRef] [PubMed]
- Chae, Y.M.; Tabatabai, M.A. Mineralization of Nitrogen in Soils Amended with Organic wastes. J. Environ. Qual. 1986, 15, 193–198. [Google Scholar] [CrossRef]
- Masunga, R.H.; Uzokwe, V.N.; Malay, P.D.; Odeh, I.; Sing, A.; Buchan, D.; De Neve, S. Nitrogen mineralization dynamics of different valuable organic amendments commonly used in agriculture. Appl. Soil Ecol. 2016, 101, 185–193. [Google Scholar] [CrossRef]
- Pinto, R.; Brito, L.M.; Coutinho, J. Nitrogen Mineralization from Organic Amendments Predicted by Laboratory and Field Incubations. Commun. Soil Sci. Plant Anal. 2020, 51, 515–526. [Google Scholar] [CrossRef]
- Geisseler, D.; Smith, R.; Cahn, M.; Muramoto, J. Nitrogen mineralization from organic fertilizers and composts: Literature survey and model fitting. J. Environ. Qual. 2021, 50, 1325–1338. [Google Scholar] [CrossRef] [PubMed]
- Skifteplan, Skifteplan Fertilization Program. Agromatic AS. 2022. Available online: www.skifteplan.no (accessed on 1 January 2023).
- Thom, T.; Hanlon, A.; Lindsay, R.; Richards, J.; Stoneman, R.; Brooks, A. Conserving Bogs. The Management Handbook, 2nd ed.; Scottish Raised Bog Conservation Project: IUCN UK Peatland Programme; Royal Soc Wildlife Trust: Nottinghamshire, UK, 2014. [Google Scholar]
- Krogstad, T. Results of 40 soil samples analysed at a commersial laboratory. Acta Agric. Scand. 2023; scientific article in progress. [Google Scholar]


| Soil Ref. | Soil Density | pH H2O | Total C * | Total N | Na-AL | K- AL | Mg-AL | Ca-AL | P- AL | K-HNO3 | Soil Texture Class |
|---|---|---|---|---|---|---|---|---|---|---|---|
| g dm−3 | % | % | mg kg−1 | mg kg−1 | mg kg−1 | mg kg−1 | mg kg−1 | mg kg−1 | |||
| U1 | 1.03 | 5.34 | 3.84 | 0.28 | 20 | 110 | 88 | 640 | 320 | 1300 | Sandy loam |
| U2 | 1.04 | 5.32 | 4.45 | 0.23 | 16 | 110 | 32 | 360 | 240 | 1300 | Loam |
| U3 | 0.99 | 5.30 | 2.98 | 0.26 | 22 | 380 | 100 | 1300 | 260 | 3000 | Silt loam |
| U4 | 1.01 | 4.68 | 2.52 | 0.25 | 14 | 74 | 38 | 300 | 260 | 3900 | Sandy loam |
| L1 | 1.18 | 7.04 | 4.11 | 0.35 | 38 | 320 | 220 | 2800 | 840 | 1500 | Loamy sand |
| L2 | 1.32 | 4.96 | 0.81 | 0.05 | 12 | 170 | 66 | 220 | 220 | 2700 | Silt loam |
| L3 | 1.17 | 5.46 | 1.61 | 0.13 | 9,8 | 120 | 140 | 720 | 68 | 1200 | Silt loam |
| L4 | 1.44 | 6.69 | 1.43 | 0.09 | 10 | 170 | 190 | 1200 | 90 | 870 | Silt loam |
| S1 | 1.03 | 6.82 | 5.13 | 0.41 | 19 | 240 | 560 | 2800 | 160 | 980 | Sandy loam |
| S2 | 1.09 | 6.65 | 3.15 | 0.24 | 18 | 130 | 340 | 2600 | 480 | 900 | Sandy loam |
| S3 | 1.25 | 6.81 | 1.51 | 0.19 | 16 | 140 | 160 | 1100 | 140 | 900 | Sandy loam |
| S4 | 1.12 | 5.76 | 2.37 | 0.17 | 17 | 140 | 130 | 1000 | 170 | 1200 | Silt loam |
| Soil No. | Initial Concentration (mg L−1) | 3 °C | 8 °C | 15 °C | 20 °C | ||||||||
|---|---|---|---|---|---|---|---|---|---|---|---|---|---|
| 2d | 4d | 8d | 2d | 4d | 8d | 2d | 4d | 8d | 2d | 4d | 8d | ||
| U1 | 4.47 | 47 | 78 | 99 | 85 | 99 | 113 | 87 | 110 | 116 | 84 | 127 | 121 |
| U2 | 7.37 | 0 ns | 19 | 17 | 0 ns | 2 ns | 24 | 10 ns | 42 | 89 | 29 | 56 | 101 |
| U3 | 31.0 | 7 ns | 4 ns | 17 | 4 ns | 4 ns | 13 | 5 ns | 1 ns | 13 | 0 ns | 0 ns | 12 |
| U4 | 6.90 | 0 ns | 1 ns | 25 | 5 ns | 8 ns | 25 | 11 | 22 | 74 | 20 | 65 | 86 |
| L1 | 1.82 | 68 | 61 | 105 | 59 | 87 | 131 | 59 | 91 | 165 | 65 | 164 | 245 |
| L2 | 1.32 | 67 | 73 | 127 | 152 | 96 | 130 | 319 | 137 | 303 | 106 | 285 | 412 |
| L3 | 1.63 | 121 | 129 | 182 | 201 | 133 | 215 | 161 | 177 | 313 | 219 | 337 | 647 |
| L4 | 3.97 | 52 | 88 | 89 | 71 | 80 | 112 | 67 | 119 | 142 | 108 | 131 | 120 |
| S1 | 6.42 | 50 | 42 | 57 | 46 | 39 | 60 | 43 | 66 | 51 | 58 | 71 | 88 |
| S2 | 6.47 | 30 | 46 | 81 | 44 | 48 | 89 | 48 | 57 | 101 | 57 | 76 | 126 |
| S3 | 10.2 | 24 | 16 | 50 | 22 | 26 | 48 | 29 | 30 | 54 | 27 | 38 | 54 |
| S4 | 4.33 | 48 | 75 | 116 | 63 | 82 | 136 | 79 | 110 | 157 | 94 | 131 | 210 |
| Soil No. | Mineral N at Start of Incubation | 8 °C | 15 °C | ||
|---|---|---|---|---|---|
| 64 Days | 128 Days | 64 Days | 128 Days | ||
| U1 | 24 | +64 | +85 | +91 | +122 |
| U2 | 40 | +46 | +64 | +67 | +104 |
| U3 | 185 | +30 | +38 | +56 | +74 |
| U4 | 38 | +44 | +55 | +73 | +105 |
| L1 | 11 | +59 | +95 | +97 | +154 |
| L2 | 8.9 | +54 | +77 | +75 | +102 |
| L3 | 11 | +47 | +63 | +67 | +94 |
| L4 | 30 | +65 | +72 | +82 | +98 |
| S1 | 39 | +58 | +91 | +87 | +131 |
| S2 | 41 | +70 | +93 | +103 | +163 |
| S3 | 65 | +61 | +95 | +84 | +143 |
| S4 | 29 | +78 | +112 | +108 | +162 |
| Average Std. | 44 45.3 | 56 12.5 | 78 19.9 | 83 15.0 | 121 28.1 |
| Temperature | 32 Days | 64 Days | 128 Days | |
|---|---|---|---|---|
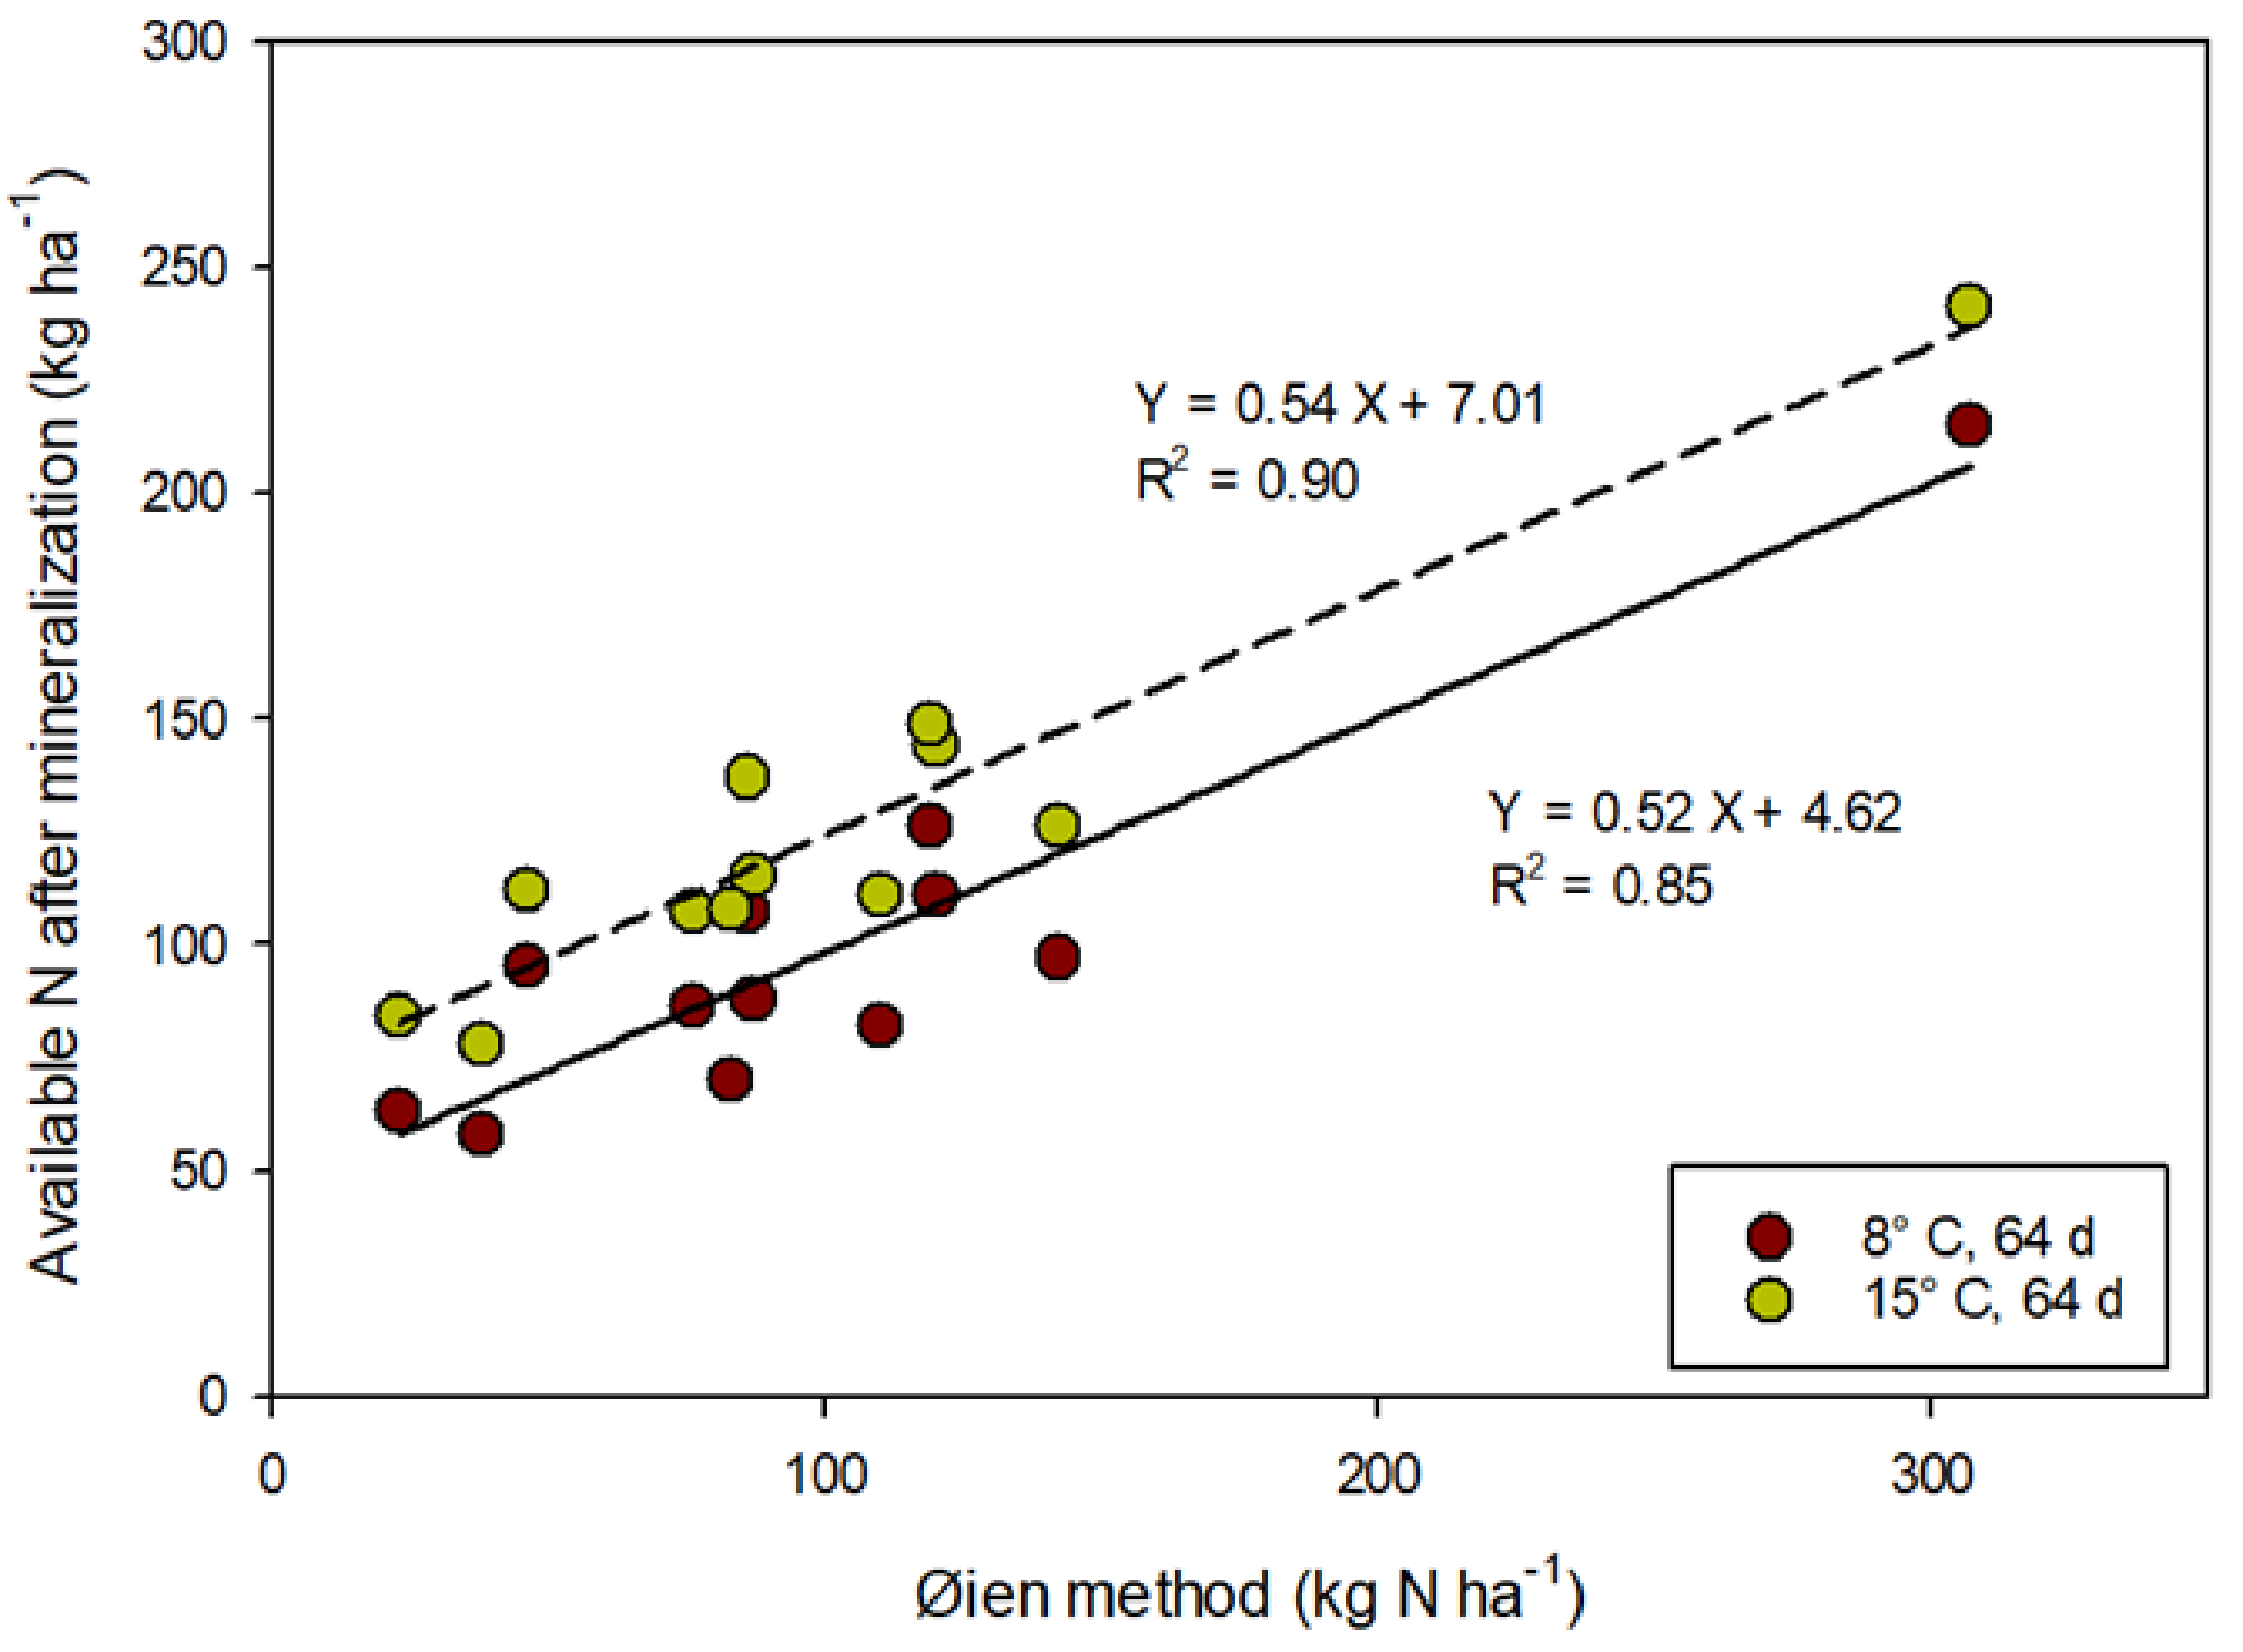
| 8 °C | Slope | 0.63 | 0.52 | 0.50 |
| R2 | 0.87 | 0.85 | 0.82 | |
| % | 85 | 97 | 118 | |
| 15 °C | Slope | 0.66 | 0.54 | 0.53 |
| R2 | 0.91 | 0.90 | 0.75 | |
| % | 103 | 122 | 160 | |
| Organic Matter (%) | 0–3 | 3–4.5 | 4.6–12.5 | 12.6–20.5 | 20.6–40 | 41–75 | 41–75 * | 41–75 ** |
|---|---|---|---|---|---|---|---|---|
| Effect of mineralization | 20 | 10 | 0 | −10 | −20 | −30 | −40 | 0 |
Disclaimer/Publisher’s Note: The statements, opinions and data contained in all publications are solely those of the individual author(s) and contributor(s) and not of MDPI and/or the editor(s). MDPI and/or the editor(s) disclaim responsibility for any injury to people or property resulting from any ideas, methods, instructions or products referred to in the content. |
© 2023 by the authors. Licensee MDPI, Basel, Switzerland. This article is an open access article distributed under the terms and conditions of the Creative Commons Attribution (CC BY) license (https://creativecommons.org/licenses/by/4.0/).
Share and Cite
Krogstad, T.; Zivanovic, V.; Simic, A.; Aksic, M.F.; Licina, V.; Meland, M. Nitrogen Mineralization of Apple Orchard Soils in Regions of Western and South-Eastern Norway. Agronomy 2023, 13, 2570. https://doi.org/10.3390/agronomy13102570
Krogstad T, Zivanovic V, Simic A, Aksic MF, Licina V, Meland M. Nitrogen Mineralization of Apple Orchard Soils in Regions of Western and South-Eastern Norway. Agronomy. 2023; 13(10):2570. https://doi.org/10.3390/agronomy13102570
Chicago/Turabian StyleKrogstad, Tore, Valentina Zivanovic, Aleksandar Simic, Milica Fotiric Aksic, Vlado Licina, and Mekjell Meland. 2023. "Nitrogen Mineralization of Apple Orchard Soils in Regions of Western and South-Eastern Norway" Agronomy 13, no. 10: 2570. https://doi.org/10.3390/agronomy13102570
APA StyleKrogstad, T., Zivanovic, V., Simic, A., Aksic, M. F., Licina, V., & Meland, M. (2023). Nitrogen Mineralization of Apple Orchard Soils in Regions of Western and South-Eastern Norway. Agronomy, 13(10), 2570. https://doi.org/10.3390/agronomy13102570