Article

A Predictive Study on the Content of Epigallocatechin Gallate (EGCG) in Yunnan Large Leaf Tea Trees Based on the Nomogram Model

1
College of Tea Science, Yunnan Agricultural University, Kunming 650201, China
2
College of Agronomy and Biotechnology, Zhejiang University, Hangzhou 310013, China
3
Yunnan Organic Tea Industry Intelligent Engineering Research Center, Yunnan Agricultural University, Kunming 650201, China
4
College of Mechanical and Electrical Engineering, Yunnan Agricultural University, Kunming 650201, China
*
Authors to whom correspondence should be addressed.
Agronomy 2023, 13(10), 2475; https://doi.org/10.3390/agronomy13102475
Submission received: 18 August 2023 / Revised: 18 September 2023 / Accepted: 22 September 2023 / Published: 25 September 2023
(This article belongs to the Special Issue Advances in Data, Models, and Their Applications in Agriculture)

Abstract

:
To explore the changes in epigallocatechin gallate (EGCG) content in tea under abiotic stress conditions, we collected tea samples, along with corresponding soil and altitude data, and utilized the measured data for single-factor analysis. At the same time, the LASSO regression method, which is rarely used in agriculture, was employed to screen modeling factors, a prediction model was established, and the Akaike information criterion (AIC) was introduced to compare the goodness of fit. The results show that LASSO screening reduced the AIC value of the model by 13.8%. The average area under the curve of the training set and the validation set was 0.81 and 0.76, respectively, and the calibration curve also showed good consistency. Based on the nomogram model, a visual prediction system was developed, and the content prediction curve was introduced for detailed soil evaluation. The accuracy rate reached 75% after external verification. This study provides a theoretical basis for elucidating the prediction and intervention of Pu’er tea quality under abiotic stress conditions.

1. Introduction

Tea was originally a medicinal product, and then gradually became one of the three most popular beverages in the world. Pu’er tea is attracting more and more attention because of its anti-cancer [1,2], hypoglycemic [3,4], and hypolipidemic properties [5,6,7,8]. At the same time, studies show that theaflavins in Pu’er tea can regulate the activity of biological enzymes in the body [9] and also have the ability to directly eliminate free radicals, which plays an anti-oxidation and anti-aging role. Pu’er tea is made from sun-dried green tea. In May 2023, in the international standard ISO20715 2023 Tea Classification, raw Pu’er tea was classified as green tea. Green tea is widely regarded as a healthy drink, and scientists around the world have conducted research on the potential benefits of green tea and its catechins, particularly epigallocatechin gallate (EGCG) [10]. EGCG is a kind of ester catechin, which is the main substance of bitterness and astringency in tea. With the help of high-tech achievements, the utilization rate of tea has been continuously improved, and EGCG has become an important raw material in the food, everyday chemical, and pharmaceutical industries. EGCG is the main polyphenol in green tea and has many biological functions. Not only does it play a crucial part in combating cancer [11,12,13,14] but it also plays a significant role in reducing inflammation [15,16] and has antibacterial, anti-infection, and other aspects. It is believed that EGCG will have great development prospects as a new drug in the future.
At present, some scholars have begun to try to predict tea yield and physical and chemical components by considering environmental factors and soil components. Some of these scholars have successfully used the soil environment to predict the content of tea polyphenols in tea [17]. Relevant scholars have made a prediction regarding the storage period of white tea based on the change in its composition. However, the accuracy of the model is not high [18]. The nomogram used in this study is an intuitive mathematical model that can predict specific results by combining multiple factors. It usually shows its results in the form of charts, which improves the intuitiveness of the prediction results. Furthermore, the nomogram model construction process is both faster and less reliant on extensive training data, which is very beneficial to our model construction. The nomogram model is a reliable and convenient tool widely used in the medical field [19,20,21,22,23]. In the field of agronomy, its application is relatively rare, but because of its intuitive, rapid construction and reliability, it is considered to be a potential tool. Through further research and application, the nomogram model can provide more accurate prediction and management methods for agricultural production, thus promoting the sustainable development of agriculture.
The study focused on a specific region and used the same variety of tea as the research object. A multi-factor regression model was constructed to explore the contribution of various environmental factors (such as soil arsenic, nickel content, and organic matter content) to the EGCG content in tea. Aiming to solve the problem that the nomogram model cannot display multiple results at the same time, the prediction model constructed in this study finally realized a variety of charts and data display forms by effectively improving the developed visualization system, which provides a basic model for the in-depth study of physical and chemical components of tea to some extent. Meanwhile, to rectify the issue of inaccurate content range prediction, this study draws on the construction idea of a survival curve in the medical field to realize the construction and display of the EGCG content prediction curve. It serves as a scientific theoretical foundation for further investigations into how abiotic stress conditions impact the quality of Pu’er tea.

2. Materials and Methods

2.1. The Research Location’s General Situation

The Xishuangbanna area belongs to the tropical monsoon climate, with abundant sunshine and abundant rainfall. The year in this region is divided into two distinct seasons: dry and wet. The average annual temperature remains around 21 °C. Foggy days range between 108 and 146 days throughout the year. The region is warm, heat-rich, humid, and rainy throughout the year. The rainy season lasts up to 5 months (May–October). Tea mountain soil features a loose, deep soil layer; good drainage; breathable, slightly acidic soil (red soil, yellow soil, latosol); and pH value of between 4 and 6. This shows that the topography, soil, and climatic conditions in Xishuangbanna are very suitable for the growth of tea trees. At the same time, this region, selected as the research area due to its status as a major producer of Yunnan Pu’er tea, stands out for its contribution to the tea industry.

2.2. Experimental Materials

The tea and soil data for this experiment were collected from the base of Yuecheng Co., Ltd. in Xishuangbanna, Yunnan Province. A total of 21 small areas were collected from the base and 4 samples were collected from each small area, for a total of 84 samples. Mengku large-leaf tea, being the primary high-quality raw material for producing Pu’er tea, serves as a solid foundation for its exceptional quality. The age range of tea trees falls between 8 and 15 years. The fresh leaves were picked following the standard of one bud and two leaves and processed using the conventional sun-dried method for sun-dried green tea production. The physical and chemical composition testing experiments were carried out by taking the average of three sets of data after five measurements, and the data were categorized, analyzed, and calculated using Microsoft Excel 2010 software (Microsoft Corporation, Redmond, WA, USA).
Samples were collected on the sunny slope and shady slope of the tea garden base. One bud and two leaves were collected on the top, middle, and bottom of each slope. Each sampling area was repeated three times and stored in a self-sealing bag with a unique identification number. The physical and chemical composition detection experiments related to this research were conducted in the D108 room of the Tea College Laboratory at Yunnan Agricultural University. The content of water extract was determined based on the method of tea water extract determination (GB/T 8305-2013), the total amount of tea polyphenols was determined based on the method of tea polyphenols and catechin content in tea (GB/T 8313-2018), the total amount of free amino acids was determined based on the method of tea free amino acid total determination (GB/T 8314-2013), and the content of catechin components and caffeine was determined via HPLC [24].
The soil samples were collected from the area between the rows of tea plants at the designated tea-picking location. The topsoil, approximately 4–5 cm deep, was carefully excavated from the surface. Then, vertical samples of the cultivated layer soil, reaching a depth of 20 cm, were taken. Altitude measurements were also recorded. A total of 21 components of soil samples were collected and analyzed, including arsenic, chrome, lead, nickel, mercury, available cadmium, available chromium, pH, zinc, copper, organic matter, nitrogen, phosphorus, potassium, alkaline hydrolysis nitrogen, magnesium, fluoride, and cations. that the consistency of the collection site, depth, and weight of each sampling point was ensured.
The concentrations of copper, zinc, chromium, nickel, and lead were analyzed using flame atomic absorption spectrophotometry. Total phosphorus determination was conducted using the alkali fusion–Mo-Sb anti-spectrophotometric method, the effective phosphorus was determined using the sodium hydrogen carbonate solution–Mo-Sb anti-spectrophotometric method, the determination of effective potassium was completed with the combined leaching–colorimetric method, the determination of nitrogen was completed with the Kjeldahl method, fluoride determination was carried out using the ion-selective electrode method, cation exchange capacity (CEC) determination was carried out using the hexammine cobalt trichloride solution–spectrophotometric method, the determination of soil pH was carried out using potentiometry, the determination of arsenic and mercury was carried out using atomic fluorescence spectrometry, and the determination of organic matter was completed with the oxidation of the potassium dichromate oxidation spectrophotometric determination of organic carbon multiplied by the constant 1.724.

2.3. Statistical Analysis

The software and hardware utilized are based on Zhang Shihao et al.’s research, which was used to construct the model in this study [17]. The LASSO (Least Absolute Shrinkage and Selection Operator) regression method was employed for screening the modeling factors. The regression method aims to decrease the variable group by constructing a penalty function that compresses the variable coefficients, ultimately resulting in some regression coefficients becoming zero. LASSO regression is a biased estimation method used to handle multicollinearity in data while still maintaining the benefits of subset shrinkage. In the screening stage of the LASSO regression model, altitude, available nickel, cation, magnesium, and total potassium were identified as the variables for constructing the nomogram model. This selection was based on the distribution of coefficients and cross-validation results from LASSO analysis. In order to verify the relationship between modeling factors and EGCG content, single-factor analysis was performed using Cox regression analysis was used to analyze all variables, followed by multivariate analysis on the selected modeling factors via single-factor analysis, and multivariate analysis was performed on the selected modeling factors. The Akaike criterion was introduced to compare and analyze the goodness of fit.
When assessing the model’s accuracy and stability, we utilized both the ROC curve and the calibration curve. By calculating the area under the ROC curve, the performance of the classification model could be assessed. Additionally, by calibrating the curve, the consistency between the predicted results and the actual results could be verified [25]. According to the calculation results, when the area was greater than 0.75, the predictive ability of the model could be considered to be better; when the area was between 0.5 and 0.75, the predictive ability of the model was still acceptable. In view of the shortcomings of having fewer modeling data sets, this study further introduced the bootstrap method to expand the data set for the accuracy evaluation and the stability evaluation of the model. The basic idea of bootstrap is to sample from the original data set multiple times to create different data sets. These samples are then used to replace the overall distribution with the empirical distribution. The random put-back sampling method is employed for the corresponding operation, and a specific quantity of samples is extracted from the original data set. The estimated statistics are calculated based on the extracted samples, and the variance and distribution are determined accordingly.

3. Results

3.1. Model Construction Factor Selection

In this study, LASSO regression was used to screen out the variables and types needed to construct a prediction model of the EGCG content in tea. The LASSO regression used not only realizes the screening of variables but also effectively enhances the complexity of the model while reducing the number of dependent variables needed for the prediction model. The variable selection process involves selectively adding variables to the nomogram prediction model in order to improve performance parameters. The model complexity is primarily altered by adjusting the parameters to prevent overfitting [26,27,28]. As the number of variables increases, the complexity of the nomogram model also increases. To a certain extent, this enhances the accuracy of the model, but it is also more prone to the problem of overfitting. The loss function of LASSO regression can be calculated using the following Formula (1):
J θ = 1 2 m i = 1 m ( h θ x i y i ) 2 + λ j = 1 n | θ j | ,
where the λ value is a regularization parameter. The complexity of the LASSO model is mainly controlled by the λ value. The larger the λ value is, the fewer variables are selected by the model. In the diagram of the LASSO regression’s coefficient distribution, as the abscissa (penalty coefficient) increases, the variable coefficient (ordinate) is progressively compressed by the penalty term and does not stop changing until it is finally compressed to 0. In order to address the issue of insufficient data sets, bootstrap is utilized for resampling in cross-validation. The two dotted lines in the figure represent the two best λ values obtained through cross-verification. The left dotted line represents the instance when the mean square error of the longitudinal axis is at its minimum, whereas the right dotted line denotes the standard error value of this minimum. Due to the increasing complexity of model construction, the model is more likely to produce overfitting. In order to reduce the risk of over-fitting, the λ value at the standard error level of one time was selected for LASSO regression analysis. Based on the analysis results (Figure 1), this study selected altitude, available nickel, cations, Mg, and total potassium as the five factors to establish the prediction model.

3.2. Factor Analysis and Model Construction

Cox regression is generally used for survival analysis in clinical medicine [29,30,31]. In this study, we utilized it to assess the impact of multiple factors simultaneously on the changes in EGCG content, as demonstrated in Formula (2), where h t is the risk function of the research object, which changes with the change in EGCG content; h(t) is the intercept of the regression equation; x1, x2, and xj represent the independent variable; and β1, β2, and βj represent the regression coefficient.
h t = h 0 t exp β 1 x 1 + β j x j ,
To minimize the data set’s influence on the model’s performance, this study randomly segregated it into a training set and a validation set using an 8:2 ratio. The Cox regression model was utilized to compare the changes in EGCG content with 22 other variables through both univariate and multivariate analysis. The results of the analysis are shown in Table 1. Among them, altitude, available nickel, cations, Mg, and total potassium screened by LASSO regression had a significant effect on the change in EGCG content (p < 0.05), and all exhibited a robust correlation with the change in EGCG content.
In order to further verify the necessity of the modeling factors selected by LASSO regression to model the construction, this study compared and analyzed the AIC (Akaike information criterion) values of all strong correlation factor modeling and the AIC values of the filtered modeling factors. The AIC serves as a standard for assessing the quality of fit of statistical models. It is built upon the principle of entropy and establishes a benchmark for evaluating the complexity of the estimated model and the accuracy of the fitted data [32,33]. When selecting the optimal model from a given set of models, typically, the model with the lowest A I C is chosen.
A I C = 2 k l n ( L ) ,
K is the model parameter, whereas L represents the likelihood function. There exists a substantial disparity between the models, which is predominantly evident in the likelihood function component. When the difference in likelihood functions is not significant, the complexity of the model becomes a relevant factor. When the model complexity increases (k increases), the likelihood function L also increases, resulting in a smaller value for the AIC. When the value of k is too large, the growth rate of the likelihood function slows down. This leads to an increase in the AIC, indicating that the model is too complex and prone to over-fitting. The AIC enhances the degree of fitting in the model and introduces a penalty term to mitigate over-fitting by minimizing the number of model parameters. It was verified that the AIC value of the modeling factor screened by LASSO regression was 361.6009, which was 13.8% lower than that of all p < 0.05 strong correlation factors.
The nomogram model is based on multi-factor regression analysis, integrates multiple modeling factors, and draws proportional line segments on the same plane using line segments with scale lines to express the relationship between variables in the model. The basic principle of the model is to construct a multi-factor regression model. The regression coefficient size in the model helps determine the degree of influence of each modeling factor on the outcome variable’s change.
The corresponding score is assigned to the value of each dependent variable, and the prediction probability of the outcome variable is calculated by employing the function transformation between the total score and the outcome variable. In this study, RStudio software was used to construct the nomogram model based on the five modeling factors obtained through LASSO regression. The nomogram indicated that the alteration of total potassium content in the soil had the most substantial impact on EGCG. The unit of altitude is m, and the units of available nickel, cations, Mg, and total potassium are mg/kg. In the prediction of the nomogram model, a total score value was obtained by adding the corresponding scores for “Points” based on the parameters of altitude, available nickel, cations, Mg, and total potassium. The final prediction probability corresponds to the value at the total score position for “Total Points” (Figure 2).

3.3. Model Accuracy Assessment

The ROC curve serves as an assessment of a model’s generalization performance. It was originally mainly used in the analysis of radar signals detected in war. It is currently primarily used to assess the performance of machine learning generative models. The ROC curve is a valuable tool for comprehensively evaluating the strengths and weaknesses of different models. A higher accuracy in prediction results can be observed when the curve position is towards the upper left. The ROC curve is a method to evaluate the results by dividing the final results into positive and negative. When evaluating the accuracy of the model, we reflect on different aspects of the real situation, including true positive ( T P ), false negative ( F N ), false positive ( F P ) and true negative ( T N ). When the predicted value is completely consistent with the true value, it is called true positive or true negative; when the predicted value is completely consistent with the true value, it is called true positive or true negative. The ordinate of the ROC curve is the true positive rate (TPR), this indicates the proportion of correctly predicted positive events in actual positive events, and the larger the value, the more accurate the prediction. The abscissa of the ROC curve is the false positive rate ( F P R ), it indicates the proportion of predicted positive events in actual negative events, and the smaller the value, the more accurate the prediction.
T P R = T P T P + F N , F P R = F P F P + T N
To ensure a comprehensive assessment of the model’s performance, relying solely on the ROC curve may not suffice. It is of utmost importance, therefore, to utilize alternative methods to accurately gauge its accuracy. In practical applications, evaluating the performance of a model can be effectively achieved by calculating the area under the curve (AUC). The AUC value represents the area under the ROC curve. The larger the AUC value, the stronger the classification ability. It is widely accepted that a model is considered to have good discrimination ability when the AUC value is ≥0.7 [34,35,36]. In this particular model, when EGCG > 20%, the AUC values obtained for the training and validation sets were 0.826 and 0.803, respectively. When EGCG > 30%, the AUC values for the training and validation sets were 0.792 and 0.717, respectively. As shown in Figure 3A,B, it can be observed that the AUC values of the training set and the verification set both reached at least 0.7, demonstrating that the model has obvious good prediction performance.

3.4. Evaluation of Model Stability

The calibration curve serves as a valuable tool for assessing the degree of fit between the model’s prediction results and the actual situation [37,38,39,40]. It can be used to evaluate the fitting degree between the nomogram and the change in EGCG content under abiotic stress. When the red line is closer to the long dotted line, the prediction result improves. In order to ensure the accuracy of the study, this study used bootstrap for resampling, and the number of resamplings was 3000 [41]. It can be seen that the actual calibration curve of the prediction model was highly similar to the ideal calibration curve through the calibration curve of the nomogram. It exhibited clear consistency for both the training set and the verification set. The models in the training sets in Figure 4A,C correspond to the verification sets in Figure 4B,D, respectively.

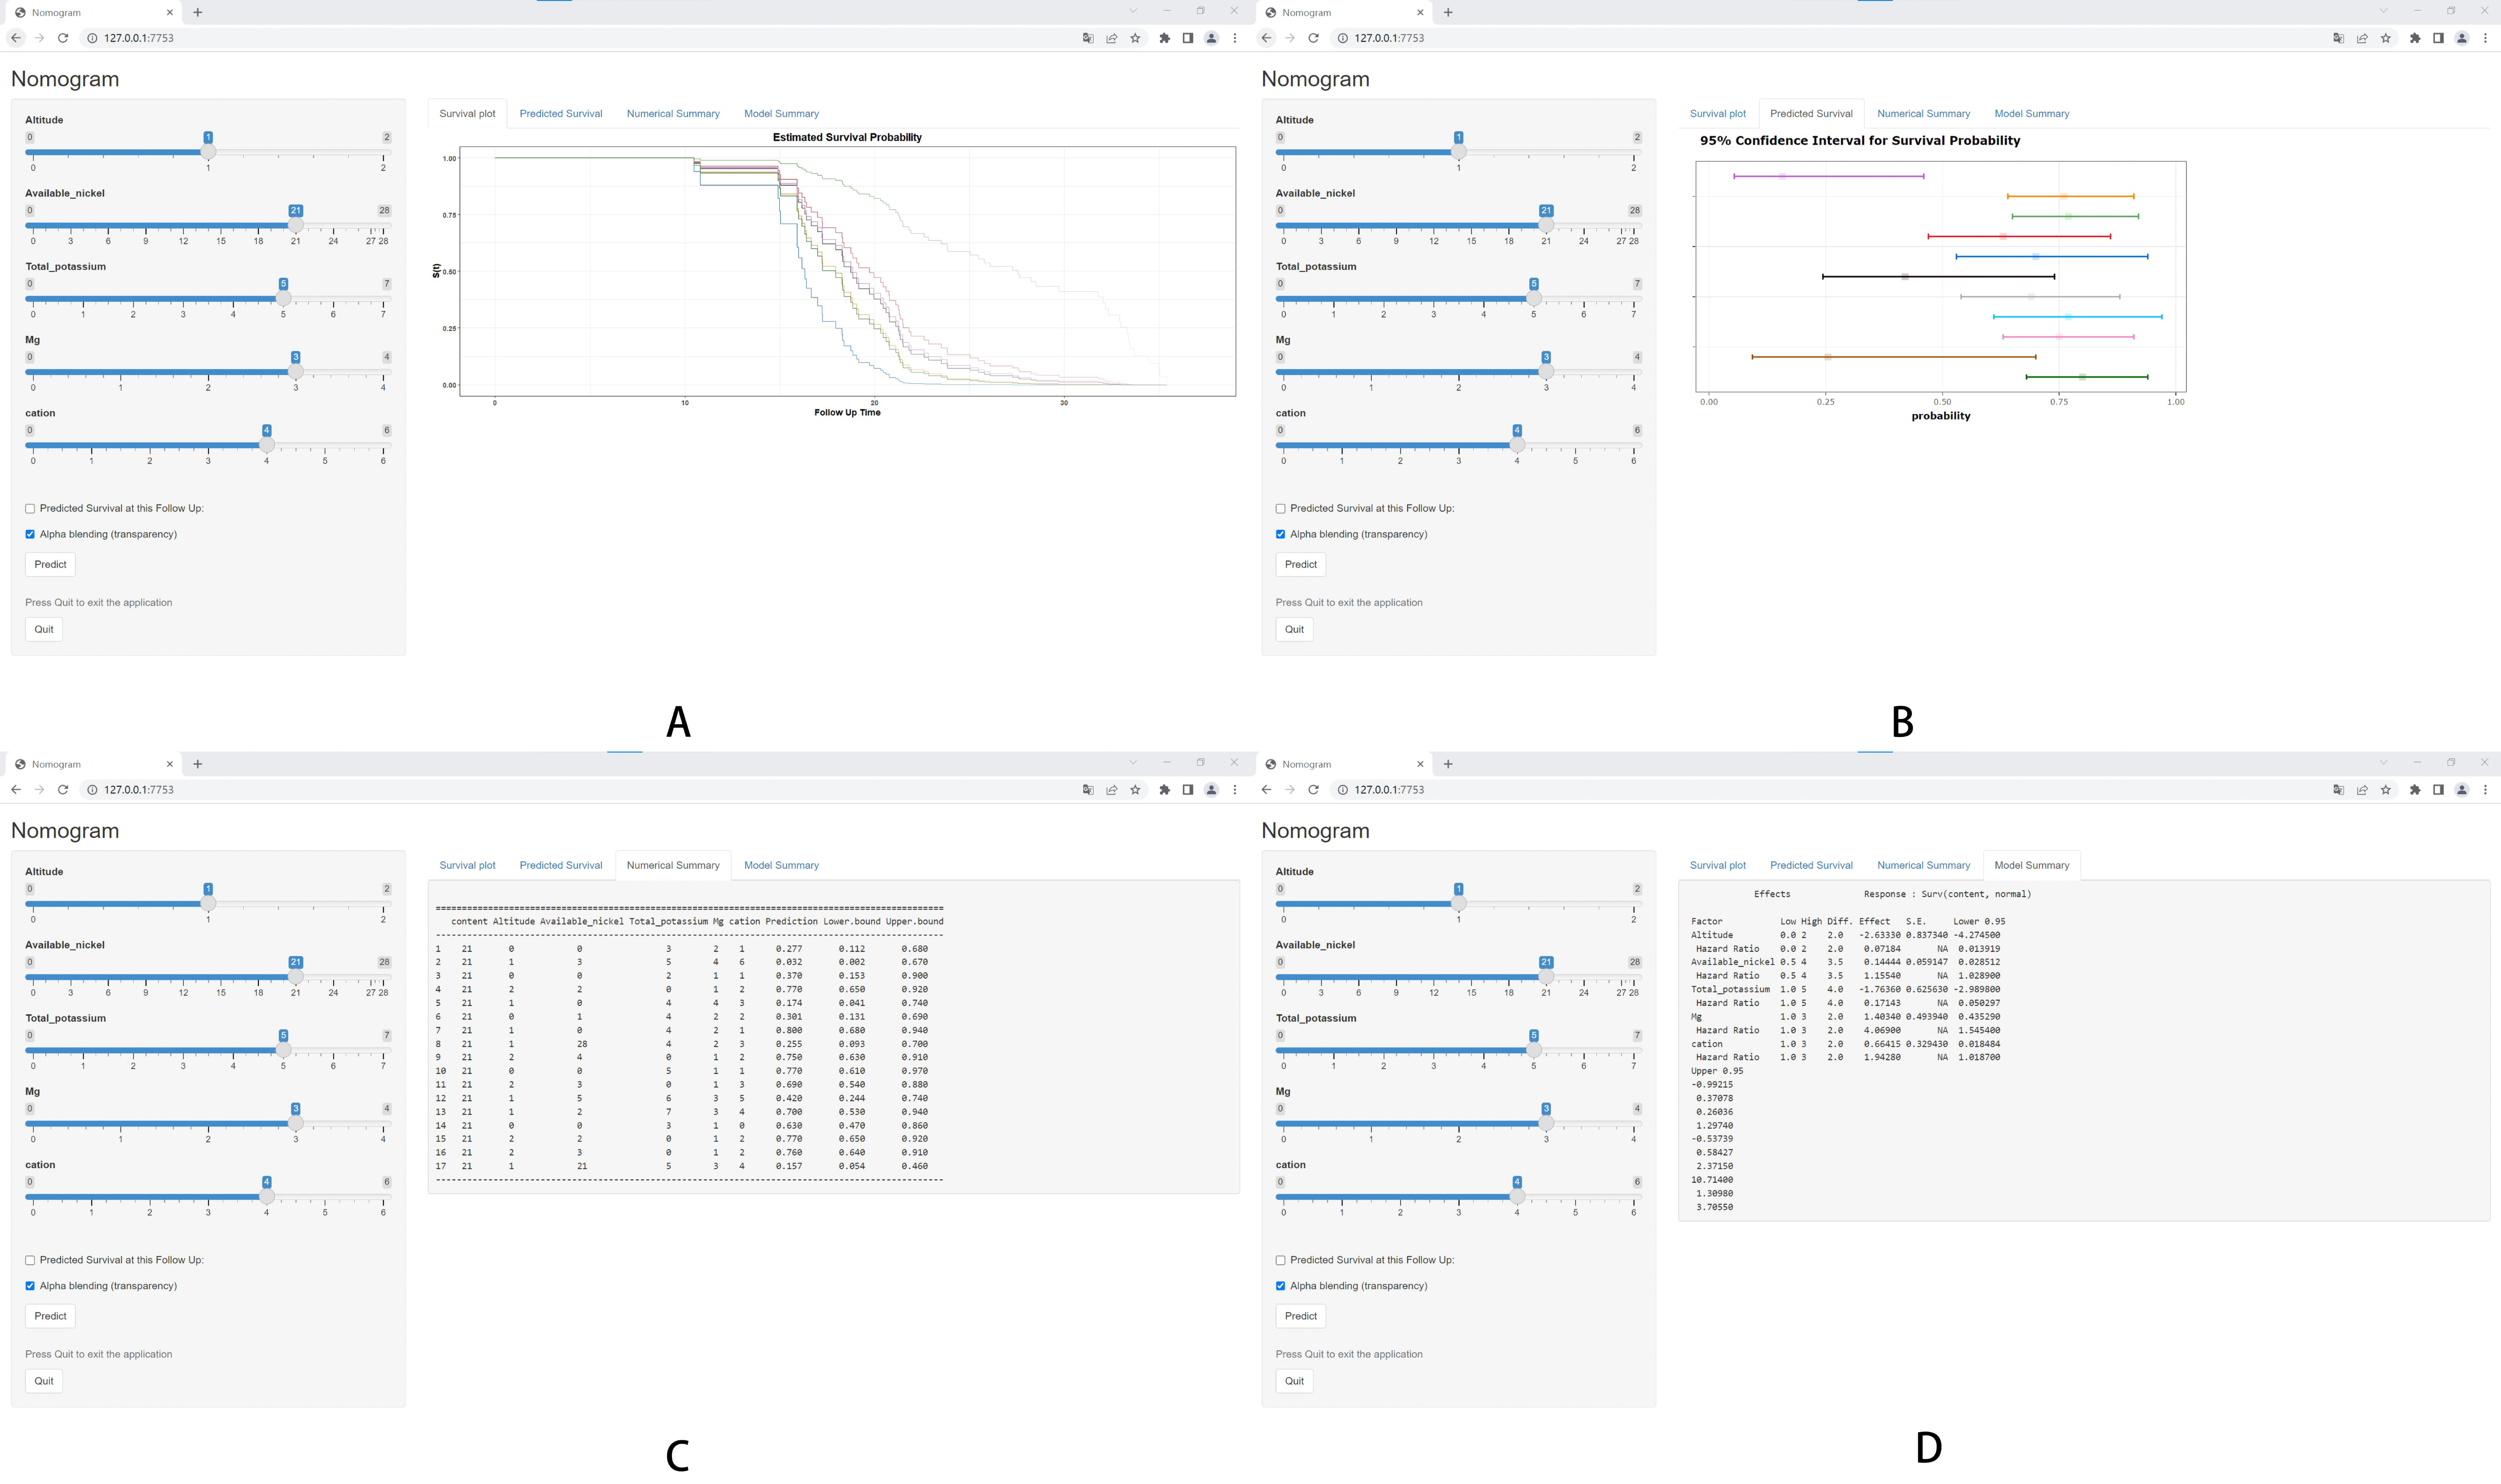
3.5. System Construction and Model Testing

The nomogram model transforms the complex regression equation into a visual graph, thereby improving the readability of the model. However, in practical applications, the efficiency of the calculation of EGCG content in tea by relying solely on the nomogram model is low. In response to this problem, a sophisticated visualization system was developed based on a nomogram model to efficiently and accurately calculate and predict the EGCG content in tea in this study. The developed system (Figure 5) mainly includes five modules: information input, survival plot, predicted survival, numerical summary, and model summary. The information input module is used to input the values of five factors, namely, altitude, available nickel, total potassium, magnesium, and cations, and make a prediction through the prediction button. The prediction survival module is capable of visually displaying the final prediction value as coordinates on a graph. When the mouse stops at a specific position, the chart displays relevant information about the altitude, available nickel, cations, Mg, total potassium, predicted value, and predicted range. The table can display up to 11 prediction results at the same time, and more prediction results cover the original prediction results.
The numerical summary module (Figure 5C) clearly shows all of the predicted detailed data, and the prediction results are displayed in the survival module. The model summary module (Figure 5B) contains all of the parameters of the construction of the nomogram model, which is also a core part of the system. The survival plot module (Figure 5A) visually presents the probability of predicting various EGCG content based on different abiotic stress conditions using curves. Each curve represents the predicted range of EGCG content under different environmental conditions, indicated by different colors. As shown in the following figure, when the content range of EGCG predicted under different abiotic stress conditions was the same, there were also some differences in the content prediction curve generated by the survival plot module. As the prediction probability decreased, the color of the curve gradually faded. Tea garden managers can select tea-planting sites more accurately by comparing these content prediction curves.
In the process of using the system (Figure 4D), the user can directly input the values of altitude, available nickel, cations, Mg, and total potassium into the information input module, and after clicking the forecast button, three values are obtained: the prediction, lower bound, and upper bound. In case the predicted value exceeds 0.8, it can be deduced that the EGCG content surpasses 30%, aligning with the original nomogram model. When the prediction < 0.3, the content of EGCG is considered to be less than 20%. When the prediction is between 0.3 and 0.8, the content of EGCG is considered to be 20–30%. Based on the nomogram model, this study produced a relevant analysis system. When being used, the parameters of altitude, available nickel, cations, Mg, and total potassium can be directly input into the system. By clicking the predict button of the system, the input information is used to predict the corresponding tea polyphenol content. The prediction system can not only display the corresponding prediction curve directly on the probability diagram but also display the corresponding score value in the numerical summary interface. The altitude of the Yuecheng tea garden base in Xishuangbanna, Yunnan Province; the available nickel, cations, magnesium, and total potassium in tea garden soil; and the corresponding EGCG content in tea leaves were selected as validation parameters. A total of 16 sets of data were used for external validation of the model (Table 2). The final results show that 12 groups of prediction results were correct, 4 groups of experimental data were wrong, and the total accuracy rate reached 75%. This indicated that our model has high accuracy in predicting EGCG content.

4. Discussion

In this study, EGCG content in tea under different altitudes and soil components. We selected the Yuecheng base in Xishuangbanna Prefecture, Yunnan Province, for analysis. Using the LASSO-Cox regression model, five factors, altitude, available nickel, cations, Mg, and total potassium, were screened out from 22 variables, and a prediction model of EGCG content in tea in this area was constructed. Both the training set and validation set values in this model are greater than 0.7 [42], displaying good reliability. This study provides an innovative tool for the preliminary prediction of EGCG content in tea leaves through the altitude of tea tree growth and related effective soil components. The verification results of all aspects show that it has good prediction ability. In light of the limitations of the conventional nomogram model, this study aimed to develop a rapid and efficient prediction system for EGCG content. This system is designed to provide quick analysis and prediction, aligning with the principles of the nomogram model. The prediction system can not only quickly predict EGCG content, but also present the predicted value of the EGCG content in the form of coordinates and values in the system. In the survival plot, the predicted values corresponding to each sample are marked with different colors, and the experimental personnel can compare and analyze the predicted values of the EGCG content of multiple samples based on the survival plot. Next, users of the system can predict other tea contents through preliminary soil testing before planting and make preliminary predictions in combination with the altitude of planting. In this way, it is possible to comprehensively evaluate the quality of tea and ultimately determine whether it is suitable for tea planting.

5. Conclusions

By predicting the EGCG content in the soil, we can ensure that while reducing tea loss, we can select fresh leaves suitable for making finished tea and fresh leaves suitable for deep processing and extract EGCG from tea as raw materials for drug research and development [43]. This not only ensures tea quality but also improves tea utilization. Furthermore, tea quality can also be affected by tea varieties [44]. Therefore, in a later stage. We will further research tea varieties to predict their quality under diverse abiotic stress conditions. This will provide a scientific theoretical basis for tea planting and processing. The study also laid a solid foundation for further research and prediction of tea yield and quality changes under abiotic stress conditions and provided a certain theoretical scientific basis.

Author Contributions

Conceptualization, writing—original draft preparation, B.W. and C.Y.; methodology, S.Z. and. Y.W. (Yamin Wu); software, X.D. and J.G.; formal analysis, J.H. and Z.F.; investigation, Y.X., L.L. and Q.G.; conceptualization, writing—review and editing, funding acquisition, W.Y. and Y.W. (Yuefei Wang). All authors have read and agreed to the published version of the manuscript.

Funding

This research was funded by the Integration and Demonstration of Key Technologies for Improving Quality and Efficiency of the Tea Industry in Luchun County under the National Key R&D Project (2022YFD1601803), the Development and demonstration of intelligent agricultural data sensing technology and equipment in plateau mountainous areas (202302AE09002001), the study on the screening mechanism of phenotypic plasticity characteristics of large-leaf tea plants in Yunnan driven by AI based on data fusion (202301AS070083), the Yunnan Menghai County Smart Tea Industry Science and Technology Mission (202304Bl090013), and the National Natural Science Foundation (32060702).

Data Availability Statement

Our data has been compressed and sent to the editorial department.

Conflicts of Interest

The authors declare no conflict of interest.

References

  1. Xie, J.; Yu, H.; Song, S.; Fang, C.; Wang, X.; Bai, Z.; Sheng, J. Pu-erh Tea Water Extract Mediates Cell Cycle Arrest and Apoptosis in MDA-MB-231 Human Breast Cancer Cells. Front. Pharmacol. 2017, 8, 190. [Google Scholar] [CrossRef] [PubMed]
  2. Zhao, X.; Song, J.L.; Kim, J.D.; Lee, J.S.; Park, K.Y. Fermented Pu-erh tea increases in vitro anticancer activities in HT-29 cells and has antiangiogenetic effects on HUVECs. J. Environ. Pathol. Toxicol. Oncol. 2013, 32, 275–288. [Google Scholar] [CrossRef] [PubMed]
  3. Ding, Q.; Zheng, W.; Zhang, B.; Chen, X.; Zhang, J.; Pang, X.; Ma, B. Comparison of hypoglycemic effects of ripened pu-erh tea and raw pu-erh tea in streptozotocin-induced diabetic rats. RSC Adv. 2019, 9, 2967–2977. [Google Scholar] [CrossRef] [PubMed]
  4. Yamashita, Y.; Wang, L.; Tinshun, Z.; Nakamura, T.; Ashida, H. Fermented Tea Improves Glucose Intolerance in Mice by Enhancing Translocation of Glucose Transporter 4 in Skeletal Muscle. J. Agric. Food Chem. 2012, 60, 11366–11371. [Google Scholar] [CrossRef] [PubMed]
  5. Jiang, C.; Zeng, Z.; Huang, Y.; Zhang, X. Chemical compositions of Pu’er tea fermented by Eurotium Cristatum and their lipid-lowering activity. LWT 2018, 98, 204–211. [Google Scholar] [CrossRef]
  6. Ni, Y.; Zhao, L.; Yu, H.; Ma, X.; Bao, Y.; Rajani, C.; Jia, W. Circulating Unsaturated Fatty Acids Delineate the Metabolic Status of Obese Individuals. Ebiomedicine 2015, 2, 1513–1522. [Google Scholar] [CrossRef]
  7. Lv, H.P.; Zhu, Y.; Tan, J.F.; Guo, L.; Dai, W.D.; Lin, Z. Bioactive compounds from Pu-erh tea with therapy for hyperlipidaemia. J. Funct. Foods 2015, 19, 194–203. [Google Scholar] [CrossRef]
  8. Zeng, L.; Yan, J.; Luo, L.; Zhang, D. Effects of Pu-erh tea aqueous extract (PTAE) on blood lipid metabolism enzymes. Food Funct. 2015, 6, 2008–2016. [Google Scholar] [CrossRef]
  9. Vu, H.T.; Song, F.V.; Tian, K.V.; Su, H.; Chass, G.A. Systematic characterisation of the structure and radical scavenging potency of Pu’Er tea () polyphenol theaflavin. Org. Biomol. Chem. 2019, 17, 9942–9950. [Google Scholar] [CrossRef]
  10. Swen, W. Effects of green tea and EGCG on cardiovascular and metabolic health. J. Am. Coll. Nutr. 2007, 26, 373S–388S. [Google Scholar]
  11. Wei, R.; Wirkus, J.; Yang, Z.; Machuca, J.; Esparza, Y.; Mackenzie, G.G. EGCG sensitizes chemotherapeutic-induced cytotoxicity by targeting the ERK pathway in multiple cancer cell lines. Arch. Biochem. Biophys. 2020, 692, 108546. [Google Scholar] [CrossRef] [PubMed]
  12. La, X.; Zhang, L.; Li, Z.; Li, H.; Yang, Y. (-)-Epigallocatechin Gallate (EGCG) enhances the sensitivity of colorectal cancer cells to 5-FU by inhibiting GRP78/NF-κB/miR-155-5p/MDR1 pathway. J. Agric. Food Chem. 2019, 67, 2510–2518. [Google Scholar] [CrossRef] [PubMed]
  13. Li, F.; Hao, S.; Gao, J.; Jiang, P. EGCG Alleviates Obesity-Exacerbated Lung Cancer Progression by STAT1/SLC7A11 Pathway and Gut Microbiota. J. Nutr. Biochem. 2023, 120, 109416. [Google Scholar] [CrossRef] [PubMed]
  14. Wang, T.; Xu, H.; Wu, S.; Guo, Y.; Zhao, G.; Wang, D. Mechanisms Underlying the Effects of the Green Tea Polyphenol EGCG in Sarcopenia Prevention and Management. J. Agric. Food Chem. 2023, 71, 9609–9627. [Google Scholar] [CrossRef] [PubMed]
  15. Betts, J.W.; Hornsey, M.; Higgins, P.G.; Lucassen, K.; Wille, J.; Salguero, F.J.; La Ragione, R.M. Restoring the activity of the antibiotic aztreonam using the polyphenol epigallocatechin gallate (EGCG) against multidrug-resistant clinical isolates of Pseudomonas aeruginosa. J. Med. Microbiol. 2019, 68, 1552–1559. [Google Scholar] [CrossRef]
  16. Mao, S.; Ren, Y.; Wei, C.; Chen, S.; Ye, X.; Jinhu, T. Development of novel EGCG/Fe loaded sodium alginate-based packaging films with antibacterial and slow-release properties. Food Hydrocoll. 2023, 145, 109032. [Google Scholar] [CrossRef]
  17. Zhang, S.; Yang, C.; Sheng, Y.; Liu, X.; Yuan, W.; Deng, X.; Wang, B. A Nomogram Model for Predicting the Polyphenol Content of Pu-Erh Tea. Foods 2023, 12, 2128. [Google Scholar] [CrossRef]
  18. Xie, D.; Dai, W.; Lu, M.; Tan, J.; Zhang, Y.; Chen, M.; Lin, Z. Nontargeted metabolomics predicts the storage duration of white teas with 8-C N-ethyl-2-pyrrolidinone-substituted flavan-3-ols as marker compounds. Food Res. Int. 2019, 125, 108635. [Google Scholar] [CrossRef]
  19. Yang, L.; Li, X.M.; Zhang, M.N.; Yao, J.; Song, B. Nomogram Models for Distinguishing Intraductal Carcinoma of the Prostate from Prostatic Acinar Adenocarcinoma Based on Multiparametric Magnetic Resonance Imaging. Korean J. Radiol. 2023, 24, 668–680. [Google Scholar] [CrossRef]
  20. Peiyuan, G.; Ganlin, G.; Xu, Y.; Zining, L.; Jiachao, H.; Bin, Y.; Guiying, W. Construction and validation of a nomogram model for predicting the overall survival of colorectal cancer patients. BMC Surg. 2023, 23, 182. [Google Scholar] [CrossRef]
  21. Wu, X.; Tang, F.; Li, H.; Chen, C.; Zhang, H.; Liu, X.; Ye, Z. Development and validation of a nomogram model for medication non-adherence in patients with chronic kidney disease. J. Psychosom. Res. 2023, 171, 111385. [Google Scholar] [CrossRef] [PubMed]
  22. Li, Z.; Xie, B.C.; Lyu, P.J.; Wang, H.X.; Li, Y.; Wang, C.H.; Yu, P. Clinical value of nomogram model in evaluating the prognosis of cholangiocarcinoma after interventional therapy. Zhonghua Yi Xue Za Zhi 2023, 103, 1217–1224. [Google Scholar] [PubMed]
  23. Shen, Y.; Xiong, Y.; Cao, Q.; Li, Y.; Xiang, W.; Wang, L.; Hong, D. Construction and validation of a nomogram model to predict symptomatic intracranial hemorrhage after intravenous thrombolysis in severe white matter lesions. J. Thromb. Thrombolysis 2023, 56, 111–120. [Google Scholar] [CrossRef] [PubMed]
  24. Zhang, S.; Liu, S.; Li, H.; Luo, L.; Zeng, L. Identification of the key phytochemical components responsible for sensory characteristics of Hunan fuzhuan brick tea. J. Food Compos. Anal. 2023, 120, 10589. [Google Scholar] [CrossRef]
  25. Wang, M.; Cui, X.; Li, S.; Yang, X.; Ma, A.; Zhang, Y.; Yu, B. DeepMal: Accurate prediction of protein malonylation sites by deep neural networks. Chemom. Intell. Lab. Syst. 2020, 207, 104175. [Google Scholar] [CrossRef]
  26. Brester, C.; Voutilainen, A.; Tuomainen, T.P.; Kauhanen, J.; Kolehmainen, M. Epidemiological predictive modeling: Lessons learned from the Kuopio Ischemic Heart Disease Risk Factor Study. Ann. Epidemiol. 2022, 70, 1–8. [Google Scholar] [CrossRef]
  27. Farvahari, A.; Gozashti, M.H.; Dehesh, T. The Usage of Lasso, Ridge, and Linear Regression to Explore the Most Influential Metabolic Variables that Affect Fasting Blood Sugar in Type 2 Diabetes Patients. Rom. J. Diabetes Nutr. Metab. Dis. 2019, 26, 371–379. [Google Scholar]
  28. Hadi, R.S.; Saeedeh, P.; Seyyed, M.T.A. Identifying the Prognosis Factors in Death after Liver Transplantation via Adaptive LASSO in Iran. J. Environ. Public Health 2016, 2016, 7620157. [Google Scholar]
  29. Cella, L.; Oh, J.H.; Deasy, J.O.; Palma, G.; Liuzzi, R.; D’avino, V.; Conson, M.; Picardi, M.; Salvatore, M.; Pacelli, R. Predicting radiation-induced valvular heart damage. Acta Oncol. 2015, 54, 1796–1804. [Google Scholar] [CrossRef]
  30. Jia, M.; Pi, J.; Zou, J.; Feng, M.; Chen, H.; Lin, C.; Yang, S.; Deng, Y.; Xiao, X. A Nomogram Model Based on Neuroendocrine Markers for Predicting the Prognosis of Neuroendocrine Carcinoma of Cervix. J. Clin. Med. 2023, 12, 1227. [Google Scholar] [CrossRef]
  31. Wei, Y.; Sun, P.; Chang, C.; Tong, Y. Ultrasound-based Nomogram for Predicting the Pathological Nodal Negativity of Unilateral Clinical N1a Papillary Thyroid Carcinoma in Adolescents and Young Adults. Acad. Radiol. 2023, 30, 2000–2009. [Google Scholar] [CrossRef] [PubMed]
  32. Wang, L.; Yan, D.; Shen, L.; Xie, Y.; Yan, S. Prognostic Value of a CT Radiomics-Based Nomogram for the Overall Survival of Patients with Nonmetastatic BCLC Stage C Hepatocellular Carcinoma after Stereotactic Body Radiotherapy. J. Oncol. 2023, 2023, 1554599. [Google Scholar] [CrossRef] [PubMed]
  33. Guo, Y.; Wu, J.; Wang, Y.; Jin, Y. Development and Validation of an Ultrasound-Based Radiomics Nomogram for Identifying HER2 Status in Patients with Breast Carcinoma. Diagnostics 2022, 12, 3130. [Google Scholar] [CrossRef] [PubMed]
  34. Rani, L.; Gogia, A.; Singh, V.; Kumar, L.; Sharma, A.; Kaur, G.; Gupta, R. Comparative assessment of prognostic models in chronic lymphocytic leukemia: Evaluation in Indian cohort. Ann. Hematol. 2018, 98, 437–443. [Google Scholar] [CrossRef]
  35. Zhou, Z.; Xie, X.; Hao, N.; Diao, D.; Song, Y.; Xia, P.; Dang, C.; Zhang, H. Different lymph node staging systems for patients with adenocarcinoma of esophagogastric junction. Curr. Med. Res. Opin. 2018, 34, 963–970. [Google Scholar] [CrossRef]
  36. Matthew, M.C.; Richa, A.; Dana, P.E. The value of vital sign trends for detecting clinical deterioration on the wards. Resuscitation 2016, 102, 1–5. [Google Scholar]
  37. Fan, M.; Zhang, P.; Wang, Y.; Peng, W.; Wang, S.; Gao, X.; Xu, M.; Li, L. Radiomic analysis of imaging heterogeneity in tumours and the surrounding parenchyma based on unsupervised decomposition of DCE-MRI for predicting molecular subtypes of breast cancer. Eur. Radiol. 2019, 29, 4456–4467. [Google Scholar] [CrossRef]
  38. Zhang, C.; Mao, M.; Guo, X.; Cui, P.; Zhang, L.; Xu, Y.; Li, L.; Han, X.; Peltzer, K.; Xiong, S.; et al. Nomogram based on homogeneous and heterogeneous associated factors for predicting bone metastases in patients with different histological types of lung cancer. BMC Cancer 2019, 19, 238. [Google Scholar] [CrossRef]
  39. Bianchi, L.; Schiavina, R.; Borghesi, M.; Bianchi, F.M.; Briganti, A.; Carini, M.; Terrone, C.; Mottrie, A.; Gacci, M.; Gontero, P.; et al. Evaluating the predictive accuracy and the clinical benefit of a nomogram aimed to predict survival in node-positive prostate cancer patients: External validation on a multi-institutional database. Int. J. Urol. 2018, 25, 574–581. [Google Scholar] [CrossRef]
  40. Feng, Z.; Lou, S.; Zhang, L.; Zhang, L.; Lan, W.; Wang, M.; Shen, Q.; Hu, Z.; Chen, F. New Preoperative Nomogram Using the Centrality Index to Predict High Nuclear Grade Clear Cell Renal Carcinoma. Cancer Manag. Res. 2019, 11, 10921–10928. [Google Scholar] [CrossRef]
  41. Yan, L.; Deng, W.; Guan, L.; Xu, H. Nomogram forecasting 3-, 5-, and 8-year overall survival and cancer-specific survival of gingival squamous cell carcinoma. Cancer Med. 2020, 9, 8266–8274. [Google Scholar] [CrossRef] [PubMed]
  42. Peng, K.; Wang, S.; Gao, L.; You, H. A nomogram incorporated lifestyle indicators for predicting nonalcoholic fatty liver disease. Medicine 2021, 100, e26415. [Google Scholar] [CrossRef] [PubMed]
  43. Chen, Q.; Zhao, J.; Guo, Z.; Wang, X. Determination of caffeine content and main catechins contents in green tea (Camellia sinensis L.) using taste sensor technique and multivariate calibration. J. Food Compos. Anal. 2010, 23, 353–358. [Google Scholar] [CrossRef]
  44. Liao, S.; Lin, J.; Liu, J.; Chen, T.; Xu, M.; Zheng, J. Chemoprevention of elite tea variety CFT-1 rich in EGCG against chemically induced liver cancer in rats. Food Sci. Nutr. 2019, 7, 2647–2665. [Google Scholar] [CrossRef]
Figure 1. Factor screening based on LASSO regression. (A) is the coefficient distribution in LASSO regression, and (B) is the cross-validation plot. In figure (A), different colored lines represent 22 influencing factors. In figure (B) the ordinate is the mean square error of the regression model, and the abscissa is the logarithm of the parameter lambda.
Agronomy 13 02475 g001
Figure 2. Nomogram for predicting EGCG content.
Agronomy 13 02475 g002
Figure 3. ROC curve analysis and calibration curve. (A,B) are ROC curve analysis diagrams. (A) is the training set and (B) is the validation set.
Agronomy 13 02475 g003
Figure 4. The calibration curve analysis. (A,C) are the training sets; (B,D) are the validation sets. In the diagrams in Figure, the red line are the actual calibration curve and the dotted lines are the ideal calibration curve.
Agronomy 13 02475 g004
Figure 5. The interface of each module of the system. (A) is the interface of the predicted survival module; (B) is the interface of the model summary module; (C) is the interface of the numerical summary module; (D) is the interface of the survival plot.
Agronomy 13 02475 g005
Table 1. Single-factor analysis results of EGCG content changes.
CharacteristicsHRCIpHazard
Ratio
95% CIp-Value
Alkaline hydrolysable Nitrogen1.270.57–1.10.164
Altitude1.460.5–0.940.0180.270.12–0.610.002
Arsenic1.270.67–0.930.005
Available cadmium1.010.96–1.020.347
Available chromium1.020.76–1.250.846
Available nickel0.961.01–1.070.0081.041.01–1.080.015
Available phosphorus0.970.78–1.340.845
Available potassium1.290.54–1.110.171
Cations0.81.04–1.480.0161.391.01–1.920.044
Cu0.920.8–1.480.594
Fluoride1.070.71–1.230.632
Lead0.91–1.240.042
Mercury1.650.32–1.150.125
Mg0.61.33–2.1102.021.24–3.270.004
Nickel1.990.33–0.760.001
Organic_matter1.110.82–0.980.018
PH1.010.87–1.140.936
Total_chromium1.050.8–1.140.578
Total_nitrogen1.240.66–0.990.036
Total_phosphorus1.150.68–1.120.283
Total_potassium0.861.05–1.30.0050.640.47–0.870.005
Zn1.020.79–1.240.898
p < 0.05. HR: hazard ratio, CI: confidence interval.
Table 2. Model test results.
EGCG (%)Altitude
(m)
Available Nickel (mg/kg)Total Potassium (mg/kg)Mg
(mg/kg)
Cations
(mg/kg)
GradeIs It Correct
15.0316000.0867.853.571.40.256
10.8116500.3459.95.186.10.02
19.0416000.0656.572.751.60.33
22.6117000.2624.722.342.10.76
18.2716500.0728.065.813.60.174
20.7616000.1128.213.682.10.278
32.9616500.0918.273.251.90.82
22.8316502.848.253.213.30.257
29.7117000.4114.662.722.40.74
23.8416000.069.892.591.10.78
33.6717000.3814.882.643.60.65
27.6316500.51510.84.845.30.42
23.8116500.27111.44.7650.73
21.3316000.0697.512.870.80.63
32.1517000.2814.72.172.60.75
14.9116502.119.944.584.80.157
Disclaimer/Publisher’s Note: The statements, opinions and data contained in all publications are solely those of the individual author(s) and contributor(s) and not of MDPI and/or the editor(s). MDPI and/or the editor(s) disclaim responsibility for any injury to people or property resulting from any ideas, methods, instructions or products referred to in the content.

