


Determination of the Most Efficient Forage Sorghum Irrigation Scheduling Strategies in the U.S. Central High Plains Using the AquaCrop Model and Field Experiments

Abstract
:1. Introduction
2. Materials and Methods
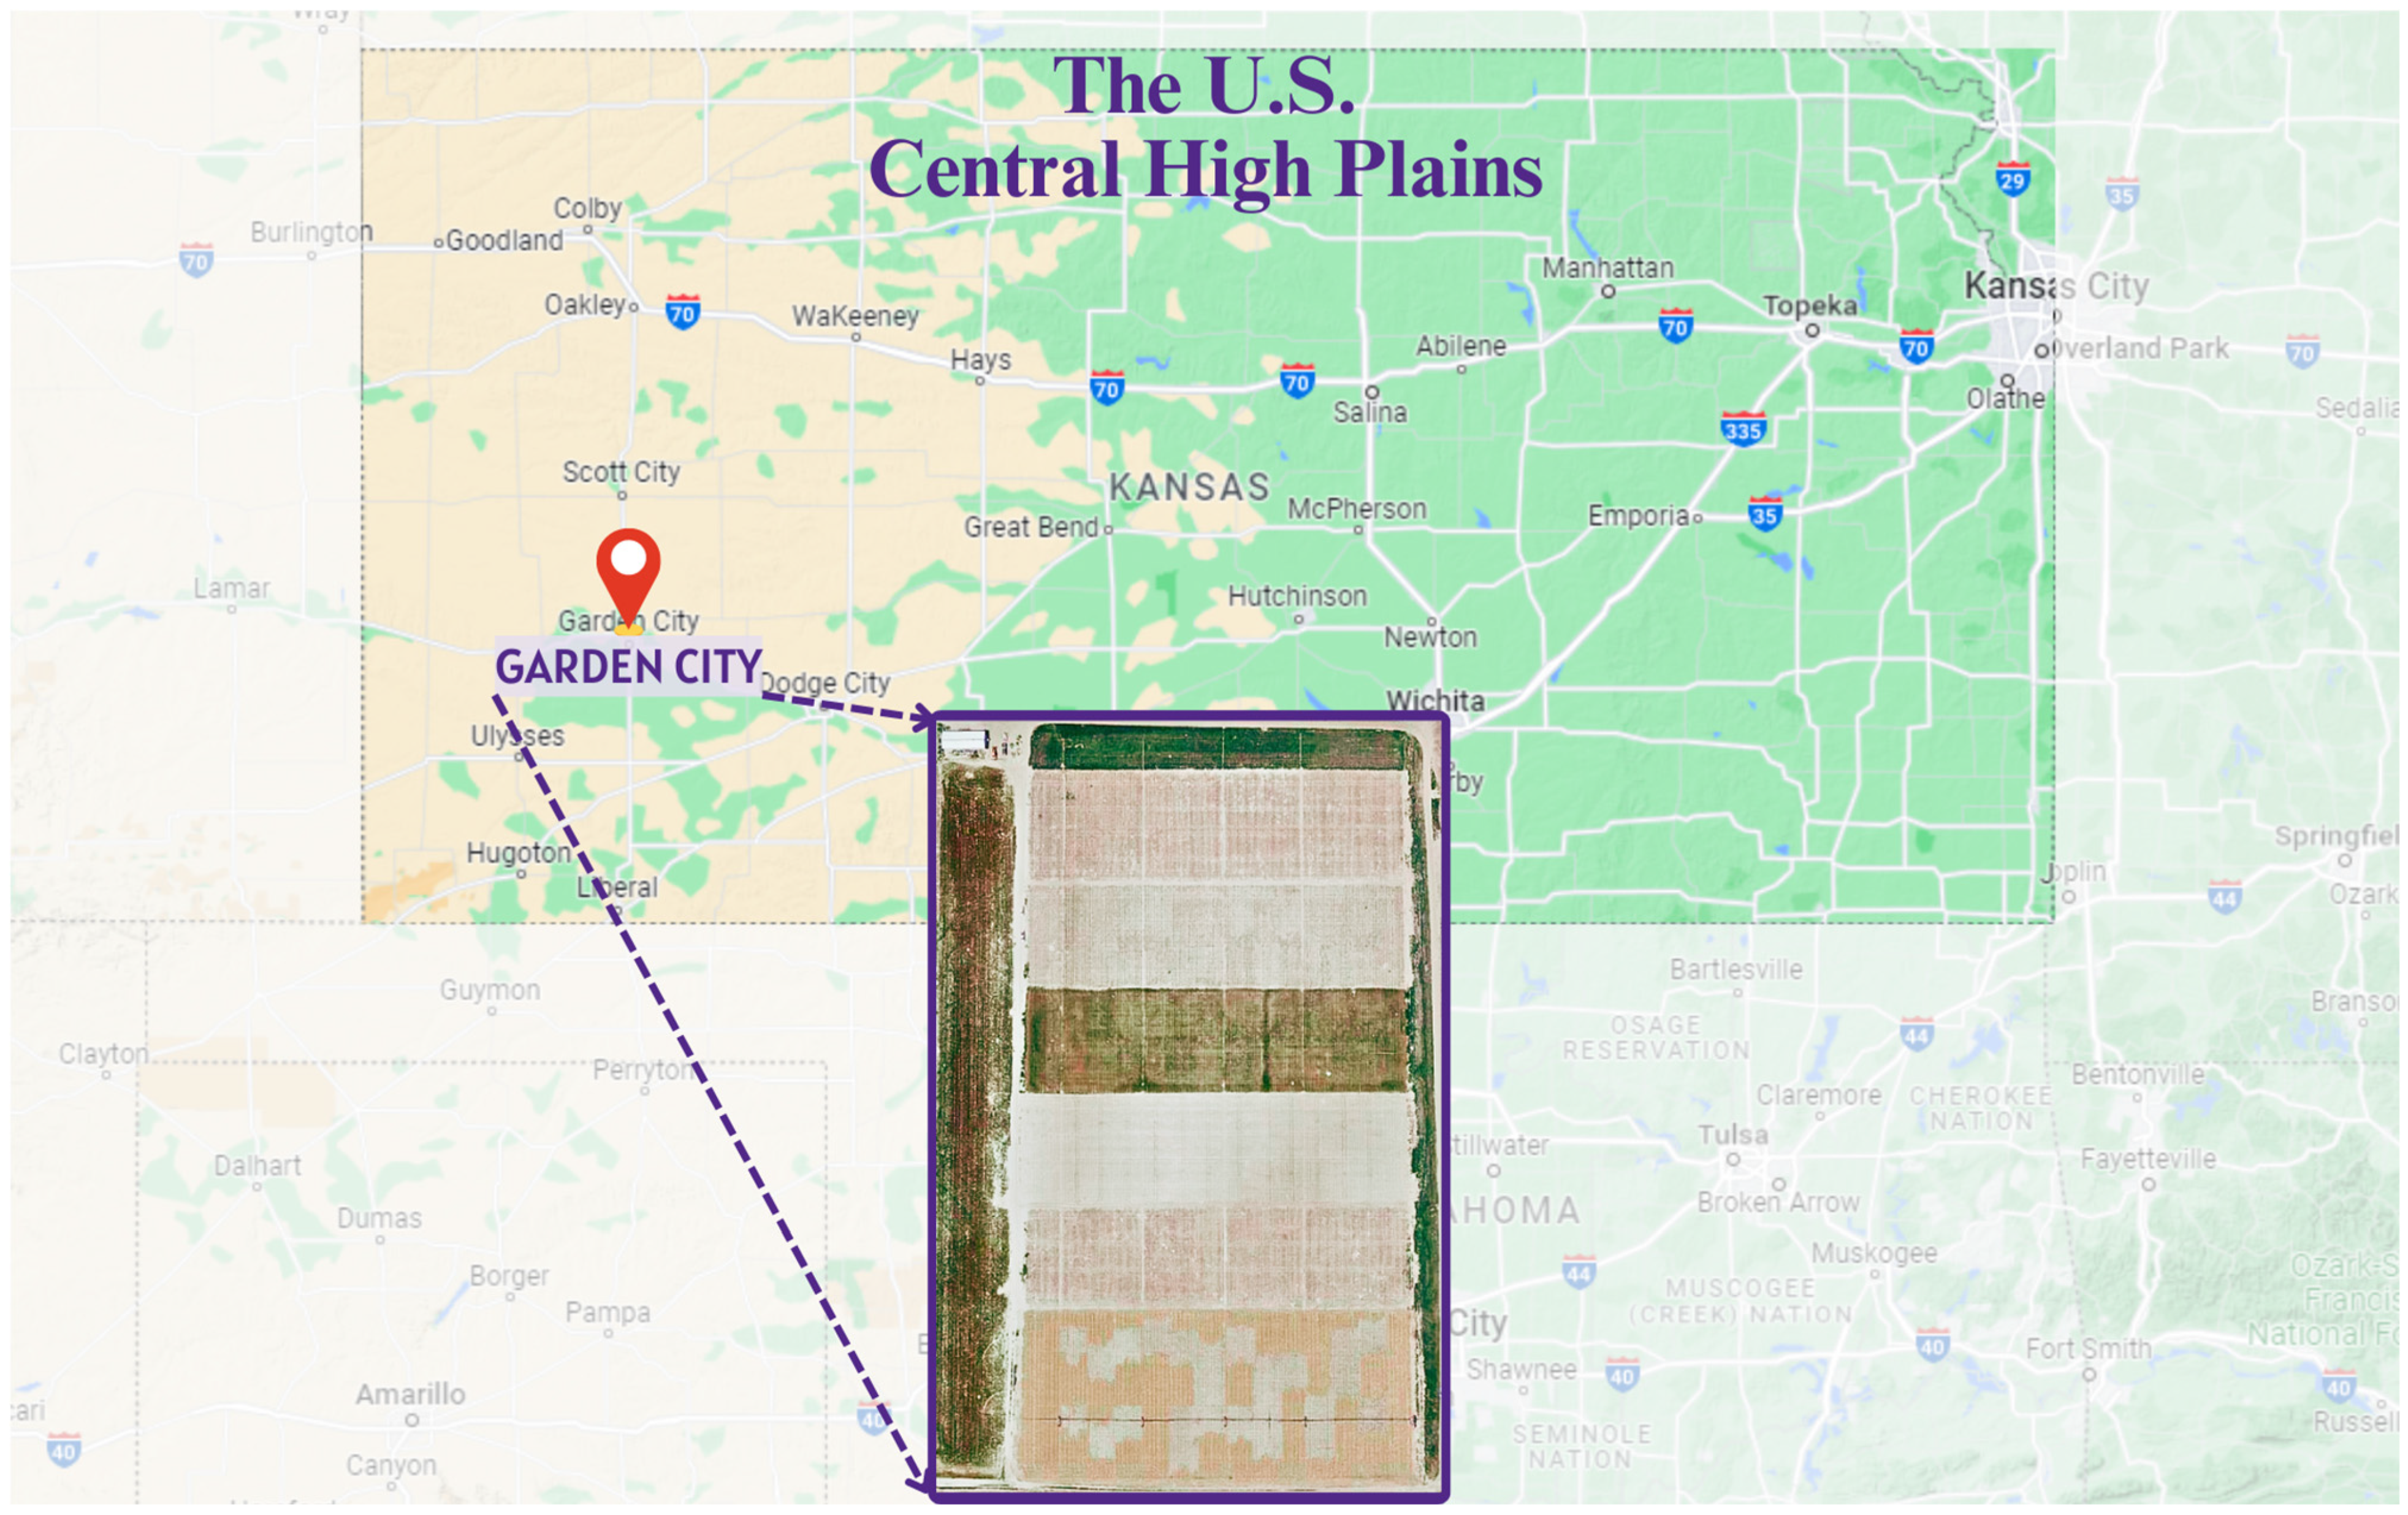
2.1. Site Description
2.2. Experimental Design and Treatments
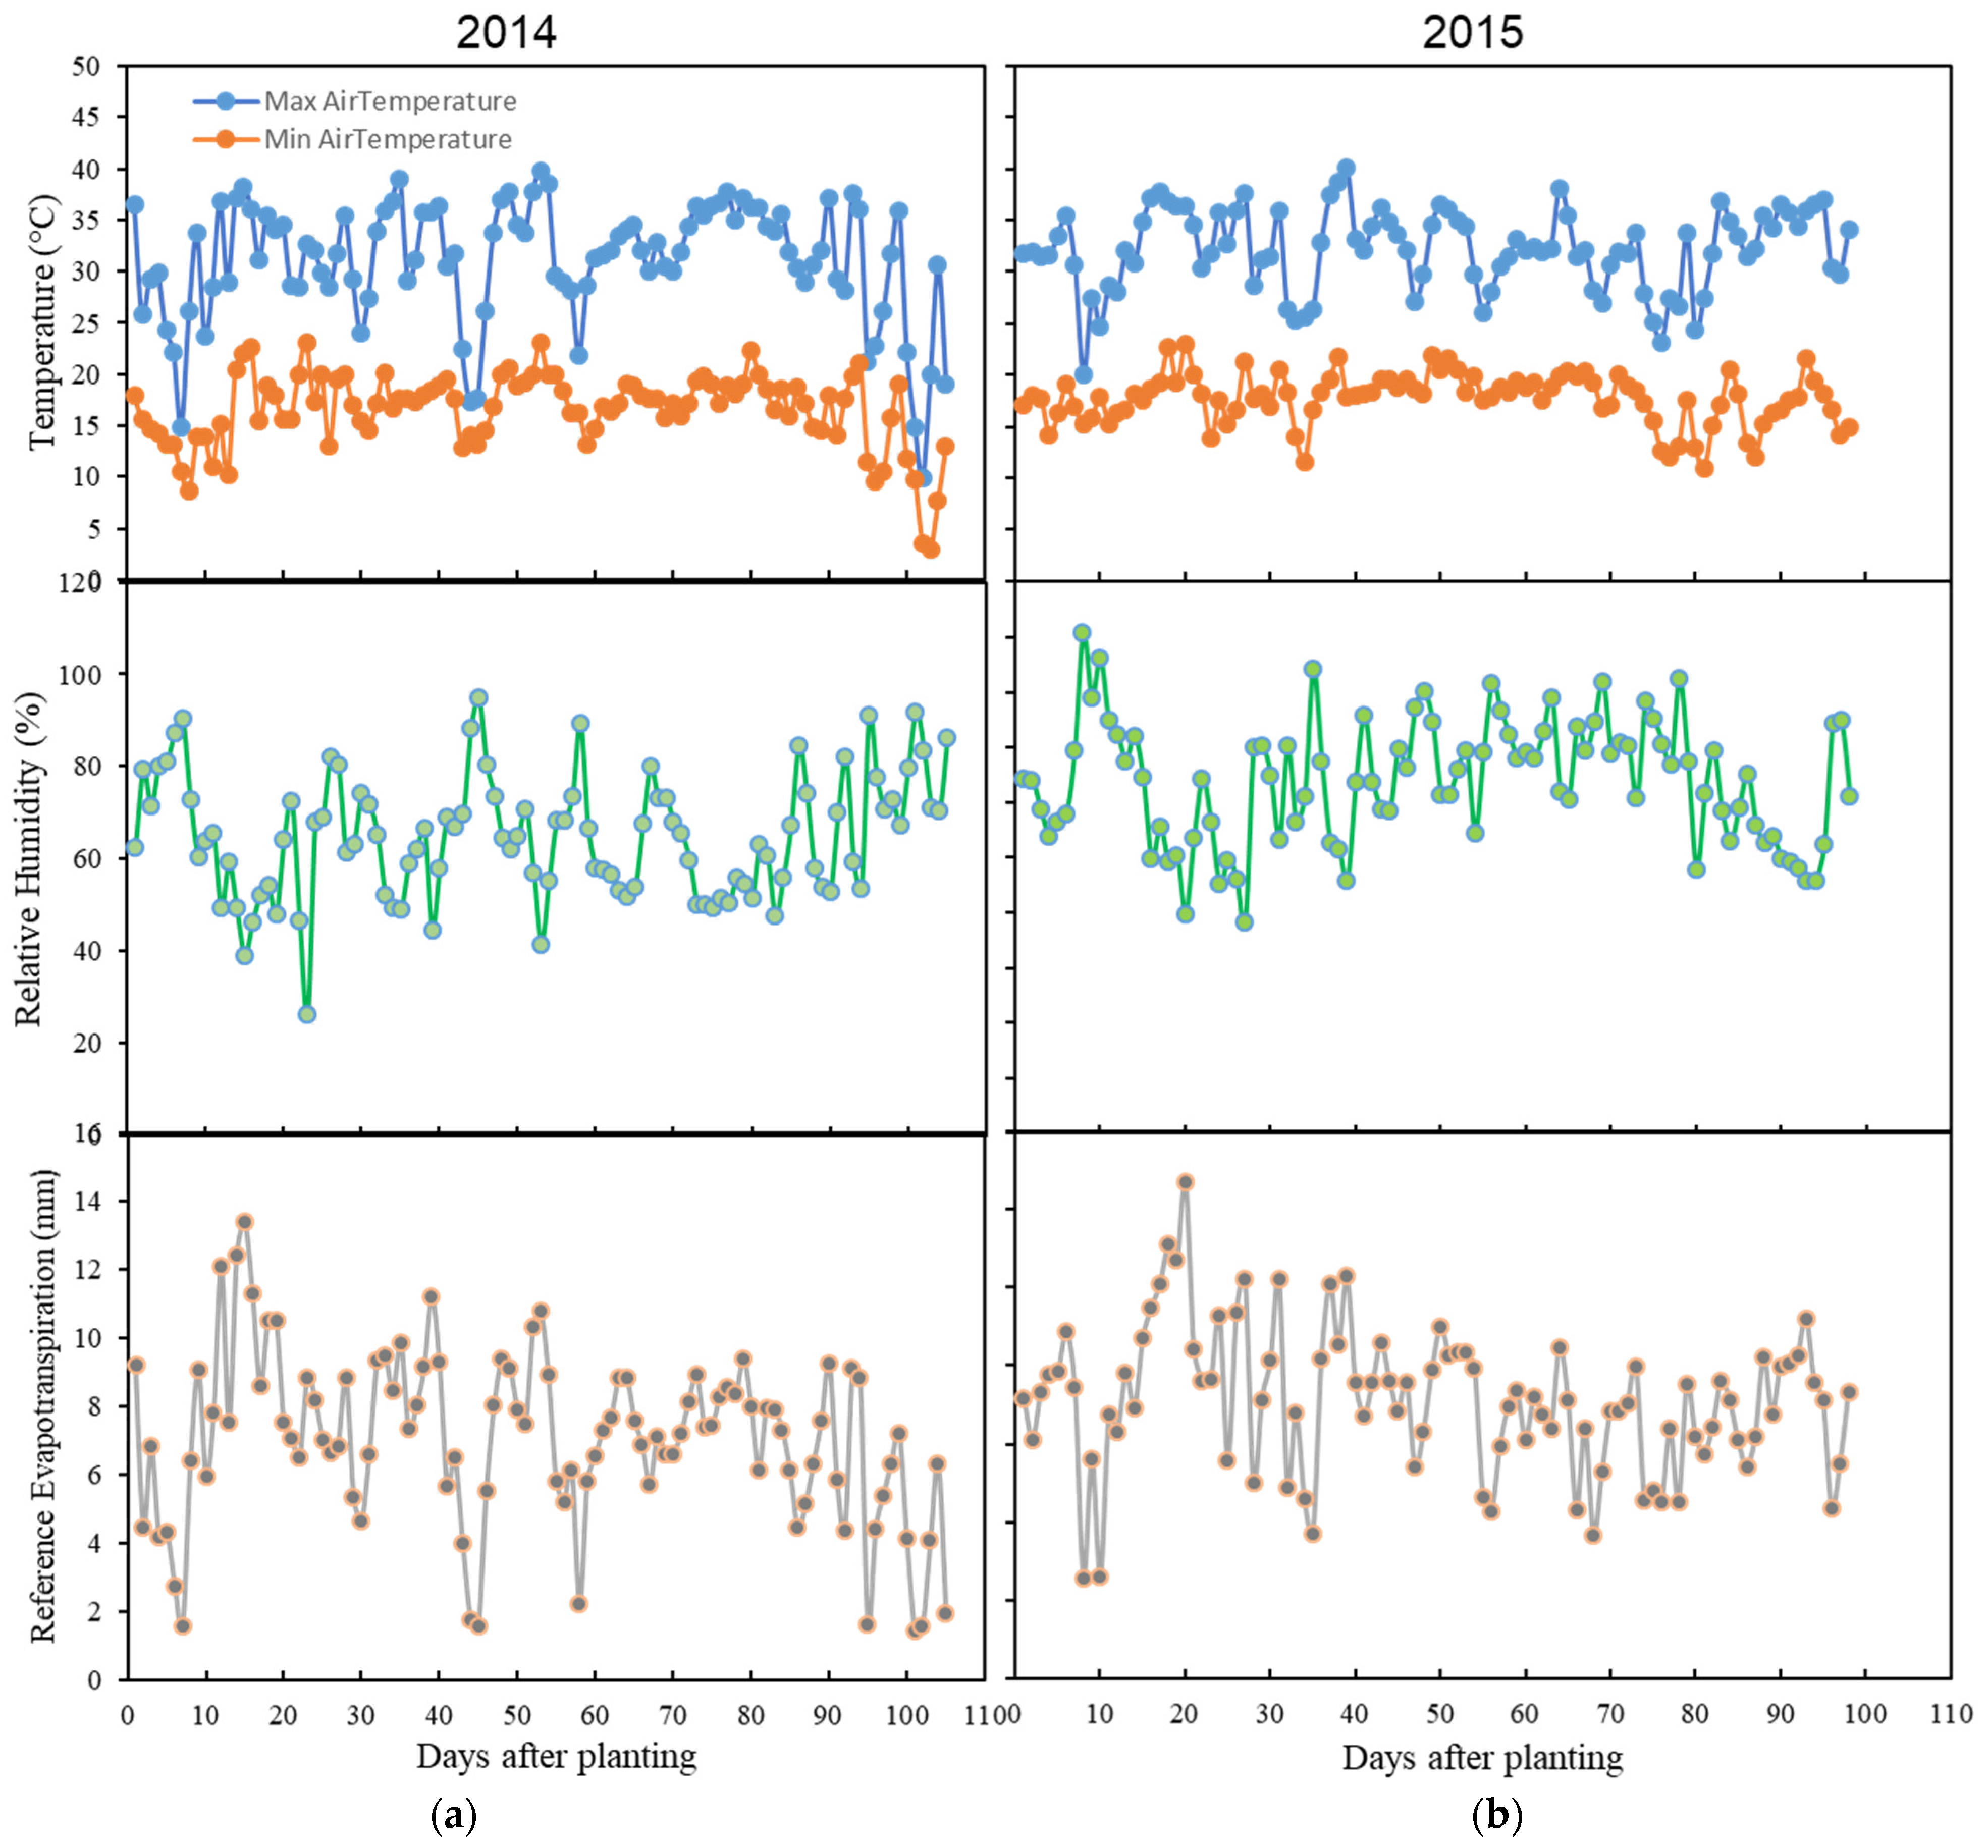
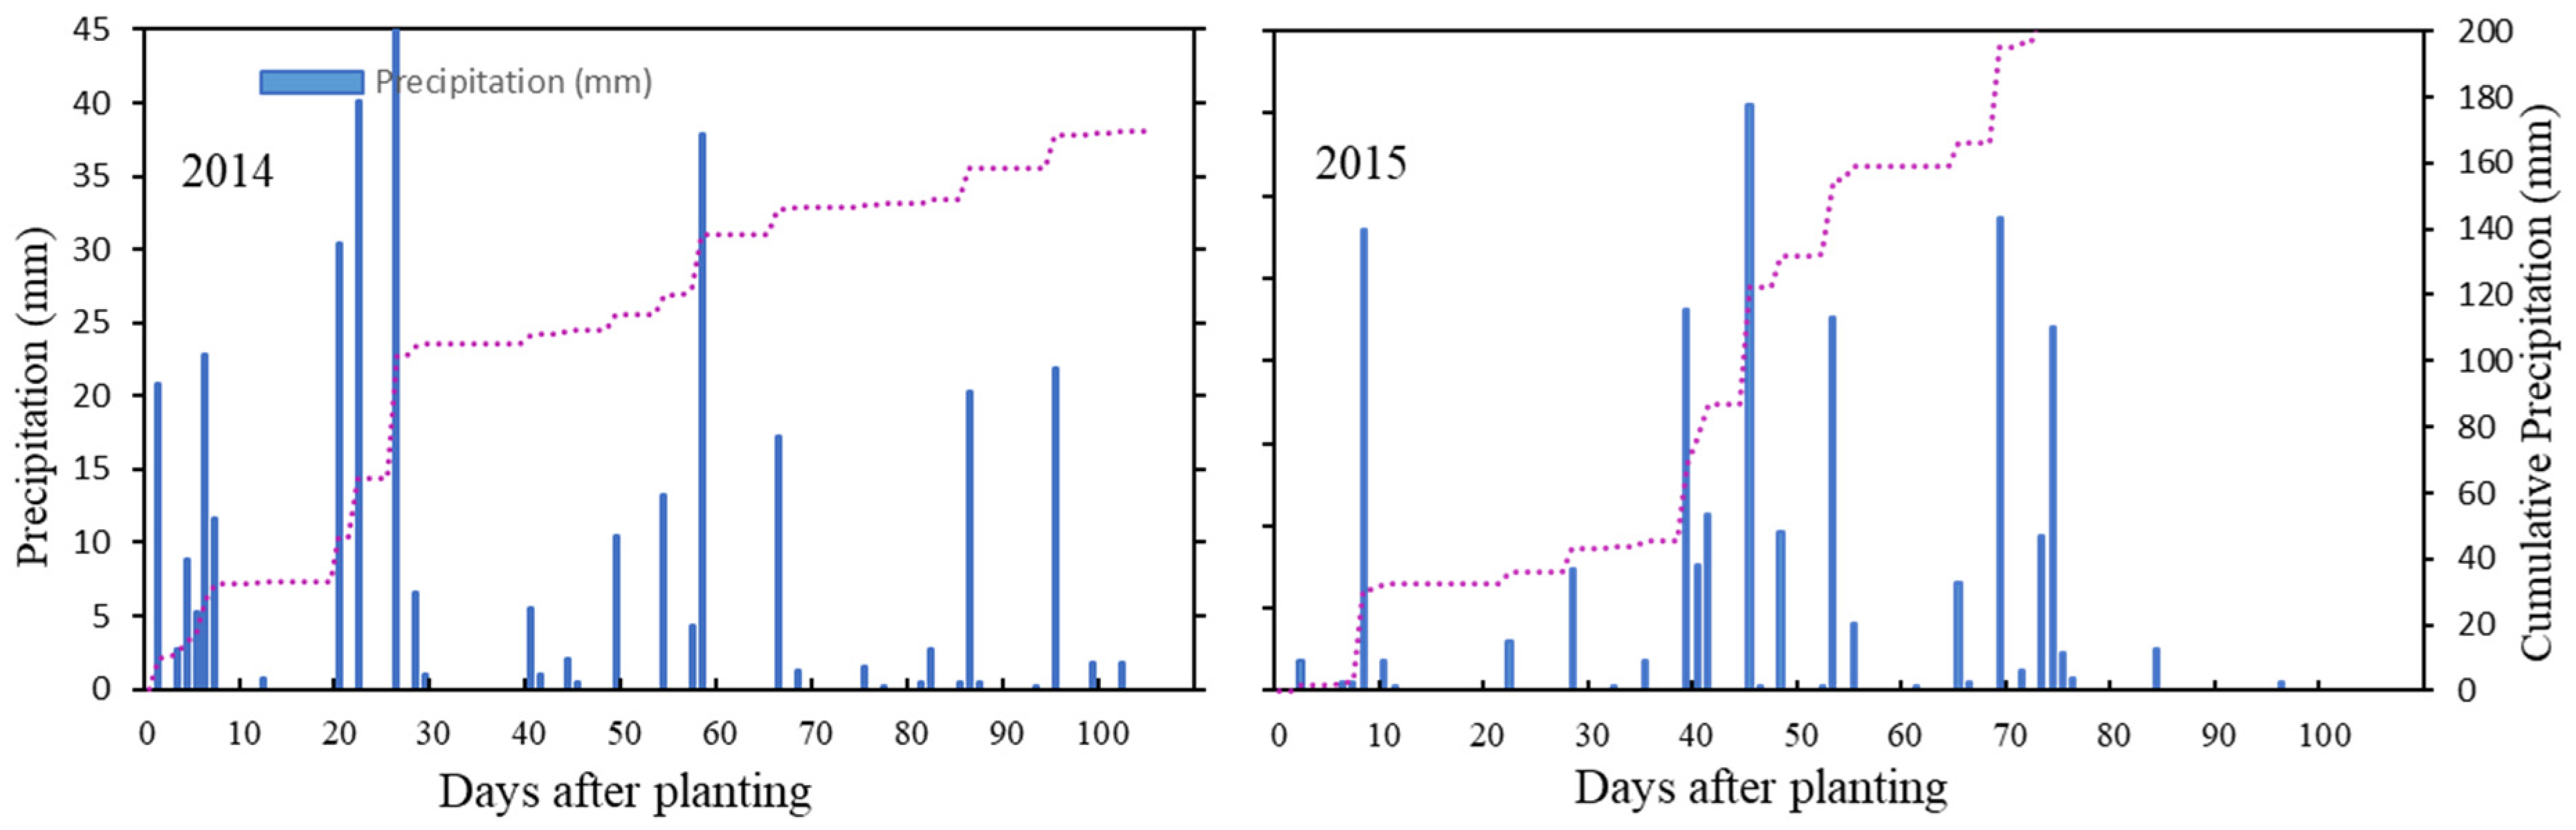
2.3. Data Acquisition and Management
2.4. AquaCrop Model
2.5. Model Calibration and Validation
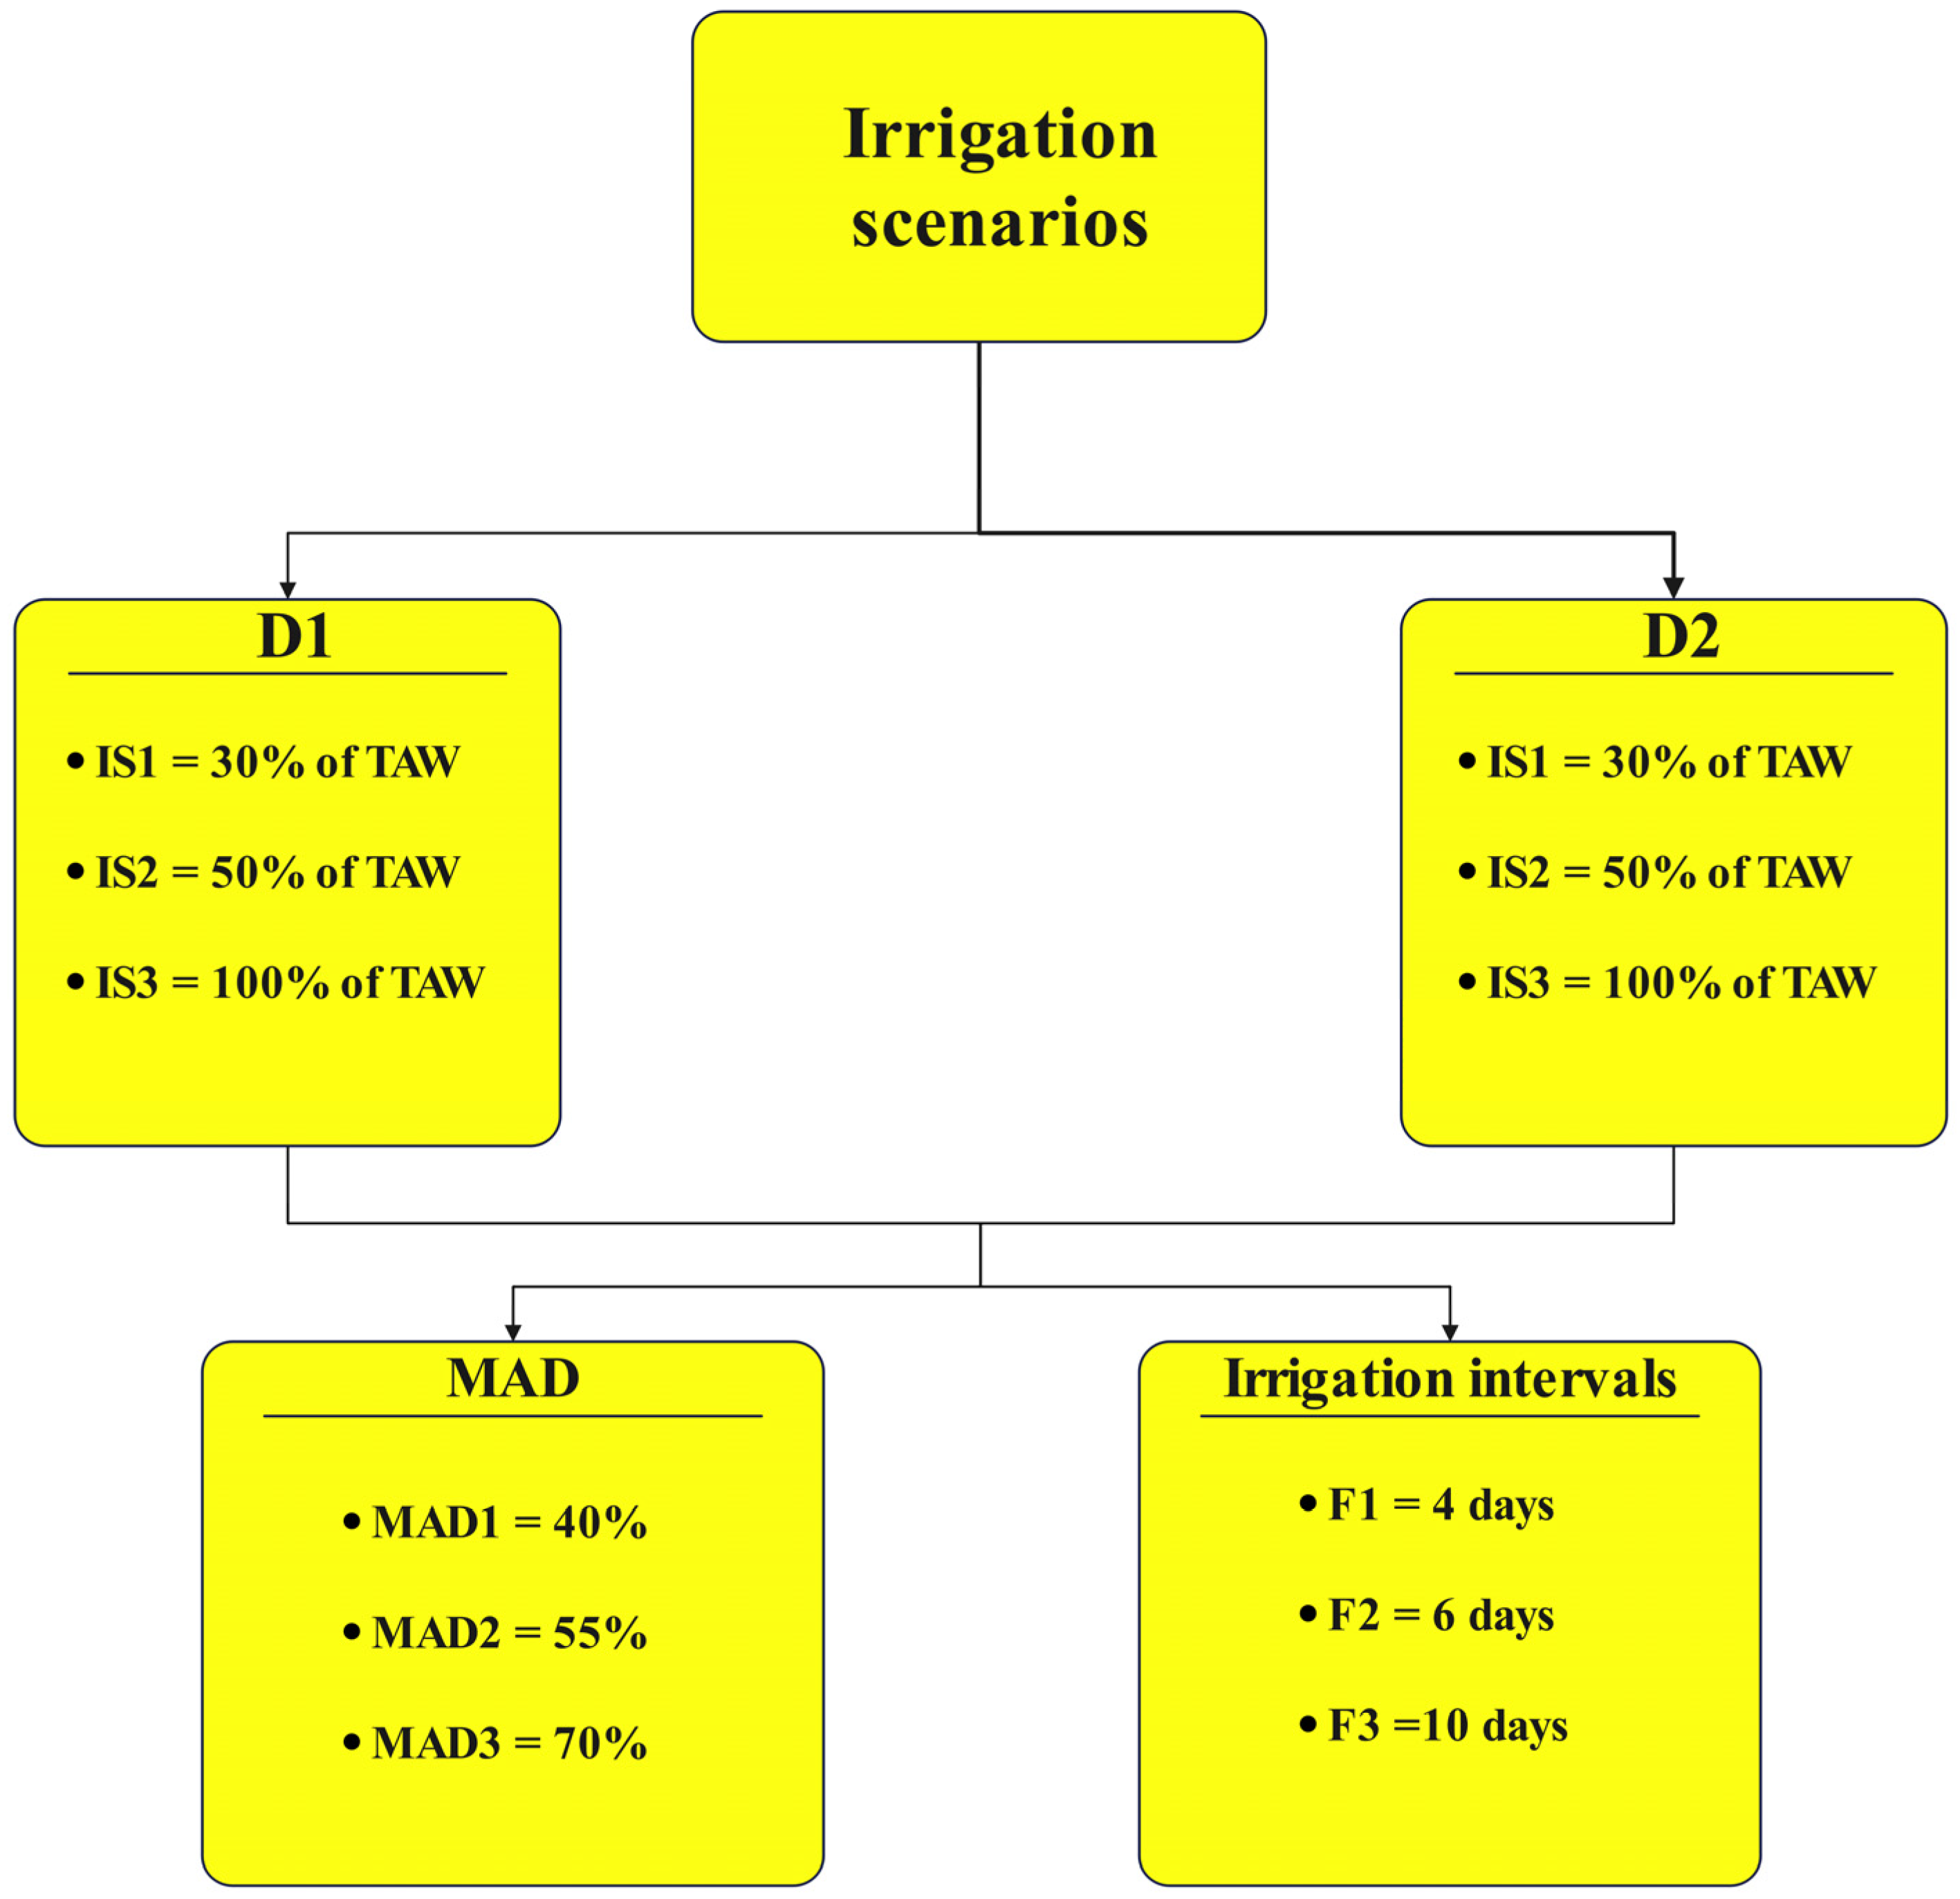
2.6. Exploring Conservational Irrigation Scheduling Strategies and Pre-Season Irrigation Scenarios by Using the AquaCrop Model
3. Results and Discussion
3.1. Parameterization
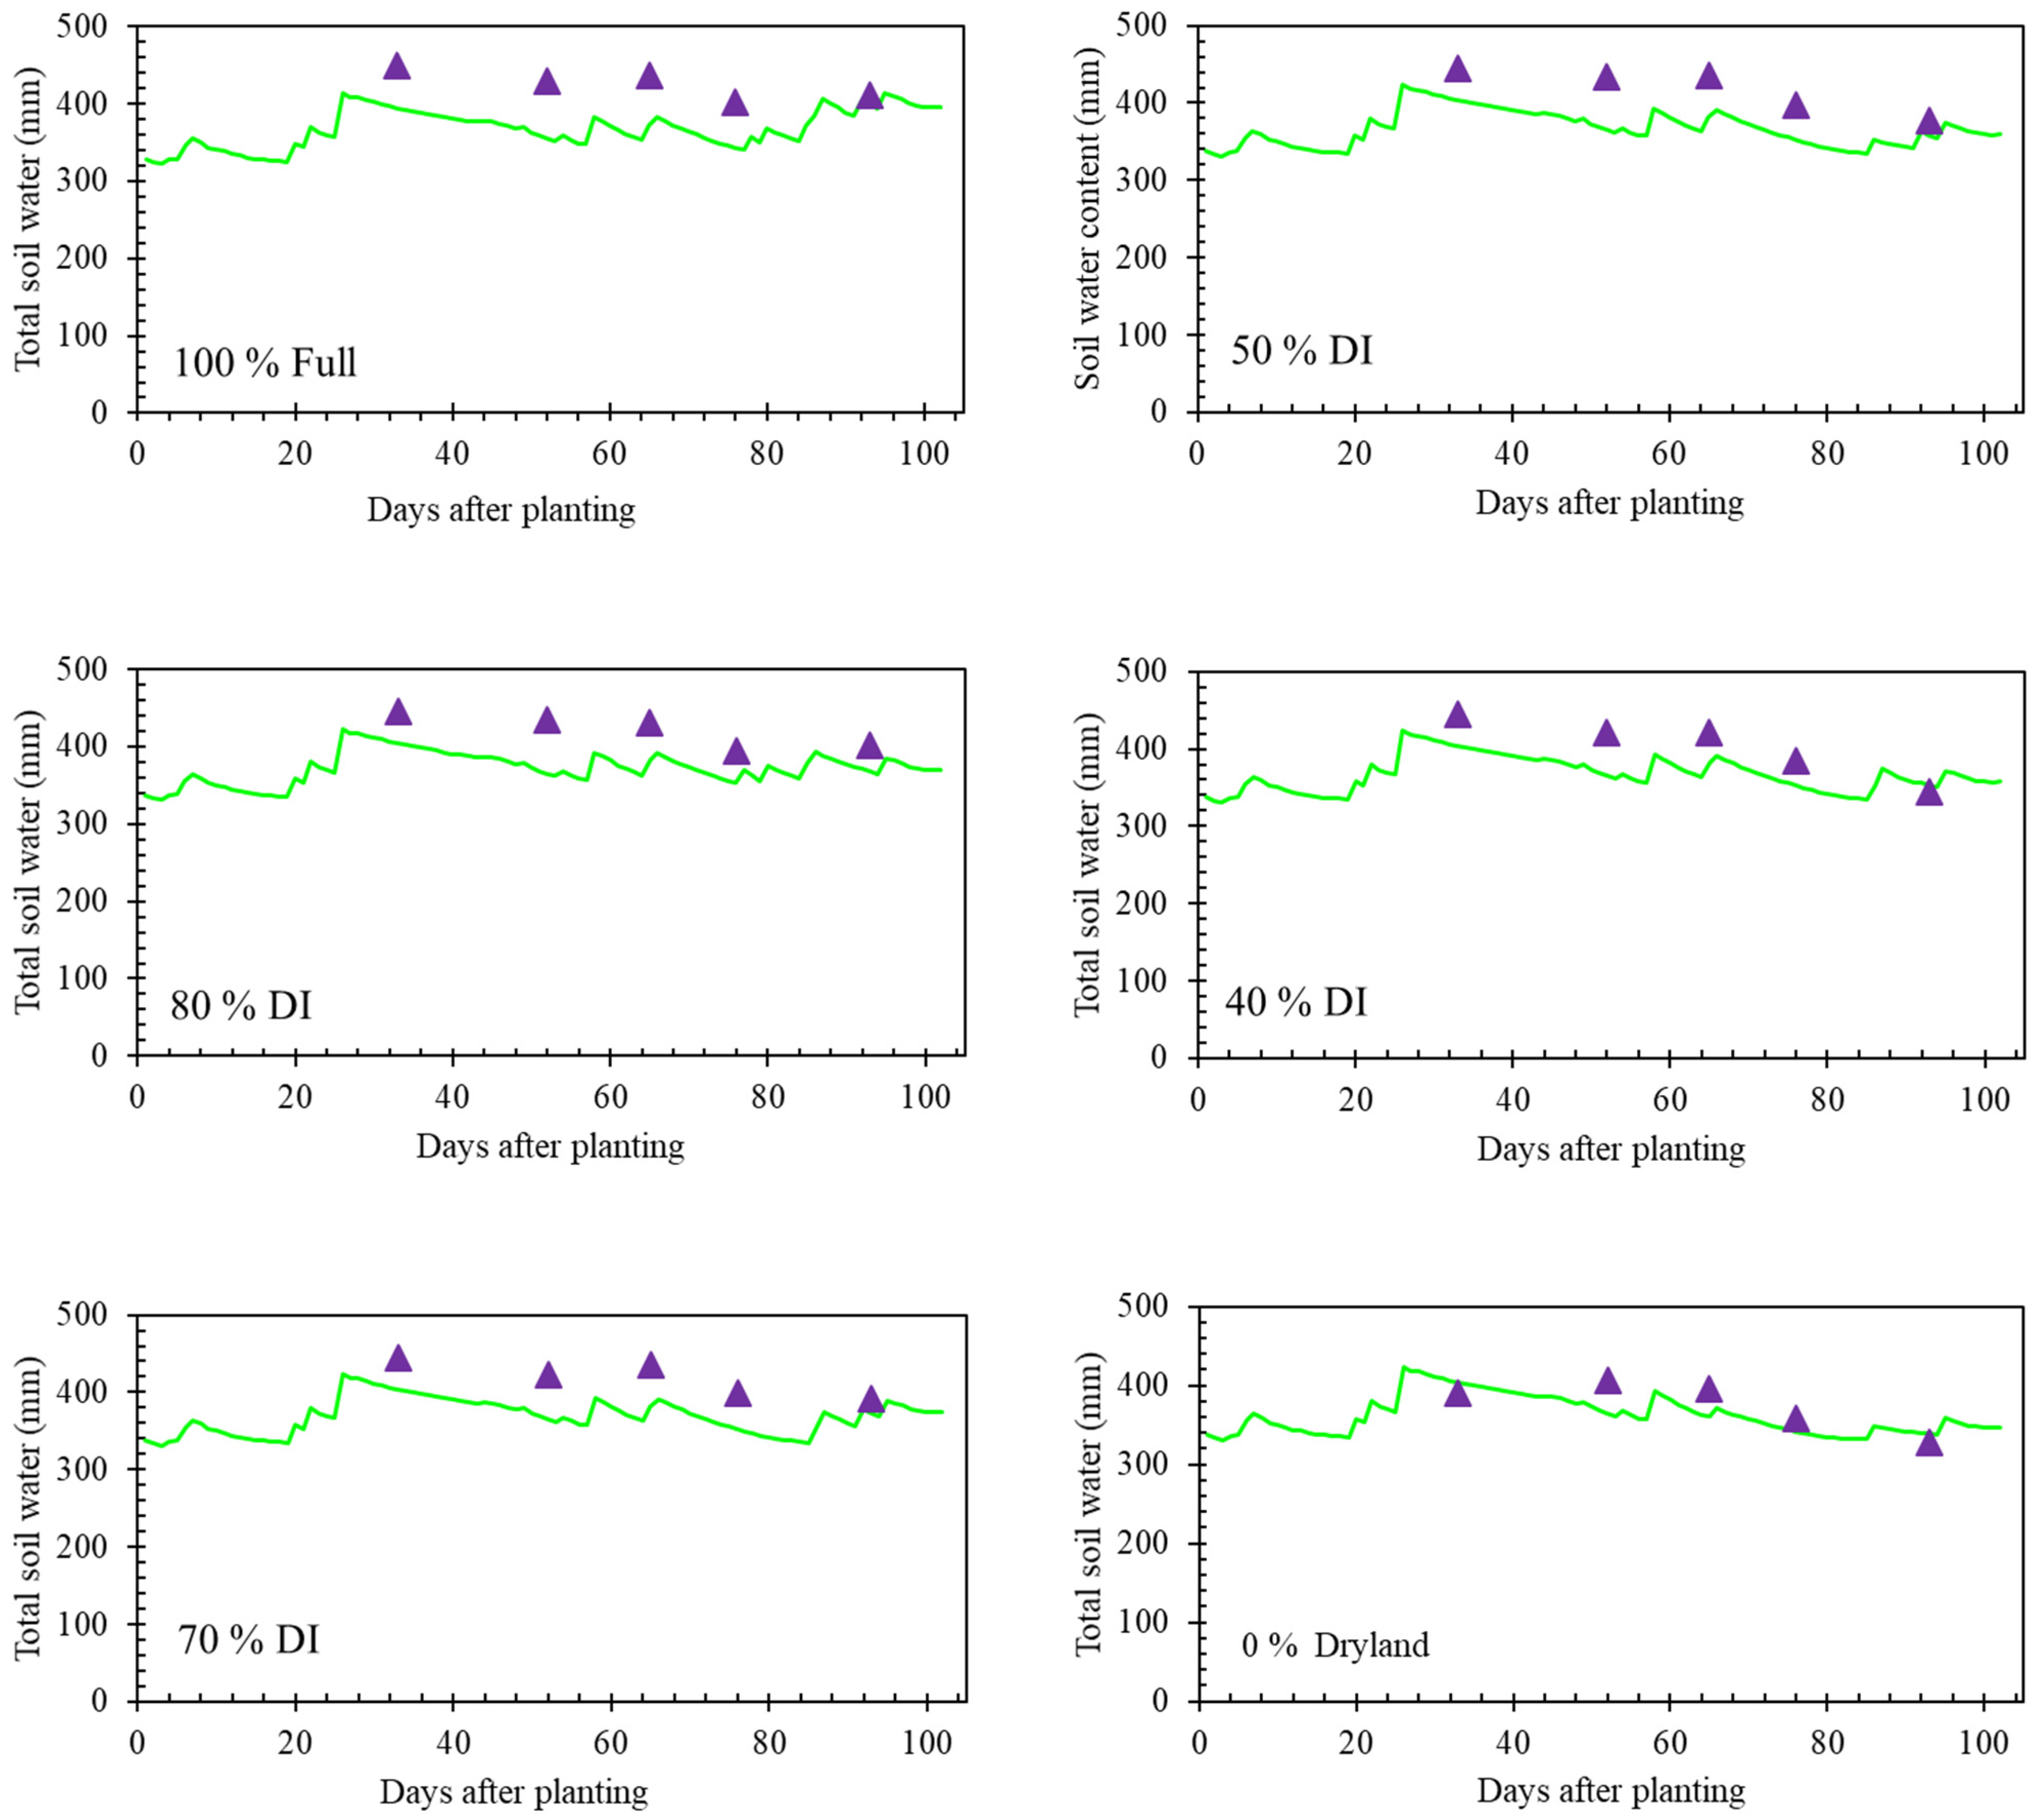
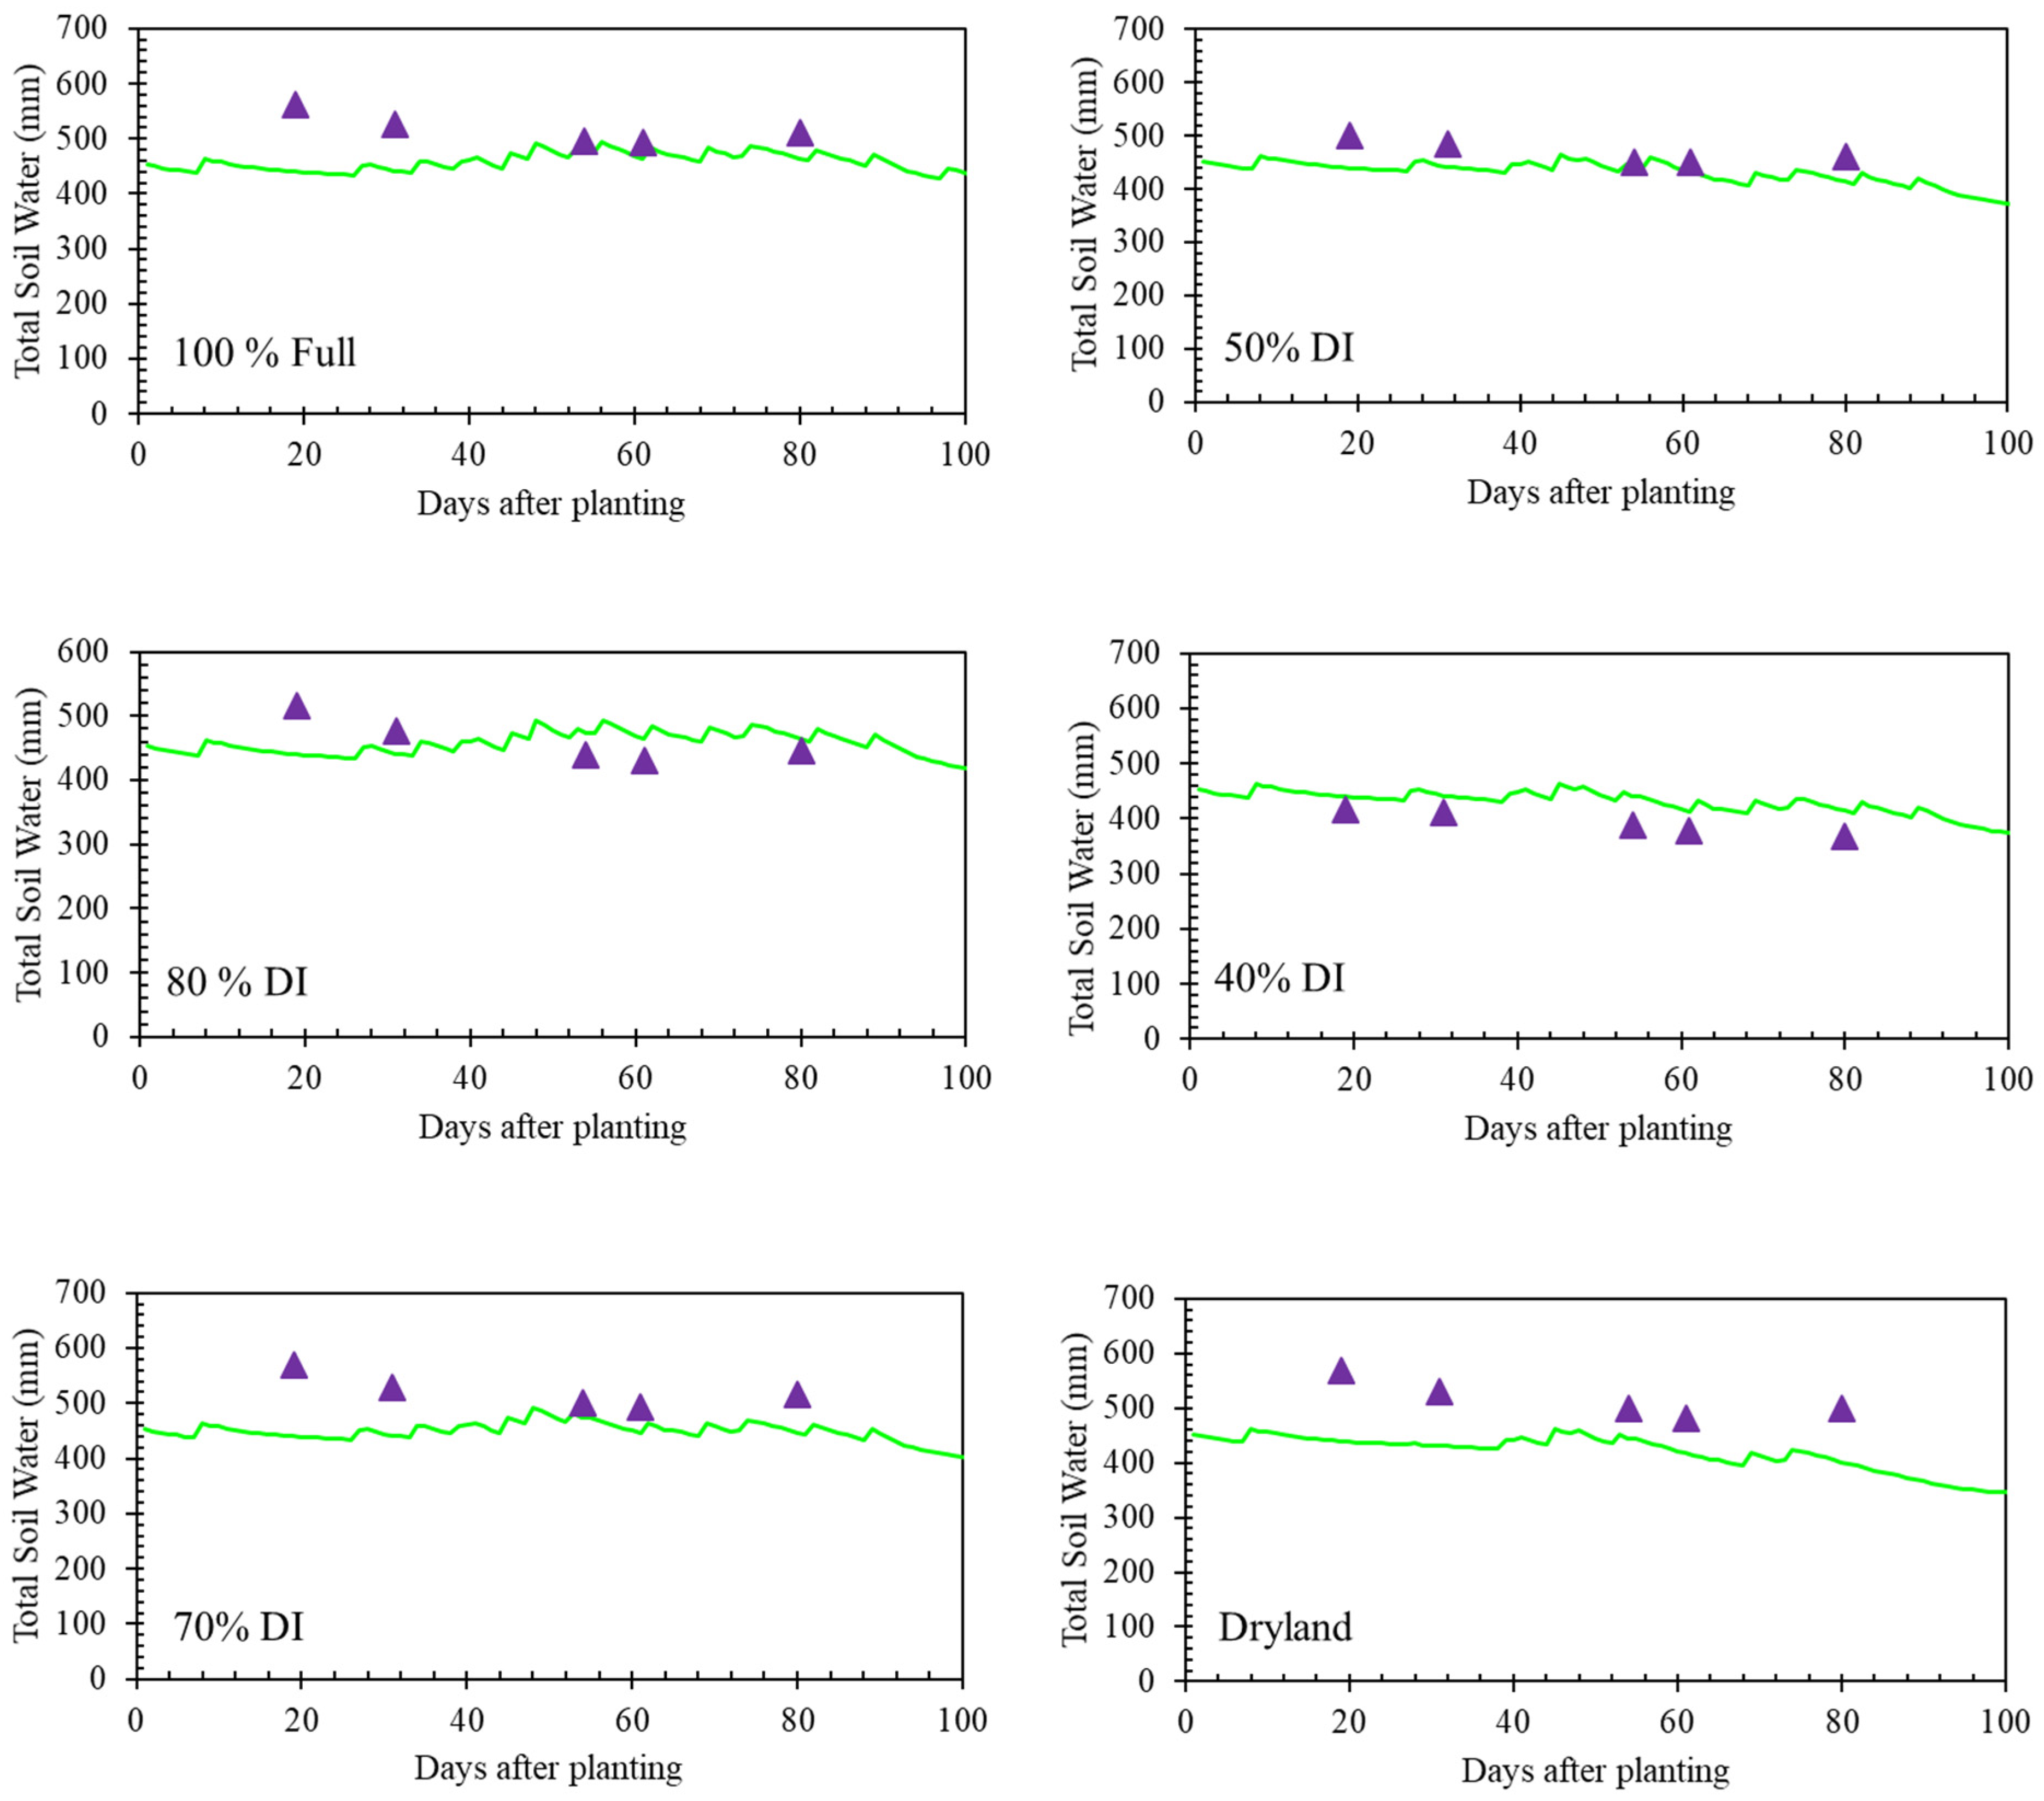
3.2. Soil Water
3.3. Forage Sorghum Biomass and Grain Yield
3.4. Evapotranspiration
3.5. Irrigation Water Use Efficiency
3.6. AquaCrop Model Performance Discussion
3.7. Long-Term Irrigation Strategies Analysis
4. Conclusions
Author Contributions
Funding
Institutional Review Board Statement
Informed Consent Statement
Data Availability Statement
Acknowledgments
Conflicts of Interest
References
- Klocke, N.L.; Currie, R.S.; Tomsicek, D.J.; Koehn, J. Corn yield response to deficit irrigation. Trans. ASABE 2011, 54, 931–940. [Google Scholar] [CrossRef]
- Lamm, F.R.; Stone, L.R.; O′brien, D.M. Crop production and economics in Northwest Kansas as related to irrigation capacity. Appl. Eng. Agric. 2007, 23, 737–745. [Google Scholar] [CrossRef]
- Obour, A.; Holman, J.D.; Mengel, D.B. Nitrogen application effects on forage sorghum biomass production and nitrates. Kansas Agric. Exp. Stn. Res. Rep. 2018, 4, 4. [Google Scholar] [CrossRef]
- Holman, J.D.; Obour, A.K.; Mengel, D.B. Nitrogen application effects on forage sorghum production and nitrate concentration. J. Plant Nutr. 2019, 42, 2794–2804. [Google Scholar] [CrossRef]
- Bhattarai, B.; Singh, S.; West, C.P.; Ritchie, G.L.; Trostle, C.L. Effect of deficit irrigation on physiology and forage yield of forage sorghum, pearl millet, and corn. Crop Sci. 2020, 60, 2167–2179. [Google Scholar] [CrossRef]
- Jahanzad, E.; Jorat, M.; Moghadam, H.; Sadeghpour, A.; Chaichi, M.-R.; Dashtaki, M. Response of a new and a commonly grown forage sorghum cultivar to limited irrigation and planting density. Agric. Water Manag. 2013, 117, 62–69. [Google Scholar] [CrossRef]
- Roby, M.C.; Salas Fernandez, M.G.; Heaton, E.A.; Miguez, F.E.; VanLoocke, A. Biomass sorghum and maize have similar water-use-efficiency under non-drought conditions in the rain-fed Midwest U.S. Agric. For. Meteorol. 2017, 247, 434–444. [Google Scholar] [CrossRef]
- Gheysari, M.; Sadeghi, S.-H.; Loescher, H.W.; Amiri, S.; Zareian, M.J.; Majidi, M.M.; Asgarinia, P.; Payero, J.O. Comparison of deficit irrigation management strategies on root, plant growth and biomass productivity of silage maize. Agric. Water Manag. 2017, 182, 126–138. [Google Scholar] [CrossRef]
- Keller, J.; Bliesner, R.D. Sprinkle and Trickle Irrigation; Van Nostrand Reinhold: New York, NY, USA, 1990. [Google Scholar]
- Kirkham, M.B. Principles of Soil and Plant Water Relations; Academic Press: Cambridge, MA, USA, 2014; ISBN 0124200788. [Google Scholar]
- Clark, G.A.; Rogers, D.H.; Briggeman, S. KanSched An ET-based irrigation scheduling tool for Kansas summer annual crops. In Proceedings of the 2004 Central Plains Irrigation Conference, Kearney, NE, USA, 17–18 February 2004. [Google Scholar]
- Lamm, F.R.; Rogers, D.H. The importance of irrigation scheduling for marginal capacity systems growing corn. Appl. Eng. Agric. 2015, 31, 261–265. [Google Scholar]
- Aguilar, J.; Rogers, D.; Kisekka, I. Irrigation scheduling based on soil moisture sensors and evapotranspiration. Kansas Agric. Exp. Stn. Res. Rep. 2015, 1, 20. [Google Scholar] [CrossRef]
- Lamm, F.R.; Rogers, D.H.; Manges, H.L. Irrigation scheduling with planned soil water depletion. Trans. ASAE 1994, 37, 1491–1497. [Google Scholar] [CrossRef]
- Kisekka, I.; Schlegel, A.; Ma, L.; Gowda, P.H.; Prasad, P.V.V. Optimizing preplant irrigation for maize under limited water in the High Plains. Agric. Water Manag. 2017, 187, 154–163. [Google Scholar] [CrossRef]
- Kisekka, I.; Aguilar, J.P.; Rogers, D.H.; Holman, J.; O’Brien, D.M.; Klocke, N. Assessing deficit irrigation strategies for corn using simulation. Trans. ASABE 2016, 59, 303–317. [Google Scholar]
- Stone, L.R.; Schlegel, A.J. Yield–water supply relationships of grain sorghum and winter wheat. Agron. J. 2006, 98, 1359–1366. [Google Scholar] [CrossRef]
- Araya, A.; Kisekka, I.; Holman, J. Evaluating deficit irrigation management strategies for grain sorghum using AquaCrop. Irrig. Sci. 2016, 34, 465–481. [Google Scholar] [CrossRef]
- Klocke, N.L.; Currie, R.S.; Tomsicek, D.J.; Koehn, J.W. Sorghum yield response to deficit irrigation. Trans. ASABE 2012, 55, 947–955. [Google Scholar] [CrossRef]
- Kaplan, M.; Kara, K.; Unlukara, A.; Kale, H.; Buyukkilic Beyzi, S.; Varol, I.S.; Kizilsimsek, M.; Kamalak, A. Water deficit and nitrogen affects yield and feed value of sorghum sudangrass silage. Agric. Water Manag. 2019, 218, 30–36. [Google Scholar] [CrossRef]
- Moosavi, S.G.; Seghatoleslami, M.J.; Javadi, H.; Ansari-nia, E. Effect of irrigation intervals and planting patterns on yield and qualitative traits of forage sorghum. Adv. Environ. Biol. 2011, 5, 3363–3368. [Google Scholar]
- Chen, Y.; Marek, G.W.; Marek, T.H.; Brauer, D.K.; Srinivasan, R. Improving SWAT auto-irrigation functions for simulating agricultural irrigation management using long-term lysimeter field data. Environ. Model. Softw. 2018, 99, 25–38. [Google Scholar] [CrossRef]
- Nematpour, A.; Eshghizadeh, H.R. Biochemical responses of sorghum and maize to the impacts of different levels of water deficit and nitrogen supply. Cereal Res. Commun. 2023, 51, 1–11. [Google Scholar] [CrossRef]
- Van Gaelen, H.; Tsegay, A.; Delbecque, N.; Shrestha, N.; Garcia, M.; Fajardo, H.; Miranda, R.; Vanuytrecht, E.; Abrha, B.; Diels, J. A semi-quantitative approach for modelling crop response to soil fertility: Evaluation of the AquaCrop procedure. J. Agric. Sci. 2015, 153, 1218–1233. [Google Scholar] [CrossRef]
- Li, J.; Song, J.; Li, M.; Shang, S.; Mao, X.; Yang, J.; Adeloye, A.J. Optimization of irrigation scheduling for spring wheat based on simulation-optimization model under uncertainty. Agric. Water Manag. 2018, 208, 245–260. [Google Scholar] [CrossRef]
- Zhao, J.; Han, T.; Wang, C.; Jia, H.; Worqlul, A.W.; Norelli, N.; Zeng, Z.; Chu, Q. Optimizing irrigation strategies to synchronously improve the yield and water productivity of winter wheat under interannual precipitation variability in the North China Plain. Agric. Water Manag. 2020, 240, 106298. [Google Scholar] [CrossRef]
- Gohain, G.B.; Singh, K.K.; Singh, R.S.; Dakhore, K.K.; Ghosh, K. Application of CERES-sorghum crop simulation model DSSAT v4.7 for determining crop water stress in crop phenological stages. Model. Earth Syst. Environ. 2022, 8, 1963–1975. [Google Scholar] [CrossRef]
- White, J.W.; Alagarswamy, G.; Ottman, M.J.; Porter, C.H.; Singh, U.; Hoogenboom, G. An Overview of CERES–Sorghum as Implemented in the Cropping System Model Version 4.5. Agron. J. 2015, 107, 1987–2002. [Google Scholar] [CrossRef]
- Yang, K.-W.; Chapman, S.; Carpenter, N.; Hammer, G.; McLean, G.; Zheng, B.; Chen, Y.; Delp, E.; Masjedi, A.; Crawford, M.; et al. Integrating crop growth models with remote sensing for predicting biomass yield of sorghum. Silico Plants 2021, 3, diab001. [Google Scholar] [CrossRef]
- Steduto, P.; Hsiao, T.C.; Raes, D.; Fereres, E. AquaCrop—The FAO Crop Model to Simulate Yield Response to Water: I. Concepts and Underlying Principles. Agron. J. 2009, 101, 426–437. [Google Scholar] [CrossRef]
- Raes, D.; Steduto, P.; Hsiao, T.C.; Fereres, E. AquaCrop—The FAO crop model to simulate yield response to water: II. Main algorithms and software description. Agron. J. 2009, 101, 438–447. [Google Scholar] [CrossRef]
- Hsiao, T.C.; Heng, L.; Steduto, P.; Rojas-Lara, B.; Raes, D.; Fereres, E. AquaCrop—The FAO Crop Model to Simulate Yield Response to Water: III. Parameterization and Testing for Maize. Agron. J. 2009, 101, 448–459. [Google Scholar] [CrossRef]
- Zhang, C.; Xie, Z.; Wang, Q.; Tang, M.; Feng, S.; Cai, H. AquaCrop modeling to explore optimal irrigation of winter wheat for improving grain yield and water productivity. Agric. Water Manag. 2022, 266, 107580. [Google Scholar] [CrossRef]
- Huang, M.; Wang, C.; Qi, W.; Zhang, Z.; Xu, H. Modelling the integrated strategies of deficit irrigation, nitrogen fertilization, and biochar addition for winter wheat by AquaCrop based on a two-year field study. Field Crops Res. 2022, 282, 108510. [Google Scholar] [CrossRef]
- Dirwai, T.L.; Senzanje, A.; Mabhaudhi, T. Calibration and Evaluation of the FAO AquaCrop Model for Canola (Brassica napus) under Varied Moistube Irrigation Regimes. Agriculture 2021, 11, 410. [Google Scholar] [CrossRef]
- Paredes, P.; de Melo-Abreu, J.P.; Alves, I.; Pereira, L.S. Assessing the performance of the FAO AquaCrop model to estimate maize yields and water use under full and deficit irrigation with focus on model parameterization. Agric. Water Manag. 2014, 144, 81–97. [Google Scholar] [CrossRef]
- He, Q.; Li, S.; Hu, D.; Wang, Y.; Cong, X. Performance assessment of the AquaCrop model for film-mulched maize with full drip irrigation in Northwest China. Irrig. Sci. 2021, 39, 277–292. [Google Scholar] [CrossRef]
- Araya, A.; Kisekka, I.; Gowda, P.H.; Prasad, P.V.V. Evaluation of water-limited cropping systems in a semi-arid climate using DSSAT-CSM. Agric. Syst. 2017, 150, 86–98. [Google Scholar] [CrossRef]
- Allen, R.G.; Pereira, L.S.; Raes, D.; Smith, M. FAO Irrigation and drainage paper No. 56. Rome Food Agric. Organ. United Nations 1998, 56, e156. [Google Scholar]
- Kisekka, I.; Holman, J.D.; Waggoner, J.W.; Aguilar, J.; Currie, R. Forage Sorghum and Corn Silage Response to Full and Deficit Irrigation. Kansas Agric. Exp. Stn. Res. Rep. 2016, 2, 6. [Google Scholar] [CrossRef]
- Sandhu, R.; Irmak, S. Assessment of AquaCrop model in simulating maize canopy cover, soil-water, evapotranspiration, yield, and water productivity for different planting dates and densities under irrigated and rainfed conditions. Agric. Water Manag. 2019, 224, 105753. [Google Scholar] [CrossRef]
- Sandhu, R.; Irmak, S. Performance of AquaCrop model in simulating maize growth, yield, and evapotranspiration under rainfed, limited and full irrigation. Agric. Water Manag. 2019, 223, 105687. [Google Scholar] [CrossRef]
- Masasi, B.; Taghvaeian, S.; Gowda, P.H.; Warren, J.; Marek, G. Simulating soil water content, evapotranspiration, and yield of variably irrigated grain sorghum using AquaCrop. JAWRA J. Am. Water Resour. Assoc. 2019, 55, 976–993. [Google Scholar] [CrossRef]
- Solgi, S.; Ahmadi, S.H.; Sepaskhah, A.R.; Edalat, M. Wheat yield modeling under water-saving irrigation and climatic scenarios in transition from surface to sprinkler irrigation systems. J. Hydrol. 2022, 612, 128053. [Google Scholar] [CrossRef]
- Lyu, J.; Jiang, Y.; Xu, C.; Liu, Y.; Su, Z.; Liu, J.; He, J. Multi-objective winter wheat irrigation strategies optimization based on coupling AquaCrop-OSPy and NSGA-III: A case study in Yangling, China. Sci. Total Environ. 2022, 843, 157104. [Google Scholar] [CrossRef]
- Araya, A.; Kisekka, I.; Vara Prasad, P.V.; Gowda, P.H. Evaluating optimum limited irrigation management strategies for corn production in the Ogallala aquifer region. J. Irrig. Drain. Eng. 2017, 143, 4017041. [Google Scholar] [CrossRef]
- Zhang, J.; Li, K.; Gao, Y.; Feng, D.; Zheng, C.; Cao, C.; Sun, J.; Dang, H.; Hamani, A.K.M. Evaluation of saline water irrigation on cotton growth and yield using the AquaCrop crop simulation model. Agric. Water Manag. 2022, 261, 107355. [Google Scholar] [CrossRef]
- Ahmadi, S.H.; Reis Ghorra, M.R.; Sepaskhah, A.R. Parameterizing the AquaCrop model for potato growth modeling in a semi-arid region. Field Crops Res. 2022, 288, 108680. [Google Scholar] [CrossRef]
- Katerji, N.; Campi, P.; Mastrorilli, M. Productivity, evapotranspiration, and water use efficiency of corn and tomato crops simulated by AquaCrop under contrasting water stress conditions in the Mediterranean region. Agric. Water Manag. 2013, 130, 14–26. [Google Scholar] [CrossRef]
- Iqbal, M.A.; Shen, Y.; Stricevic, R.; Pei, H.; Sun, H.; Amiri, E.; Penas, A.; del Rio, S. Evaluation of the FAO AquaCrop model for winter wheat on the North China Plain under deficit irrigation from field experiment to regional yield simulation. Agric. Water Manag. 2014, 135, 61–72. [Google Scholar] [CrossRef]
- Toumi, J.; Er-Raki, S.; Ezzahar, J.; Khabba, S.; Jarlan, L.; Chehbouni, A. Performance assessment of AquaCrop model for estimating evapotranspiration, soil water content and grain yield of winter wheat in Tensift Al Haouz (Morocco): Application to irrigation management. Agric. Water Manag. 2016, 163, 219–235. [Google Scholar] [CrossRef]
- Ran, H.; Kang, S.; Li, F.; Du, T.; Tong, L.; Li, S.; Ding, R.; Zhang, X. Parameterization of the AquaCrop model for full and deficit irrigated maize for seed production in arid Northwest China. Agric. Water Manag. 2018, 203, 438–450. [Google Scholar] [CrossRef]
- Farahani, H.J.; Izzi, G.; Oweis, T.Y. Parameterization and Evaluation of the AquaCrop Model for Full and Deficit Irrigated Cotton. Agron. J. 2009, 101, 469–476. [Google Scholar] [CrossRef]
- Fan, J.; McConkey, B.; Wang, H.; Janzen, H. Root distribution by depth for temperate agricultural crops. Field Crops Res. 2016, 189, 68–74. [Google Scholar] [CrossRef]
- Van Genuchten, M.T. A Numerical Model for Water and Solute Movement in and Below the Root Zone; Research Report No. 121; U.S. Salinity Laboratory: Riverside, CA, USA, 1987.
- Skaggs, T.H.; Van Genuchten, M.T.; Shouse, P.J.; Poss, J.A. Macroscopic approaches to root water uptake as a function of water and salinity stress. Agric. Water Manag. 2006, 86, 140–149. [Google Scholar] [CrossRef]
- Montoya, F.; Camargo, D.; Ortega, J.F.; Córcoles, J.I.; Domínguez, A. Evaluation of Aquacrop model for a potato crop under different irrigation conditions. Agric. Water Manag. 2016, 164, 267–280. [Google Scholar] [CrossRef]
- Hadebe, S.T.; Modi, A.T.; Mabhaudhi, T. Calibration and testing of AquaCrop for selected sorghum genotypes. Water SA 2017, 43, 209. [Google Scholar] [CrossRef]
- Prasad, P.V.V.; Boote, K.J.; Allen, L.H. Adverse high temperature effects on pollen viability, seed-set, seed yield and harvest index of grain-sorghum [Sorghum bicolor (L.) Moench] are more severe at elevated carbon dioxide due to higher tissue temperatures. Agric. For. Meteorol. 2006, 139, 237–251. [Google Scholar] [CrossRef]
- Hammer, G.L.; Broad, I.J. Genotype and Environment Effects on Dynamics of Harvest Index during Grain Filling in Sorghum. Agron. J. 2003, 95, 199–206. [Google Scholar] [CrossRef]
- Thapa, S.; Stewart, B.A.; Xue, Q.; Chen, Y. Manipulating plant geometry to improve microclimate, grain yield, and harvest index in grain sorghum. PLoS ONE 2017, 12, e0173511. [Google Scholar] [CrossRef]


| Parameters | Default | Calibrated |
|---|---|---|
| Initial canopy cover at 90% emergence (%) | 0.22 | 0.74 |
| Canopy expansion | 18.1 | 16.7 |
| Maximum canopy cover (%) | 90 | 48 |
| Canopy decline (day) | 25 | 16 |
| Emergence (days after sowing) | 13 | 13 |
| Maximum canopy (days after sowing) | 60 | 53 |
| Start of senescence (days after sowing) | 91 | 93 |
| Maturity (days after sowing) | 102 | 104 |
| Duration of flowering | 20 | 20 |
| Length of flowering | 65 | 65 |
| Max effective root depth (m) | 1.5 | 1.5 |
| Length of max root depth (days after sowing) | 96 | 96 |
| Normalized Crop Water Productivity | 33.7 | 33.7 |
| Harvest index | 45 | 23 |
| Soil water stress | ||
| Canopy expansion | ||
| P-upper | 0.15 | 0.07 |
| P-lower | 0.7 | 0.37 |
| Shape | 3.0 | 3.2 |
| Stomatal closure function | ||
| P-upper | 0.75 | 0.41 |
| Shape | 3.0 | 1.8 |
| Early canopy senescence | ||
| P-upper | 0.7 | 0.41 |
| Shape | 3.0 | 1.6 |
| Treatments | RMSE (mm) | NRMSE | d | R2 | |
|---|---|---|---|---|---|
| Calibration year | 100%—full | 57.1 | 0.136 | 0.4 | 0.75 |
| 80% | 50.4 | 0.121 | 0.64 | 0.39 | |
| 70% | 53.0 | 0.127 | 0.36 | 0.12 | |
| 50% | 49.4 | 0.12 | 0.77 | 0.59 | |
| 40% | 37.5 | 0.096 | 0.77 | 0.58 | |
| 0—dryland | 42.1 | 0.134 | 0.97 | 0.93 | |
| Validation year | 100%—full | 71.5 | 0.138 | 0.88 | 0.78 |
| 80% | 43.8 | 0.095 | 0.89 | 0.79 | |
| 70% | 79.9 | 0.153 | 0.53 | 0.28 | |
| 50% | 40.7 | 0.087 | 0.38 | 0.15 | |
| 40% | 38.1 | 0.097 | 0.84 | 0.70 | |
| 0—dryland | 93.2 | 0.181 | 0.50 | 0.26 |
| Biomass | RMSE (ton/ha) | NRMSE | R2 | d | MBE (ton/ha) | |
|---|---|---|---|---|---|---|
| Calibration year (2014) | 0.76 | 0.09 | 0.71 | 0.91 | −0.09 | |
| Validation year (2015) | 0.53 | 0.04 | 0.86 | 0.95 | 0.26 | |
| Grain yield | ||||||
| Calibration year (2014) | 0.27 | 0.12 | 0.79 | 0.87 | −0.19 | |
| Validation year (2015) | 0.49 | 0.20 | 0.30 | 0.44 | 0.46 |
| Treatment | 2014 | 2015 | ||||
|---|---|---|---|---|---|---|
| Observed | Simulated | Pe (%) | Observed | Simulated | Pe (%) | |
| 100% | 9.17 | 9.27 | 1.09 | 13.92 | 13.69 | −1.61 |
| 80% | 8.62 | 9.08 | 5.33 | 13.70 | 13.67 | −0.20 |
| 70% | 8.56 | 7.27 | −15.07 | 13.17 | 13.63 | 3.50 |
| 50% | 8.15 | 7.20 | −11.66 | 13.09 | 13.03 | −0.45 |
| 40% | 6.45 | 7.17 | 11.16 | 11.84 | 13.02 | 9.93 |
| Dryland | 5.22 | 5.66 | 8.24 | 10.20 | 10.46 | 2.54 |
| Treatment | 2014 | 2015 | ||||
|---|---|---|---|---|---|---|
| Observed | Simulated | Pe (%) | Observed | Simulated | Pe (%) | |
| 100% | 2.51 | 2.52 | 0.39 | 2.8 | 3.01 | 7.5 |
| 80% | 2.40 | 2.45 | 2.08 | 2.68 | 3.01 | 12.42 |
| 70% | 2.42 | 1.94 | −19.83 | 2.40 | 2.98 | 24.08 |
| 50% | 2.25 | 1.91 | −15.11 | 2.33 | 2.97 | 27.55 |
| 40% | 2.02 | 1.90 | −5.94 | 2.31 | 2.96 | 28.35 |
| Dryland | 1.56 | 1.27 | −18.42 | 2.28 | 2.66 | 16.67 |
| RMSE (mm) | NRMSE | R2 | d | MBE (mm) | ||||||||
|---|---|---|---|---|---|---|---|---|---|---|---|---|
| Seasonal evapotranspiration (mm) | Calibration year | 91.26 | 0.24 | 0.89 | 0.76 | −89.93 | ||||||
| Validation year | 86.45 | 0.21 | 0.95 | 0.65 | 59.73 | |||||||
| Observational and simulated seasonal evapotranspiration (mm) for irrigation treatments | ||||||||||||
| 100% | 80% | 70% | 50% | 40% | Dryland | |||||||
| Obs. | Sim | Obs. | Sim | Obs. | Sim | Obs. | Sim | Obs. | Sim | Obs. | Sim | |
| Calibration year | 460.04 | 352.92 | 398.68 | 334.05 | 384.65 | 287.47 | 349.63 | 271.32 | 383.83 | 276.76 | 301.22 | 215.9 |
| Validation year | 508.37 | 506.26 | 475.47 | 506.13 | 463.12 | 494.02 | 441.44 | 468.69 | 383.29 | 467.5 | 217.42 | 404.77 |
| RMSE (Kg ha−1 mm−1) | NRMSE | R2 | d | MBE (Kg ha−1 mm−1) | ||||||
|---|---|---|---|---|---|---|---|---|---|---|
| Irrigation water use efficiency (Kg/ha·mm) | Calibration year | 4.24 | 0.13 | 0.94 | 0.96 | −3.02 | ||||
| Validation year | 5.15 | 0.25 | 0.99 | 0.90 | 4.31 | |||||
| Observational and simulated irrigation water use efficiency (Kg ha−1 mm−1) for irrigation treatments | ||||||||||
| 100% | 80% | 70% | 50% | 40% | ||||||
| Obs. | Sim | Obs. | Sim | Obs. | Sim | Obs. | Sim | Obs. | Sim | |
| Calibration year | 16.47 | 16.53 | 23.62 | 24.11 | 31.76 | 25.45 | 44.29 | 37.57 | 45.19 | 42.50 |
| Validation year | 13.77 | 14.81 | 15.07 | 16.92 | 15.74 | 19.54 | 22.93 | 29.25 | 30.31 | 38.91 |
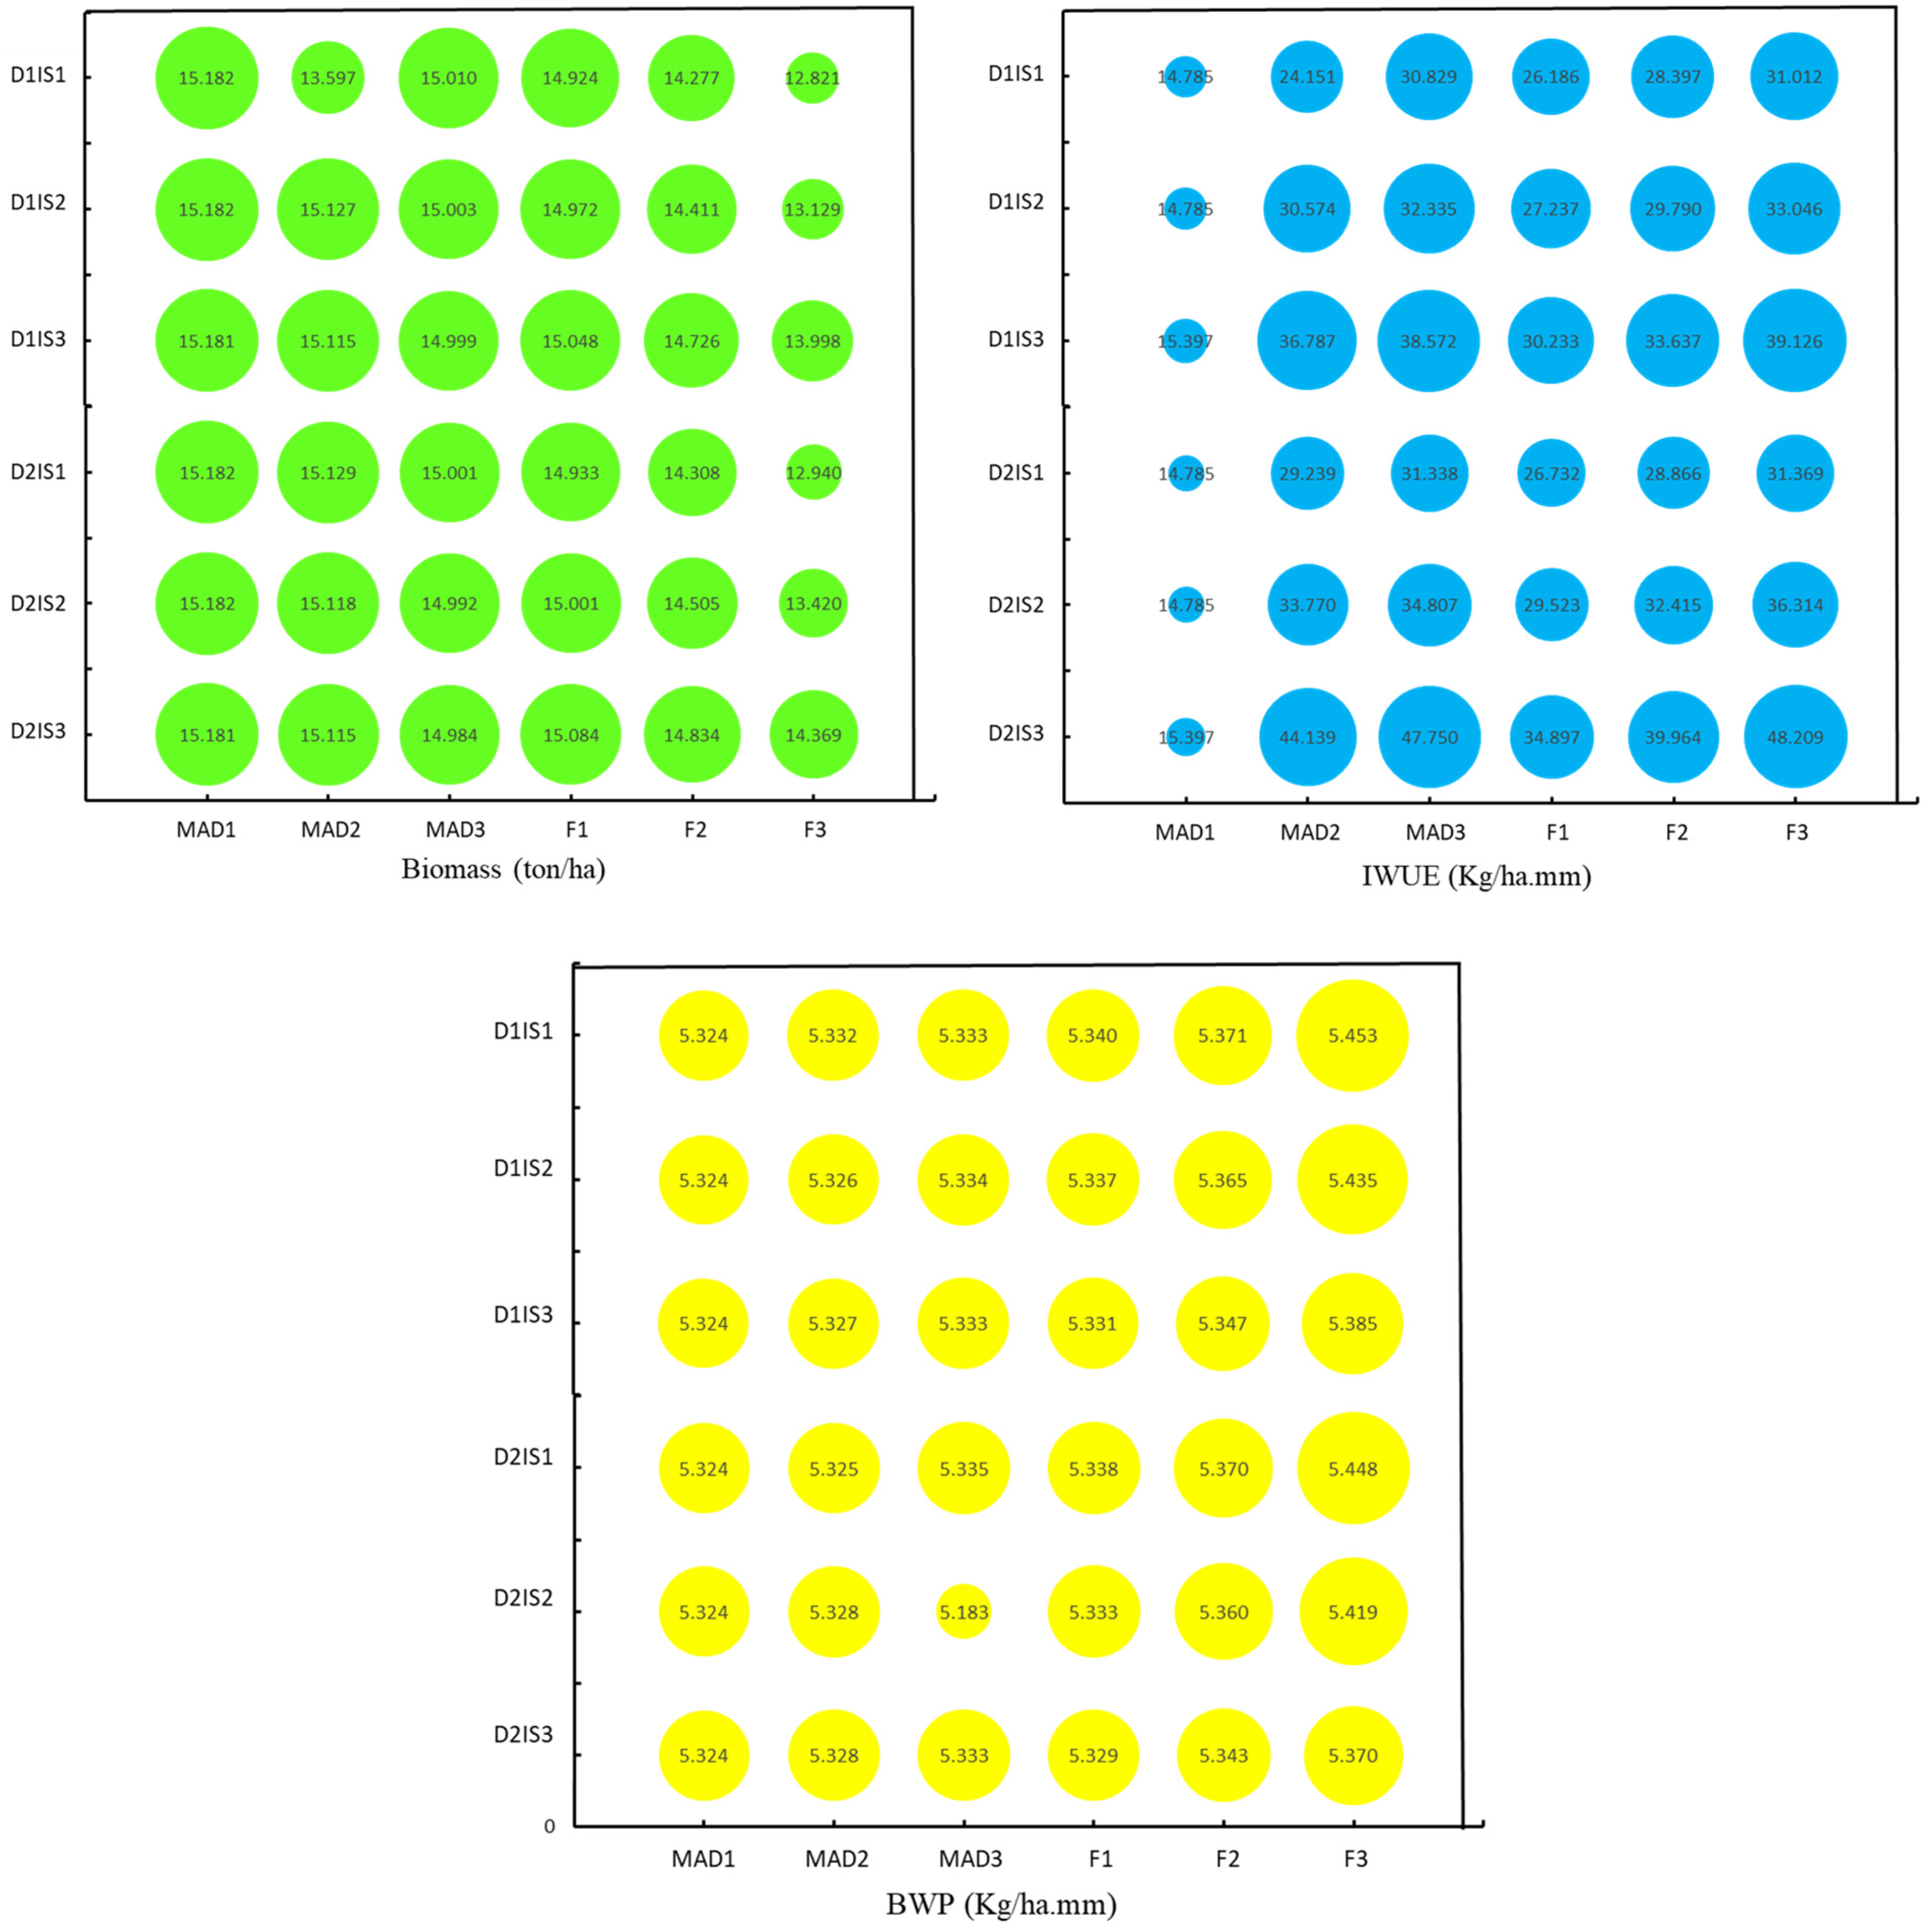
| Scenario | Biomass (ton/ha) | Scenario | IWUE (Kg/ha·mm) | Scenario | BWP (Kg/ha·mm) | |||
|---|---|---|---|---|---|---|---|---|
| D1IS1MAD1 | 15.18151 | a | D2IS3F3 | 48.20916 | a | D1IS1F3 | 5.452728 | a |
| D1IS2MAD1 | 15.18151 | a | D2IS3MAD3 | 47.75004 | ab | D2IS1F3 | 5.448294 | a |
| D2IS1MAD1 | 15.18151 | a | D2IS3MAD2 | 44.13881 | abc | D1IS2F3 | 5.434749 | a |
| D2IS2MAD1 | 15.18151 | a | D2IS3F2 | 39.96421 | bcd | D2IS2F3 | 5.418804 | a |
| D1IS3MAD1 | 15.18146 | a | D1IS3F3 | 39.12559 | cde | D1IS3F3 | 5.384775 | a |
| D2IS3MAD1 | 15.18146 | a | D1IS3MAD3 | 38.57193 | cdef | D1IS1F2 | 5.371225 | a |
| D2IS1MAD2 | 15.12889 | ab | D1IS3MAD2 | 36.7872 | cdefg | D2IS1F2 | 5.369919 | a |
| D1IS2MAD2 | 15.12659 | ab | D2IS2F3 | 36.31387 | cdefgh | D2IS3F3 | 5.369661 | a |
| D2IS2MAD2 | 15.11846 | ab | D2IS2MAD3 | 35.6158 | cdefghi | D1IS2F2 | 5.365256 | a |
| D1IS3MAD2 | 15.11495 | ab | D2IS3F1 | 34.89746 | defghi | D2IS2F2 | 5.35979 | a |
| D2IS3MAD2 | 15.11484 | ab | D2IS2MAD2 | 33.76995 | defghi | D1IS3F2 | 5.347463 | a |
| D2IS3F1 | 15.08389 | ab | D1IS3F2 | 33.63745 | defghi | D2IS3F2 | 5.342804 | a |
| D1IS3F1 | 15.04824 | ab | D1IS2F3 | 33.04585 | defghij | D1IS1F1 | 5.33982 | a |
| D1IS1MAD3 | 15.01043 | abc | D2IS2F2 | 32.41538 | defghij | D2IS1F1 | 5.337857 | a |
| D1IS2MAD3 | 15.00335 | abc | D1IS2MAD3 | 32.33465 | defghij | D1IS2F1 | 5.336726 | a |
| D2IS2F1 | 15.00146 | abc | D2IS1F3 | 31.36942 | defghij | D2IS1MAD3 | 5.334935 | a |
| D2IS1MAD3 | 15.00081 | abc | D2IS1MAD3 | 31.33822 | defghij | D1IS2MAD3 | 5.33398 | a |
| D2IS2MAD3 | 15.0006 | abc | D1IS1F3 | 31.01244 | defghij | D1IS1MAD3 | 5.333487 | a |
| D1IS3MAD3 | 14.99943 | abc | D1IS1MAD3 | 30.8295 | defghij | D2IS3MAD3 | 5.333436 | a |
| D2IS3MAD3 | 14.98432 | abc | D1IS2MAD2 | 30.57364 | efghij | D1IS3MAD3 | 5.333402 | a |
| D1IS2F1 | 14.9717 | abc | D1IS3F1 | 30.23289 | efghij | D2IS2F1 | 5.332911 | a |
| D2IS1F1 | 14.93305 | abc | D1IS2F2 | 29.79021 | efghij | D1IS1MAD2 | 5.332475 | a |
| D1IS1F1 | 14.92365 | abc | D2IS2F1 | 29.52272 | fghij | D2IS2MAD3 | 5.331215 | a |
| D2IS3F2 | 14.83378 | bc | D2IS1MAD2 | 29.23879 | fghij | D1IS3F1 | 5.330633 | a |
| D1IS3F2 | 14.72589 | cd | D2IS1F2 | 28.86594 | ghij | D2IS3F1 | 5.328729 | a |
| D2IS2F2 | 14.5053 | de | D1IS1F2 | 28.3967 | ghij | D2IS2MAD2 | 5.327947 | a |
| D1IS2F2 | 14.41119 | e | D1IS2F1 | 27.23669 | hij | D2IS3MAD2 | 5.327681 | a |
| D2IS3F3 | 14.36884 | e | D2IS1F1 | 26.73173 | ij | D1IS3MAD2 | 5.327328 | a |
| D2IS1F2 | 14.3083 | e | D1IS1F1 | 26.18553 | ij | D1IS2MAD2 | 5.325701 | a |
| D1IS1F2 | 14.27673 | e | D1IS1MAD2 | 24.15055 | j | D2IS1MAD2 | 5.325415 | a |
| D1IS3F3 | 13.99773 | f | D1IS3MAD1 | 15.3969 | k | D1IS3MAD1 | 5.323934 | a |
| D1IS1MAD2 | 13.59749 | g | D2IS3MAD1 | 15.3969 | k | D2IS3MAD1 | 5.323934 | a |
| D2IS2F3 | 13.41962 | g | D1IS1MAD1 | 14.78531 | k | D1IS1MAD1 | 5.323607 | a |
| D1IS2F3 | 13.1293 | h | D1IS2MAD1 | 14.78531 | k | D1IS2MAD1 | 5.323607 | a |
| D2IS1F3 | 12.93992 | hi | D2IS1MAD1 | 14.78531 | k | D2IS1MAD1 | 5.323607 | a |
| D1IS1F3 | 12.82116 | i | D2IS2MAD1 | 14.78531 | k | D2IS2MAD1 | 5.323607 | a |
Disclaimer/Publisher’s Note: The statements, opinions and data contained in all publications are solely those of the individual author(s) and contributor(s) and not of MDPI and/or the editor(s). MDPI and/or the editor(s) disclaim responsibility for any injury to people or property resulting from any ideas, methods, instructions or products referred to in the content. |
© 2023 by the authors. Licensee MDPI, Basel, Switzerland. This article is an open access article distributed under the terms and conditions of the Creative Commons Attribution (CC BY) license (https://creativecommons.org/licenses/by/4.0/).
Share and Cite
Fazel, F.; Ansari, H.; Aguilar, J. Determination of the Most Efficient Forage Sorghum Irrigation Scheduling Strategies in the U.S. Central High Plains Using the AquaCrop Model and Field Experiments. Agronomy 2023, 13, 2446. https://doi.org/10.3390/agronomy13102446
Fazel F, Ansari H, Aguilar J. Determination of the Most Efficient Forage Sorghum Irrigation Scheduling Strategies in the U.S. Central High Plains Using the AquaCrop Model and Field Experiments. Agronomy. 2023; 13(10):2446. https://doi.org/10.3390/agronomy13102446
Chicago/Turabian StyleFazel, Forough, Hossein Ansari, and Jonathan Aguilar. 2023. "Determination of the Most Efficient Forage Sorghum Irrigation Scheduling Strategies in the U.S. Central High Plains Using the AquaCrop Model and Field Experiments" Agronomy 13, no. 10: 2446. https://doi.org/10.3390/agronomy13102446
APA StyleFazel, F., Ansari, H., & Aguilar, J. (2023). Determination of the Most Efficient Forage Sorghum Irrigation Scheduling Strategies in the U.S. Central High Plains Using the AquaCrop Model and Field Experiments. Agronomy, 13(10), 2446. https://doi.org/10.3390/agronomy13102446