Abstract
To optimize a suitable fertilization method needed for high nitrogen utilization and growth of mung bean in the black soil of Northeast China, a field experiment was carried out with 10 treatments based on isotope-tracing technology. The nitrogen fertilizer utilization, residual, loss and dry-matter transportation, leaf area, photosynthetic potential, and wet-basis moisture content of mung bean were discussed. The results showed that the total utilization rate of nitrogen fertilizer under different treatments was 34.75~47.71%, while in the 0~15 cm soil layer, the total residual rate was 11.36~33.69%, and the loss rate was 21.03~53.89%. The T1 treatment had the lowest total nitrogen fertilizer utilization rate and the greatest loss rate. The leaf area and photosynthetic potential at the seedling stage in the T9 treatment, the branching stage in the T2 treatment, and the flowering stage in the T4 and T9 treatments were 5.11~31.82% higher than those in the CK treatment, and the values at the drumming and maturing stages were significantly lower than those in the CK treatment (p < 0.05). The total wet-basis water content of the root, stem, leaf, and pod in the whole stages compared with the CK treatment increased by 3.35~7.41% in T4, T5, T7, and T8. In the T6 and T9 treatments, the output rate of stem-sheath storage matter and the transformation rate were significantly higher than those in the T1 treatment (p < 0.05). The dry-matter accumulation in the T1 and T9 treatments was significantly different from that in the CK treatment, which increased by 27.72% and 5.10%, respectively. Thus, organic fertilizer coupled with nitrogen fertilizer can improve the nitrogen fertilizer utilization rate and the growth of mung beans.
1. Introduction
As the world’s most populous country, China uses only 9% of the world’s cultivated land but feeds 22% of the world’s population [1,2]. From 2003 to 2015, grain production in China increased by 22,990.8 million tons and succeeded in achieving 12 years of consistent growth. The significant growth in China’s grain mainly relies on the extensive use of chemical fertilizers. According to statistics, China’s fertilizer use accounts for one-third of the world’s total fertilizer consumption, and China has become the world’s largest consumer of nitrogen fertilizer [3,4]. Fertilizer use is crucial for improving soil fertility and crop productivity, but the excessive application of nitrogen fertilizer can lead to several problems, such as soil salinization and acidification, reduced soil saturation and fertility, damage caused to the ozone layer, soil sludge, and heavy metal pollution of farmland and water bodies, leading to ecosystem disorders [5,6,7,8]. In 2015, the Ministry of Agriculture issued the Action Plan for Zero Growth in Fertilizer Use by 2020, which demands zero growth in fertilizer use by 2020 to ensure food security [9]. Achieving zero growth in fertilizer use and the goal of reducing fertilizer and increasing efficiency have placed higher demands on the efficient utilization of fertilizer.
The northeastern black soil area is located in the Songliao Basin, which is one of the four major black soil areas in the world and is mainly distributed in Liaoning Province, Jilin Province, Heilongjiang Province, and the eastern four leagues of Inner Mongolia, with a total black soil area of 1.09 million km2; this is an important commercial food base in China, accounting for one-third of the country’s commercial food supply, and is the basis of national food security [10,11]. Black soils have high salt-based saturation, good agglomerate structure, rich organic matter content, and suitable PH [12,13]. Nitrogen is one of the most important elements for plant growth and development. Applying nitrogen fertilizer is an important means to increase crop yield in agricultural production [14,15]. However, in recent years, due to the excessive use of nitrogen fertilizer, soil organic matter content decreased, with soil consolidation, environmental pollution, and a series of problems [16,17,18]. Therefore, switching to organic fertilizer with a nitrogen fertilizer application pattern is crucial to scientifically develop a management model that reduces nitrogen fertilizer dosage, improves black soil fertility, reduces environmental pollution, and improves fertilizer efficiency, and, at the same time, it is of great significance for sustainable development in Chinese agriculture [13,19].
A large number of studies have shown that the combination of organic fertilizer and nitrogen fertilizer can prevent soil acidification, increase the soil organic matter content, promote soil carbon cycle stability, improve soil nitrogen, phosphorus and potassium nutrient capacity and crop quality, and achieve stable and increased yields [20,21,22]. Li et al. [23] and Hu et al. [24] found that the application of humic acid can improve soil physical and chemical properties, increase the soil nutrient content, and, thus, improve crop quality and yield. Ye et al. [25] found that the application of bio-organic fertilizers to reduce the application of chemical fertilizers can significantly improve soil fertility and significantly improved tomato yield and quality. Zhang et al. [26] showed that magnesium fertilization combined with organic corn straw fertilizer can significantly increase the seed yield, nitrogen utilization, and nitrogen efficiency of corn plants, thus, increasing corn yield. Chen et al. [27] and Wei et al. [28] showed that organic fertilizer application can increase soil organic carbon fixation, reduce nitrogen and carbon losses, significantly increase crop height, stem width, and leaf area, and, to some extent, promote crop yield. Ma et al. [29] showed that the application of organic fertilizers in the soil can help to improve soil quality, maintain crop production, and increase crop yield. Liu et al. [30] and Kimani et al. [31] reported that biochar application combined with chemical fertilizers in soil can improve soil quality and increase the soil carbon sequestration capacity, rice yield, and nitrogen fertilizer utilization, thus, decreasing agricultural pollution. Xin et al. [32] showed that the application of chemical fertilizer is necessary to increase crop yield, while the complete application of organic fertilizer instead of chemical fertilizer increased the efficiency of fertilizer utilization but decreased the yield. Therefore, the reasonable application of organic fertilizer can result in higher fertilizer utilization efficiency and sustained high yield.
Mung bean is a warm-season, high-yielding bean crop that is widely grown in China because of its high economic and nutritional value [33,34]. Mung bean is a crop with low soil requirements, a short reproductive cycle, high nitrogen fixation capacity, and environmental adaptability [35]. However, China’s mung beans are facing a series of problems, and it is difficult to ensure the growth of mung beans because the majority of them are grown in arid and semiarid areas [36], so it is especially important to fertilize them in a reasonable way [37]. At present, organic fertilizers instead of chemical fertilizers are more common in planting patterns, in which a large number of studies are conducted on the same organic fertilizers instead of chemical fertilizers, but studies on the differences between different organic fertilizers instead of chemical fertilizers are still lacking. Therefore, this study was conducted to explore the effect of different organic fertilizers with nitrogen fertilizers on the nitrogen use and growth of mung beans in the context of applying different organic fertilizers instead of chemical fertilizers and aimed to provide a reference basis for the best fertilization pattern for mung bean planting.
2. Materials and Methods
2.1. Experimental Site
The experiment was performed in 2021 at the experimental field of Heilongjiang Bayi Agricultural University, Daqing city, which is located in the western part of Heilongjiang Province. The average daily temperature ≤ 5 °C exceeds 145 days, with a short frost-free season throughout the year and climatic characteristics belonging to the northern boreal continental monsoon climate. The test soil is calcareous black calcium soil. The physical and chemical properties of the soil are shown in Table 1.

Table 1.
The different fertilizer treatments.
2.2. Experimental Design
The P2O5 of 45.0 kg/hm2 K2O, 22.5 kg/hm2 as the base fertilizer, as well as the nitrogen fertilizer and organic fertilizer required for each treatment, were applied to the soil at one time before sowing and no later fertilization was carried out. The nitrogen fertilizer used had 10.22% abundance of 15N-labelled urea with 46.4% nitrogen content, while the nitrogen content of the humic acid fertilizer, bio-organic fertilizer, biochar, and straw organic fertilizer was 2%, 2.74%, 0.85%, and 1.3%, respectively. P2O5, K2O, nitrogen fertilizer, and organic fertilizer were spread on the surface of the soil and then mixed thoroughly with the soil. The seeds were planted on 24 May 2021. Mung beans were sown in holes, and the selected seeds were screened before sowing to eliminate broken seeds and impurities. The experiment was set up with 10 treatments, in which CK was a blank control (no fertilizer), T1 consisted of normal fertilizer as a basic control, T2~T5 controlled the nitrogen content of nitrogen fertilizer and supplemented the nitrogen content of organic fertilizer, T6~T9 controlled the total amount of organic fertilizer and supplemented the nitrogen content of nitrogen fertilizer, and all treatments were replicated three times, as shown in Table 2.
Table 2.
Experimental design scheme.
2.3. Isotope Determination of Plant and Soil Samples
The weighed plant samples were ground in a grinder according to method 2.5, passed through a 0.15 mm sieve, and extracted using H2SO4-H2O2. The mass fraction of nitrogen in each organ of the mature plant was determined using a flow analyzer (AutoAnalyzer-III from SEALAnalytical, Bronluby GMBH, Hamburg, Germany). The plant isotope measurements were performed at the Key Laboratory of Water Resources Efficient Utilization, Ministry of Agriculture, Northeastern Agricultural University, China. An elemental analyzer (Flash 2000 HT, Thermo Fisher Scientific, Waltham, MA, USA) and an isotope mass spectrometer (DELTA V Advantage, Thermo Fisher Scientific, Waltham, MA, USA) were used in combination to determine the 15N abundance of each organ of mung bean at the maturing stage.
Soil samples of 0–5 cm, 5–10 cm, and 10–15 cm were collected at the maturing stage of mung bean using a soil auger and dried in a drying oven at 105 °C; stones and rhizomes were removed, after which the soil was ground into powder and passed through a 0.15 mm sieve, and soil 15N abundance was determined using the method of Silva and Bremner (1966). The relevant equations are as follows [38,39,40]:
Percentage of plant nitrogen derived from fertilizer nitrogen Ndff:
where NP is the 15N abundance in plant samples, Nf is the 15N abundance in the fertilizer, and NA is the natural abundance of 15N (0.365% 15N).
Percentage of plant nitrogen derived from soil and organic fertilizer nitrogen Ndfs:
The accumulation of fertilizer nitrogen (NF) in the plant:
The accumulation of soil and organic fertilizer nitrogen (NSO) in the plant:
where DM is the dry matter mass of the plant and NC is the nitrogen content.
Total nitrogen () in each soil layer:
where ρ is the soil capacitance of each layer, V is the volume of each soil layer, and NS is the whole nitrogen mass ratio of each soil layer.
15N residue in soil R:
where a is the 15N abundance of the soil sample, b is the 15N abundance in 15N-labelled urea, and c is the standard value of natural 15N abundance (0.3663% 15N).
Utilization of NP, residual rate NSP of fertilizer N labelled by 15N in the soil:
where NT is the amount of fertilizer applied.
15N loss rate in soil LR:
2.4. Principal Component Analysis
Three replications were taken for each treatment at the seedling, branching, flowering, drumming, and maturing stages of mung bean, and the length and width of each leaf (at the longest and widest part of the leaf) were measured with a ruler to find the leaf area of a single leaf and the mean value of each treatment. The single plant leaf area LA (cm) [41] and photosynthetic potential Q ((cm2·d)/cm2) [42,43] were calculated as follows:
where Lk is the length of the kth leaf, Wk is the width of the kth leaf, α is the regression coefficient of leaf area, taken as 0.75, L1 and L2 are the leaf area indexes measured before and after stage, and T1 and T2 represent the time before and after the two measurements.
2.5. The Wet-Basis Moisture Content of Each Organ
A representative mung bean plant was collected at each of the seedling, branching, flowering, drumming, and maturing stages, and three replicates were collected per treatment. After sampling, the plants were placed in sealed bags and transported to the laboratory. The plants were cleaned and divided into four parts, i.e., roots, stems, leaves, and pods, placed in a drying oven at 105 °C for 30 min and then dried at 80 °C until their masses were constant. The dry mass of each plant was weighed separately to calculate the wet-basis moisture content θ (%) [44] according to the following equation:
where Af is the fresh mass of plant organs and Ad is the dry mass of the plant organ.
2.6. Dry Matter Accumulation, Distribution, and Transport of Mung Bean
The dry mass measured according to 2.5 was used to calculate the stem-sheath storage matter output rate QR (%) and transformation rate CR (%) [42] as follows:
where Eb is the dry mass of the stem sheath at the flowering stage, Em is the dry mass of the stem sheath at maturing, and Ef is the dry mass of seeds at maturing.
2.7. Data Analysis
The experimental data were organized and statistically analyzed using Microsoft Excel 2010, significance analysis was performed using SPSS 25.0, and plotting was performed using Origin 2021.
3. Results
3.1. Nitrogen Fertilizer Utilization and Distribution
When nitrogen fertilizer was applied as 15N urea, 34.75~47.71% of the nitrogen fertilizer was absorbed and utilized by the mung beans (Figure 1b); the accumulation of 15N fertilizer at the maturing stage of mung beans under different fertilizer treatments ranged from 10.01 to 31.28 kg/hm2, and the highest value was achieved in the T1 treatment (Figure 1a). The accumulation of 15N fertilizer in T2~T9 treatment decreased by 12.28~67.99% compared with T1 treatment. However, the utilization of 15N fertilizer in the T2~T9 treatments increased by 12.40~27.17%, showing that organic fertilizer combined with nitrogen fertilizer could improve the utilization of nitrogen fertilizer.
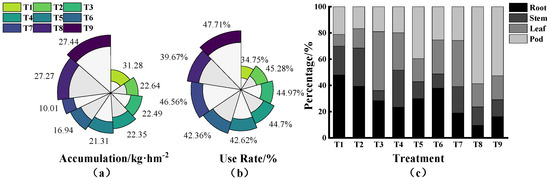
Figure 1.
The 15N fertilizer accumulation, utilization rate, and accumulation percentage in each organ of mung bean relative to the total nitrogen accumulation under different treatments. Note: CK: no fertilizer (0 kg/hm2), T1: nitrogen fertilizer (193.97 kg/hm2), T2: nitrogen fertilizer (107.76 kg/hm2) + humic acid (2000 kg/hm2); T3: nitrogen fertilizer (107.76 kg/hm2) + bio-organic fertilizer (1460 kg/hm2); T4: nitrogen fertilizer (107.76 kg/hm2) + biochar (4706 kg/hm2); T5: nitrogen fertilizer (107.76 kg/hm2) + straw organic fertilizer (3077 kg/hm2); T6: nitrogen fertilizer (86.21 kg/hm2) + humic acid (2500 kg/hm2); T7: nitrogen fertilizer (46.34 kg/hm2) + bio-organic fertilizer (2500 kg/hm2); T8: nitrogen fertilizer (148.17 kg/hm2) + biochar (2500 kg/hm2); T9: nitrogen fertilizer (123.92 kg/hm2) + organic fertilizer (2500 kg/hm2); the same below.
The distribution of 15N fertilizer in each organ of the mung bean plants varied greatly (Figure 1c), and the accumulation of 15N fertilizer across all treatments was 1.90~14.98 kg/hm2 in roots, 1.73~6.88 kg/hm2 in stems, 2.77~10.09 kg/hm2 in leaves, and 2.58~16 kg/hm2 in pods. The 15N fertilizer in roots accounted for 9.51~47.90% of the total nitrogen accumulation; stems accounted for 7.70~29.08%; leaves accounted for 8.85~44.88%; and pods accounted for 16.74~58.67%.
3.2. Nitrogen Fertilizer Residues
The total residual amount of 15N fertilizer in the 0~15 cm soil layer under different treatments was 5.51~16.85 kg/hm2 (Figure 2a), equivalent to 11.45~33.69% of the total 15N fertilizer applied to the soil, and the maximum value was obtained in the T2 treatment. The residual amount in the T3~T9 treatments was 8.57~52.30% lower than that in the T1 treatment. The residual rates of nitrogen fertilizer in the T2~T9 treatments were higher than those in the T1 treatment (Figure 2b), i.e., 33.54~66.28% (p < 0.05) higher in treatments T2~T4, T6, T7, and T9. Compared with T1 treatment, T5 and T8 treatment increased significantly by 0.49% and 3.92%, respectively.

Figure 2.
Total residual amount and total residual rate of 15N fertilizer in 0–15 cm soil under different treatments.
The residual amount of 15N fertilizer in different soil layers reflects the effects of nitrogen fertilizer transport. The residual amount after the mung bean harvest was 1.22~8.20 kg/hm2 in the 0~5 cm soil layer, 0.30~3.50 kg/hm2 in the 5~10 cm soil layer, and 0.30~7.06 kg/hm2 in the 10~15 cm soil layer (Figure 3a). Figure 3b shows the residual amount of 15N in each soil layer as a percentage of the total residual amount. In the 0~5 cm soil layer, the percentage of the total residual amount in the T2~T9 treatments was significantly lower than that in the T1 treatment, i.e., 23.27~85.14% lower (p < 0.05); in the 5~10 cm soil layer, the percentage in the T3 treatment was significantly lower than that in the T1 treatment, i.e., 79.63% lower (p < 0.05), and there was no significant difference among the T1, T8, and T9 treatments. In the T2 and T4~T7 treatments, the percentage was higher than that in the T1 treatment, i.e., 23.30~57.70% higher (p < 0.05); in the 10~15 cm soil layer, the percentage in the T5~T7 treatments was significantly lower than that in the T1 treatment, i.e., 43.32~83.75% lower (p < 0.05). However, compared with T1 treatment, T2~T4, T8, and T9 treatment increased by 42.85~73.44% (p < 0.05).

Figure 3.
The residual amount of 15N fertilizer in each soil layer after the mung bean harvest and the residual amount of 15N fertilizer in each soil layer as a percentage of the total residual nitrogen fertilizer.
3.3. Nitrogen Fertilizer Losses
Figure 4 shows the 15N fertilizer loss rate under different treatments. Across all treatments, the 15N fertilizer loss rates were 21.03~53.89% and the highest value was achieved in the T1 treatment, i.e., 53.89%, which was significantly higher than that in the other treatments (p < 0.05). The order of the 15N fertilizer loss rate of each treatment was T1 > T8 > T5 > T4 > T6 > T9 > T3 > T7 > T2, and in the T2~T9 treatments, it was reduced by 9.99~60.98% compared to the T1 treatment.

Figure 4.
The rate of 15N fertilizer loss under different treatments.
3.4. Effects on Leaf Area and Photosynthetic Potential
The leaf is the main organ for photosynthesis and production [45,46]. Across all treatments, the leaf area first increased and then decreased and peaked at the drumming stage (Figure 5a), and there was no significant difference (p > 0.05) at the seedling and branching stages compared to the CK treatment. However, at the flowering stage, the T2, T4, T6, and T9 treatments increased by 0.17~11.16% compared with the CK treatment, while the T1, T3, T5, T7, and T8 treatments decreased by 7.46~17.85%. At the drumming stage, all treatments were lower than the CK treatment, with a decrease of 11.57~23.75% (p < 0.05).
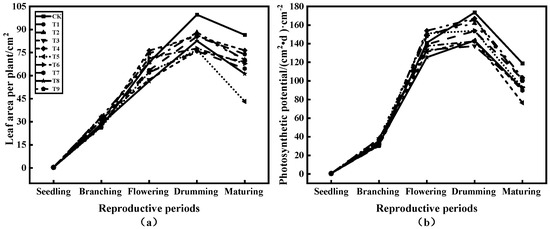
Figure 5.
Leaf area and photosynthetic potential of mung bean plants at different stages.
Photosynthetic potential (Q) is determined by the leaf area index and its duration (Figure 5b) [42]. Its trend was similar to that of the leaf area. At the flowering stage, in the T2, T4, T6, and T9 treatments, the Q was 5.11~9.20% (p < 0.05) higher than that in the CK treatment. In the T1, T3, T5, T7, and T8 treatments, the Q was 1.29~11.10% (p < 0.05) lower than that in the CK treatment. Both the drumming and maturing stages recorded maximum values in the CK treatment, i.e., 173.60 (cm2·d)/cm2 and 118.91 (cm2·d)/cm2, and all treatments decreased by 3.77~20.72% (p < 0.05) at the drumming stage and by 12.94~35.66% (p < 0.05) at the maturing stage compared with the CK treatment.
3.5. Effects on the Wet-Basis Moisture Content
The wet-basis moisture content of roots can show their activity (Figure 6a) [43]. The wet-basis moisture content of roots was lowest at the flowering stage. At the seeding stage, the T2~T9 treatments increased by 4.79~21.47% (p < 0.05) compared with the CK treatment, while the T1 and CK treatments showed no significant difference. At the branching stage in the T1 and T4~T6 treatments, the moisture content increased by 2.66~8.07% compared with the CK treatment, while the T2, T8, and CK treatments showed no significant difference. However, the T3, T7, and T9 treatments decreased compared to the CK treatment. At the flowering stage, the T2, T6, and T7 treatments were 1.29~12.04% higher than the CK treatment, and the T1, T3, T4, T8, and T9 treatments showed a decreasing trend compared with the CK treatment. The T5 and CK treatments were not significantly different. At the maturing stage, compared with the CK treatment, except for the T8 treatment, the wet-basis moisture content of the other treatments increased by 1.64~12.12%.

Figure 6.
Variation in the wet-basis water content of each organ of the mung bean plant.
The wet-basis moisture content of the stem decreased slowly from the seedling stage to the flowering stage, increased slowly from the flowering stage to the drumming stage, and decreased rapidly from the drumming stage to the maturing stage. All treatments showed consistent trends (Figure 6b). The moisture content at the seedling stage in the T2, T3, T4, T5, and T8 treatments, at the branching stage in the T1, T2, T3, T4, T5, and T6 treatments, at the flowering stage in the T6 and T7 treatments, and at the drumming stage in the T1, T2, T4, T6, and T7 treatments was not significantly different from that in the CK treatment. However, at the maturing stage, the T1, T3, T4, T5, T6, and T7 treatments were 13.87~58.74% (p < 0.05) higher than the CK treatment.
From the seedling to the branching stage, the wet-basis moisture content of the leaves increased, except in the T8 treatment (Figure 6c). However, from the branching to the flowering stage, all treatments decreased, while the T2 and T6 treatments decreased significantly, by 34.21% (p < 0.05) and 32.93% (p < 0.05), respectively. Across all treatments, the wet-basis moisture content increased from the flowering to the drumming stage, while the T2 and T6 treatments increased significantly, by 49.09% (p < 0.05) and 40% (p < 0.05), respectively. However, all treatments decreased from the drumming to the maturing stage. Compared to the CK treatment, the seedling stage in the T3~T9 treatments was increased significantly by 2.29~19.41% (p < 0.05), while the branching stage in the T1, T3~T6, and T8 treatments, the flowering stage in the T1, T3~T5, and T8 treatments, and the drumming stage in the T1~T6, T8, and T9 treatments were not significantly different.
The wet-basis moisture content of the pods is shown in Figure 6d. At the flowering stage, in the T1 and CK treatments, there was no significant difference. The drumming stage in the T1, T2, T4, and T5 treatments was increased by 12.04% (p < 0.05), 15.52% (p < 0.05), 11.45% (p < 0.05), and 4.47% (p > 0.05), respectively, compared to the CK treatment. The maturing stage in the T1 and T4 treatments was significantly higher than that in the CK treatment, with increases of 0.88% (p < 0.05) and 12.62% (p < 0.05), respectively.
3.6. Effects on Dry Matter Output, Transformation Rate, and Accumulation
The output percentage of stem-sheath storage matter was higher than the transformation rate (Figure 7a), and all treatments were lower than the CK treatment. In the T6 and T9 treatments, the output rate of the stem-sheath storage matter and transformation rate were significantly higher than those in the T1 treatment (p < 0.05), which increased by 47.02% and 33% and by 25.43% and 9.51%, respectively. However, in the T2~T5 and T7 treatments, the output rate of the stem-sheath storage matter and transformation rate were significantly lower than those in the T1 treatment (p < 0.05), which decreased by 29.71~84.30% and by 14.87~88.36%, respectively. The dry-matter accumulation is shown in Figure 7b. The T1 and T9 treatments was 27.72% (p < 0.05) and 5.10% higher than the CK treatment. The T2, T3, T4, and T5 treatments were not significant compared with the CK treatment, while T6~T8 treatments were significantly lower than that in the CK treatment, with decreases of 33.26% (p < 0.05), 16.45% (p < 0.05), and 19.07% (p < 0.05), respectively.
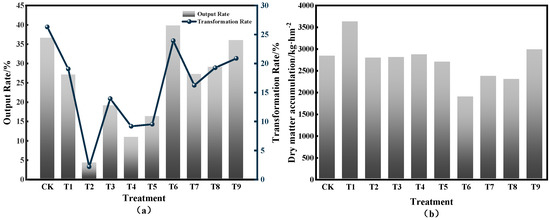
Figure 7.
Changes in output, transformation rate, and dry-matter accumulation of mung bean plants by treatment.
4. Discussions
4.1. Effects on Nitrogen Fertilizer Utilization, Residues, and Losses
The commonly referred to nitrogen fertilizer utilization is only a single representation of the total nitrogen utilization during the growth of mung beans. In this study, with the use of the 15N-tracer technique, marked 15N urea was applied to the soil together with organic fertilizer, overcoming the disadvantage of the traditional calculation method of fertilizer utilization, which only represents the nitrogen utilization rate of the crop during the whole growth period. The accumulation and distribution of nitrogen in mung bean plants under different organic fertilizers with nitrogen fertilizers were studied to provide a basis for accurately describing the utilization of fertilizer nitrogen by mung beans under different treatments throughout the reproductive period. The experimental results showed that the total nitrogen utilization rate of mung bean plants with different organic fertilizers with nitrogen fertilizer treatments ranged from approximately 39.67 to 47.71% and was higher than that of the normal fertilizer treatments, and nitrogen reduction with organic fertilizer improved the fertilizer utilization efficiency. Yu et al. [46] and Zhou et al. [47] showed that the rational application of nitrogen fertilizer can improve nitrogen fertilizer utilization and promote crop growth compared with normal fertilizer application. The total residual rate of mung bean plants with different organic fertilizer with nitrogen fertilizer treatments in 0~15 cm soil ranged from approximately 11.42 to 33.69%, and the residual rate of organic fertilizer with nitrogen fertilizer treatments was generally higher than that of the normal fertilizer treatments. The test results are consistent with the findings of Zhang et al. [48] but slightly higher than those of Chen et al. [49], which may be due to the climatic soil in black soil areas having a strong fertilizer retention capacity, so fertilizers have higher residual rates in black soils [50]; on the other hand, it may be caused by the different crops grown and different types of fertilizer application. In this study, the loss rate of normal fertilizer application reached 53.89%, and the loss rate of organic fertilizer with nitrogen fertilizer ranged from approximately 21.03 to 48.51%, indicating that organic fertilizer with nitrogen fertilizer can significantly reduce the loss rate of nitrogen fertilizer, and this result is the same as that of Chen et al. [51]. This experiment only studied the utilization, residual, and loss of nitrogen fertilizer under treatments with different amounts of organic fertilizer with nitrogen fertilizer, and some nitrogen fertilizer losses through gaseous emissions, such as ammonia volatilization and nitrification–denitrification, need to be further investigated.
4.2. Effect on Leaf Area
The leaf is an important organ for photosynthesis to produce organic matter for plant growth and is also an important indicator to determine whether the crop can be highly productive [52,53]. Many previous studies were conducted on the effect of organic fertilizers on leaf area, showing that these fertilizers can partially replace chemical fertilizers to promote leaf growth [54]. Ma et al. [55] found that the leaf area of wheat with organic fertilizer combined with compound fertilizer at the flowering stage was significantly higher than that with compound fertilizer alone and without fertilizer treatment under the same moisture conditions in a study on the effect of different fertilizer and moisture treatments on the leaf area of wheat. In this study, we found that the leaf area from the seedling stage to the drumming stage showed an increasing trend as the crop progressed throughout the growth period and a decreasing trend after the drumming stage, reaching a maximum at the drumming stage, and the leaf area of the T9, T2, and T4 treatments increased most significantly at the seedling, branching, and flowering stages compared to the control (CK) in the same period, by 31.82%, 23.18%, and 11.16%, respectively. The leaf area of each treatment at the drumming and maturing stages was lower than that of the control (CK) treatment, indicating that the leaves gradually senesced after the flowering stage and that there were fewer new leaves. The results of this study are similar to those of Guo et al. [56] and Li et al. [57], indicating that organic fertilizer application can effectively promote leaf growth and improve the photosynthetic capacity of the crop, thus, ensuring stable and increased crop yield.
4.3. Effect on the Wet-Basis Moisture Content
The main parts of mung bean plants include the root, stem, leaf, and pod. The dry-matter accumulation of each organ can be observed by the wet-basis water content of each organ. However, most of the previous work used the wet-basis water content to express the water changes in plant organs. In this experiment, we studied the changes in the wet-basis water content of each organ of the mung bean plants by applying different organic fertilizers. The results showed that, in all stages, the wet-basis moisture content of the roots first decreased and then increased. From the seedling to the flowering stage and from the flowering to the maturing stage, the moisture content increased, and the lowest value was recorded at the flowering stage. The results of this study are consistent with those of Wei et al. [43], probably because the late root growth of the mung bean plant basically stopped but its water absorption did not. As an important channel for transferring and transporting water and nutrients above and below ground, the water content variation and morphological characteristics of the stem play an important role in crop growth and yield formation [58]. This study showed that at all stages, all treatments first decreased and then decreased due to the assimilates being transferred to the seeds as the stems senesced, and the increasing maturation of the seeds reflected a significant decrease in the wet-basis water content [59]. The wet-basis water content of the leaves showed a bimodal curve for each treatment from meristem to maturation, and the results of the study are similar to those of Sun et al. [60], indicating that nutrient transfer from the leaves to the pods began after the flowering stage, and after the drumming stage, the leaves continued to die and the nutrient fraction was transferred to the seeds.
4.4. Effect on the Photosynthetic Potential and Dry Mass
Mung bean yield formation is essentially a process of photosynthetic material production assimilation, and photosynthetic production capacity and assimilation capacity determine the yield; the photosynthetic potential and dry-matter accumulation are usually used to reflect the photosynthetic production assimilation capacity [61]. In this study, we found that the photosynthetic potential was the lowest at the seedling stage and highest at the drumming stage; from the seedling to the drumming stage, it increased, and from the bulging to the maturing stage, it decreased, while it reached the maximum at the drumming stage, and the changes were consistent among treatments. The photosynthetic potential of the T9, T4, and T2 treatments increased most significantly compared to the control (CK) at the seedling, branching, and flowering stages, with increases of 31.82%, 22.77%, and 9.20%, respectively. However, at the drumming and maturing stages, all treatments were lower than the CK treatment, mainly because the leaves turned yellow and fell off after the drumming stage, which is consistent with the results of Zhang et al. [62], indicating that the application of organic fertilizer increases the photosynthetic potential. Dry-matter accumulation and distribution are the basis of crop yield formation and the key to various agronomic measures to regulate seed yield [63]. In this study, we found that the dry-matter accumulation of T1, T4, and T9 treatments increased, and at all stages, the output percentage of the stem-sheath storage matter was higher than the transformation rate, indicating that the higher the dry-matter accumulation, the higher the crop yield and the better the quality, similar to the results of Xu et al. [64], who showed that the application of organic fertilizer can improve the stem-sheath storage matter output, transformation rate, and dry-matter accumulation, which can eventually lay the foundation for improving the mung bean yield.
5. Conclusions
In the process of mung bean planting, different organic fertilizers combined with nitrogen fertilizer can decrease the loss of nitrogen fertilizer and increase the absorption and utilization of nitrogen fertilizer. The total nitrogen fertilizer was 34.75~47.71%, the total residual rate was 11.42~33.69%, and the loss rate was 21.03~53.89%. All treatment utilization and residual rates were higher than those of the T1 treatment, and the loss rate was lower than that of the T1 treatment. From the seedling to the flowering stage, the total leaf area and photosynthetic potential in the T9 treatment increased significantly compared to those in the CK treatment. In the T9 treatment, the total wet-basis water content of each organ was higher than that in the other treatments at the seedling and flowering stages. The output rate of the stem-sheath storage matter and the transformation rate in the T9 treatment were significantly higher than those in the T1 treatment. Thus, organic fertilizer with nitrogen fertilizer promoted crop growth and decreased the amount of fertilizer residue and loss in the soil. Comprehensive analysis based on the experiment showed that T9 was the better fertilization treatment.
Author Contributions
Conceptualization, E.Z. and Y.Z.; methodology, M.L.; software, Y.Z.; validation, M.Q.; investigation, Y.Z.; data curation, Y.Z.; writing—original draft preparation, E.Z. and Y.Z.; writing—review and editing, P.C.; supervision, Z.Q.; project administration, E.Z.; funding acquisition. All authors have read and agreed to the published version of the manuscript.
Funding
This work was jointly supported by the Basic Scientific Research Fund of the Heilongjiang Provincial Universities (2020-KYYWF-1042).
Data Availability Statement
Not applicable.
Conflicts of Interest
The authors declare no conflict of interest.
References
- Li, S.; Lei, Y.D.; Zhang, Y.Y.; Liu, J.G.; Shi, X.Y.; Jia, H.; Wang, C.; Chen, F.; Chu, Q.Q. Rational Trade-Offs between Yield Increase and Fertilizer Inputs Are Essential for Sustainable Intensification: A Case Study in Wheat–Maize Cropping Systems in China. Sci. Total Environ. 2019, 679, 328–336. [Google Scholar] [CrossRef]
- Chen, P.; Nie, T.Z.; Chen, S.H.; Zhang, Z.X.; Qi, Z.J.; Liu, W.N. Recovery Efficiency and Loss of 15N-Labelled Urea in a Rice-Soil System under Water Saving Irrigation in the Songnen Plain of Northeast China. Agric. Water Manag. 2019, 222, 139–153. [Google Scholar] [CrossRef]
- Ji, Y.; Liu, H.; Shi, Y. Will China’s Fertilizer Use Continue to Decline? Evidence from Lmdi Analysis Based on Crops, Regions and Fertilizer Types. PLoS ONE 2020, 15, e0237234. [Google Scholar] [CrossRef] [PubMed]
- Tian, H.Q.; Lu, C.Q.; Melillo, J.; Ren, W.; Huang, Y.; Xu, X.F.; Liu, M.L.; Zhang, C.; Chen, G.S.; Pan, S.F. Food Benefit and Climate Warming Potential of Nitrogen Fertilizer Uses in China. Environ. Res. Lett. 2012, 7, 044020. [Google Scholar] [CrossRef]
- Liu, Q.; Xu, H.W.; Yi, H.J. Impact of Fertilizer on Crop Yield and C: N: P Stoichiometry in Arid and Semi-Arid Soil. Int. J. Environ. Res. Public Health 2021, 18, 4341. [Google Scholar] [CrossRef]
- Gosal, S.; Gill, G.; Sharma, S.; Walia, S. Soil Nutrient Status and Yield of Rice as Affected by Long-Term Integrated Use of Organic and Inorganic Fertilizers. J. Plant Nutr. 2018, 41, 539–544. [Google Scholar] [CrossRef]
- Chen, Y.T.; Hu, S.Y.; Guo, Z.G.; Cui, T.H.; Zhang, L.P.; Lu, C.R.; Yu, Y.Q.; Luo, Z.B.; Fu, H.; Jin, Y. Effect of Balanced Nutrient Fertilizer: A Case Study in Pinggu District, Beijing, China. Sci. Total Environ. 2021, 754, 142069. [Google Scholar] [CrossRef]
- Yang, Y.R.; He, Y.C.; Li, Z.L. Social Capital and the Use of Organic Fertilizer: An Empirical Analysis of Hubei Province in China. Environ. Sci. Pollut. Res. 2020, 27, 15211–15222. [Google Scholar] [CrossRef]
- Li, W.C.; Guo, S.F.; Liu, H.B.; Zhai, L.M.; Wang, H.Y.; Lei, Q.L. Comprehensive Environmental Impacts of Fertilizer Application Vary among Different Crops: Implications for the Adjustment of Agricultural Structure Aimed to Reduce Fertilizer Use. Agric. Water Manag. 2018, 210, 1–10. [Google Scholar] [CrossRef]
- Zhang, G.H.; Yang, Y.; Liu, Y.N.; Wang, Z.Q. Advances and Prospects of Soil Erosion Research in the Black Soil Region of Northeast China. J. Soil Water Conserv. 2022, 36, 1–12. [Google Scholar]
- Zheng, E.N.; Zhu, Y.H.; Hu, J.Y.; Meng, F.X.; Zhang, G.; Xu, T.Y. Coupling of Water and Fertilizer Methods on Growth of Rice, Soil Respiration and Inorganic Nitrogen. Trans. Chin. Soc. Agric. Mach. 2021, 52, 272–279. [Google Scholar]
- Gao, W.; Wang, L.F.; Jia, Z.J. Changes in Community Assembly of Microbiomes in Black Soil under Distinct Scenarios of Long-Term Field Fertilizatio. J. Ecol. Rural Environ. 2021, 37, 1437–1448. [Google Scholar]
- Chen, X.J.; Zeng, D.; Xu, Y.; Fan, X.J. Perceptions, Risk Attitude and Organic Fertilizer Investment: Evidence from Rice and Banana Farmers in Guangxi, China. Sustainability 2018, 10, 3715. [Google Scholar] [CrossRef]
- Lin, S.F.; Pi, Y.J.; Long, D.Y.; Duan, J.J.; Zhu, X.T.; Wang, X.L.; He, J.; Zhu, Y.H. Impact of Organic and Chemical Nitrogen Fertilizers on the Crop Yield and Fertilizer Use Efficiency of Soybean–Maize Intercropping Systems. Agriculture 2022, 12, 1428. [Google Scholar] [CrossRef]
- Zhuang, Y.H.; Ruan, S.H.; Zhang, L.; Chen, J.R.; Li, S.S.; Wen, W.J.; Liu, H.B. Effects and Potential of Optimized Fertilization Practices for Rice Production in China. Agron. Sustain. Dev. 2022, 42, 32. [Google Scholar] [CrossRef]
- Shrestha, P.; Small, G.E.; Kay, A. Quantifying Nutrient Recovery Efficiency and Loss from Compost-Based Urban Agriculture. PLoS ONE 2020, 15, e0230996. [Google Scholar] [CrossRef]
- Miao, Y.X.; Stewart, B.A.; Zhang, F.S. Long-Term Experiments for Sustainable Nutrient Management in China. A Review. Agron. Sustain. Dev. 2011, 31, 397–414. [Google Scholar] [CrossRef]
- Zheng, L.H.; Pei, J.B.; Jin, X.X.; Schaeffer, S.; An, T.T.; Wang, J.K. Impact of Plastic Film Mulching and Fertilizers on the Distribution of Straw-Derived Nitrogen in a Soil-Plant System Based on 15n–Labeling. Geoderma 2018, 317, 15–22. [Google Scholar] [CrossRef]
- Zheng, E.; Qin, M.; Zhang, Z.; Xu, T. Humic Acid Fertilizer Incorporation Increases Rice Radiation Use, Growth, and Yield: A Case Study on the Songnen Plain, China. Agriculture 2022, 12, 653. [Google Scholar] [CrossRef]
- Wang, H.X.; Xu, J.L.; Liu, X.J.; Zhang, D.; Li, L.W.; Li, W.; Sheng, L.X. Effects of Long-Term Application of Organic Fertilizer on Improving Organic Matter Content and Retarding Acidity in Red Soil from China. Soil Tillage Res. 2019, 195, 104382. [Google Scholar] [CrossRef]
- Wan, L.J.; Tian, Y.; He, M.; Zheng, Y.Q.; Lyu, Q.; Xie, R.J.; Ma, Y.Y.; Deng, L.; Yi, S.L. Effects of Chemical Fertilizer Combined with Organic Fertilizer Application on Soil Properties, Citrus Growth Physiology, and Yield. Agriculture 2021, 11, 1207. [Google Scholar] [CrossRef]
- Chen, P.; Xu, J.Z.; Zhang, Z.X.; Wang, K.C.; Li, T.C.; Wei, Q.; Li, Y.W. Carbon Pathways in Aggregates and Density Fractions in Mollisols under Water and Straw Management: Evidence from 13C Natural Abundance. Soil Biol. Biochem. 2022, 169, 108684. [Google Scholar] [CrossRef]
- Li, Y.; Fang, F.; Wei, J.L.; Wu, X.B.; Cui, R.Z.; Li, G.S.; Zheng, F.L.; Tan, D.S. Humic Acid Fertilizer Improved Soil Properties and Soil Microbial Diversity of Continuous Cropping Peanut: A Three-Year Experiment. Sci. Rep. 2019, 9, 12014. [Google Scholar] [CrossRef] [PubMed]
- Hu, Y.W.; Li, Q.K.; Song, C.J.; Jin, X.H. Effect of Humic Acid Combined with Fertilizer on the Improvement of Saline-Alkali Land and Cotton Growth. Appl. Ecol. Environ. Res. 2021, 19, 1279–1294. [Google Scholar] [CrossRef]
- Ye, L.; Zhao, X.; Bao, E.C.; Li, J.S.; Zou, Z.R.; Cao, K. Bio-Organic Fertilizer with Reduced Rates of Chemical Fertilization Improves Soil Fertility and Enhances Tomato Yield and Quality. Sci. Rep. 2020, 10, 177. [Google Scholar] [CrossRef]
- Zhang, M.L.; Geng, Y.H.; Cao, G.J.; Zou, X.; Qi, X.Y.; Stephano, M.F. Effect of Magnesium Fertilizer Combined with Straw Return on Nitrogen Use Efficiency. Agron. J. 2021, 113, 345–357. [Google Scholar] [CrossRef]
- Chen, D.Y.; Shao, X.H.; Yu, J.; Liu, X.; Yuan, Y.B.; Su, X.K. Influence of Em Bio-Organic Fertilizer on Plant Growth and Photosynthetic Characteristics of Flue-Cured Tobacco (Nicotiana Tabacum). J. Food Agric. Env. 2012, 10, 1066–1070. [Google Scholar]
- Wei, Z.B.; Ying, H.; Guo, X.W.; Zhuang, M.H.; Cui, Z.L.; Zhang, F.S. Substitution of Mineral Fertilizer with Organic Fertilizer in Maize Systems: A Meta-Analysis of Reduced Nitrogen and Carbon Emissions. Agronomy 2020, 10, 1149. [Google Scholar] [CrossRef]
- Ma, X.M.; Li, H.X.; Xu, Y.; Liu, C.S. Effects of Organic Fertilizers Via Quick Artificial Decomposition on Crop Growth. Sci. Rep. 2021, 11, 3900. [Google Scholar] [CrossRef]
- Liu, X.Y.; Wang, H.D.; Liu, C.; Sun, B.B.; Zheng, J.F.; Bian, R.J.; Drosos, M.; Zhang, X.H.; Li, L.Q.; Pan, G.X. Biochar Increases Maize Yield by Promoting Root Growth in the Rainfed Region. Arch. Agron. Soil Sci. 2021, 67, 1411–1424. [Google Scholar] [CrossRef]
- Kimani, S.M.; Bimantara, P.O.; Kautsar, V.; Tawaraya, K.; Cheng, W. Poultry Litter Biochar Application in Combination with Chemical Fertilizer and Azolla Green Manure Improves Rice Grain Yield and Nitrogen Use Efficiency in Paddy Soil. Biochar 2021, 3, 591–602. [Google Scholar] [CrossRef]
- Xin, X.L.; Qin, S.W.; Zhang, J.B.; Zhu, A.N.; Yang, W.L.; Zhang, X.F. Yield, Phosphorus Use Efficiency and Balance Response to Substituting Long-Term Chemical Fertilizer Use with Organic Manure in a Wheat-Maize System. Field Crops Res. 2017, 208, 27–33. [Google Scholar] [CrossRef]
- Yin, L.L.; Zhang, M.L.; Wu, R.G.; Chen, X.L.; Liu, F.; Xing, B.L. Genome-Wide Analysis of Osca Gene Family Members in Vigna Radiata and Their Involvement in the Osmotic Response. BMC Plant Biol. 2021, 21, 408. [Google Scholar] [CrossRef]
- Alene, A.A.; Raffi, M.M.; Tiruneh, K.J. Phosphorus Use Efficiency, Yield and Nodulation of Mung Bean (Vigna Radiata L.) as Influenced by the Rate of Phosphorus and Rhizobium Strains Inoculation in Metema District, Ethiopia. J. Plant Nutr. 2020, 44, 1300–1315. [Google Scholar] [CrossRef]
- Ranawake, A.; Dahanayaka, N.; Amarasingha, U.; Rodrigo, W.; Rodrigo, U. Effect of Water Stress on Growth and Yield of Mung Bean (Vigna Radiata L.). Trop. Agric. Res. Ext. 2011, 14, 76–79. [Google Scholar] [CrossRef]
- Ding, W.; Xing, B.L.; Wan, G.M. Dry Matter Accumulation Dynamics and Distribution Law of Mung Bean Organs in Different Growth Stages. J. Shanxi Agric. Sci. 2020, 48, 1589–1596. [Google Scholar]
- Wang, G.J.; Xu, Z.W.; Li, Y. Effects of Biochar and Compost on Mung Bean Growth and Soil Properties in a Semi-Arid Area of Northeast China. Int. J. Agric. Biol. 2016, 18, 1056–1060. [Google Scholar] [CrossRef]
- Zhang, Z.X.; Chen, P.; Chen, S.H.; Shang, W.B.; Hou, J.X. Effects of Water-Saving Irrigation on Residues of Different Periods Fertilizer Nitrogen in Black Soils. Trans. Chin. Soc. Agric. Mach. 2018, 49, 240–250. [Google Scholar]
- Zhang, Z.X.; Chen, P.; Chen, S.H.; Zheng, E.N.; Nie, T.Z.; Liu, M. 15n Tracer-Based Analysis of Water and Nitrogen Management Differences in Uptake and Partitioning of N Applied at Different Growth Stages in Transplanted Rice. Trans. Chin. Soc. Agric. Mach. 2018, 49, 309–317+346. [Google Scholar]
- Yang, G.Z.; Chu, K.Y.; Tang, H.Y.; Nie, Y.C.; Zhang, X.L. Fertilizer 15N Accumulation, Recovery and Distribution in Cotton Plant as Affected by N Rate and Split. J. Integr. Agric. 2013, 12, 999–1007. [Google Scholar] [CrossRef]
- Wei, Y.X.; Shi, X.G.; Feng, C.; Wu, Y.; Liu, H. Effects of Applying Biochar on Soil Comprehensive Fertility and Soybean Growth in Black Soil Area. Trans. Chin. Soc. Agric. Mach. 2020, 51, 285–294. [Google Scholar]
- Wei, Y.X.; Ru, C.; Wu, Y.; Liu, H.; Yang, M.J. Response of Photosynthate Production Characteristics of Rice to Water Consumption Process in Black Soil Region. Trans. Chin. Soc. Agric. Mach. 2019, 50, 263–274+284. [Google Scholar]
- Wei, Y.X.; Ma, Y.Y.; Liu, H.; Zhang, Y.H.; Yang, M.J.; Zhang, Y. Effects of Soil Water, Plant, Water Saving and Yield Increasing of Maize under Regulated Deficit Drip Irrigation. Trans. Chin. Soc. Agric. Mach. 2018, 49, 252–260. [Google Scholar]
- Huo, Z.Y.; Yao, Y.; Zhang, H.C.; Xia, Y.; Ni, X.C.; Dai, Q.G.; Xu, K.; Wei, H.Y. Effect of Sowing Date on Characteristics of Photosynthesis and Matter Production of Direct Seeding Rice. Sci. Agric. Sin. 2012, 45, 2592–2606. [Google Scholar]
- Duan, Y.H.; Li, Z.H.; Lu, F. Effect of Different Field Configuration Methods on Photosyntheticcharacteristics and Dry Matter Accumulation of Dwarf Glutinous Sorghum. J. Shanxi Agric. Univ. (Nat. Sci. Ed.) 2020, 40, 54–61. [Google Scholar]
- Yu, C.X.; Zhang, L.L.; Yang, L.J.; Wu, K.K.; Li, W.T.; Song, Y.C.; Li, D.P.; Wu, Z.J. Combining N-Inhibitor and Chicken Manure with Reduced N Fertilizer to Improve the Conversion and Utilization of Fertilizer N in a Paddy Soil. J. Plant Nutr. Fertil. 2021, 27, 1581–1591. [Google Scholar]
- Zhou, T.Y.; Chen, L.; Wang, W.L.; Xu, Y.J.; Zhang, W.Y.; Zhang, H.; Liu, L.J.; Wang, Z.Q.; Gu, J.F.; Yang, J.C. Effects of Application of Rapeseed Cake as Organic Fertilizer on Rice Quality at High Yield Level. J. Sci. Food Agric. 2021, 102, 1832–1841. [Google Scholar] [CrossRef]
- Zhang, M.; Yao, Y.L.; Tian, Y.H.; Ceng, K.; Zhao, M.; Zhao, M.; Yin, B. Increasing Yield and N Use Efficiency with Organic Fertilizer in Chinese Intensive Rice Cropping Systems. Field Crops Res. 2018, 227, 102–109. [Google Scholar] [CrossRef]
- Chen, Y.; Tang, X.; Yang, S.M.; Wu, C.Y.; Wang, J.Y. Contributions of Different N Sources to Crop N Nutrition in a Chinese Rice Field. Pedosphere 2010, 20, 198–208. [Google Scholar] [CrossRef]
- Wang, Q.J.; Liu, F.; Jiao, F.; Sun, B.; Guo, Z.Y.; Chang, B.C.; Zhang, J.S.; Gao, Z.C.; Jiang, H. Effect on Improving Mollisol Paddy Soil and Saline Meadow Soil by Continuous Deep Ploughing. Trans. Chin. Soc. Agric. Eng. 2017, 33, 152–158. [Google Scholar]
- Chen, Q.; Liu, Z.X.; Xing, Y.; Wu, X.X.; Ge, S.F.; Jiang, Y.M. Effects of Split Combined Application of Organic-Inorganic Fertilizers on Plant Growth, 15N Absorption, Utilization and Loss of Gala Apple Tree. J. Appl. Ecol. 2019, 30, 1367–1372. [Google Scholar]
- Ji, Y.K.; Guo, Z.S.; Tian, W.; Zhai, S.J.; Huang Fu, Z.Q.; Wu, J.H. Effects of Different Kinds of Slow/Controlled-Release Fertilizers on the Yield and Quality of Intercropped Peanuts. J. Henan Agric. Sci. 2021, 50, 1–12. [Google Scholar]
- Zhang, Y.C.; Liang, G.L.; Qin, Y.; Liu, W.H.; Jia, Z.F.; Liu, Y.; Ma, X. Characteristics of Chlorophyll and Photosynthesis in Leaves and Their Response to Nutrients during Aging of Elymus Sibiricus. Acta Prataculturae Sin. 2022, 31, 229–237. [Google Scholar]
- Li, P.P.; Lin, Y.F.; Hu, Y.G. Effects of Compound Application of Organic and Chemical Fertilizers on Growth, Quality of Tea Plants and Soil Nutrient. Trans. Chin. Soc. Agric. Mach. 2015, 46, 64–69. [Google Scholar]
- Ma, S.C.; Zhang, X.C.; Duan, A.W.; Yang, S.J.; Sun, J.S. Regulated Deficit Irrigation Effect of Winter Wheat under Different Fertilization Treatments. Trans. Chin. Soc. Agric. Eng. 2012, 28, 139–143. [Google Scholar]
- Guo, Z.Q.; Xiao, G.J.; Li, X.J.; Hu, Y.B. Effects of Different Soil Organic Carbon Contents on Photosynthetic Physiology and Growth of Maize. Agric. Res. Arid Areas 2022, 40, 238–246. [Google Scholar]
- Li, Q.S.; Wang, D.Q.; Du, C.Y.; Wang, Y.; Gao, K.; Wang, G.; Wang, S.Q. Effect of Combined Application of Organic and Inorganic Fertilizers and Biochar on the Growth and Development of Flue-Cured Tobacco and Leaf Quality. Chin. J. Soil Sci. 2021, 56, 1393–1401. [Google Scholar]
- Wei, Y.X.; Hou, J.X.; Wu, Y.; Liu, H.; Ru, C.; Wang, B. Effects of Dry Direct Seeding on Water Distribution and Lodging Resistance of Rice Plants. Trans. Chin. Soc. Agric. Mach. 2019, 50, 227–241. [Google Scholar]
- Yao, S.J.; Du, G.Y.; Mou, H.M.; Luan, X.Y.; Ma, H.Y.; Liu, J.N.; Liu, M.D.; Qi, X.; He, J.Q. Detection of Water Distribution and Dynamics in Body of Winter Wheat Based on Nuclear Magnetic Resonance. Trans. Chin. Soc. Agric. Eng. 2014, 30, 177–186. [Google Scholar]
- Sun, J.Y.; Cao, H.X.; Huang, Y. Correlation between Canopy Spectral Vegetation Index and Leaf Stomatal Conductance in Rapeseed (Brassica Napus L.). Acta Agron. Sin. 2009, 35, 1131–1138. [Google Scholar] [CrossRef]
- Jiang, Y.; Zhao, C.; Liu, G.M.; Zhao, L.T.; Wang, W.L.; Huo, Z.Y. Characteristics of Rice Yield Formation and Annual Economic Benefit under Stable Rice Integrative Cultivation Mode. China Rice 2021, 27, 23–28. [Google Scholar]
- Zhang, L.; Wei, J.J.; Zhang, Z.Q. Research on Yield and Physiological Indexes of High Yielding Soybean Variety “Xindadou 1” under Different Fertilization. Xinjiang Agric. Sci. 2010, 47, 1958–1962. [Google Scholar]
- Shi, X.K.; Yu, Z.W.; Zhao, J.Y.; Shi, Y.; Wang, X.Z. Effect of Nitrogen Application Rateon Photosynthetic Characteristics, Dry Matter Accululation and Distribution and Yield of High-Yielding Winter Wheat. J. Triticeae Crops 2021, 41, 713–721. [Google Scholar]
- Xu, L.Q.; Guo, X.H.; Lan, Y.C.; Cui, Z.Y.; Zhang, J.N.; Lǚ, Y.D. Effects of Different Organic Fertilizers on Dry Matter Accumulation and Yield of Dry Direct-Seeding Rice. Acta Agric. Boreali-Sin. 2021, 36, 188–195. [Google Scholar]
Disclaimer/Publisher’s Note: The statements, opinions and data contained in all publications are solely those of the individual author(s) and contributor(s) and not of MDPI and/or the editor(s). MDPI and/or the editor(s) disclaim responsibility for any injury to people or property resulting from any ideas, methods, instructions or products referred to in the content. |
© 2023 by the authors. Licensee MDPI, Basel, Switzerland. This article is an open access article distributed under the terms and conditions of the Creative Commons Attribution (CC BY) license (https://creativecommons.org/licenses/by/4.0/).