Abstract
Soybean is a legume widely cultivated globally for its seeds, which are rich in oil and protein suitable for animal and human nutrition, and as a biofuel source. One of the main factors that limits production is soil salinity; currently there are an estimated 800 million hectares of agricultural land affected by salt stress worldwide. The aim of this research was to determine whether anatomical, morphological, nutritional, physiological, and biochemical parameters are negatively affected in soybean plants cultivated under different levels of salt stress. The experiment was randomized into five treatments (0, 50, 100, 150, and 200 mM Na+). Plants subjected to concentrations of 50 to 200 mM Na+ exhibited reductions in K (range 21% to 57%), Ca (range 38% to 63%), and Mg (range 20% to 41%) compared to controls (without Na+). Na+ stress progressively produced negative effects on photosynthetic machinery, gas exchange, and photosynthetic pigments, results clearly related to oxidative stress generated by the saline growth conditions. Interestingly, our study revealed that at concentrations up to 100 mM Na+ deposition of epicuticular wax occurred, the quantity and shape of the stomata changed, and the thickness of the leaf epidermis increased. Our broad-based, multidisciplinary, and comparative study proved that soybean plants suffer significant deleterious effects modulated by Na+ stress, mainly at concentrations above 100 mM Na+.
1. Introduction
Soybean (Glycine max (L.) Merr.) is one of the most important crops in the world because its seeds are rich in oils and proteins [1] that can be used in foods, animal feed [2], and as an energy source in biofuels [3]. Global production is estimated at approximately 338 million tons, with the United States being the main producer, followed by Brazil and Argentina. However, one of the main factors limiting soybean cultivation is soil salinity [4], a matter of increasing importance since approximately 800 million hectares of land are affected by this environmental problem.
Salinity is one of the main forms of abiotic stress, occurring mainly in arid and semi-arid regions that experience low precipitation and high evapotranspiration [5]. However, anthropogenic factors may exacerbate and potentiate salt accumulation via inadequate irrigation, poorly drained soils, and overuse of fertilizers and pesticides [6]. Among the salts that accumulate in soils and which are harmful to agricultural crops, NaCl stands out, and in recent years it has been the focus of numerous studies on its effects on plants [7,8,9,10].
Soil salinity tends to cause the accumulation of Na+ ions inside plant cell vacuoles [11]. This causes an osmotic imbalance by decreasing the soil water potential and reducing a plant’s ability to take up water [12], making the Na+ potentially toxic through metabolic disturbance [13]. Furthermore, the osmotic pressure caused by excess Na+ in the growth regions adversely affects ionic balance, delaying the transport and accumulation of macro- and micronutrients in plant tissues [4]. Stress arising from raised Na+ concentration is often accompanied by the replacement of K+ by Na+ in cytosol, and since K+ acts as an enzymatic cofactor and is involved in protein synthesis this may alter biochemical reactions and protein conformation [14].
Plants develop morphological, physiological, biochemical, and anatomical strategies to tolerate salt stress, including the selective exclusion of ions, ionic accumulation in root structures that reduces ion transport to leaves, compartmentalization of ions in vacuoles, biosynthesis of osmoregulators, modulation in gas exchange, and increasing the activities of antioxidant enzymes [15,16].
Na+ stress can be classified as mild, moderate, or severe, depending on exposure time and salt concentration. Plants exposed to mild and moderate Na+ concentrations exhibit structural changes in leaf epidermis, more specifically an increase in leaf hairiness [17] and epicuticular wax accumulation [18], as a strategy to prevent damage connected to light and temperature as well as to avoid excessive transpiration through stomata guard cells [19]. Severe Na+ exposure induces ionic toxicity and overaccumulation of ROS, causing oxidative stress and hormonal imbalance [20], with negative repercussions on photosynthetic pigments, growth rate, and biomass accumulation [21].
Our hypothesis investigated the problems caused by different Na+ concentrations on morphological aspects in soybean plants; we considered that a multidisciplinary, broad, and comparative approach was essential to explain the deleterious effects. On this basis, our research measured anatomical, nutritional, physiological, and biochemical interferences, detailing possible consequences on morphological responses in soybean plants subjected to progressive salt stress.
2. Materials and Methods
2.1. Location and Growth Conditions
The experiments were performed at the Paragominas Campus of the Universidade Federal Rural da Amazônia, Paragominas, Brazil (2°55′ S, 47°34′ W). The study was conducted in a greenhouse in which the temperature and humidity were controlled. The minimum, maximum, and median temperatures were 24.6 °C, 28.8 °C, and 26.6 °C, respectively. The relative humidity during the experimental period varied between 60% and 80%.
2.2. Plants, Containers, and Acclimation
Seeds of Glycine max (L.) Merr. var. M8644RR Monsoy ™ were germinated and grown in 1.2-L pots filled with a mixed substrate of sand and vermiculite in the ratio 3:1. The plants were cultivated under semi-hydroponic conditions, initially using 500 mL of distilled water, for eight days. A modified nutritive solution was used [22], with the ionic strength beginning at 50% on the 6th day and then raised to 100% after two more days (8th day). After this period, the nutrient solution remained at full ionic strength.
2.3. Experimental Design
The experiment was randomized into five treatments (0, 50, 100, 150, and 200 mM NaCl, designated as 0, 50, 100, 150, and 200 mM Na+, respectively). Five replicates of each treatment were conducted, producing a total of 25 experimental units (pots), with one plant in each unit.
2.4. Plant Conduction and Salt Stress
Nutrient solution was prepared without Na+ supply [23]. To simulate Na+ exposure, NaCl was used at concentrations of 0, 50, 100, 150, and 200 mM Na, applied over 15 days (days 20–35 after the start of the experiment). On day 35 of the experiment, physiological and morphological parameters were measured for all plants, and leaf tissues were harvested for anatomical, biochemical, and nutritional analyses.
2.5. Determining of Na+ and Nutrients
Milled samples (100 mg) of root, stem, and leaf tissues were pre-digested in conical tubes (50 mL) with 2 mL of sub-boiled HNO3. Subsequently, 8 mL of a solution containing 4 mL of H2O2 (30% v/v) and 4 mL of ultra-pure water was added, and the mixture transferred to a Teflon digestion vessel [24]. Determinations of Na, K, P, Ca, Mg, S, Fe, Mn, and Cu were performed using an inductively coupled plasma mass spectrometer (model ICP-MS 7900, Agilent, United States).
2.6. Chlorophyll Fluorescence, Gas Exchange, and Anatomical Variables
Chlorophyll fluorescence was measured as described by Maia et al. [25]. Gas exchange was evaluated following the calibration procedures described by Pereira et al. [26]. Anatomical samples were collected following the methodology of Oliveira et al. [27] and O’Brien et al. [28]. Stomatal characterization was carried out according to Segatto et al. [29]. Wax extraction was based on the recommendations of Damato et al. [30] with modifications. In individual pre-weighed receptacles, fragments of 1 cm2 of the middle third of a leaf were immersed in 2 mL chloroform for 30 s. The extract obtained was placed in a water bath at 60 °C to achieve total evaporation of the chloroform and then weighed. Wax quantification was expressed as the amount of wax per unit leaf area (mg cm−2).
2.7. Determination of Antioxidant Enzymes, Superoxide, and Soluble Proteins
Antioxidant enzymes [SOD (EC 1.15.1.1), CAT (EC 1.11.1.6), APX (EC 1.11.1.11), POX (EC 1.11.1.7)], O2−, and soluble proteins were extracted from totally expanded leaf (0.5 g) according to the method of Badawi et al. [31]; this extraction methodology had advantages of rapidity, cost, and efficiency. Total soluble proteins were quantified using the methodology described by Bradford [32]. SOD activity was measured at 560 nm and expressed as unit m−1 proteins [33]. CAT activity was measured at 240 nm [34] and expressed as μmol H2O2 mg−1 protein min−1. APX activity was measured at 290 nm [35] and expressed as μmol AsA mg−1 protein min−1. POX activity was measured at 470 nm [36], with the activity expressed in μmol tetraguaiacol mg−1 protein min−1. The determination of O2− was measured at 530 nm [37].
2.8. Quantification of Hydrogen Peroxide, Malondialdehyde, and Electrolyte Leakage
Stress indicators [hydrogen peroxide (H2O2) and malondialdehyde (MDA)] were extracted from leaf tissue [38], this being a method that has the advantage of applying a single extraction procedure for both compounds. H2O2 concentration was measured using the procedures of Velikova et al. [39]. MDA concentration was determined by the method of Cakmak and Horst [40], using an extinction coefficient of 155 mM−1 cm−1. Electrolyte leakage (EL) was measured according to Gong et al. [41].
2.9. Quantification of Photosynthetic Pigments and Biomass, and Data Analysis
The chlorophyll and carotenoid levels were determined using 40 mg of leaf tissue. The samples were homogenized in the dark with 8 mL of 90% methanol. The homogenate was centrifuged at 6000× g for 10 min at 5 °C. The supernatant was removed, and the chlorophyll a (Chl a) and b (Chl b), carotenoid (Car), and total chlorophyll (total Chl) levels were quantified using a spectrophotometer (model UV-M51; Bel Photonics, Italy, Monza) [42]. The biomass of roots, stems, and leaves was measured based on constant dry weights (g) after drying in a forced-air ventilation oven at 65 °C. The data were subjected to ANOVA and subsequently submitted to the Scott–Knott test [43].
3. Results
3.1. Salinity Reduced Ionic Homeostasis Linked to K+/Na+ and Nutrient Content
Salt stress induced by Na+ caused significant increases in Na+ content (Table 1), decreases in K+ contents (21% to 57%), and reductions in K+/Na+ ratio (87% to 100%) compared to the control treatment (0 mM Na+). The increase in salinity caused changes (p < 0.05) in the contents of elements (Table 2). Plants subjected to concentrations of 50 to 200 mM Na+ exhibited reductions in Ca (38% to 63%), Mg (20% to 41%), S (14% to 27%), Fe (19% to 40%), Mn (10% to 28%), and Cu (13% to 37%) compared to the controls (without Na+).

Table 1.
Na and K contents and K+/Na+ ratio in soybean plants submitted to salt stress.
Table 2.
Nutrient contents in soybean plants submitted to salt stress.
3.2. Na+ Promoted Damage in Photosynthetic Machinery and Impacted Gas Exchange
Plants exposed to saline conditions exhibited significant increases in F0 values, ranging from 14% to 37%, compared to controls (Figure 1). There were also decreases in Fm (3% to 23%) and Fv (8% to 40%). For Fv/Fm, salt stress induced significant losses that ranged from 5% to 22% in plants exposed to 50 to 200 mM Na+ compared to controls. Plants subjected to concentrations of 50 to 200 mM Na+ exhibited significant reductions in ΦPSII (13% to 62%), qP (2% to 30%), and ETR (12% to 62%) (Table 3). Conversely, salt stress induced increases of 31% to 140% for NPQ, 8% to 52% for EXC, and of 41% to 878% for ETR/PN compared to controls. Plants exposed to Na+ showed interferences (p < 0.05) in gas exchange (Table 4), with PN values ranging from 38% to 96% relative to controls. Similar trends were observed in E (decreases of 32% to 65%) and in gs (reductions of 52% to 85%). Additionally, gradual reductions were detected in WUE (8% to 89%) and PN/Ci (38% to 97%) in plants exposed to 50 to 200 mM Na+ compared to controls.
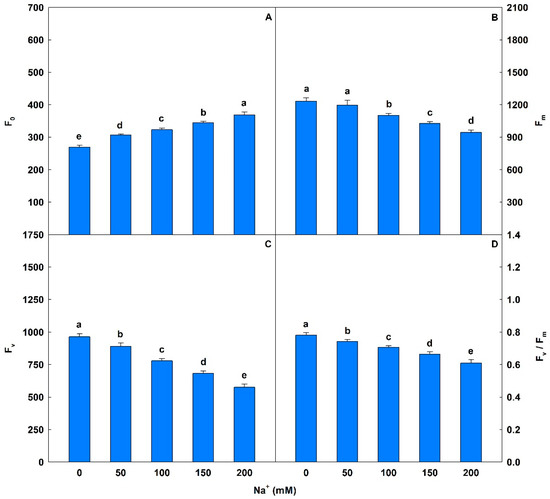
Figure 1.
Minimal fluorescence yield of the dark-adapted state (F0), maximal fluorescence yield of the dark-adapted state (Fm), variable fluorescence (Fv), and maximal quantum yield of PSII photochemistry (Fv/Fm) in soybean plants submitted to salt stress. Bars with different letters indicate significant differences from the Scott–Knott test (p < 0.05). Bars correspond to means from five repetitions and standard deviations.
Table 3.
Chlorophyll fluorescence in soybean plants submitted to salt stress.
Table 4.
Gas exchange in soybean plants submitted to salt stress.
3.3. Changes in Leaf Structures and Epicuticular Wax were Induced by Progressive Salt Stress
Plants exposed to 50 and 100 mM Na+ presented significant increases in various stomatal characteristics, with peaks in adaxial and abaxial faces (Table 5 and Figure 2), more specifically SD (44% and 23%), PDS (13% and 7%), EDS (29% and 17%), SF (16% and 14%), and SI (33% and 18%), respectively, compared to controls. Increased salinity caused impacts (p < 0.05) on the trichomes on both leaf faces, with damage more intense at 200 mM Na+; for TD the reductions were 62% and 84%, while for TS reductions were 57% and 55% on the adaxial and abaxial faces, respectively, compared to controls. With respect to epicuticular wax (EWL) (Table 6), salt stress promoted significant changes in EWL indices, with an increase of 12%, followed by reductions of 21%, 31%, and 36% at concentrations of 50, 100, 150, and 200 mM Na+, respectively, compared to controls. It was possible to follow the effect of salt stress on EWL on the leaf surface using SEM (Figure 3); where reduction of wax deposition occurred, it was observed that the losses occurred preferentially from the central region rather than from the periphery of the epidermal cells. There were significant effects on leaf structures in plants subjected to Na+ stress (Table 6). With respect to anatomy, LXT, LMD, ETAd, ETAb, and SPT values below 100 mM Na+ increased by 28%, 6%, 62%, 46%, and 57%, respectively, compared to controls, whereas between 150 and 200 mM Na+ there were reductions of 9%, 17%, 9%, 3%, and 16%, respectively. At 50 mM Na+ LPT increased by 35%, but at higher Na+ levels LPT decreased by up to 12%. Increasing salinity caused significant increases in PPT from 12% to 54% compared to controls. Anatomically, the leaves of plants subjected to increasing salinity exhibited the first alterations under 100 mM Na+ compared to controls (Figure 4). In the central vein (viewed in cross section) progressive changes of the tissues were observed, mainly in the vascular system, with reductions in the number, shape, and size of the auxiliary bundles. Additionally, spaces were detected in the palisade parenchyma, and minor disorders in the spongy parenchyma of the leaf mesophyll.
Table 5.
Stomatal and trichome characteristics in soybean plants submitted to salt stress.
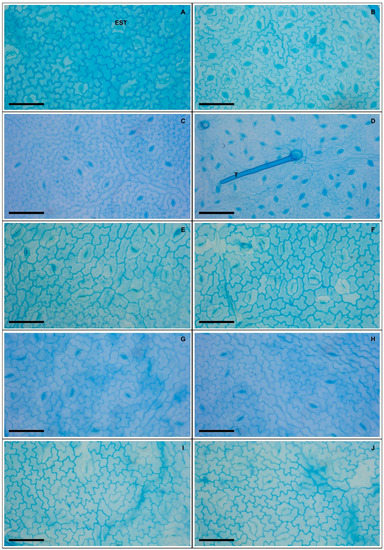
Figure 2.
Adaxial leaf surface (A,C,E,G,I) and abaxial (B,D,F,H,J) in soybean plants submitted to salt stress. 0 mM Na+ (A,B), 50 mM Na+ (C,D), 100 mM Na+ (E,F), 150 mM Na+ (G,H), and 200 mM Na+ (I,J). Legends: EST = stomata, T = trichome. Bars: 50 µm.
Table 6.
Epicuticular wax load and leaf anatomy in soybean plants submitted to salt stress.
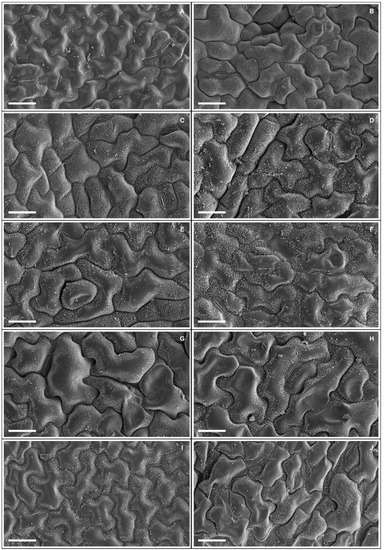
Figure 3.
Adaxial leaf surface (A,C,E,G,I) and abaxial (B,D,F,H,J) in scanning electron microscopy showing epicuticular wax deposits in soybean plants submitted to salt stress. 0 mM Na+ (A,B), 50 mM Na+ (C,D), 100 mM Na+ (E,F), 150 mM Na+ (G,H), and 200 mM Na+ (I,J). Bars: 25 µm.
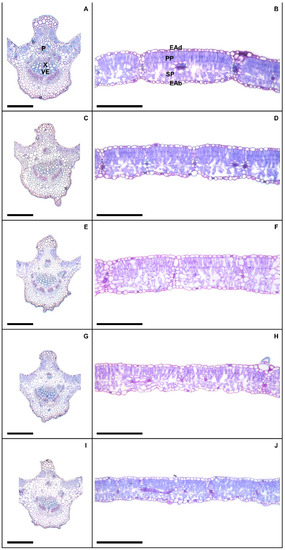
Figure 4.
Leaf cross section showing midrib (A,C,E,G,I) and the middle region (B,D,F,H,J) in soybean plants submitted to salt stress. Legends: 0 mM Na+ (A,B), 50 mM Na+ (C,D), 100 mM Na+ (E,F), 150 mM Na+ (G,H), and 200 mM Na+ (I,J). Legends: P = phoelm, X = xylem, VE = vessel elements, EAd = adaxial epidermis, EAb = abaxial epidermis, PP = palisade parenchyma, SP = spongy parenchyna. Bars: 150 µm.
3.4. Salinity Modified the Antioxidant System
Plants exposed to 50 to 200 mM Na+ showed significant increases in SOD levels (93% to 125%) compared to controls (Figure 5). On the other hand, peaks in the activities of CAT, APX, and POX were observed at salinity levels under 100 mM Na+ and significant oscillations were detected in CAT (5% to 121%), POX (58% to 514%), and APX (5% to 43%) compared to controls.
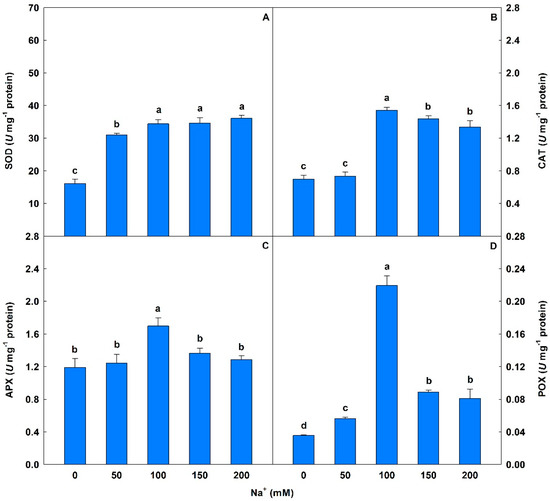
Figure 5.
Activities of superoxide dismutase (SOD), catalase (CAT), ascorbate peroxidase (APX), and peroxidase (POX) in soybean plants submitted to salt stress. Bars with different letters indicate significant differences from the Scott–Knott test (p < 0.05). Bars correspond to means from five repetitions and standard deviations.
3.5. Na+ Induced Oxidative Stress and Decreased Photosynthetic Pigments
Salinity caused significant interference in O2− values, with progressive increases of 2% to 40%. H2O2 levels were significantly increased (13% to 103%) with increasing salt stress (Figure 6). MDA levels showed significant increases of 8% to 30% from 50 to 200 mM Na+, and EL levels also increased 15% to 64%, compared to controls. With respect to chloroplast pigments, saline conditions induced significant changes (p < 0.05) with reductions of 14% to 33% in Chl a and 18% to 69% in Chl b compared to controls at 50 to 200 mM Na+ (Table 7). A similar trend was observed in total Chl, with losses ranging from 16% to 46%, and losses in CAR of 21% to 70%. However, from 50 to 200 mM Na+ progressive and significant increases in the Chl a/Chl b ratio (34% to 176%) and total Chl/CAR ratio (7% to 83%) where observed compared to controls.
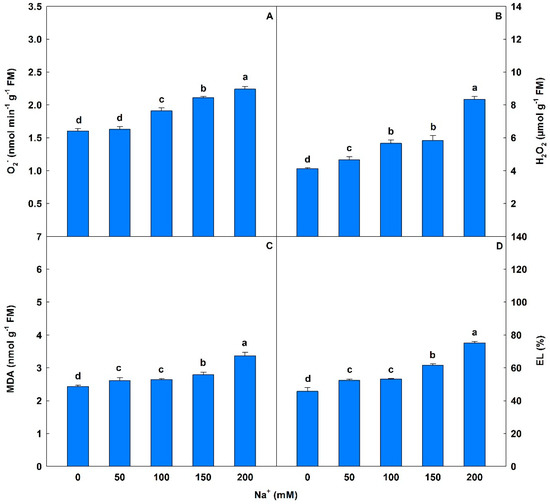
Figure 6.
Superoxide anion (O2−), hydrogen peroxide (H2O2), malondialdehyde (MDA), and electrolyte leakage (EL) in soybean plants submitted to salt stress. Bars with different letters indicate significant differences from the Scott–Knott test (p < 0.05). Bars correspond to means from five repetitions and standard deviations.
Table 7.
Photosynthetic pigments in soybean plants submitted to salt stress.
3.6. Salt Stress Reduced Biomass
Biomass was significantly affected by salt stress (Figure 7 and Figure 8), with decreases of 36% to 76% in LDM, 43% to 75% in RDM, 51% to 78% in SDM, and 42% to 76% for TDM compared to controls.
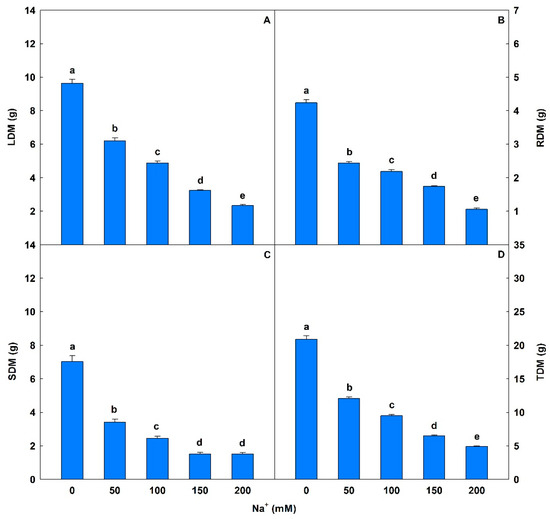
Figure 7.
Leaf dry matter (LDM), root dry matter (RDM), stem dry matter (SDM), and total dry matter (TDM) in soybean plants submitted to salt stress. Bars with different letters indicate significant differences from the Scott–Knott test (p < 0.05). Bars corresponding to means from five repetitions and standard deviations.
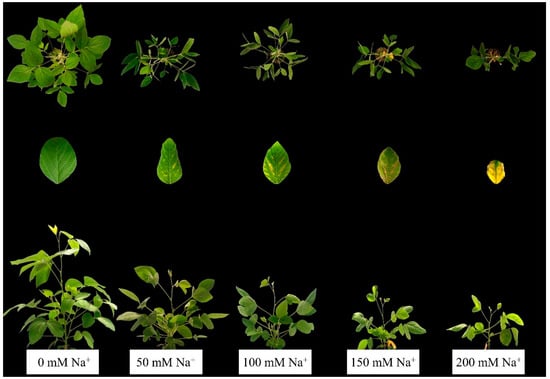
Figure 8.
Morphological modifications in soybean plants submitted to salt stress.
4. Discussion
The increases in Na+ content in soybean leaf tissues observed in this study confirm the aim of simulated salt stress. High concentrations of salts, mainly Na+, interfere with K+ uptake due to the high affinity of Na+ for transporters and non-selective cationic channels [44] resulting in reduced K+ content and K+/Na+ ratio in leaves after salt stress. Imbalances connected to K+ absorption often cause metabolic disturbances, including loss in enzyme activities and protein synthesis, and negatively affect the photosynthetic process, cell expansion, and stomatal movements [45]. Na+ accumulation in the stem is a strategy employed by plants to reduce osmotic and ionic stresses in leaf tissue, leaves generally being more sensitive to the stress caused by Na+ [46]. Silva et al. [47] evaluating anatomical changes in stem and root of G. max submitted to progressive concentrations from 0 to 200 mM NaCl detected a higher accumulation of Na+ in the stem. Tiwari et al. [48] evaluating 17 genotypes of Cucumis sativus at four salinity levels found increases in Na+ content and decreases in both K+ content and K+/Na+ ratio in the leaves of all analyzed genotypes. Ding et al. [49] investigating the growth, antioxidant system, and the nutritional content in Solanum melongena leaves exposed to 90 mM NaCl verified significant increases in Na+ content and decreases in K+ concentration and K+/Na+ ratio, respectively.
In this study, salinity induced reductions in the content of macronutrients (Ca, Mg, and S) and micronutrients (Fe, Mn, and Cu). Reductions in these nutrients are associated with high salt concentrations that increase osmotic pressure mainly in plant growth regions, interfering with the uptake of water and nutrients [15]. Na+ stress maximizes competition between ions, delaying the mobility and accumulation of essential nutrients in plant tissues [4]. High concentrations of Na+ cause replacement of Ca2+ in membranes leading to a decrease in K+/Na+ selectivity [50] and a weakening of the cell wall structure making it more susceptible to rupture [51]. Reduced concentration of K+ and Ca2+ ions in tissues caused by salt stress often reduces plant growth [52]. Ca2+ is the second most used intracellular messenger in plants [53]. When extracellular stress signals are perceived by membrane receptors, Ca2+ acts as an intracellular messenger, inducing tolerance mechanisms, including reduction in plant growth, apoptosis and Na+ translocation into the cells of older tissues [54]. Morgan et al. [55] evaluating ionic homeostasis and ATPase activities in Vicia faba exposed to 100 mM NaCl during two harvest periods (7 and 14 days) found reductions in the Ca2+ content. Similarly, Teixeira and Carvalho [56] evaluating the salt stress (0, 60, 120, and 240 mM NaCl) on the mineral composition of Portulaca oleracea found reductions of up to 56% and 81% in the Ca2+ content of plants sown in spring and summer, respectively.
As with K+ and Ca2+, a decrease in Mg2+ in plant tissues may occur under saline conditions due to Na+ interference [57]. Mg is a central element in the chlorophyll molecule, and participates in several enzymatic processes that involve phosphate transfer [58]. The reduction in the tissue Mg2+ content may have contributed to the decrease in the photosynthetic pigments observed in this study. Another nutrient that plays an important role in the proper function of the photosynthetic apparatus and in the electron transport system is sulfur (S). Sulfur-containing compounds are also involved in ROS metabolism, where they contribute to mitigating salt-induced oxidative stress and improving ionic selectivity linked to K+ and Na+ [59]. On the other hand, S deficiency negatively impacts plant metabolism, decreasing the chlorophyll content and photosynthetic efficiency, and altering the activity of ribulose-1,5-bisphosphate carboxylase-oxygenase (RuBisCO) [60]. Bendaly et al. [61] evaluating physiological and biochemical changes in Atriplex halimus plants exposed to progressive salinity (0 to 400 mM NaCl) observed reductions in Mg2+ content at the higher salt concentrations. When studying the effect of 35 mM NaCl on an F6 cultivar of Fragaria × ananassa, Karlidag et al. [62] found reductions of 75% and 47% in the content of Mg and S, respectively.
In general, micronutrients are negatively impacted by Na+ because they are involved in the constitution, integrity, and function of several plant organelles [63]. Fe is an important and essential micronutrient for chlorophyll biosynthesis and in antioxidant enzyme activity, directly acting on photosynthesis and cellular respiration [64]. Mn also plays important roles in plant metabolism, participating in photosynthesis, constituting the PSII proteins, and activating decarboxylase, dehydrogenase, peroxidase, and phosphatase [65]. Mn deficiency inhibits growth and induces chlorosis, necrosis, and cell death [66]. Cu is highly affected by salinity and reduced absorption of this micronutrient can cause leaf damage, including significant reductions in chlorophyll pigments and photosynthesis, impairing electron transport activity in PSII [67]. When analyzing the nutritional content of Cucumis sativus plants subjected to salinity, Huang et al. [68] reported reductions of 69%, 73%, and 65% in Fe, Mn, and Cu content, respectively. Oliveira et al. [10] evaluating the morphological, physiological and biochemical impacts in Eucalyptus urophylla seedlings exposed to 250 mM NaCl found a 59% reduction in Fe content.
Na+ induced progressive increases in F0 values, indicating that this ion decreased the proportion of oxidized quinone (QA) and negatively affected the efficiency of the capture of light energy in the PSII reaction center [69]. Reductions in Fm, Fv and Fv/Fm values after saline stress reveal a deficiency in the conversion of photochemical energy, with possible photoinhibition or damage to the PSII complex [70]. Additionally, salt stress impairs the structure and organization of the thylakoid membrane, often causing decreases in the photosynthetic activity in the reaction centers [71]. Khoshbakht et al. [72] evaluating the parameters of chlorophyll fluorescence in Citrus reticulata × Citrus limetta seedlings submitted to 75 mM NaCl, observed increases in F0 values and reductions in Fm, Fv, and Fv/Fm. Stepien and Johnson [73] studying the photosynthetic responses in Arabidopsis thaliana exposed to 100 and 150 mM NaCl found reductions in Fv/Fm values.
Plants exposed to concentrations of 50 to 200 mM Na+ exhibited decreases in ΦPSII, qP, and ETR values, demonstrating a lower energy absorption of photons and subsequent decrease in energy flow for excitation of electrons captured by plastoquinone [74], while increases in NPQ, EXC, and ETR/PN values suggest mechanisms of protection against PSII damage, including higher thermal dissipation in the reaction center [75] and increased photorespiration through the consumption of photochemical energy [76]. Yuan et al. [77], evaluating the photosynthetic performance and heat dissipation capacity in Cucumis sativus plants subjected to 75 mM NaCl, observed decreases of 35% in values of both ΦPSII and qP. Yan et al. [78] detected negative changes in photosynthesis and efficiency of PSII in Caragana korshinskii leaves exposed to three levels of salinity (0, 100, and 300 mM NaCl), with increased NPQ values and reduced ΦPSII, qP, and ETR after 1, 9, and 18 days of salt stress. Aragão et al. [79] studying Jatropha curcas plants exposed to 100 mM NaCl detected decreases in qP (28%) and ETR (36%), as well as increases in NPQ (200%), EXC (120%), and ETR/PN (42%).
Negative effects on PN, E, and gs were observed in plants exposed to salinity. The adverse osmotic conditions induced by the Na+ stress probably stimulated abscisic acid (ABA) biosynthesis, acting on stomatal closure and negatively influencing gs values [16]. Additionally, stomata-related limitations, evidenced by reductions in SD, SI, and SF, impair E and CO2 influx, inducing reductions in PN [80]. In other words, the reductions in E and PN, coupled with the low performance in stomatal regulation (gs) justify the reduction detected in WUE and the clear limitations on gas exchange. Agrawal et al. [81], evaluating growth, gas exchange, and ionic regulation in two Ziziphus mauritiana cultivars subjected to NaCl (electrical conductivity from 0 to 16 dS m−1), observed decreases in PN, gs, and E values. Physiological responses similar to those found in our research were found by Zheng et al. [82] comparing the performance of two Triticum aestivum genotypes exposed to 50, 100, and 150 mM Na+, resulting in reductions in PN and gs. Shahbaz et al. [7], evaluating the repercussions of salt stress on growth, photosynthetic capacity, and ion accumulation in eight Helianthus annuus cultivars, found reductions in WUE.
The increases we observed in PN/Ci in plants exposed to 50 to 200 mM Na+ indicate a decrease in RuBisCO enzyme activity, compromising CO2 fixation in the Calvin–Benson cycle leading to an increase in Ci [83]. Rodrigues et al. [84], evaluating the physiological adjustment of Ricinus communis plants under concentrations of 50, 100, and 150 mM NaCl, reported increases in PN/Ci values. Chen et al. [85] observed increases in Ci after comparing the progressive effects of salinity (40 to 200 mM NaCl) on growth and photosynthetic attributes in Populus bonatii cultivars.
There were slight increases in SD and SI at concentrations of 50 and 100 mM Na+, which can be explained by decreases in epidermal cell expansion and leaf area [86]. On the other hand, SD and SI decreased at 150 and 200 mM NaCl, negatively affecting CO2 absorption and consequently gs values [87]. The oscillations in values for PDS, EDS, and SF indicated that the salt stress influenced the stomata structurally, inducing in fact an elliptic form. Khan et al. [88] stated that elliptical stomata have better functionality than those with circular form. Decreases in TS and TD values (50 to 200 mM Na+) were attributed to two effects combined; salt stress and higher sun exposure on epidermal cells, favoring water losses via transpiration [89]. Barbieri et al. [19] comparing two Ocimum basilicum cultivars grown in concentrations of 100 and 200 mM NaCl showed reductions in SD values. Sarabi et al. [90] studying Cu. melo plants subjected to 30, 60, and 90 mM Na+ observed successive decreases in TS and TD values.
The slight increase in EWL observed at 50 mM NaCl has the effect of improving the reflection of radiation incident on the epidermis, protecting against excessive transpiration and respiration, and consequently decreasing the leaf temperature [91]. However, above 100 mM NaCl there is a degradation of epicuticular wax that may be correlated with Na+ and Cl− accumulation in the leaves [18]. Avestan et al. [92] studying F. ananassa (exposed to 25 and 50 mM NaCl) observed changes in leaf structure and reduced EWL.
The anatomical changes in the vascular bundles and the reduction in LXT and LPT values observed under 200 mM Na+ clearly affected solute translocation by the conductive tissues and reduced photo-assimilate accumulation [93]. Slight increases in ETAd and ETAb in plants exposed to up to 100 mM Na+ suggested an anatomical adaptation to salinity that prevents excessive water loss during transpiration [94]. On the other hand, the observed reduction in these parameters above 150 mM NaCl may indicate susceptibility to damage caused at higher levels of salinity. The decreases in PPT and SPT (200 mM Na+) may have contributed to the decreases in PN, Ci, and PN/Ci values; the palisade parenchyma presents the greatest number of chloroplasts, the organelles responsible for the photosynthetic process, while SPT is related to intense formation of intercellular spaces involved with gas exchange [95]. Moreover, the loose cellular arrangement found in the mesophyll impairs the cell surface contact and consequently the capture of light energy and gas exchange necessary during the photosynthetic process [96]. Paz et al. [97] subjected Lotus tenuis plants to a solution containing 90 mM NaCl and found increases in ETAd, ETAb, PPT, and SPT values.
Plants exposed to salinity (>50 mM Na+) showed increases in SOD, CAT, APX, and POX activities, demonstrating in this research the efficiency of the antioxidant system in relation to ROS accumulation under simulated saline stress. SOD catalyzes the reaction of O2− forming H2O2 [98], while CAT, APX, and POX convert H2O2 to non-reactive compounds, such as H2O and O2 [99]. Fariduddin et al. [100] found increases in SOD and CAT activities in their assessment of the activities of antioxidant enzymes in two Cu. sativus cultivars exposed to 150 mM Na+. El-Mashad and Mohamed [101], investigating the effects of salinity on the antioxidant system, found increases in POX activity in Vigna sinensis plants subjected to 100 and 150 mM NaCl. Rasool et al. [8] studied growth parameters and biochemical attributes in eight Cicer arietinum genotypes under concentrations of 25 to 100 mM NaCl, reporting increases in SOD, CAT, and APX.
Increases in MDA and EL values found in plants exposed to Na+ clearly reveal membrane damage caused by the action of ROS, such as O2− and H2O2. ROS are highly reactive and toxic, causing structural and functional deterioration of membranes and subsequent lipid peroxidation [102,103]. Increases in MDA, EL, and H2O2 were observed by Hu et al. [104] studying genes, proteins, and enzymes linked to antioxidant metabolism in two Lolium perenne genotypes under 250 mM NaCl. Farhangi-Abriz and Torabian [105] evaluating antioxidant enzymes, oxidative stress, and osmotic adjustment in Phaseolus vulgaris seedlings subjected to three levels of salinity (0, 6, and 12 dS m−1 NaCl) found increases in MDA, O2−, and H2O2.
Damage to photosynthetic pigments (Chl a, Chl b, total Chl, and CAR) in plants exposed to salt stress is associated with oxidative stress promoted by increases in MDA, O2−, and H2O2, as previously detected in this study. The latter are highly toxic and promote the degradation of the thylakoid membrane, where there is a high concentration of chlorophyll molecules, and inhibit the biosynthesis of these pigments [106]. Shu et al. [107], evaluating the effects of saline stress (75 mM NaCl) on the structure and function of the photosynthetic apparatus in Cucumis sativus plants, found reductions in Chl a, Chl b, and total Chl values. Similar behavior was observed by Ma et al. [108] in Oryza sativa leaves subjected to 150 mM NaCl, with observed decreases of 21%, 19%, and 20% in Chl a, Chl b, and total Chl, respectively. Aghaleh et al. [109], studying the progressive effects of salt stress (100 to 600 mM NaCl) in two species of Salicornia, detected reductions in Chl a, Chl b, and CAR in both.
Salinity affected plant growth, causing reductions in LDM, RDM, SDM, and TDM values. The lower biomass in plants exposed to Na+ can be explained by multiple effects, including altered stomatal characteristics, and reduced gas exchange and chlorophyll fluorescence. Under salt stress conditions there is often a reduction in biomass because the osmotic stress caused by the excess Na+ negatively affects the processes linked to cell division and elongation [50,110]. Na+ also inhibits root system development through structural and functional restrictions, with consequent impacts on nutrient uptake and translocation [111], aggravated by the reduction in light and CO2 capture and inefficient stomatal regulation [112,113]. Qin et al. [9] observed decreases in LDM, RDM, and SDM values after cultivating Vitis vinifera plants under saline conditions. Khan et al. [113] investigating physiological and biochemical behavior in Vigna radiata plants exposed to salt stress (100 mM NaCl) found reductions in TDM.
5. Conclusions
This research reveals that progressive salt stress adversely affects morphological responses in soybean plants, particularly at concentrations higher than 100 mM Na+. Plants subjected to concentrations of 50 to 200 mM Na+ suffered reductions in all macro- and micronutrients evaluated. Na+ stress progressively interfered with the photosynthetic machinery, gas exchange, and photosynthetic pigments, effects clearly related to oxidative stress generated by the salinity of the growth medium. Interestingly, our study revealed that at concentrations up to 100 mM Na+ deposition of epicuticular wax took place, the quantity and shape of the stomata was modified, and the thickness of the leaf epidermis increased. Overall, our multidisciplinary and comparative study proved that soybean plants suffer significant deleterious effects when subjected to salt stress during growth, mainly at concentrations above 100 mM Na+.
Author Contributions
A.K.d.S.L. and P.A. were the advisors for this project, planned all phases of the research and critically revised the manuscript. B.R.S.d.S. conducted the experiments, performed physiological, biochemical, anatomical, and morphological determinations, and wrote and edited the manuscript. R.M.P. and B.L.B. carried out the nutritional determinations. E.M.S.G.L., L.A.d.S. and M.N.A. critically revised the manuscript. All authors have read and agreed to the published version of the manuscript.
Funding
This research had financial support from Fundação Amazônia de Amparo a Estudos e Pesquisas (FAPESPA/Brazil), Conselho Nacional de Desenvolvimento Científico e Tecnológico (CNPq/Brazil) and Universidade Federal Rural da Amazônia (UFRA/Brazil) to A.K.d.S.L. On the other hand, B.R.S.d.S. was supported with a scholarship from Coordenação de Aperfeiçoamento de Pessoal de Nível Superior (CAPES/Brazil). The M.N.A. lab is supported by the Researchers Support Project Number (RSP2023R180), King Saud University, Riyadh, Saudi Arabia.
Institutional Review Board Statement
Not applicable.
Informed Consent Statement
Not applicable.
Data Availability Statement
Data are available upon request to the corresponding author.
Acknowledgments
This research had financial support from Fundação Amazônia de Amparo a Estudos e Pesquisas (FAPESPA/Brazil), Conselho Nacional de Desenvolvimento Científico e Tecnológico (CNPq/Brazil) and Universidade Federal Rural da Amazônia (UFRA/Brazil) to AKSL. On the other hand, BRSS was supported with a scholarship from Coordenação de Aperfeiçoamento de Pessoal de Nível Superior (CAPES/Brazil). The MNA lab is supported by the Researchers Support Project Number (RSP2023R180), King Saud University, Riyadh, Saudi Arabia.
Conflicts of Interest
The authors declare that they have no competing interest.
References
- Xu, D.; Zhang, J.; Cao, Y.; Wang, J.; Xiao, J. Influence of Microcrystalline Cellulose on the Microrheological Property and Freeze-Thaw Stability of Soybean Protein Hydrolysate Stabilized Curcumin Emulsion. LWT-Food Sci. Technol. 2016, 66, 590–597. [Google Scholar] [CrossRef]
- Sanjukta, S.; Rai, A.K. Production of Bioactive Peptides during Soybean Fermentation and Their Potential Health Benefits. Trends Food Sci. Technol. 2016, 50, 1–10. [Google Scholar] [CrossRef]
- Pereira, G.G.; Garcia, R.K.A.; Ferreira, L.L.; Barrera-Arellano, D. Soybean and Soybean/Beef-Tallow Biodiesel: A Comparative Study on Oxidative Degradation during Long-Term Storage. J. Am. Oil Chem. Soc. 2017, 94, 587–593. [Google Scholar] [CrossRef]
- Parihar, P.; Singh, S.; Singh, R.; Singh, V.P.; Prasad, S.M. Effect of Salinity Stress on Plants and Its Tolerance Strategies: A Review. Environ. Sci. Pollut. Res. 2015, 22, 4056–4075. [Google Scholar] [CrossRef]
- Abuelgasim, A.; Ammad, R. Mapping Soil Salinity in Arid and Semi-Arid Regions Using Landsat 8 OLI Satellite Data. Remote Sens. Appl. Soc. Environ. 2019, 13, 415–425. [Google Scholar] [CrossRef]
- Manchanda, G.; Garg, N. Salinity and Its Effects on the Functional Biology of Legumes. Acta Physiol. Plant. 2008, 30, 595–618. [Google Scholar] [CrossRef]
- Shahbaz, M.; Ashraf, M.; Akram, N.A.; Hanif, A.; Hameed, S.; Joham, S.; Rehman, R. Salt-Induced Modulation in Growth, Photosynthetic Capacity, Proline Content and Ion Accumulation in Sunflower (Helianthus annuus L.). Acta Physiol. Plant. 2011, 33, 1113–1122. [Google Scholar] [CrossRef]
- Rasool, S.; Ahmad, A.; Siddiqi, T.O.; Ahmad, P. Changes in Growth, Lipid Peroxidation and Some Key Antioxidant Enzymes in Chickpea Genotypes under Salt Stress. Acta Physiol. Plant. 2013, 35, 1039–1050. [Google Scholar] [CrossRef]
- Qin, L.; Kang, W.; Qi, Y.; Zhang, Z.; Wang, N. The Influence of Silicon Application on Growth and Photosynthesis Response of Salt Stressed Grapevines (Vitis vinifera L.). Acta Physiol. Plant. 2016, 38, 68. [Google Scholar] [CrossRef]
- Oliveira, V.P.; Lima, M.D.R.; Silva, B.R.S.; Batista, B.L.; Lobato, A.K.S. Brassinosteroids Confer Tolerance to Salt Stress in Eucalyptus Urophylla Plants Enhancing Homeostasis, Antioxidant Metabolism and Leaf Anatomy. J. Plant Growth Regul. 2019, 38, 557–573. [Google Scholar] [CrossRef]
- Horie, T.; Karahara, I.; Katsuhara, M. Salinity Tolerance Mechanisms in Glycophytes: An Overview with the Central Focus on Rice Plants. Rice 2012, 5, 11. [Google Scholar] [CrossRef] [PubMed]
- Rengasamy, P. Soil Processes Affecting Crop Production in Salt-Affected Soils. Funct. Plant Biol. 2010, 37, 613–620. [Google Scholar] [CrossRef]
- Blumwald, E. Sodium Transport and Salt Tolerance in Plants. Curr. Opin. Cell Biol. 2000, 12, 431–434. [Google Scholar] [CrossRef]
- Zhu, J.-K. Salt and Drought Stress Signal Transduction in Plants. Annu. Rev. Plant Biol. 2002, 53, 247–273. [Google Scholar] [CrossRef]
- Munns, R. Comparative Physiology of Salt and Water Stress. Plant Cell Environ. 2002, 25, 239–250. [Google Scholar] [CrossRef]
- Acosta-Motos, J.R.; Ortuño, M.F.; Bernal-Vicente, A.; Diaz-Vivancos, P.; Sanchez-Blanco, M.J.; Hernandez, J.A. Plant Responses to Salt Stress: Adaptive Mechanisms. Agronomy 2017, 7, 18. [Google Scholar] [CrossRef]
- Bickerton, P.D.; Pittman, J.K. Role of Cation/Proton Exchangers in Abiotic Stress Signaling and Stress Tolerance in Plants. In Elucidation of Abiotic Stress Signaling in Plants; Springer: New York, NY, USA, 2015; pp. 95–117. [Google Scholar] [CrossRef]
- Yang, C.; Ma, S.; Lee, I.; Kim, J.; Liu, S. Saline-Induced Changes of Epicuticular Waxy Layer on the Puccinellia Tenuiflora and Oryza Sativa Leave Surfaces. Biol. Res. 2015, 48, 33. [Google Scholar] [CrossRef]
- Barbieri, G.; Vallone, S.; Orsini, F.; Paradiso, R.; De Pascale, S.; Negre-Zakharov, F.; Maggio, A. Stomatal Density and Metabolic Determinants Mediate Salt Stress Adaptation and Water Use Efficiency in Basil (Ocimum basilicum L.). J. Plant Physiol. 2012, 169, 1737–1746. [Google Scholar] [CrossRef]
- Kim, J.; Liu, Y.; Zhang, X.; Zhao, B.; Childs, K.L. Analysis of Salt-Induced Physiological and Proline Changes in 46 Switchgrass (Panicum Virgatum) Lines Indicates Multiple Response Modes. Plant Physiol. Biochem. 2016, 105, 203–212. [Google Scholar] [CrossRef]
- Pulavarty, A.; Kukde, S.; Shinde, V.M.; Sarangi, B.K. Morphological, Physiological and Biochemical Adaptations of Eucalyptus Citriodora Seedlings under NaCl Stress in Hydroponic Conditions. Acta Physiol. Plant. 2016, 38, 20. [Google Scholar] [CrossRef]
- Hoagland, D.R.; Arnon, D.I. The Water-Culture Method for Growing Plants without Soil, 2nd ed.; California Agricultural Experiment Station: Berkeley, CA, USA, 1950. [Google Scholar]
- Santos, L.R.; Batista, B.L.; Lobato, A.K.S. Brassinosteroids Mitigate Cadmium Toxicity in Cowpea Plants. Photosynthetica 2018, 56, 591–605. [Google Scholar] [CrossRef]
- Paniz, F.P.; Pedron, T.; Freire, B.M.; Torres, D.P.; Silva, F.F.; Batista, B.L. Effective Procedures for the Determination of As, Cd, Cu, Fe, Hg, Mg, Mn, Ni, Pb, Se, Th, Zn, U and Rare Earth Elements in Plants and Foodstuffs. Anal. Methods 2018, 10, 4094–4103. [Google Scholar] [CrossRef]
- Maia, C.F.; da Silva, B.R.S.; da Lobato, A.K.S. Brassinosteroids Positively Modulate Growth: Physiological, Biochemical and Anatomical Evidence Using Two Tomato Genotypes Contrasting to Dwarfism. J. Plant Growth Regul. 2018, 37, 1099–1112. [Google Scholar] [CrossRef]
- Pereira, Y.C.; Rodrigues, W.S.; Lima, E.J.A.; Santos, L.R.; Silva, M.H.L.; Lobato, A.K.S. Brassinosteroids Increase Electron Transport and Photosynthesis in Soybean Plants under Water Deficit. Photosynthetica 2019, 57, 181–191. [Google Scholar] [CrossRef]
- O’Brien, T.P.; Feder, N.; McCully, M.E. Polychromatic Staining of Plant Cell Walls by Toluidine Blue O. Protoplasma 1964, 59, 368–373. [Google Scholar] [CrossRef]
- Segatto, F.B.; Bisognin, D.A.; Benedetti, M.; Costa, L.C.; Rampelotto, M.V.; Nicoloso, F.T. A Technique for the Anatomical Study of Potato Leaf Epidermis. Ciênc. Rural 2004, 34, 1597–1601. [Google Scholar] [CrossRef]
- Damato, T.C.; Carrasco, L.D.M.; Carmona-Ribeiro, A.M.; Luiz, R.V.; Godoy, R.; Petri, D.F.S. The Interactions between Surfactants and the Epicuticular Wax on Soybean or Weed Leaves: Maximal Crop Protection with Minimal Wax Solubilization. Crop Prot. 2017, 91, 57–65. [Google Scholar] [CrossRef]
- Badawi, G.H.; Yamauchi, Y.; Shimada, E.; Sasaki, R.; Kawano, N.; Tanaka, K.; Tanaka, K. Enhanced Tolerance to Salt Stress and Water Deficit by Overexpressing Superoxide Dismutase in Tobacco (Nicotiana Tabacum) Chloroplasts. Plant Sci. 2004, 166, 919–928. [Google Scholar] [CrossRef]
- Bradford, M.M. A Rapid and Sensitive Method for the Quantitation of Microgram Quantities of Protein Utilizing the Principle of Protein-Dye Binding. Anal. Biochem. 1976, 72, 248–254. [Google Scholar] [CrossRef]
- Giannopolitis, C.N.; Ries, S.K. Superoxide Dismutases: I. Occurrence in Higher Plants. Plant Physiol. 1977, 59, 309–314. [Google Scholar] [CrossRef]
- Havir, E.A.; McHale, N.A. Biochemical and Developmental Characterization of Multiple Forms of Catalase in Tobacco Leaves. Plant Physiol. 1987, 84, 450–455. [Google Scholar] [CrossRef] [PubMed]
- Nakano, Y.; Asada, K. Hydrogen Peroxide Is Scavenged by Ascorbate-Specific Peroxidase in Spinach Chloroplasts. Plant Cell Physiol. 1981, 22, 867–880. [Google Scholar]
- Cakmak, I.; Marschner, H. Magnesium Deficiency and High Light Intensity Enhance Activities of Superoxide Dismutase, Ascorbate Peroxidase, and Glutathione Reductase in Bean Leaves. Plant Physiol. 1992, 98, 1222–1227. [Google Scholar] [CrossRef]
- Elstner, E.F.; Heupel, A. Inhibition of Nitrite Formation from Hydroxylammoniumchloride: A Simple Assay for Superoxide Dismutase. Anal. Biochem. 1976, 70, 616–620. [Google Scholar] [CrossRef]
- Wu, Q.-S.; Xia, R.-X.; Zou, Y.-N. Reactive Oxygen Metabolism in Mycorrhizal and Non-Mycorrhizal Citrus (Poncirus Trifoliata) Seedlings Subjected to Water Stress. J. Plant Physiol. 2006, 163, 1101–1110. [Google Scholar] [CrossRef]
- Velikova, V.; Yordanov, I.; Edreva, A. Oxidative Stress and Some Antioxidant Systems in Acid Rain-Treated Bean Plants Protective Role of Exogenous Polyamines. Plant Sci. 2000, 151, 59–66. [Google Scholar] [CrossRef]
- Cakmak, I.; Horst, W.J. Effect of Aluminium on Lipid Peroxidation, Superoxide Dismutase, Catalase, and Peroxidase Activities in Root Tips of Soybean (Glycine Max). Physiol. Plant. 1991, 83, 463–468. [Google Scholar] [CrossRef]
- Gong, M.; Li, Y.-J.; Chen, S.-Z. Abscisic Acid-Induced Thermotolerance in Maize Seedlings Is Mediated by Calcium and Associated with Antioxidant Systems. J. Plant Physiol. 1998, 153, 488–496. [Google Scholar] [CrossRef]
- Lichtenthaler, H.K.; Buschmann, C. Chlorophylls and Carotenoids: Measurement and Characterization by UV-VIS Spectroscopy. In Current Protocols in Food Analytical Chemistry; John Wiley & Sons, Inc.: Hoboken, NJ, USA, 2001; pp. 431–438. ISBN 9780471709084. [Google Scholar]
- Steel, R.G.; Torrie, J.H.; Dickey, D.A. Principles and Procedures of Statistics: A Biometrical Approach, 3rd ed.; Academic Internet Publishers: Moorpark, CA, USA, 2006. [Google Scholar]
- Chen, Z.; Newman, I.; Zhou, M.; Mendham, N.; Zhang, G.; Shabala, S. Screening Plants for Salt Tolerance by Measuring K+ Flux: A Case Study for Barley. Plant Cell Environ. 2005, 28, 1230–1246. [Google Scholar] [CrossRef]
- Flowers, T.J.; Munns, R.; Colmer, T.D. Sodium Chloride Toxicity and the Cellular Basis of Salt Tolerance in Halophytes. Ann. Bot. 2015, 115, 419–431. [Google Scholar] [CrossRef]
- Farooq, M.; Hussain, M.; Wakeel, A.; Siddique, K.H.M. Salt Stress in Maize: Effects, Resistance Mechanisms, and Management. A Review. Agron. Sustain. Dev. 2015, 35, 461–481. [Google Scholar] [CrossRef]
- Silva, B.R.S.; Batista, B.L.; Lobato, A.K.S. Anatomical Changes in Stem and Root of Soybean Plants Submitted to Salt Stress. Plant Biol. 2021, 23, 57–65. [Google Scholar] [CrossRef] [PubMed]
- Tiwari, J.K.; Munshi, A.D.; Kumar, R.; Pandey, R.N.; Arora, A.; Bhat, J.S.; Sureja, A.K. Effect of Salt Stress on Cucumber: Na+-K+ Ratio, Osmolyte Concentration, Phenols and Chlorophyll Content. Acta Physiol. Plant. 2010, 32, 103–114. [Google Scholar] [CrossRef]
- Ding, H.D.; Zhu, X.-H.; Zhu, Z.W.; Yang, S.J.; Zha, D.S.; Wu, X.X. Amelioration of Salt-Induced Oxidative Stress in Eggplant by Application of 24-Epibrassinolide. Biol. Plant. 2012, 56, 767–770. [Google Scholar] [CrossRef]
- Munns, R.; Tester, M. Mechanisms of Salinity Tolerance. Annu. Rev. Plant Biol. 2008, 59, 651–681. [Google Scholar] [CrossRef]
- Hepler, P.K.; Winship, L.J. Calcium at the Cell Wall-Cytoplast Interface. J. Integr. Plant Biol. 2010, 52, 147–160. [Google Scholar] [CrossRef]
- Aghajanzadeh, T.A.; Reich, M.; Hawkesford, M.J.; Burow, M. Sulfur Metabolism in Allium Cepa Is Hardly Affected by Chloride and Sulfate Salinity. Arch. Agron. Soil Sci. 2019, 65, 945–956. [Google Scholar] [CrossRef]
- Reddy, A.S.N.; Ali, G.S.; Celesnik, H.; Day, I.S. Coping with Stresses: Roles of Calcium- and Calcium/Calmodulin-Regulated Gene Expression. Plant Cell 2011, 23, 2010–2032. [Google Scholar] [CrossRef]
- Mahajan, S.; Pandey, G.K.; Tuteja, N. Calcium- and Salt-Stress Signaling in Plants: Shedding Light on SOS Pathway. Arch. Biochem. Biophys. 2008, 471, 146–158. [Google Scholar] [CrossRef]
- Morgan, S.H.; Maity, P.J.; Geilfus, C.M.; Lindberg, S.; Mühling, K.H. Leaf Ion Homeostasis and Plasma Membrane H+-ATPase Activity in Vicia Faba Change after Extra Calcium and Potassium Supply under Salinity. Plant Physiol. Biochem. 2014, 82, 244–253. [Google Scholar] [CrossRef]
- Teixeira, M.; Carvalho, I.S. Effects of Salt Stress on Purslane (Portulaca oleracea) Nutrition. Ann. Appl. Biol. 2009, 154, 77–86. [Google Scholar] [CrossRef]
- Mei, X.Q.; Li, S.S.; Li, Q.S.; Yang, Y.F.; Luo, X.; He, B.Y.; Li, H.; Xu, Z.M. Sodium Chloride Salinity Reduces Cd Uptake by Edible Amaranth (Amaranthus mangostanus L.) via Competition for Ca Channels. Ecotoxicol. Environ. Saf. 2014, 105, 59–64. [Google Scholar] [CrossRef] [PubMed]
- Guo, W.; Chen, S.; Hussain, N.; Cong, Y.; Liang, Z.; Chen, K. Magnesium Stress Signaling in Plant: Just a Beginning. Plant Signal. Behav. 2015, 10, 37–41. [Google Scholar] [CrossRef] [PubMed]
- Nazar, R.; Iqbal, N.; Masood, A.; Syeed, S.; Khan, N.A. Understanding the Significance of Sulfur in Improving Salinity Tolerance in Plants. Environ. Exp. Bot. 2011, 70, 80–87. [Google Scholar] [CrossRef]
- Fatma, M.; Asgher, M.; Masood, A.; Khan, N.A. Excess Sulfur Supplementation Improves Photosynthesis and Growth in Mustard under Salt Stress through Increased Production of Glutathione. Environ. Exp. Bot. 2014, 107, 55–63. [Google Scholar] [CrossRef]
- Bendaly, A.; Messedi, D.; Smaoui, A.; Ksouri, R.; Bouchereau, A.; Abdelly, C. Physiological and Leaf Metabolome Changes in the Xerohalophyte Species Atriplex Halimus Induced by Salinity. Plant Physiol. Biochem. 2016, 103, 208–218. [Google Scholar] [CrossRef]
- Karlidag, H.; Yildirim, E.; Turan, M. Role of 24-Epibrassinolide in Mitigating the Adverse Effects of Salt Stress on Stomatal Conductance, Membrane Permeability, and Leaf Water Content, Ionic Composition in Salt Stressed Strawberry (Fragaria × ananassa). Sci. Hortic. 2011, 130, 133–140. [Google Scholar] [CrossRef]
- El-Fouly, M.M.; Mobarak, Z.M.; Salama, Z.A. Improving Tolerance of Faba Bean during Early Growth Stages to Salinity through Micronutrients Foliar Spray. Not. Sci. Biol. 2010, 2, 98–102. [Google Scholar] [CrossRef]
- Xiong, H.; Guo, X.; Kobayashi, T.; Kakei, Y.; Nakanishi, H.; Nozoye, T.; Zhang, L.; Shen, H.; Qiu, W.; Nishizawa, N.K.; et al. Expression of Peanut Iron Regulated Transporter 1 in Tobacco and Rice Plants Confers Improved Iron Nutrition. Plant Physiol. Biochem. 2014, 80, 83–89. [Google Scholar] [CrossRef]
- Schmidt, S.B.; Husted, S. The Biochemical Properties of Manganese in Plants. Plants 2019, 8, 381. [Google Scholar] [CrossRef]
- Schmidt, S.B.; Jensen, P.E.; Husted, S. Manganese Deficiency in Plants: The Impact on Photosystem II. Trends Plant Sci. 2016, 21, 622–632. [Google Scholar] [CrossRef] [PubMed]
- Yruela, I. Copper in Plants: Acquisition, Transport and Interactions. Funct. Plant Biol. 2009, 36, 409–430. [Google Scholar] [CrossRef]
- Huang, Y.; Bie, Z.; He, S.; Hua, B.; Zhen, A.; Liu, Z. Improving Cucumber Tolerance to Major Nutrients Induced Salinity by Grafting onto Cucurbita Ficifolia. Environ. Exp. Bot. 2010, 69, 32–38. [Google Scholar] [CrossRef]
- Li, J.; Yang, P.; Gan, Y.; Yu, J.; Xie, J. Brassinosteroid Alleviates Chilling-Induced Oxidative Stress in Pepper by Enhancing Antioxidation Systems and Maintenance of Photosystem II. Acta Physiol. Plant. 2015, 37, 222. [Google Scholar] [CrossRef]
- Murchie, E.H.; Lawson, T. Chlorophyll Fluorescence Analysis: A Guide to Good Practice and Understanding Some New Applications. J. Exp. Bot. 2013, 64, 3983–3998. [Google Scholar] [CrossRef] [PubMed]
- Shu, S.; Yuan, L.-Y.; Guo, S.; Sun, J.; Yuan, Y. Effects of Exogenous Spermine on Chlorophyll Fluorescence, Antioxidant System and Ultrastructure of Chloroplasts in Cucumis sativus L. under Salt Stress. Plant Physiol. Biochem. 2013, 63, 209–216. [Google Scholar] [CrossRef] [PubMed]
- Khoshbakht, D.; Asghari, M.R.; Haghighi, M. Influence of Foliar Application of Polyamines on Growth, Gas-Exchange Characteristics, and Chlorophyll Fluorescence in Bakraii Citrus under Saline Conditions. Photosynthetica 2018, 56, 731–742. [Google Scholar] [CrossRef]
- Stepien, P.; Johnson, G.N. Contrasting Responses of Photosynthesis to Salt Stress in the Glycophyte Arabidopsis and the Halophyte Thellungiella: Role of the Plastid Terminal Oxidase as an Alternative Electron Sink. Plant Physiol. 2009, 149, 1154–1165. [Google Scholar] [CrossRef]
- Buonasera, K.; Lambreva, M.; Rea, G.; Touloupakis, E.; Giardi, M.T. Technological Applications of Chlorophyll a Fluorescence for the Assessment of Environmental Pollutants. Anal. Bioanal. Chem. 2011, 401, 1139–1151. [Google Scholar] [CrossRef]
- Porcar-Castell, A.; Tyystjärvi, E.; Atherton, J.; van der Tol, C.; Flexas, J.; Pfündel, E.E.; Moreno, J.; Frankenberg, C.; Berry, J.A. Linking Chlorophyll a Fluorescence to Photosynthesis for Remote Sensing Applications: Mechanisms and Challenges. J. Exp. Bot. 2014, 65, 4065–4095. [Google Scholar] [CrossRef]
- Baker, N.R. Chlorophyll Fluorescence: A Probe of Photosynthesis in Vivo. Annu. Rev. Plant Biol. 2008, 59, 89–113. [Google Scholar] [CrossRef] [PubMed]
- Yuan, Y.; Shu, S.; Li, S.; He, L.; Li, H.; Du, N.; Sun, J.; Guo, S. Effects of Exogenous Putrescine on Chlorophyll Fluorescence Imaging and Heat Dissipation Capacity in Cucumber (Cucumis sativus L.) under Salt Stress. J. Plant Growth Regul. 2014, 33, 798–808. [Google Scholar] [CrossRef]
- Yan, H.; Hu, X.; Li, F. Leaf Photosynthesis, Chlorophyll Fluorescence, Ion Content and Free Amino Acids in Caragana Korshinskii Kom Exposed to NaCl Stress. Acta Physiol. Plant. 2014, 36, 2285–2295. [Google Scholar] [CrossRef]
- Aragão, R.M.; Silva, E.N.; Vieira, C.F.; Silveira, J.A.G. High Supply of NO3—Mitigates Salinity Effects through an Enhancement in the Efficiency of Photosystem II and CO2 Assimilation in Jatropha Curcas Plants. Acta Physiol. Plant. 2012, 34, 2135–2143. [Google Scholar] [CrossRef]
- Hasanuzzaman, M.; Shabala, L.; Zhou, M.; Brodribb, T.J.; Corkrey, R.; Shabala, S. Factors Determining Stomatal and Non-Stomatal (Residual) Transpiration and Their Contribution towards Salinity Tolerance in Contrasting Barley Genotypes. Environ. Exp. Bot. 2018, 153, 10–20. [Google Scholar] [CrossRef]
- Agrawal, R.; Gupta, S.; Gupta, N.K.; Khandelwal, S.K.; Bhargava, R. Effect of Sodium Chloride on Gas Exchange, Antioxidative Defense Mechanism and Ion Accumulation in Different Cultivars of Indian Jujube (Ziziphus mauritiana L.). Photosynthetica 2013, 51, 95–101. [Google Scholar] [CrossRef]
- Zheng, Y.H.; Xu, X.B.; Wang, M.Y.; Zheng, X.H.; Li, Z.J.; Jiang, G.M. Responses of Salt-Tolerant and Intolerant Wheat Genotypes to Sodium Chloride: Photosynthesis, Antioxidants Activities, and Yield. Photosynthetica 2009, 47, 87–94. [Google Scholar] [CrossRef]
- He, Y.; Yu, C.; Zhou, L.; Chen, Y.; Liu, A.; Jin, J.; Hong, J.; Qi, Y.; Jiang, D. Rubisco Decrease Is Involved in Chloroplast Protrusion and Rubisco-Containing Body Formation in Soybean (Glycine Max.) under Salt Stress. Plant Physiol. Biochem. 2014, 74, 118–124. [Google Scholar] [CrossRef]
- Rodrigues, C.R.F.; Silva, E.N.; da Mata Moura, R.; dos Anjos, D.C.; Hernandez, F.F.F.; Viégas, R.A. Physiological Adjustment to Salt Stress in R. Communis Seedlings Is Associated with a Probable Mechanism of Osmotic Adjustment and a Reduction in Water Lost by Transpiration. Ind. Crops Prod. 2014, 54, 233–239. [Google Scholar] [CrossRef]
- Chen, W.; Zou, D.; Guo, W.; Xu, H.; Shi, D.; Yang, C. Effects of Salt Stress on Growth, Photosynthesis and Solute Accumulation in Three Poplar Cultivars. Photosynthetica 2009, 47, 415–421. [Google Scholar] [CrossRef]
- Fu, Q.S.; Yang, R.C.; Wang, H.S.; Zhao, B.; Zhou, C.L.; Ren, S.X.; Guo, Y.D. Leaf Morphological and Ultrastructural Performance of Eggplant (Solanum melongena L.) in Response to Water Stress. Photosynthetica 2013, 51, 109–114. [Google Scholar] [CrossRef]
- Asmar, S.A.; Castro, E.M.; Pasqual, M.; Pereira, F.J.; Soares, J.D.R. Changes in Leaf Anatomy and Photosynthesis of Micropropagated Banana Plantlets under Different Silicon Sources. Sci. Hortic. 2013, 161, 328–332. [Google Scholar] [CrossRef]
- Sha Valli Khan, P.S.; Kozai, T.; Nguyen, Q.T.; Kubota, C.; Dhawan, V. Growth and Water Relations of Paulownia Fortunei Under Photomixotrophic and Photoautotrophic Conditions. Biol. Plant. 2003, 46, 161–166. [Google Scholar] [CrossRef]
- Bickford, C.P. Ecophysiology of Leaf Trichomes. Funct. Plant Biol. 2016, 43, 807. [Google Scholar] [CrossRef] [PubMed]
- Sarabi, B.; Bolandnazar, S.; Ghaderi, N.; Ghashghaie, J. Genotypic Differences in Physiological and Biochemical Responses to Salinity Stress in Melon (Cucumis melo L.) Plants: Prospects for Selection of Salt Tolerant Landraces. Plant Physiol. Biochem. 2017, 119, 294–311. [Google Scholar] [CrossRef]
- Sheperd, T.; Griffiths, D.W. The Effects of Stress on Plant Cuticular Waxes. New Phytol. 2006, 171, 469–499. [Google Scholar] [CrossRef]
- Avestan, S.; Ghasemnezhad, M.; Esfahani, M.; Byrt, C.S. Application of Nano-Silicon Dioxide Improves Salt Stress Tolerance in Strawberry Plants. Agronomy 2019, 9, 246. [Google Scholar] [CrossRef]
- Nikinmaa, E.; Hölttä, T.; Hari, P.; Kolari, P.; Mäkelä, A.; Sevanto, S.; Vesala, T. Assimilate Transport in Phloem Sets Conditions for Leaf Gas Exchange. Plant Cell Environ. 2013, 36, 655–669. [Google Scholar] [CrossRef]
- Javelle, M.; Vernoud, V.; Rogowsky, P.M.; Ingram, G.C. Epidermis: The Formation and Functions of a Fundamental Plant Tissue. New Phytol. 2011, 189, 17–39. [Google Scholar] [CrossRef]
- Sorin, C.; Musse, M.; Mariette, F.; Bouchereau, A.; Leport, L. Assessment of Nutrient Remobilization through Structural Changes of Palisade and Spongy Parenchyma in Oilseed Rape Leaves during Senescence. Planta 2015, 241, 333–346. [Google Scholar] [CrossRef]
- Polizel, A.M.; Medri, M.E.; Nakashima, K.; Yamanaka, N.; Farias, J.R.B.; Oliveira, M.C.N.; Marin, S.R.R.; Abdelnoor, R.V.; Marcelino-Guimarães, F.C.; Fuganti, R.; et al. Molecular, Anatomical and Physiological Properties of a Genetically Modified Soybean Line Transformed with Rd29A: AtDREB1A for the Improvement of Drought Tolerance. Genet. Mol. Res. 2011, 10, 3641–3656. [Google Scholar] [CrossRef] [PubMed]
- Paz, R.C.; Reinoso, H.; Espasandin, F.D.; González Antivilo, F.A.; Sansberro, P.A.; Rocco, R.A.; Ruiz, O.A.; Menéndez, A.B. Akaline, Saline and Mixed Saline-Alkaline Stresses Induce Physiological and Morpho-Anatomical Changes in Lotus Tenuis Shoots. Plant Biol. 2014, 16, 1042–1049. [Google Scholar] [CrossRef] [PubMed]
- Gill, S.S.; Tuteja, N. Reactive Oxygen Species and Antioxidant Machinery in Abiotic Stress Tolerance in Crop Plants. Plant Physiol. Biochem. 2010, 48, 909–930. [Google Scholar] [CrossRef]
- Abedi, T.; Pakniyat, H. Antioxidant Enzymes Changes in Response to Drought Stress in Ten Cultivars of Oilseed Rape (Brassica napus L.). Czech J. Genet. Plant Breed. 2010, 46, 27–34. [Google Scholar] [CrossRef]
- Fariduddin, Q.; Khalil, R.R.A.E.; Mir, B.A.; Yusuf, M.; Ahmad, A. 24-Epibrassinolide Regulates Photosynthesis, Antioxidant Enzyme Activities and Proline Content of Cucumis sativus under Salt and/or Copper Stress. Environ. Monit. Assess. 2013, 185, 7845–7856. [Google Scholar] [CrossRef] [PubMed]
- El-Mashad, A.A.A.; Mohamed, H.I. Brassinolide Alleviates Salt Stress and Increases Antioxidant Activity of Cowpea Plants (Vigna sinensis). Protoplasma 2012, 249, 625–635. [Google Scholar] [CrossRef] [PubMed]
- Yuan, G.F.; Jia, C.G.; Li, Z.; Sun, B.; Zhang, L.P.; Liu, N.; Wang, Q.M. Effect of Brassinosteroids on Drought Resistance and Abscisic Acid Concentration in Tomato under Water Stress. Sci. Hortic. 2010, 126, 103–108. [Google Scholar] [CrossRef]
- Siddiqui, M.H.; Al-Khaishany, M.Y.; Al-Qutami, M.A.; Al-Whaibi, M.H.; Grover, A.; Ali, H.M.; Al-Wahibi, M.S.; Bukhari, N.A. Response of Different Genotypes of Faba Bean Plant to Drought Stress. Int. J. Mol. Sci. 2015, 16, 10214–10227. [Google Scholar] [CrossRef]
- Hu, L.; Li, H.; Pang, H.; Fu, J. Responses of Antioxidant Gene, Protein and Enzymes to Salinity Stress in Two Genotypes of Perennial Ryegrass (Lolium perenne) Differing in Salt Tolerance. J. Plant Physiol. 2012, 169, 146–156. [Google Scholar] [CrossRef]
- Farhangi-Abriz, S.; Torabian, S. Antioxidant Enzyme and Osmotic Adjustment Changes in Bean Seedlings as Affected by Biochar under Salt Stress. Ecotoxicol. Environ. Saf. 2017, 137, 64–70. [Google Scholar] [CrossRef]
- Takahashi, S.; Badger, M.R. Photoprotection in Plants: A New Light on Photosystem II Damage. Trends Plant Sci. 2011, 16, 53–60. [Google Scholar] [CrossRef] [PubMed]
- Shu, S.; Guo, S.R.; Sun, J.; Yuan, L.Y. Effects of Salt Stress on the Structure and Function of the Photosynthetic Apparatus in Cucumis sativus and Its Protection by Exogenous Putrescine. Physiol. Plant. 2012, 146, 285–296. [Google Scholar] [CrossRef] [PubMed]
- Ma, L.; Li, Y.; Yu, C.; Wang, Y.; Li, X.; Li, N.; Chen, Q.; Bu, N. Alleviation of Exogenous Oligochitosan on Wheat Seedlings Growth under Salt Stress. Protoplasma 2012, 249, 393–399. [Google Scholar] [CrossRef]
- Aghaleh, M.; Niknam, V.; Ebrahimzadeh, H.; Razavi, K. Salt Stress Effects on Growth, Pigments, Proteins and Lipid Peroxidation in Salicornia Persica and S. Europaea. Biol. Plant. 2009, 53, 243–248. [Google Scholar] [CrossRef]
- Fricke, W.; Peters, W.S. The Biophysics of Leaf Growth in Salt-Stressed Barley. A Study at the Cell Level. Plant Physiol. 2002, 129, 374–388. [Google Scholar] [CrossRef] [PubMed]
- Zahra, J.; Nazim, H.; Cai, S.; Han, Y.; Wu, D.; Zhang, B.; Haider, S.I.; Zhang, G. The Influence of Salinity on Cell Ultrastructures and Photosynthetic Apparatus of Barley Genotypes Differing in Salt Stress Tolerance. Acta Physiol. Plant. 2014, 36, 1261–1269. [Google Scholar] [CrossRef]
- Degl’Innocenti, E.; Hafsi, C.; Guidi, L.; Navari-Izzo, F. The Effect of Salinity on Photosynthetic Activity in Potassium-Deficient Barley Species. J. Plant Physiol. 2009, 166, 1968–1981. [Google Scholar] [CrossRef]
- Hussain, M.I.; Lyra, D.A.; Farooq, M.; Nikoloudakis, N.; Khalid, N. Salt and Drought Stresses in Safflower: A Review. Agron. Sustain. Dev. 2016, 36, 4. [Google Scholar] [CrossRef]
- Khan, M.I.R.; Asgher, M.; Khan, N.A. Alleviation of Salt-Induced Photosynthesis and Growth Inhibition by Salicylic Acid Involves Glycinebetaine and Ethylene in Mungbean (Vigna radiata L.). Plant Physiol. Biochem. 2014, 80, 67–74. [Google Scholar] [CrossRef]


Disclaimer/Publisher’s Note: The statements, opinions and data contained in all publications are solely those of the individual author(s) and contributor(s) and not of MDPI and/or the editor(s). MDPI and/or the editor(s) disclaim responsibility for any injury to people or property resulting from any ideas, methods, instructions or products referred to in the content. |
© 2023 by the authors. Licensee MDPI, Basel, Switzerland. This article is an open access article distributed under the terms and conditions of the Creative Commons Attribution (CC BY) license (https://creativecommons.org/licenses/by/4.0/).