Abstract
Climate change is exacerbating adverse impacts of water stress in rainfed agriculture. This paper seeks to identify safe sowing windows for smallholder farmers in the Sudanian region of West Africa (WA). We hypothesize that the traditional focus on the onset of the season to start sowing leads to crop losses in years of high rainfall intermittency. AquaCrop, an FAO crop model, is used to simulate the yield response of maize (Zea mays L.) to sowing dates ranging from the 1st of May to the 30th of November at 20 locations in WA. We find that sowing directly after the first rains carries a higher risk of water stress, hampering crop development due to insufficient buildup of soil water storage to overcome dry spells. Based on three years of data per station on average, we identify safe sowing windows across the Sudanian region that secure optimal yield in 97% of all cases. We find that delaying sowing to mid-June (savanna and western part of the region) and to July (semi-arid region) ensures optimal yields. Of the three commonly applied local onset approaches covered in our evaluation, only LO10mm (10 mm/day on four consecutive days) achieves a similar yield result. The advantage of the safe window approach is that it is accessible for smallholders, who in many cases do not have access to local rainfall information.
1. Introduction
Food production is under increasing pressure worldwide to feed the ever-growing population []. At the same time, in 2021 a quarter of the population in Sub-Saharan Africa was facing moderate to severe food insecurity []. The situation is especially precarious under rain-fed agriculture, where there are no mitigating measures that can be taken to cope with climate extremes. Reliance on rain-fed agriculture in West Africa (WA) is particularly problematic, as rainfall patterns are highly variable on decadal and inter-annual time scales []. To help farmers deal with this rainfall uncertainty, agro-meteorological indices have been introduced to support farmers in making crop decisions. However, the occurrence of long dry spells (7 to 15 days) at the start and end of the rainy season [,] continues to have negative effects on crop yields, which in most cases remain below 2 t/ha for maize [,,]. Hence, better management practices are necessary, especially adaptation to dry spells at the start of the season, which is a predominant factor in crop yield losses [].
The unpredictability of the onset of the rainy season has led to the so-called phenomenon of the “false start” or “false onset” characterized by erratic rain events at the beginning of the season followed by intermittent dry spells of various lengths [,]. In the last decades, agro-climatologists have proposed two onset approaches to address the challenge of false starts in WA. While the approach based on atmospheric dynamics or regional onset focuses on the migration of the Inter-tropical Convergence Zone (ITCZ) from latitude 5 N to 10 N [,], the local onset approach focuses on empirical thresholds of accumulated rainfall totals over a period of time (control period) [,,]. A case study in Niger for the years 1968–1990 highlights the strong link between dry spells at late crop stages and yield failure []. Thus, while the start of the season is crucial, rainfall variability throughout the growing season needs attention.
Assessing the rainfall pattern can elucidate critical periods and stress-sensitive stages that could potentially hinder crop development. Such an analysis helps in identifying safe sowing windows and can support farmers in making informed decisions and improving yields []. In addition to the study by [], we include different locations and associated water stress levels and identify safe planting windows. Moreover, the development of crop insurance products, such as germination insurance, can greatly profit from better insights into optimal sowing dates.
In this study, we aim to identify robust sowing windows within the rainy season that secure crop yield under rainfall variations. We use a water-driven crop growth model, AquaCrop v6.1, run with meteorological observations from 20 stations across the Sudanian agro-climatological region to study yield response to rainfall variability for a wide range of sowing dates. We evaluate existing rainfall-based definitions of local onset use in the region to start sowing in order to assess whether they fall within the safe sowing window. The outcomes can help farmers to prevent untimely sowing decisions and optimize rainwater use to secure crop yields.
2. Data Description
2.1. Study Area
The study area is the Sudanian agro-climatological region of WA. The majority of food crops in WA are grown under rainfed and labor-intensive conditions []. The main crops grown are maize (Zea mays L.), sorghum (Sorghum bicolor), Pearl millet (Pennisetum glaucum), and beans (Phaseolus vulgaris L.). The climatology of the region is characterized by a unimodal rainfall season that runs from April/May through October following a northward latitudinal gradient associated with the ITCZ []. Mean daily temperature during the rainy season varies from 26 C in the south to 30 C in the northern part of the region. Annual rainfall ranges from 438 mm to 1265 mm from the north to the south of the Sudanian region [].
2.2. Data Sources
Meteorological observations from 20 stations from the network of the Trans-African Hydro-Meteorological Observatory (TAHMO, https://tahmo.org/, accessed on 22 June 2021) were used in this study. The stations were selected to represent the range of climate conditions in the study area. Only stations with at least 3 years of continuous data (data gaps of not more than 10 days) were selected for the analysis. The stations are distributed across the Sudanian region (see Figure 1) and cover six countries: Benin, Burkina Faso, Ghana, Mali, Nigeria, and Togo. The TAHMO stations provide observations of rainfall, temperature, atmospheric pressure, and relative humidity at a 5-min resolution []. Table 1 provides an overview of the coordinates, mean annual rainfall, and evaporation of the 20 meteorological stations.
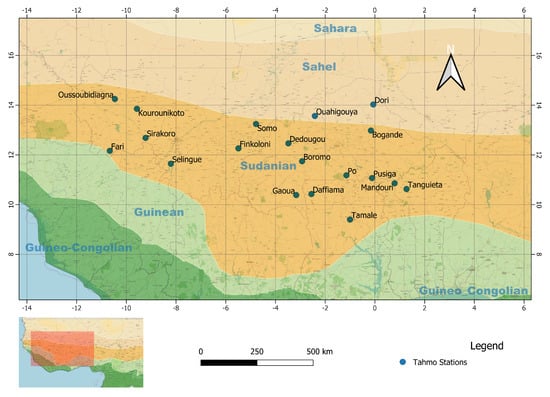
Figure 1.
Agro-climatological regions in West Africa and the locations of the 20 TAHMO stations across the Sudanian region.
Soil profile information was extracted from the Africa Soil Profiles Database, Version 1.2 (AfSP v1.2, https://www.isric.org/projects/africa-soil-profiles-database-afsp (accessed on 13 September 2021)), compiled by ISRIC—World Soil Information (World Data Center for Soils). We validated the soil profile data using the Soil Atlas of Africa dataset (SAA) at the scale of 1:3 M, derived among others from the Harmonized World Soil Database and the FAO-UNESCO Soil map of the World []. For locations where the soil profile was not available, the dominant WRB reference soil group of the location was extracted from the SAA map, and the closest station having the same soil group and properties was considered for the analysis. Soil texture was used as input into the Soil Water Characteristics module of SPAW (Soil Plant Atmosphere Water), a hydraulic properties calculator, to estimate saturated hydraulic conductivity (K) and water holding capacity of the soil, which are required parameters to run AquaCrop simulations (ars.usda.gov, https://www.ars.usda.gov/research/software/ (accessed on 13 September 2021); []).

Table 1.
TAHMO stations, names and IDs, coordinates, mean annual rainfall () and reference evapotranspiration ( based on Makkink []) and period of data availability.
Table 1.
TAHMO stations, names and IDs, coordinates, mean annual rainfall () and reference evapotranspiration ( based on Makkink []) and period of data availability.
| Mean | Mean | |||||
|---|---|---|---|---|---|---|
| ID | Stations | Coordinates | Country | (mm) | (mm) | Period |
| Bog | Bogande | 12.98 N; 0.16 W | Burkina Faso | 488.7 | 1253.3 | 2017–2019 |
| Bor | Boromo | 11.74 N; 2.93 W | Burkina Faso | 1013.4 | 1252.1 | 2018–2020 |
| Daf | Daffiama | 10.42 N; 2.55 W | Ghana | 795.7 | 1287.2 | 2018–2020 |
| Ded | Dedougou | 12.46 N; 3.48 W | Burkina Faso | 920.2 | 1205.1 | 2017–2020 |
| Dor | Dori | 14.03 N; 0.07 W | Burkina Faso | 438 | 1349.3 | 2017–2020 |
| Far | Fari | 12.16 N; 10.67 W | Mali | 984 | 1127 | 2018–2020 |
| Fin | Finkoloni | 12.26 N; 5.49 W | Mali | 970.8 | 1499 | 2017, 2019–2020 |
| Gao | Gaoua | 10.39 N; 3.17 W | Burkina Faso | 1101.5 | 1280 | 2017–2020 |
| Kou | Kourounikoto | 13.85 N; 9.58 W | Mali | 989 | 1276 | 2018–2020 |
| Man | Mandouri | 10.86 N; 0.79 W | Togo | 613 | 1050.4 | 2018–2020 |
| Oua | Ouahigouya | 13.57 N; 2.42 W | Burkina Faso | 984 | 1282.2 | 2017–2020 |
| Ous | Oussoubidiagna | 14.25 N; 10.46 W | Mali | 619 | 1185 | 2018–2020 |
| Po | Po | 11.18 N; 1.4 W | Burkina Faso | 1264.7 | 1159.8 | 2017–2020 |
| Pus | Pusiga | 11.07 N; 0.11 W | Ghana | 1226.8 | 1155.3 | 2018–2020 |
| Sel | Selingue | 11.65 N; 8.21 W | Mali | 478.4 | 1220.2 | 2018–2020 |
| Sir | Sirakoro | 12.68 N; 9.23 W | Mali | 987.1 | 1110.4 | 2018–2020 |
| Som | Somo | 13.24 N; 4.78 W | Mali | 487.1 | 1532.1 | 2017, 2019–2020 |
| Tam | Tamale | 9.50 N; 1.00 W | Ghana | 588.9 | 1205.1 | 2019–2020 |
| Tan | Tanguieta | 10.63 N; 1.27 E | Benin | 980.7 | 1070.5 | 2017–2020 |
| Uni | Unimaid | 11.81 N; 13.21 E | Nigeria | 503.8 | 1315 | 2016–2017, 2020 |
Interviews and discussions with 64 farmers in the northern regions of Benin and Ghana during field trips enabled us to define the management practices (limited/no use of fertilizer, no irrigation) as well as the current practice with respect to sowing time.
2.3. Seasonal Variability of Rainfall and Evaporation in the Study Region
The set of stations covers a period of 3 years on average between 2016 and 2020, for a total of 64 years of data analyzed for all the stations together. Average annual rainfall varies between 500mm and 1100mm, reflecting the spatial variability of rainfall with latitude in the Sudanian region of WA []. Most of the rain falls between the months of June and September (80% and 91% on average for the savanna and the semi-arid zones, respectively). Reference evapotranspiration (Eref based on []) is nearly twice the annual precipitation, yet during the rainy season Eref nearly equals this amount of rainfall.
Figure 2 presents the average seasonal rainfall sufficiency (cumulative difference between daily precipitation and evapotranspiration, for the months of May to October) for each of the 20 stations, sorted by latitude (low to high). At most stations (13 out of 20) seasonal rainfall can meet evaporative demand (Sufficiency ). In total, the dataset contains seven severe dry years out of the 64 years with annual rainfall about/below half of the average annual rainfall. There are also ten years with lower annual rainfall than the long-term mean.
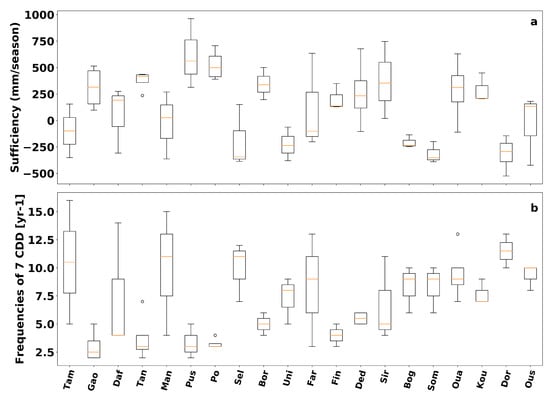
Figure 2.
(a) Average rainfall sufficiency in the growing season (from May to October), computed as the difference between daily precipitation and evapotranspiration. Evaporation computed following Makkink []. (b) Frequency of 7-day consecutive dry days (CDD), mean, and variability over the study period. Stations are ordered by increasing latitude from left to right.
2.4. Dry Spells during the Growing Season
With all stations used in this study, we have a total of 64 years, allowing for more general summary statistics. On average, each station experienced 30 (std = 8) and 7 (std = 3.5) dry spells of 3 and 7 consecutive dry days per rainy season, respectively (Figure 2). We analyzed the frequency of dry spells exceeding 7 and 10 days within the 30 days following a reference date. Reference dates are defined as the first day of each of the three dekads of each month of the rainy season. The term dekad here refers to days 1–10, 11–20, and 21–30/31 of each month, as defined by []. For each 30-day period, the maximum length of dry spells was determined. This length was compared to the threshold values (7 and 10) to calculate the frequency of 30-day periods in which it was exceeded for the length of the 3-year dataset.
Figure 3 shows the dekadal occurrence of dry spells in the growing season for four selected locations representative of wet and well-distributed (Gaoua and Dedougou) and dry or unevenly distributed (Oussoubadiagna and Dori) rainy seasons. At well-watered stations such as Gaoua, the risk of long dry spells (≥7 days and ≥10 days) is quite low after mid-May (<25%), whereas at drier stations (Oussoubidiagna and Dori) the risk is greater than 70% until mid-June. The rain season is shorter at these stations, with dry spell occurrence increasing steeply after mid-July. Three out of four stations experience a period of increased risk of dry spells in the middle of the season (mid-June to early July).
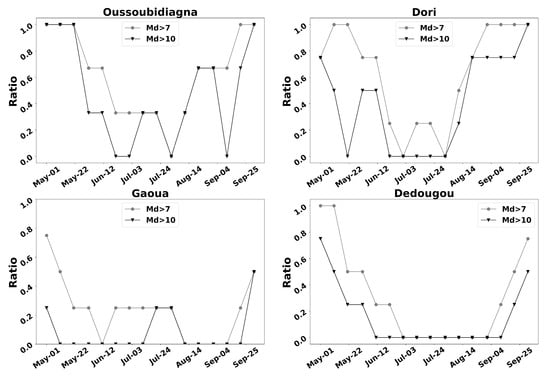
Figure 3.
Ratio of maximum dry spells (Md) exceeding 7 and 10 days within 30 days after a specific date at four selected locations. The ratio is defined as the number of years a maximum dry spell occurs over the three-year data period per location, following [].
3. Methods
3.1. Definitions of the Onset of the Rainy Season for Agriculture
In this study, we focus on the local or precipitation threshold-based onset, which is deemed most relevant for smallholder farmers in WA with lower levels of education []. The alternative regional onset approach requires information at a level not generally accessible to small-scale farmers []. We consider three local onset definitions based on the literature and local practices in the WA region. The first, LO20mm hereafter, defines the onset as one or two consecutive rainy days accumulating at least 20 mm with no 7-day dry spell occurring during the next 30 days counted from the onset []. This approach prioritizes sufficient water availability; however, it requires a long control period (30 days) until farmers can start to plant. The second approach, FP20mm, which is mostly practiced by smallholder farmers in the region, is based on one or two consecutive days of rain with a total of about 20 mm. This should ensure sufficient soil humidity to sustain seed germination [,,]. The third local onset approach, termed agronomical onset, accounts for both rainfall and evapotranspiration, defined as an average of four consecutive rainy days exceeding 10 mm daily (LO10mm) [].
3.2. The FAO Crop Model, AquaCrop
Crop development and yield response were computed using AquaCrop, an FAO crop model []. Crop modeling enables the evaluation of optimal conditions by simulating the plant in its environment, crop water requirement, and stresses at different stages of crop development. Thus, the safe sowing window was assessed by computing the response to different sowing dates from 1 May to 30 November for each season.
3.2.1. Description of the Model
Of the various crop models, AquaCrop was chosen as a user-friendly yet robust crop model especially well suited for conditions where water is a key limiting factor for crop yield. It can be adapted to various conditions, agricultural water management practices, and planning [,]. The model uses a relatively limited amount of input data, and is widely used in regions similar to WA [].
In AquaCrop, daily crop biomass is associated with the transpired water through the biomass water productivity []. Hence, the water-driven growth engine of AquaCrop simulates the crop green canopy cover (CC in %) on daily time steps from crop emergence through the development and senescence of the canopy, while the root system develops and deepens. Transpiration is then converted into biomass accumulated every day using a crop-specific water productivity parameter (1) normalized for reference evapotranspiration:
where, at day i, is the aboveground biomass (g), is the normalized crop water productivity (g of biomass per m), is the transpiration (mm), and is the evaporative demand of the atmosphere (mm).
This normalization makes a parameter applicable to a wide range of climates []. After the biomass is calculated by accumulation, the yield (Y) is partitioned from flowering using (2) via the harvest index ( in %). We obtain the following:
As a water-driven model, AquaCrop introduces the effects of water stress, which affects each component of the model. The water stress response is expressed as a stress coefficient that modifies the simulated component. It varies in value from 1 (no stress) to 0 (full stress) as a function of the total available water (TAW) []. Above an upper threshold of soil water content, the water stress is considered to be absent and is 1. Below a lower threshold, the stress is at its full effect and Ks is 0. The water deficit response is expressed through stress coefficients that progressively slow down canopy expansion, reduce stomatal conductance and transpiration, trigger and accelerate canopy senescence, decrease root deepening, and affect the harvest index depending on stress level, timing, and duration.
AquaCropv6.1 was used in this analysis, which requires as input weather data (precipitation, max and min temperature, , concentration), soil information (soil profile, textures, and hydraulic properties of each layer), crop information (phenology, plant density, canopy cover, max root depth), and management information (irrigation schedule, application of mulches, water table).
3.2.2. Parameterization of the Model
We considered a water-sensitive crop, 90 days maturation maize, as a suitable crop that is widely grown in the region. The aim was to run the Aquacrop model under different weather patterns observed across the WA region in order to investigate the impact of varying rainfall patterns on crop yields under rainfed farming. Considering the large number of parameters in Aquacrop and the scarce field data from the region, a formal model calibration of this regional yield study is not feasible, as has been acknowledged in [,,,]. Instead, we calibrated AquaCrop by choosing realistic parameter values determined in field trial studies in the region. We used default conservative parameters provided by [,] and chose realistic parameter values determined and validated in field trial studies across the region [] and areas with similar agro-climatic conditions [] for maize simulation, presented in Table 2. The model was further fine-tuned (see Table 3 for non-conservative parameters based on []) to best approximate yield ranges observed in previous studies under rainfed conditions in WA [,,]. We incorporated information from specific regions collected by the project Global Yield Gap Atlas (https://www.yieldgap.org/gygaviewer/index.html (accessed on 13 September 2021)), such as actual on-farm yield under rainfed conditions at the finest available resolution (sub-district, district or municipality; see Table 4).

Table 2.
Conservative maize parameters (from [] used in the AquaCrop simulations).

Table 3.
Non-conservative parameters adjusted (*) based on [] for 90 days maturation Maize and [,].

Table 4.
Comparison of actual yield ranges (from Global Yield Gap Atlas (https://www.yieldgap.org/gygaviewer/index.html (accessed on 13 September 2021)), 2007–2011) to actual yield ranges of maize simulated with AquaCrop using the TAHMO dataset (2018–2020).
The normalized WP was set to 15.3 g m (inbuilt severe stress conditions), implying 54% reduction of WP (53% in []) as compared to the default values for C4 crops (30 g m to 35 g m). This value of WP describes the reduction in water productivity and relative biomass observed in arid and semi-arid regions []. In the rainfed context of WA and based on field measurements, [] calibrated WP with a 53% reduction (15.8 g m) with respect to its default value (33.7 g m) to achieve relatively small errors (4% at calibration, 8% at validation). Thus, without access to field experimental data, the same values were used in our simulations, as our stations are located in the same agroecological regions as the station where the study was performed.
Additionally, management constraints (limited soil fertility and weed control/management) were implemented to represent the agricultural situation of rainfed smallholder farming in WA. AquaCropv6.1 offers the possibility of simulating the effects of soil fertility and limitations induced by weed stresses []. We followed [] when it comes to settings for fertility levels and weed pressure by choosing poor fertility and a 53% yield reduction due to weed pressure. They obtained relatively small errors. Here, we expect larger errors in general, as the specific circumstances vary widely over the region; however, we expect the obtained yields to be realistic and typical. To account for these limitations, the model was set to the inbuilt poor soil fertility level (i.e., total soil fertility stress of 66%) corresponding to no application of fertilizer.
4. Results and Discussion
4.1. Crop Model Performance
Table 4 compares yield data from the Global Yield Gap Atlas (GYGA) and simulated yields by the Aquacrop model for the same or nearest locations to the TAHMO stations we used in our study. Simulated yields were obtained using AquaCrop, applying the same sowing dates and the same climate data provided in the GYGA database (https://www.yieldgap.org/gygaviewer/index.html (accessed on 13 September 2021)). The AquaCrop results capture the range of actual yields reported at each location in the GYGA database. Discrepancies are found for the stations in Mali (highest average yields in WA []), likely explained by management practices and soil fertility differing from the settings used in the model [].
Overall, yields in the Sudanian region of WA range from 0 t ha (crop failure) to a maximum of 1.7 t ha. This is in agreement with yields previously reported in the literature [,,]. Figure 4 shows the simulated versus actual yields for the locations listed in Table 4. The associated metrics, root mean square error ( t/ha), and coefficient of determination () indicate that the simulated yields fit and correlate well with the observed actual yields on-farm. Hence, the set of parameters used here (Table 2 and Table 3) adequately represents farming practices in WA. Moreover, the nutrient level considered (0 N kg/ha) reflects the poor soil quality of most farmlands, which are typically burned after the harvest with no or little addition of fertilizers []. Table 4 shows a typical example of an AquaCrop run with weed control and normal soil fertility. Clearly, these values are much higher than what is typically found on smallholder farms in the region [,]. Very important is that in this case the relative results show that certain years and sowing dates do greatly reduce the yield (see Table 4-Oussoubidiagna).
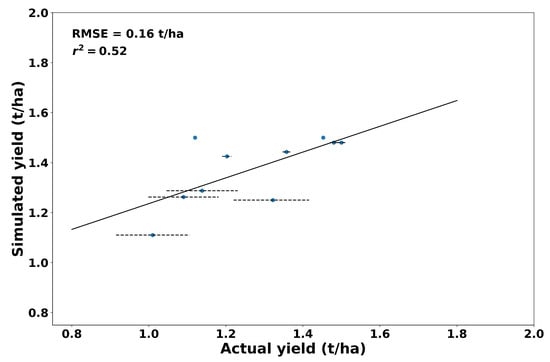
Figure 4.
Correlation fit for actual on-farm yield versus simulated yield computed at the same or nearest locations to the TAHMO stations used in this study.
4.2. Yield Distribution in Response to Varying Sowing Dates
Crop response varies with the sowing date as a result of varying weather conditions, in particular, the occurrence of dry spells during the growing stages of the crop. Figure 5 shows the variation of yield response for sowing dates ranging from 1 May to 30 November at four selected stations across the region. For the stations Oussoubidiagna, Gaoua, and Dedougou, yields of 1.4–1.6 t ha are achieved for a window of sowing dates between 20 June and 20 August. Variability in the width of the sowing windows occurs at all three locations; at Oussoubidiagna, one of the years even shows a very narrow window wherein yields of no more than 0.95 t ha are reached. At Dori, the driest location, a very narrow window of less than a month is observed, with yields varying between 1.3 and 1.6 t ha. Yields decrease sharply beyond this window, and drop to complete yield failure within a few weeks. This makes the selection of an appropriate sowing date particularly important. We stress again that these results should not be taken as absolute yields with known error distributions, but rather as relative yields as a function of location and planting date.
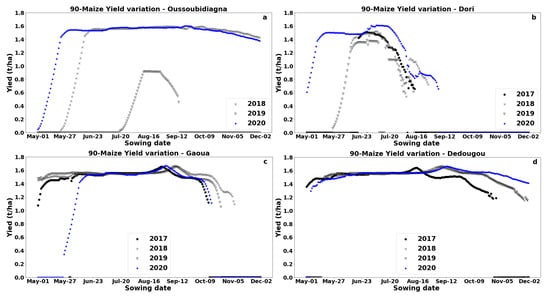
Figure 5.
Variation in yield response for 90-day maize for each date of the sowing window from 1st May to 31st November at four selected locations: (a) Oussoubidiagna, (b) Dori, (c) Gaoua, and (d) Dedougou.
Figure 3 and Figure 5 indicate that sowing early in May after the first rains is a risky strategy for several locations, as the crop is likely to experience water stress, especially in dry years. In addition, at the beginning of the rainy season, regardless of the intensity of the rains, two important phenomena can be observed. First, soil evaporation is more important than transpiration due to the dry state of the soil after a long dry season (November to March) []. Second, the soil is still building up water storage to sustain crop growth and overcome subsequent rainfall deficits. This highlights the importance of soil water storage and of different water conservation techniques used in agriculture with proven effects on yield production [].
Therefore, it seems that waiting for several rain events and sowing late might solve the sowing challenge. However, the graphs suggest that at locations such as Dori, waiting too long can lead to reduced yield (failure). This is in agreement with the northward/southward movement of the Inter-Tropical Convergence Zone (ITCZ) in WA []. In fact, the northward shift of the ITCZ (rainfall maximum) to the Sudanian region occurs around May, while the inverse movement happens around mid-August, leading to a decrease in rainfall. This implies that sowing beyond the adequate sowing window may only extend the growing season beyond the rainy season and lead again to water stress at the end of the crop development []. Hence, it matters how sowing strategies are determined. A safe sowing window can be identified for recommendation purposes. Defining the safe sowing window for each of the locations, understanding the reasons behind yield reduction, along with how well the different definitions of the onset perform, is therefore crucial to minimizing crop losses.
4.3. Comparing Yield Response for Three Local Onset Approaches
Sowing dates based on three different local onset approaches vary from as early as the first week of May to mid-September (Figure 6), reflecting the northward shift of the sowing dates, which follows the northward migration of the ITCZ. LO20mm and FP20mm generally occur earlier in the season (50% and 66% of the sowing dates in May respectively), while LO10mm occurs later compared to the first two approaches. The mean local onset date across all stations is 30 May for FP20mm, 8 June for LO20mm, and 17 June for LO10mm.
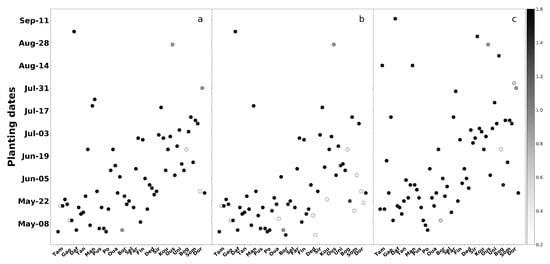
Figure 6.
Yield response for sowing dates according to three local onset approaches. The shading of each marker represents the amount of yield [0–1.7 t ha] achieved at each location. (a) LO20mm, (b) FP20mm, (c) LO10mm.
The LO20mm onset helps achieve a reasonably good yield response, with an average yield of 1.4 t ha (std = 0.4). Considering the optimal yield at a station as at least 90% of the maximum simulated yield, optimal yield is reached in 57 out of 64 cases with LO20mm. Similar results are observed for LO10mm, with an average yield of 1.5 t ha (std = 0.3) and >90% yield in 59 out of 64 simulations. For FP20mm, the average yield is 1.2 t ha (std = 0.6), with optimal yield in 52 cases. FP20mm fails completely (0 t ha) in twelve cases, while LO20mm completely fails in five and LO10mm in two cases out of 64.
The 30-day control period incorporated in the LO20mm approach seems to provide an extra buffer to prevent the crop from experiencing important water stress at early development stages, protecting it from complete failure [,].
4.4. Effects of Water Stress on Crop Development
The analysis of stress effects and water content in the soil provides insights into yield failure when considering a specific onset date. Figure 7 shows the daily crop response (1. biomass and yield build-up, 2. stress effects, 3. rainfall distribution, and 4. soil water content) when considering LO20mm and a sowing date within the safe window at Gaoua in 2020. Despite both the water threshold and control period criteria being satisfied according to LO20mm (10 May 2020), the crop experiences severe stress during the first month of its development (Figure 7(a2)). Shortly after sowing, most rainfall is lost directly due to evaporation. Consequently, the soil water content in the effective root zone (Wr) remains at permanent wilting point (PWP). As a result, the crop experiences persistent and intense water stress (between 50% and 100%) after emergence, affecting leaf expansion and stomatal conductance, and disabling the production of any biomass. This triggers early canopy senescence, leading to crop failure by June 24. The same scenario is observed for FP20mm.
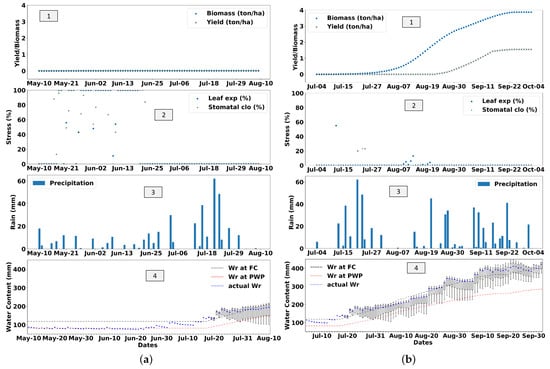
Figure 7.
Crop yield and biomass accumulation (1), stress effects on leaf and stomatal closure (2), daily rainfall (3), and water content in the effective rooting zone (4) for sowing dates according to LO20mm on 10 May 2020 (a), and a date within safe sowing window (4 July 2020)—Gaoua (b). Actual Wr is the water content in the effective root zone compared to water content at field capacity (FC) and at permanent wilting point (PWP).
Alternatively, for the sowing date of 4 July 2020, within the safe sowing window (Figure 7b) the soil water content is at field capacity upon sowing, and oscillates around the same water content level throughout the growing season. Although the crop experiences a dry spell of 8 days shortly after sowing, leading to 55% stress on leaf expansion and 23% stress on stomatal conductance, subsequent rains soften the effects, preventing crop failure. Moreover, the water storage built up from the beginning of the rainy season up to the sowing date enables the crop to overcome two other dry spells of two weeks at the beginning of August (vegetative stage) and one week during yield formation. The total stress experienced at the end of the season amounts to 1% stress on both leaf expansion and stomatal conductance, and maximum yield was achieved. Similar results were observed for LO10mm (sowing date 13 July 2020).
These results confirm that enabling the soil to build up sufficient water storage is a safe approach to prevent both false starts and harmful dry spells during the growing season. Benoit [] recommended the same approach to farmers in the Sudan-savanna region of Nigeria. This approach helps protect the crop from severe water stress during the two most critical stages of emergence and flowering.
4.5. Safe Sowing Window across West Africa
The safe sowing window is defined as the sowing dates during the rainy season that lead to at least 90% of maximal yield at a particular location. Figure 8 shows the safe sowing window computed using AquaCrop for all stations in 2020 (see Figure A1 and Figure A2 for the years 2018 and 2019, respectively). The start of the safe window follows the south-north gradient of maximum rain and a second northwestward shift. In the savanna region, with relatively high and well-distributed rainfall, the start of the window is nearly invariant and takes place in May while a delay is observed until June for the western part and July for the semi-arid zone.
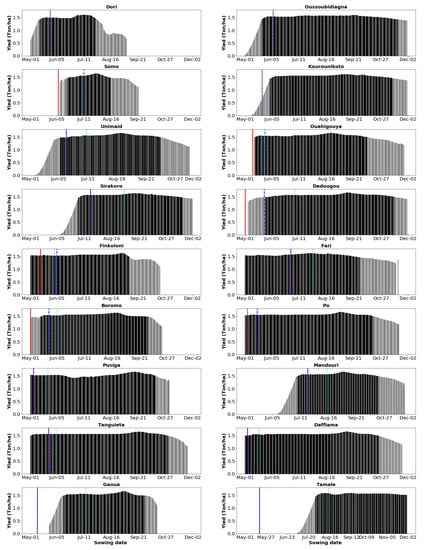
Figure 8.
Variation of yield response to each date of the sowing window from 1st May to 31st November in 2020 expressed as bar chart for the available locations. The dark bars represent the safe windows and the vertical lines represent the different sowing based on the three definitions: (i) red for FP20mm, (ii) blue for LO20mm, and (iii) cyan for LO10mm.
To account for the alternate behavior of wet/dry years within the datasets, we define the safe window in the context of this analysis as the intersection between all windows securing optimal yield at a location. Thus, we observe a safe window on average from the beginning of June (June 4th) in the savanna region, mid-June, and the last week of June for the western part and the semi-arid regions, respectively. The end of the window and therefore its length seems wide for the whole region except for the semi-arid region where, beyond the month of July, the crop is exposed to dry spells during the late stages of crop development (see Figure 5—Dori). Marteau et al. [] noticed the same phenomenon when simulating the yield response of pearl millet (Pennisetum glaucum) in southwest Niger. These results corroborate previous studies that observe the same shift of the onset: a northward shift of the onset from mid-May in south Burkina Faso to late July in central-northern Mali [], and an optimal sowing window from early May to early July, respectively, from the south to the north of Burkina Faso []. Ati et al. [] noticed for the region where Unimaid is located that sowing between June and early July would help combat false start using a method based on rainfall and evaporation.
Farmers often do not have access to the accurate rainfall information needed in order to apply the local onset definitions discussed in this paper. The safe sowing windows serve as guidelines for the different zones of the Sudanian region. It is therefore recommended that sowing moments are delayed in the southern regions until at least mid-June, while in the semi-arid region (dryer) sowing must take place in July for drought-sensitive crops such as maize. Delaying the sowing ensures that considerable consecutive rains have fallen, that the high vulnerability to dry spells at the start of the season is avoided, and that there is enough time to build up soil water storage.
5. Conclusions
In this paper the FP20mm approach currently used by most farmers is shown not to be a reliable sowing criterion, as 12 cases out of 64 resulted in complete yield failure. Yield losses are explained by a high likelihood of dry spells occurring shortly after the first rains within the sowing date range of FP20mm. By contrast, LO20mm and LO10mm result in 57 and 54 out of 64 cases, respectively, reaching optimal yield, which is at least 90% of maximum yield at the location. However, these two approaches pose challenges for smallholder farmers because many of them do not have access to reliable rainfall information. Moreover, the control period of the LO20mm approach, no 7-dry-spell in 30 days following the first two rain events of 20 mm, is hardly practical. It requires monitoring for dry spells for a period of 30 days before making a decision, which may lead to sowing too late.
On the other hand, our results based on computed yields for twenty stations across the region over a period of three years (2018–2020) for sowing dates between May and November show that there is a safe window that ensures optimal yields in 97% of the cases. Delaying the sowing date beyond the onset of the rainy season, to mid-June in the lower latitudes (savanna) and the western part of the region and to July for the higher latitudes (semi-arid region), ensures optimal yields in nearly all cases. Only in two cases is yield reduced by half due to exceptionally dry years. Delaying the sowing dates in this way helps to avoid the false start of the rainy season, and ensures that there is enough soil water storage to overcome dry spells, especially during sensitive stages of crop development. We are aware that other factors, such as labor availability and market prices, affect the choice of sowing date. Nonetheless, in the context of limited rainfall information available to farmers, we recommend these safe sowing windows for short-term and drought-sensitive cereals such as maize cultivars that have a 90-day growth cycle.
Author Contributions
All authors have jointly contributed to the design of this research work. Conceptualization, S.M.D.A., M.-C.t.V. and N.v.d.G.; methodology, S.M.D.A., M.-C.t.V. and N.v.d.G.; validation, S.M.D.A., M.-C.t.V. and N.v.d.G.; resources, S.M.D.A., M.-C.t.V. and N.v.d.G.; writing—original draft preparation, S.M.D.A.; writing—review and editing, M.-C.t.V. and N.v.d.G.; project administration, S.M.D.A.; supervision, M.-C.t.V. and N.v.d.G.; funding acquisition, S.M.D.A. and N.v.d.G. All authors have read and agreed to the published version of the manuscript.
Funding
Agoungbome, S.M.D. was supported by the Islamic Development Bank through the IsDB PhD scholarship Programme for a period of three years of his PhD research.
Informed Consent Statement
Informed consent was obtained from all participants involved in the interviews.
Data Availability Statement
Publicly available datasets were analyzed in this study. This data can be found on the above-mentioned links and upon request for research purposes.
Acknowledgments
This study is part of the TWIGA project, which is funded by the European Union Horizon2020 Program under grant #776691.
Conflicts of Interest
The authors declare no conflict of interest.
Appendix A. Variation of the Yield Response of 90-Day Maize
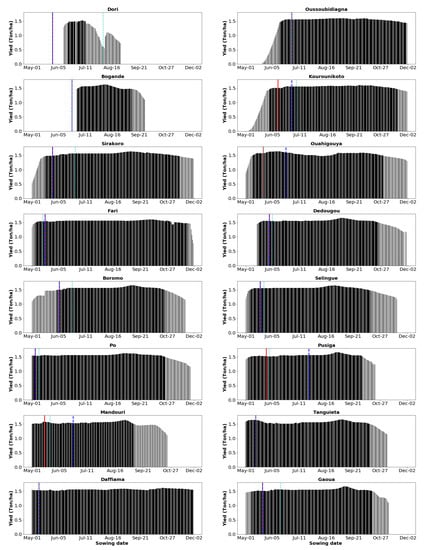
Figure A1.
Variation of yield response to each date of the sowing window from 1st May to 31st November in 2018 expressed as bar chart for the available locations. The dark bars represent the safe windows and the vertical lines represent the different sowing based on the three definitions: (i) red for FP20mm, (ii) blue for LO20mm, and (iii) cyan for LO10mm.
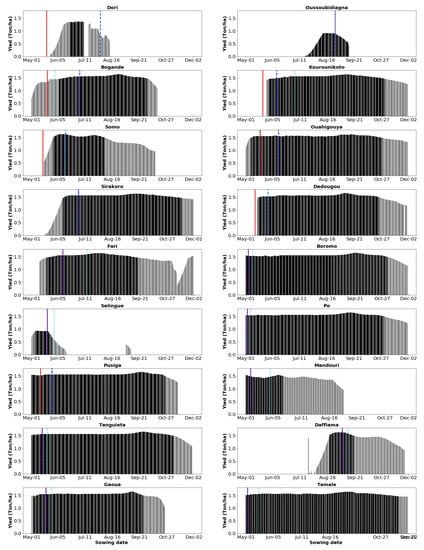
Figure A2.
Variation of yield response to each date of the sowing window from 1st May to 31st November in 2019 expressed as bar chart for the available locations. The dark bars represent the safe windows and the vertical lines represent the different sowing based on the three definitions: (i) red for FP20mm, (ii) blue for LO20mm, and (iii) cyan for LO10mm.
References
- Berners-Lee, M.; Kennelly, C.; Watson, R.; Hewitt, C.N. Current global food production is sufficient to meet human nutritional needs in 2050 provided there is radical societal adaptation. Elem. Sci. Anthr. 2018, 6, 52. [Google Scholar] [CrossRef]
- FAO; IFAD; UNICEF; WFP; WHO. The State of Food Security and Nutrition in the World 2022. Repurposing Food and Agricultural Policies to Make Healthy Diets More Affordable; Food and Agriculture Organization of the United Nations: Rome, Italy, 2022; p. 260. [Google Scholar] [CrossRef]
- Gbangou, T.; Ludwig, F.; van Slobbe, E.; Hoang, L.; Kranjac-Berisavljevic, G. Seasonal variability and predictability of agro-meteorological indices: Tailoring onset of rainy season estimation to meet farmers’ needs in Ghana. Clim. Serv. 2019, 14, 19–30. [Google Scholar] [CrossRef]
- Froidurot, S.; Diedhiou, A. Characteristics of wet and dry spells in the West African monsoon system. Atmos. Sci. Let. 2017, 18, 125–131. [Google Scholar] [CrossRef]
- Rockström, J.; Karlberg, L.; Wani, S.P.; Barron, J.; Hatibu, N.; Oweis, T.; Bruggeman, A.; Farahani, J.; Qiang, Z. Managing water in rainfed agriculture—The need for a paradigm shift. Agric. Water Manag. 2010, 97, 543–550. [Google Scholar] [CrossRef]
- Gaetani, M.; Janicot, S.; Vrac, M.; Famien, A.M.; Sultan, B. Robust assessment of the time of emergence of precipitation change in West Africa. Sci. Rep. 2020, 10, 7670. [Google Scholar] [CrossRef]
- Sultan, B.; Guan, K.; Kouressy, M.; Biasutti, M.; Piani, C.; Hammer, G.L.; McLean, G.; Lobell, D.B. Robust features of future climate change impacts on sorghum yields in West Africa. Environ. Res. Lett. 2014, 9, 104006. [Google Scholar] [CrossRef]
- Guilpart, N.; Grassini, P.; van Wart, J.; Yang, H.; van Ittersum, M.; van Bussel, L.G.J.; Wolf, J.; Claessens, L.; Leenaars, J.G.; Cassman, K. Rooting for food security in Sub-Saharan Africa. Environ. Res. Lett. 2017, 12, 114036. [Google Scholar] [CrossRef]
- Gbangou, T.; Slobbe, E.V.; Ludwig, F.; Kranjac-Berisavljevic, G.; Paparrizos, S. Harnessing Local Forecasting Knowledge on Weather and Climate in Ghana: Documentation, Skills, and Integration with Scientific Forecasting Knowledge. Weather Clim. Soc. 2020, 13, 23–37. [Google Scholar] [CrossRef]
- Laux, P.; Kunstmann, H.; Bardossy, A. Predicting the regional onset of the rainy season in West Africa. Int. J. Climatol. 2008, 28, 329–342. [Google Scholar] [CrossRef]
- Silungwe, F.R.; Graef, F.; Bellingrath-Kimura, S.D.; Tumbo, S.D.; Kahimba, F.C.; Lana, M.A. The Management Strategies of Pearl Millet Farmers to Cope with Seasonal Rainfall Variability in a Semi-Arid Agroclimate. Agronomy 2019, 9, 400. [Google Scholar] [CrossRef]
- Fontaine, B.; Louvet, S.; Roucou, P. Definition and predictability of an OLR-based West African monsoon onset. Int. J. Climatol. 2008, 28, 1787–1798. [Google Scholar] [CrossRef]
- Gazeaux, J.; Flaounas, E.; Naveau, P.; Hannart, A. Inferring change points and nonlinear trends in multivariate time series: Application to West African monsoon onset timings estimation. J. Geophys. Res. 2011, 116, D05101. [Google Scholar] [CrossRef]
- Ati, O.; Stigter, C.; Oladipo, E. A comparison of methods to determine the onset of the growing season in Northern Nigeria. Int. J. Climatol. 2002, 22, 731–742. [Google Scholar] [CrossRef]
- Marteau, R.; Moron, V.; Philippon, N. Spatial coherence of monsoon onset over Western and Central Sahel (1950–2000). J. Clim. 2009, 22, 1313–1324. [Google Scholar] [CrossRef]
- Yamada, T.J.; Kanae, S.; Oki, T.; Koster, R.D. Seasonal variation of land–atmosphere coupling strength over the West African monsoon region in an atmospheric general circulation model. Hydrol. Sci. J. 2013, 58, 1276–1286. [Google Scholar] [CrossRef]
- Sultan, B.; Baron, C.; Dingkuhn, M.; Sarr, B.; Janicot, S. Agricultural impacts of large-scale variability of the West African monsoon. Agric. For. Meteor. 2005, 128, 93–110. [Google Scholar] [CrossRef]
- Ismaila, U.; Gana, A.S.; Tswanya, N.M.; Dogara, D. Cereals production in Nigeria: Problems, constraints and opportunities for betterment. Afr. J. Agric. Res. 2010, 5, 1341–1350. [Google Scholar] [CrossRef]
- Aryee, J.; Amekudzi, L.; Quansah, E.; Klutse, N.; Atiah, W.; Yorke, C. Development of high spatial resolution rainfall data for Ghana. Int. J. Climatol. 2018, 38, 1201–1215. [Google Scholar] [CrossRef]
- Lebel, T.; Ali, A. Recent trends in the Central and Western Sahel rainfall regime (1990–2007). J. Hydrol. 2009, 375, 52–64. [Google Scholar] [CrossRef]
- van de Giesen, N.; Hut, R.; Selker, J. The Trans-African Hydro-Meteorological Observatory (TAHMO). WIREs Water 2014, 1, 341–348. [Google Scholar] [CrossRef]
- Jones, A.; Breuning-Madsen, H.; Brossard, M.; Dampha, A.; Deckers, J.; Dewitte, O.; Gallali, T.; Hallett, S.; Jones, R.; Kilasara, M.; et al. Soil Atlas of Africa, 66th ed.; FAO Irrigation and Drainage Paper, European Commission, Publications Office of the European Union: Luxembourg, 2013; p. 176. [Google Scholar]
- Saxton, K.; Rawls, W. Soil water characteristic estimates by texture and organic matter for hydrologic solutions. Soil Sci. Soc. Am. J. 2006, 70, 1569–1578. [Google Scholar] [CrossRef]
- de Bruin, H.A.R.; Lablans, W.N. Reference crop evapotranspiration determined with a modified Makkink equation. Hydrol. Process. 1998, 12, 1053–1062. [Google Scholar] [CrossRef]
- Sivakumar, M.V.K. Empirical analysis of dry spells for agricultural applications in West Africa. J. Clim. 1992, 5, 532–539. [Google Scholar] [CrossRef]
- Nyadzi, E. BEST OF BOTH WORLDS: Co-Producing Climate Services that Integrate Scientific and Indigenous Weather and Seasonal Climate Forecast for Water Management and Food Production in Ghana. Ph.D. Thesis, Wageningen University and Research, Wageningen, The Netherlands, 2020. [Google Scholar]
- Fitzpatrick, R.G.J.; Bain, C.L.; Knippertz, P.; Marsham, J.; Parker, D.J. The West African Monsoon Onset: A Concise Comparison of Definitions. J. Clim. 2015, 28, 8673–8694. [Google Scholar] [CrossRef]
- Marteau, R.; Sultan, B.; Moron, V.; Alhassane, A.; Baron, C.; Traoré, S.B. The onset of the rainy season and farmers’ sowing strategy for pearl millet cultivation in Southwest Niger. Agric. For. Meteorol. 2011, 151, 1356–1369. [Google Scholar] [CrossRef]
- Huho, J.M. Rain-fed agriculture and climate change: An analysis of the most appropriate planting dates in Central Division of Laikipia District, Kenya. Int. J. Curr. Res. 2011, 3, 172–182. [Google Scholar]
- Steduto, P.; Hsiao, T.C.; Raes, D.; Fereres, E. AquaCrop—The FAO crop model to simulate yield response to water: I. Concepts and underlying principles. Agron. J. 2009, 101, 426–437. [Google Scholar] [CrossRef]
- Vanuytrecht, E.; Raes, D.; Steduto, P.; Hsiao, T.C.; Fereres, E.; Heng, L.K.; García-Vila, M.; Moreno, P.M. AquaCrop: FAO’s crop water productivity and yield response model. Environ. Model. Softw. 2014, 62, 351–360. [Google Scholar] [CrossRef]
- Hsiao, T.; Heng, L.; Steduto, P.; Rojas-Lara, B.; Raes, D.; Fereres, E. AquaCrop—The FAO Crop Model to Simulate Yield Response to Water: III. Parameterization and Testing for Maize. Agron. J. 2009, 101, 448–459. [Google Scholar] [CrossRef]
- Abedinpour, M.; Sarangi, A.; Rajput, T.; Singh, M.; Pathak, H.; Ahmad, T. Performance evaluation of AquaCrop model for maize crop in a semi-arid environment. Agric. Water Manag. 2012, 110, 55–66. [Google Scholar] [CrossRef]
- Raes, D.; Steduto, P.; Hsiao, T.C.; Fereres, E. AquaCrop—The FAO crop model to simulate yield response to water: II. Main algorithms and software description. Agron. J. 2009, 101, 438–447. [Google Scholar] [CrossRef]
- Akumaga, U.; Tarhule, A.; Yusuf, A.A. Validation and testing of the FAO AquaCrop model under different levels of nitrogen fertilizer on rain-fed maize in Nigeria, West Africa. Agric. For. Meteorol. 2017, 232, 225–234. [Google Scholar] [CrossRef]
- Ran, H.; Kang, S.; Li, F.; Du, T.; Tong, L.; Li, S.; Ding, R.; Zhang, X. Parameterization of the AquaCrop model for full and deficit irrigated maize for seed production in arid Northwest China. Agric. Water Manag. 2018, 203, 438–450. [Google Scholar] [CrossRef]
- Raes, D.; Steduto, P.; Hsiao, T.C.; Fereres, E. AquaCrop Version 6.0–6.1, Reference Manual; Food and Agriculture Organization of the United Nations: Rome, Italy, 2018. [Google Scholar]
- Nyakudya, I.W.; Stroosnijder, L. Effect of rooting depth, plant density and planting date on maize (Zea mays L.) yield and water use efficiency in semi-arid Zimbabwe: Modelling with AquaCrop. Agric. Water Manag. 2014, 146, 280–296. [Google Scholar] [CrossRef]
- MoFA. Agriculture in Ghana: Facts and Figures; Ministry of Food and Agriculture, Statistics, Research, and Information Directorate (SRID): Accra, Ghana, 2010.
- Galford, G.L.; Peña, O.; Sullivan, A.K.; Nash, J.; Gurwick, N.; Pirolli, G.; Richards, M.; White, J.; Wollenberg, E. Agricultural development addresses food loss and waste while reducing greenhouse gas emissions. Sci. Total Environ. 2020, 699, 134318. [Google Scholar] [CrossRef]
- Shelia, V.; Gummadi, S.; Nenkam, A.; Sibiry Traore, P.C.; Hansen, J.W.; Whitbread, A.; Hoogenboom, G. Spatial Multi-Model Regional Yield Simulations Using the Ccafs Regional Agricultural Forecasting Toolbox (CRAFT): A Case Study for Mali. In Proceedings of the ASA, CSSA, and CSA International Annual Meeting, Baltimore, MD, USA, 4–7 November 2018. [Google Scholar]
- Abate, T.; Coulibaly, N.; Menkir, A.; Wawa, B. DT Maize: A Quarterly Bulletin of the Drought Tolerant Maize for Africa Project. CIMMYT and IITA Report, Volume 4, No. 1, March 2015. Available online: https://bit.ly/3BUkljG (accessed on 20 July 2022).
- Tittonell, P.; Giller, K.E. When yield gaps are poverty traps: The paradigm of ecological intensification in African smallholder agriculture. Field Crop. Res. 2013, 143, 76–90. [Google Scholar] [CrossRef]
- Wolka, K.; Mulder, J.; Biazin, B. Effects of soil and water conservation techniques on crop yield, runoff and soil loss in Sub-Saharan Africa: A review. Agric. Water Manag. 2018, 207, 67–79. [Google Scholar] [CrossRef]
- Waongo, M.; Laux, P.; Traoré, S.B.; Sanon, M.; Kunstmann, H. A Crop Model and Fuzzy Rule Based Approach for Optimizing Maize Planting Dates in Burkina Faso, West Africa. J. Appl. Meteorol. Climatol. 2014, 53, 598–613. [Google Scholar] [CrossRef]
- Benoit, P. The start of the growing season in Northern Nigeria. Agric. Meteorol. 1977, 18, 91–99. [Google Scholar] [CrossRef]
Disclaimer/Publisher’s Note: The statements, opinions and data contained in all publications are solely those of the individual author(s) and contributor(s) and not of MDPI and/or the editor(s). MDPI and/or the editor(s) disclaim responsibility for any injury to people or property resulting from any ideas, methods, instructions or products referred to in the content. |
© 2023 by the authors. Licensee MDPI, Basel, Switzerland. This article is an open access article distributed under the terms and conditions of the Creative Commons Attribution (CC BY) license (https://creativecommons.org/licenses/by/4.0/).