Abstract
In hyper-arid and arid zones, management of crop water requirements is considered a vital component for sustaining crop production. The efficiency of the irrigation method and the application of many kinds of organic matter are practices that should be followed in Egypt to maximize the use of irrigation water. Two field experiments were conducted during the two successive winter seasons of 2020/2021 and 2021/2022 to study the effect of drip irrigation systems and of several types of compost on yield and yield attributes of four cultivars of wheat in newly reclaimed sandy soils. Studied factors were irrigation levels based on the amount of water evapotranspiration (ET) (I1, I2, I3) and the application of compost types (Com1, Com2 and Com3) on four bread wheat cultivars. The parameters measured at each irrigation level were: heading date (day), plant height (cm2), number of spikes/m2, number of grains/spike, 1000-grain weight (g), grain yield (t/fed.), Biological yield (kg/fed.) and harvest index (%). The farmyard manure (Com3) gave the maximum values under irrigation shortages, reflected in producing the maximum values for traits measured in the 2020/2021 season as compared to (Com1) or (Com2) applications, which scored lower values for the traits for the different cultivars for wheat. The interaction (I1, I2) × Com3 × (Mis1, Mis2) led to a significant increase during both seasons for all the yield and yield components studied. A drip irrigation system at the level of 80% of ET and application of Com3 is recommended to optimize wheat productivity from the unit area. The savings in water irrigation would allow expansion of the cultivated area to decrease the gap between local crop production and local requirements.
1. Introduction
Bread wheat Triticum aestivum L. is the world’s most important grain, covering more of the earth’s surface than any other food crop [1]. It is an essential staple crop around the world [2]. The bread wheat yield is affected by global climatic change [3]. The productivity of wheat is influenced by various biotic or abiotic stresses [4]. The global requirement for wheat by the year 2020 is forecast to be around 950 million tones to meet the food requirements imposed by the increase in population growth. This target will be achieved only if global wheat production is increased by 2.5% per annum [5]. Egypt has a cultivated area of 9.7 million feddans, of which approximately 6.5 million feddans are concentrated in the Delta and receive surface irrigation, and 3.2 million feddans are newly reclaimed soils that receive pressurized irrigation (sprinkler or pivot and drip irrigation) [6]. It is clear that the use of non-conventional water resources is becoming a necessity [7]. The use of saline or sodic water in agriculture increases the total volume of irrigation water in many areas [8] but soil management is essential to prevent adverse impacts [9]. The success of saline water use in irrigation requires the development of many new scientific practices, new guidelines on its use that cope with the prevailing local conditions, and new strategies that facilitate its use on a relatively large scale [10].
In Egypt, agriculture uses more than 83% of freshwater resources. Despite water scarcity and the fact that Egypt’s share in the Nile waters is predetermined, water-use efficiency is low, due to high water losses [11]. Wheat has been the main winter crop for more than 7000 years in Egypt and is considered to be a strategic commodity [12]. It provides more than one-third of the daily caloric intake. The cultivated fields with wheat supply only 40 to 50% of Egypt’s annual domestic demand. Therefore, field production needs to be increased to cover the demanded consumption [13]. The grain is used as food for humans, and the straw as fodder for animals. Wheat has special importance in Egypt because the local production is not sufficient to face the annual requirements [14]. Egypt imports wheat grain for more than 50% of its needs because the area of local production is limited.; therefore, attempts to increase wheat production are quite important. Such increases could be achieved through horizontal and vertical expansion. The cultivated area covers about 3.6 million fadden (fed). Wheat in the winter season of 2021/2022 produced an average of 3 t/fed. Recently, Egypt has made progress in wheat development. Farmers have reported good results from improved land and water management practices, and new wheat varieties that combine high yield, suitability for mechanization, disease resistance, and high yield quality have been released, increasing the role of the private sector in agricultural investment and reclaiming the desert.
The growing interest in using natural resources makes organic manures of particular importance. The recycling of organic wastes for the maintenance of soil health by hygienic methods is vital for increasing crop production and the welfare of mankind. The incorporation of organic remains in the form of compost, farmyard manure, cereal residue, and green manure is known to improve the physical, chemical, and biological properties of the soil. Fischer and Glaser [15] reported that composting is the most important and rewarding method for increasing agricultural output through raising the level of soil fertility by improving: (a) the long-term structural stability, (b) moisture retention of the soil, and (c) increasing the supply of nutrients. Composting agricultural residues may lead to reducing global warming through reduced use of agricultural chemicals and fertilizers reduces the production of fertilizers and agricultural chemicals, leading to reduced greenhouse gas emissions [16].
There are three main irrigation systems, namely: surface (or gravity) irrigation, sprinkler irrigation, and drip irrigation. Drip irrigation is highly efficient because only the immediate root zone of each plant is wetted. This system also allows the precise application of water-soluble fertilizers and other agricultural chemicals. Drip irrigation is reported to help increase yield gains up to 100%, water savings of up to 40–80%, and associated fertilizer, pesticide, and labor savings over conventional irrigation systems [17]. Several possible approaches, such as irrigation technologies and efficient irrigation scheduling [18], may be adapted for more effective use of limited water supplies. The great challenge of the agricultural sector in Egypt is to produce more food from less water. Drip irrigation system has successfully been used to irrigate a wide range of crops [19]. Therefore, the specific objectives of the study were to study the effect of the drip irrigation method and many kinds of compost applications on different verities of bread wheat on wheat irrigation water use efficiency, yield and yield components net income to recommend an effective irrigation water management strategy for wheat grown under newly reclaimed sandy soil conditions.
2. Materials and Methods
2.1. Site Description
Two field experiments were conducted at the Elisha village, El-Nubaria Province, El-Behira Governorate, Egypt (Figure 1), during the 2020/2021 and 2021/2022 wheat growing seasons (latitude 30°30′23″ N and longitude 30°19′07″ E.
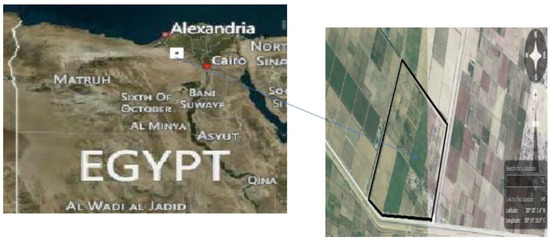
Figure 1.
Location of the experimental farm in the El-Nubaria region, Egypt.
The experimental area has an arid climate with cool winters and hot dry summers. Table 1 summarizes the monthly mean climatic data for the two growing seasons 2020/2021 and 2021/2022 (which are nearly the same) for El-Nubaria city. The data on maximum and minimum temperature, relative humidity, and wind speed were obtained from “The Central Laboratory of Meteorology” which is related to the Ministry of Agriculture. No rainfall can be assumed for the two seasons because the amount was very small, and the duration did not exceed a few minutes.

Table 1.
Growing season climate data by month at the experimental site.
2.2. Experimental Details
The soil of the experimental site is classified as sandy soil. Some physical and chemical properties of the experimental soil were measured following (Chapman and Pratt [20]) (Table 2 and Table 3, respectively).

Table 2.
Main physical properties of the soil at the experimental site.

Table 3.
Chemical properties of the soil at the experimental site.
2.3. Layout of Experiment Design
The drip irrigation system was estimated according to the meteorological data of the Central Laboratory for Agricultural Climate (CLAC). Using the Penman–Monteith equation, the evapotranspiration rate (ET) was found to be 2450 m3/fed/season for drip irrigation, as shown in Figure 2.
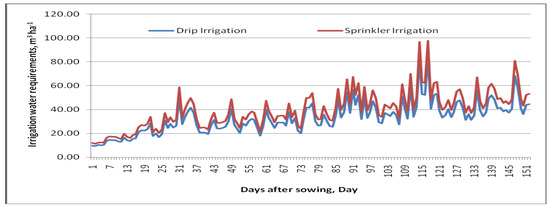
Figure 2.
Daily irrigation water requirements for the wheat plant under drip and sprinkler irrigation systems.
Site characteristics including the latitude (+ for north and − for south), longitude (+ for west and − for east) and elevation (m) above sea level must be input. The required weather data includeshourly solar radiation (MJ m−2h−1), mean air temperature (°C), mean wind speed (m s−1) andmean dew point temperature (°C). The air and dew point temperatures should be measured atbetween 1.5 and 2.0 m height and the wind speed should be measured at 2.0 m height. For windspeeds measured at some height other than 2.0 m, the wind speed at 2 m height (u2) can beestimated as Penman-Monteith (hourly) Reference Evapotranspiration Equations for Estimating ETos and ETrs with Hourly Weather Data. Available from: https://www.researchgate.net/publication/237412886_Penman-Monteith_hourly_Reference_Evapotranspiration_Equations_for_Estimating_ETos_and_ETrs_with_Hourly_Weather_Data [accessed on 30 December 2022].
where uz = wind speed (m s−1) at height zw (m) above the ground
U2 = uz{4.87/In(67.8zw − 5.42)}
The experiment design was a split plot design with four replications. The main plots were randomly assigned to the three levels of irrigation water applied, equaling 100% ET = 2450 m3/fed (I1), 80% ET = 1960 m3/fed (I2) and 70% ET = 1715 m3/fed (I3) of (ET) evapotranspiration at 2450 m3 per season, by using the drip irrigation method. The compost types were: facilities compost (Com1), cucumber canopy compost (Com2) and farmyard manure (Com3) applied at a rate of 10 m3 in each sub plot as follows: 25 cm deep from soil surface level turned up with the soil (25 cm + turn). Four bread wheat cultivars (Sakha 95 (S95), Giza 171 (G171), Misr 1 (Mis1) and Misr 2 (Mis2) were distributed in the sub plots. Each plot area was 3.6 m wide (12 rows × 30 cm apart) and 3.5 m long (12.6 m2), and plants were 8 cm apart. A distance of 2 m was left as a border between the treatments.
The wheat was sown on 20 November 2020 and 19 November 2021 for the two successive growing seasons, respectively, using a machine planter. The fertilizer applications were based on soil analysis recommendations. All plots received the same amount of fertilizer, i.e., calcium super-phosphate (Abou Zaabal For Specialized Chemicals, Cairo, Egypt) (15.5% P2 O5) at the rate of 200 /fed was applied before sowing to the soil. Nitrogen fertilizer in the form of ammonium nitrate (Abu Qir Fertilizers Company, Cairo, Egypt)(33.5% N) was applied at the rate of 100 kg N /fed at five equal doses before the second, third, fourth, fifth, and sixth irrigations. Potassium sulfate (Yara International ASA, Oslo, Norway) (48.52% K2 O) was applied at the rate of 50 kg/fed before the first and third irrigations in two equal doses. All other agricultural practices for wheat crop production were carried out according to the recommendations of the Egypt Ministry of Agriculture and Land Reclamation.
Data and their recording procedure:
Agronomic traits: Days to heading, plant height (cm), the number of spikes/m2, the number of grains/spike, 1000-grain weight (g), grain yield (t/fed), biological yield (t/fed) and irrigation water use efficiency (kg/m3). The harvest index (HI) was estimated at harvest.
Quality traits: Grain protein content was determined by using a modified micro-Kjeldahl apparatus. The crude protein percentage in wheat grains was calculated by multiplying the total nitrogen percentage by 5.75 according to the procedures outlined in A.O.A.C. [21].
Analysis of data was done by computer, using the ANOVA program for statistical analysis. The differences among means for all traits were tested for significance at a 5% level according to (Gomez and Gomez [22]).
3. Results
I.A. Effect of water irrigation amount (ET) on the yield and yield components attributes for wheat plants during the 2020/2021 and 2021/2022 seasons.
The results in Table 4, Table 5, Table 6, Table 7 and Table 8 and Figure 3, Figure 4, Figure 5 and Figure 6 showed that irrigation of wheat plants during the 2020/2021 and 2021/2022 seasons at the level of 100% from ET significantly led to an increase and gave the maximum values for wheat heading date (day) (101.49 and 101.53, respectively), plant height (cm2) (119.23 and 121.77, respectively), number of spikes/m2 (360 and 365.25, respectively), number of grains/spike (66.42 and 67.33, respectively), 1000-grain weight (g) (46.25 and 46.66, respectively), grain yield (t/fed) (3925 and 4014, respectively), biological yield (kg/fed) (10,924 and 11,089, respectively) and harvest index (%) (36.05 and 36.33, respectively) as compared to the other studied water irrigation levels (I2 or I3) during both seasons. However, the greatest percent protein (13.42 and 13.47%, respectively) and irrigation water use efficiency (1.98 and 2.01, respectively) were achieved with the I2 treatment in both seasons.

Table 4.
ET irrigation and different compost affecting heading date (day) and plant height (cm2) with four cultivars for wheat.

Table 5.
ET irrigation and different compost affecting the number of spikes/m2 and number of grains/spike with four cultivars for wheat.

Table 6.
ET irrigation and different compost affecting 1000-grain weight (g) and grain yield (t /fed) with four cultivars for wheat.

Table 7.
ET irrigation and different compost affecting biological yield (t/fed) (grain + straw) and harvest index (%) with four cultivars for wheat.

Table 8.
ET irrigation and different compost affecting irrigation water use efficiency (kg/m3) and protein (%) with four cultivars for wheat.
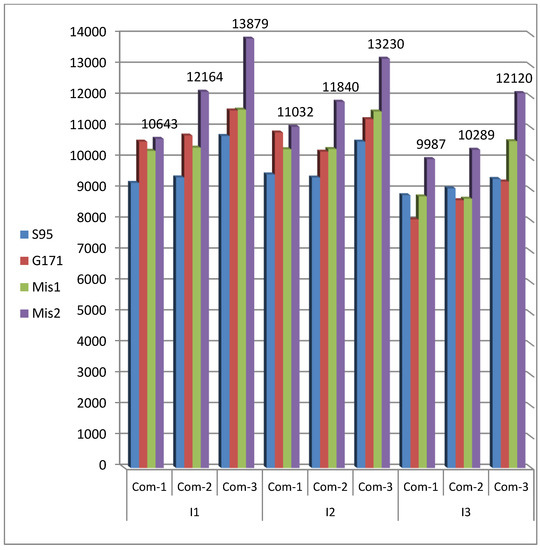
Figure 3.
The effect of irrigation and different composts on biological yield (kg/fed) for four cultivars for wheat in 2021/2022.
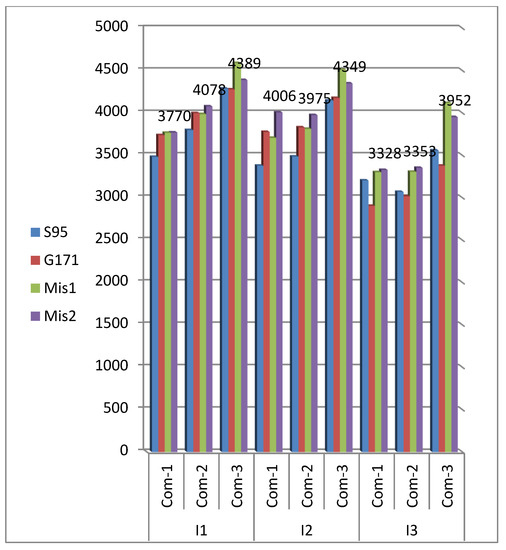
Figure 4.
The effect of irrigation and different composts on grain yield (kg/fed) for four cultivars for wheat in 2021/2022.
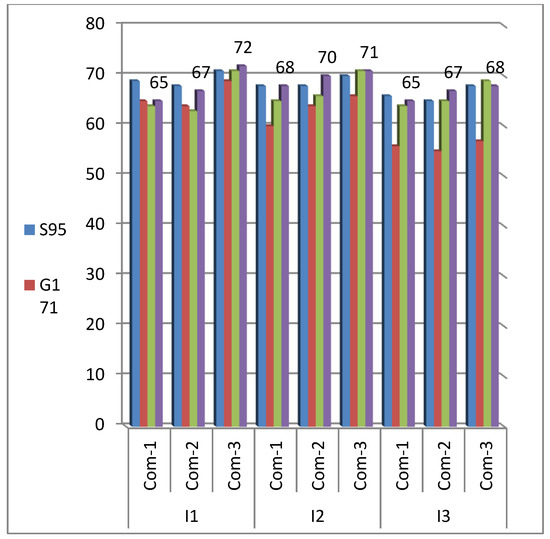
Figure 5.
The effect of irrigation and different composts on number of grains/spike for four cultivars for wheat 2021/2022.
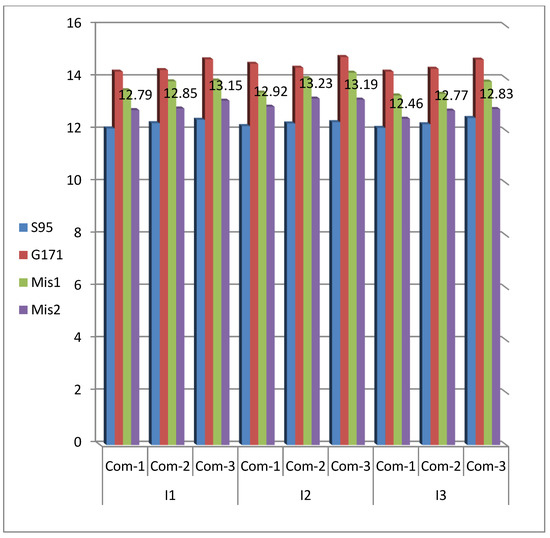
Figure 6.
The effect of irrigation and different composts on protein % for four cultivars for wheat in 2021/2022.
These results may be due to the effect of water irrigation at 100% of ET on enhancing cell division and reproductive organs, which led to increased plant height, number of spikes/m2, number of grains/spikes, 1000-grain weight (g) Grain yield (t/fed.) and biological yield (kg/fed). These results were are similar to those of Hargreaves and Samani [23], Ghare et al. [24], Bhunia et al. [25], Kumar and Abraham [26], and Damor et al. [27].
I.B. Impact of compost types on the yield and yield components attributes for wheat plants during both seasons.
As recorded in Table 4, Table 5, Table 6, Table 7 and Table 8, there are significant effects of compost types on all studied characters. It is interesting to note that the farmyard manure (Com3) gave the maximum values for wheat grain yield (t/fed) (4087 and 4145) for 2020/2021 and 2021/2022, respectively. The 2020/2021 Com3 effect was shown in acceleration, plant height (cm2) (117.54), number of spikes/m2 (372.33), number of grains/spike (67.42), 1000-grain weight (g) (46.74), grain yield (t/fed) (4087), biological yield (kg/fed) (11,302) and I.W.U.E (2.03) compared to Com1 or Com2 applications, which scored lower values for those traits.
The results in 2021 /2022 followed the same pattern. Results also showed that application of farmyard manure led to (1) increased availability of phosphorus because the direct application may prevent fixation in the soil Flavio (2004), (2) overcoming the low holding capacity defect of sandy soil, which allowed the wheat plants to get needed P as shown by the different composts enhancing the studied characters. These findings are in agreement with those of El-Gamal [28], Tahoun et al. [29], Baasiri et al. [30] and Khan et al. [31].
I.C. Effect of different wheat cultivars on the yield and yield components characteristics during the 2020/2021 and 2021/2022 seasons.
Wheat cultivars exerted a significant effect on the number of spikes/m2, the number of grains/spike, 1000-grain weight, grain yield (t/fed), straw yield, and harvest index in both seasons (Table 4, Table 5, Table 6, Table 7 and Table 8). The relative ranking of cultivars for the mentioned traits was inconsistent in the two seasons. The Misr 2 and Misr 1 cultivars had the greatest number of spikes/m2, grain yield (t/fed), and biological yield (kg/fed) in both seasons, while the Giza 171 cultivar produced the heaviest 1000-grain weight. However, the Sakha 95 cultivar recorded the lowest values of 1000-grain weight and grain yield in both seasons. There was a significant difference in grain yield among Giza 171, Sakha 95, Misr 2, and Misr 1 cultivars in both seasons. The superiority of these cultivars might have resulted from their better growth and all or some yield attributes. Data indicated that the 1000-grain weight appeared to be independent of grain yield. The varietal difference in yield and its attributes were also found by previous researchers such as Poudel et al. [32], El-Kherbawy et al. [33], Kandil et al. [34], Gunes et al. [35] and Eman and Shaker [36].
II.1. Effect of the different first-order interaction between studied factors (I × Com., I × Cul. and Com. × Cul.) on some studied yield and yield components
As explained before, the results of the previous studies pointed out the positive effect of each treatment on saving water irrigation, so the different levels of interaction effects will be very useful to learn about its effects.
Results recorded in Table 4, Table 5, Table 6, Table 7 and Table 8 showed that all the first-order interactions significantly affected the all yield and yield components characters during both seasons. Regarding the I × Com interaction effect, the results showed that the compost application by the farmyard manure (Com3) led to:
- a.
- Improved utilization of water irrigation under the condition of 100% of ET as fertilized with (Com3) compared to Com1 and Com2 applications as reflected in a significant increase during the 2020/2021 season for the number of spikes/m2 by (13.86 and 10.77%), number of grains/spike by (4.6 and 3.8%), grain yield (t/fed.) by (19.99 and 14.13%), biological yield (kg/fed.) by (17.42 and 11.92) and irrigation water use efficiency(kg/m3) by (20.27 and 14.10%), respectively. Results in 2021 and 2022 took the same trend. Under the condition of water irrigation shortage of I2 (80% ET) or I3 (70% of ET), the same farmyard manure application (Com3) helped the wheat plants to dodge the harmful water stress Baasiri et al. [30] through the 2020/2021 season. Results during the 2021/2022 season confirmed the same patterns.
- b.
- The interaction between ET rates and wheat cultivars had a significant effect on heading date (day), plant height (cm2), number of spikes/m2, number of grains/spike, 1000-grain weight (g), grain yield (t/fed), biological yield (kg/fed), harvest index (%), iirigation water use efficiency(kg/m3) and protein (%) in both seasons.It is important to report that the combinations of I1 × Mis2 or I2 × Mis2 scored the greatest values of the most studied characters during both seasons as compared to the I3 × Mis2 treatment. The lowest grain yield was obtained from G 171 on ET at 70% in both seasons.
- c.
- Regarding the compost kinds × wheat cultivars interaction effect, results in Table 4 up to 8 show that the Com3 × Mis2 application showed its superiority through maximum values for heading date (day) (98.59 and 101.79), plant height (cm2) (120.48 and 122.54), number of spikes/m2 (390.67 and 392.33), number of grains/spike (70.33 and 70.33) and biological yield (kg/fed) (13,076 and 12,819 kg/fed) during the 2020/2021 and 2021/2022 seasons, respectively. Similar conclusions were reported by the other investigators Kandil et al. [34], and El-Hamdi et al. [37]. Some of the other treatments were near the above-mentioned values (the difference between them were insignificant) and the others were lower by the level of significance.
III.1. The second-order interaction effect (I × Com × Cul) on the studied yield and yield components for wheat:
Results recorded in Table 4, Table 5, Table 6, Table 7 and Table 8 observed that the application of Com3 × Mis1 or Com3 × Mis2 under the effect of either I1, I2, or I3 led to a significant increase for all the yield and yield components under study during both seasons. These results are in agreement with those stated by Bayoumy et al. [38].
4. Conclusions
From the above information, it was observed that drip irrigation requires less irrigation water compared to the conventional irrigation method and also ensures uniform distribution of water to the crops, which resulted in increased growth, yield, and water use efficiency. It may be concluded that it is very important to use water judiciously via modern irrigation technologies in arid and semi-arid regions and added compost (farmyard manure) to raise production efficiency. Limited water resources are available and, in this situation, drip irrigation was found to be the most suitable for getting maximum productivity with increased water use efficiency and higher economic returns. Drip irrigation system at the level of 80% and feeding plants by the application of Com3 are recommended for optimizing wheat productivity from the unit area, and using the savings in water irrigation to expand the cultivated area of that crop to decrease the gap between local production and local needs.
Author Contributions
Conceptualization, K.S.A. and K.M.M.; methodology, K.M.M.; software, A.S.M.F.; validation, K.M.M., A.A.S. and A.S.M.F.; formal analysis, K.M.M.; investigation, K.M.M.; resources, A.S.M.F.; data curation, K.F.S.; writing—original draft preparation, K.M.M.; writing—review and editing, K.M.M.; visualization, A.S.M.F.; supervision, K.S.A.; project administration, A.A.S., A.E.H.; funding acquisition, K.S.A. and K.F.S. All authors have read and agreed to the published version of the manuscript.
Funding
This research received no external funding.
Institutional Review Board Statement
Not applicable.
Informed Consent Statement
Not applicable.
Data Availability Statement
Not applicable.
Acknowledgments
Our thanks go to Imam Mohammed Ibn Saud Islamic University, Riyadh, Saudi Arabia, and all the members at the Department of Agronomy, Faculty of Agriculture, Al-Azhar University, Cairo, Egypt.
Conflicts of Interest
The authors declare no conflict of interest.
References
- Miransari, M.; Smith, D. Sustainable wheat (Triticum aestivum L.) production in saline fields: A review. Crit. Rev. Biotechnol. 2019, 39, 999–1014. [Google Scholar] [CrossRef]
- Shi, Y.; Guo, Y.; Wang, Y.; Li, M.; Li, K.; Liu, X.; Fang, C.; Luo, J. Metabolomic Analysis Reveals Nutritional Diversity among Three Staple Crops and Three Fruits. Foods 2022, 11, 550. [Google Scholar] [CrossRef] [PubMed]
- Ortiz, R.; Sayre, K.; Govaerts, B.; Gupta, R.; Subbarao, G.; Ban, T.; Hodson, D.; Dixon, J.; Ortiz-Monasterio, J.I.; Reynolds, M. Climate change: Can wheat beat the heat? Agriculture. Ecosyst. Environ. 2008, 126, 46–58. [Google Scholar] [CrossRef]
- El Sayed, A.; Omar, A.; Elsaied, S.; El Samahey, B. Yield Traits and Grain Properties of some Bread Wheat Cultivars as Influenced by Planting Dates under Egyptian Conditions. J. Plant Prod. 2018, 9, 233–239. [Google Scholar] [CrossRef]
- Barutcular, C.; Yildirim, M.; Koc, M.; Dizlek, H.; Akinci, C.; El, A.; Saneoka, H.; Ueda, A.; Islam, M.; Toptas, I.; et al. Quality traits performance of bread wheat genotypes under drought and heat stress conditions. Fresenius Environ. Bull. 2016, 25, 6159–6165. [Google Scholar]
- Nasr, P.; Sewilam, H. Investigating fertilizer drawn forward osmosis process for groundwater desalination for irrigation in Egypt. Desalination Water Treat. 2016, 57, 26932–26942. [Google Scholar] [CrossRef]
- Qadir, M.; Sharma, B.; Bruggeman, A.; Choukr-Allah, R.; Karajeh, F. Non-conventional water resources and opportunities for water augmentation to achieve food security in water scarce countries. Agric. Water Manag. 2007, 87, 2–22. [Google Scholar] [CrossRef]
- Qadir, M.; Oster, J. Crop and irrigation management strategies for saline-sodic soils and waters aimed at environmentally sustainable agriculture. Sci. Total Environ. 2004, 323, 1–19. [Google Scholar] [CrossRef]
- Ganjegunte, G.; King, L.; Vance, G. Cumulative Soil Chemistry Changes from Land Application of Saline–Sodic Waters. J. Environ. Qual. 2008, 37, S-128. [Google Scholar] [CrossRef]
- El-Tohory, S.; Kassab, M.; El-Gindy, A.; EL-Bagoury, K. Drip irrigation management for wheat production in sandy soil using nuclear technique under salinity conditions. MISR J. Agric. Eng. 2016, 33, 849–868. [Google Scholar] [CrossRef]
- FAOSTAT—Food and Agriculture Organization Corporate Statistical Database. Food and Agriculture Organization of the United Nations; Duke University: Durham, NC, USA, 2020. [Google Scholar]
- Wang, J.; Vanga, S.; Saxena, R.; Orsat, V.; Raghavan, V. Effect of Climate Change on the Yield of Cereal Crops: A Review. Climate 2018, 6, 41. [Google Scholar] [CrossRef]
- HEl-Shabrawi, M.; Bakry, B.; Ahmed, M.; Abou-El-Lail, M. Humic and Oxalic Acid Stimulates Grain Yield and Induces Accumulation of Plastidial Carbohydrate Metabolism Enzymes in Wheat Grown under Sandy Soil Conditions. Agric. Sci. 2015, 6, 175–185. [Google Scholar] [CrossRef]
- Gharib, H.; Hafez, E.; Sabagh, A. Optimized Potential of Utilization Efficiency and Productivity in Wheat by Integrated Chemical Nitrogen Fertilization and Stimulative Compounds. Cercet. Agron. Mold. 2016, 49, 5–20. [Google Scholar] [CrossRef]
- Fischer, D.; Glaser, B. Synergisms between Compost and Biochar for Sustainable Soil Amelioration. In Management of Organic Waste; Kumar, S., Ed.; InTech: Halle, Germany, 2012. [Google Scholar] [CrossRef]
- Liu, H.; Li, J.; Li, X.; Zheng, Y.; Feng, S.; Jiang, G. Mitigating greenhouse gas emissions through replacement of chemical fertilizer with organic manure in a temperate farmland. Sci. Bull. 2015, 60, 598–606. [Google Scholar] [CrossRef]
- Khanali, M.; Ghasemi-Mobtaker, H.; Varmazyar, H.; Mohammadkashi, N.; Chau, K.; Nabavi-Pelesaraei, A. Applying novel eco-exergoenvironmental toxicity index to select the best irrigation system of sunflower production. Energy 2022, 250, 123822. [Google Scholar] [CrossRef]
- Attia, A.; El-Hendawy, S.; Al-Suhaibani, N.; Alotaibi, M.; Tahir, M.; Kamal, K. Evaluating deficit irrigation scheduling strategies to improve yield and water productivity of maize in arid environment using simulation. Agric. Water Manag. 2021, 249, 106812. [Google Scholar] [CrossRef]
- Rao, K.; Bajpai, A.; Gangwar, S.; Chourasia, L.; Soni, K. Maximising water productivity of wheat crop by adopting drip irrigation. Rese Crop 2016, 17, 163. [Google Scholar] [CrossRef]
- Sparks, D. Methods of Soil Analysis; Part 3: Chemical Methods; Soil Science Society of America, American Society of Agronomy, Eds.; Soil Science Society of America, American Society of Agronomy: Madison, WI, USA, 1996. [Google Scholar]
- Horwitz, W. Official Methods of Analysis of the Association of Official Analytical Chemists, 13th ed.; Association of Official Analytical Chemists, Ed.; Ass. of Official Analytical Chemists: Washington, DC, USA, 1980. [Google Scholar]
- Gomez, K.; Gomez, A. Statistical Procedures for Agricultural Research, 2nd ed.; Wiley: New York, NY, USA, 1984. [Google Scholar]
- Hargreaves, G.H.; Samani, Z.A. Reference Crop Evapotranspiration from Temperature. Appl. Eng. Agric. 1985, 1, 96–99. [Google Scholar] [CrossRef]
- Ghare, A.; Porey, P.; Ingle, R. Discussion of “Simplified Estimation of Reference Evapotranspiration from Pan Evaporation Data in California” by Richard L. Snyder, Morteza Orang, Scott Matyac, and Mark E. Grismer. J. Irrig. Drain Eng. 2006, 132, 519–520. [Google Scholar] [CrossRef]
- Bhunia, S.; Verma, I.; Arif, M.; Gochar, R.; Sharma, N. Effect of crop geometry, drip irrigation and bio-regulator on growth, yield and water use efficiency of wheat (Triticum aestivum L.). Int. J. Agric. Sci. 2015, 11, 45–49. [Google Scholar] [CrossRef]
- Kumar, S.; Abraham, T. Productivity Potential of Wheat under Certified Organic Production System. Int. J. Curr. Microbiol. Appl. Sci. 2018, 7, 281–288. [Google Scholar] [CrossRef]
- Damor, N.; Solanki, R.; Hadiyal, J.; Dharaiya, B. Effect of drip irrigation schedules and fertigation levels on growth parameters and yields of wheat (Triticum aestivum L.). J. Pharmacogn. Phytochem. 2021, 10, 1546–1550. [Google Scholar]
- El-Gamal, B.; El-Fotoh, H.A.; Hamed, M. Impact of organic and bio-fertilizers on soil health and production of quinoa and soybean. Middle East J. Agric. Reserch 2020, 9, 828–847. [Google Scholar] [CrossRef]
- Abou Tahoun, A.M.; El-Enin, M.M.; Mancy, A.G.; Sheta, M.H.; Shaaban, A. Integrative Soil Application of Humic Acid and Foliar Plant Growth Stimulants Improves Soil Properties and Wheat Yield and Quality in Nutrient-Poor Sandy Soil of a Semiarid Region. J. Soil Sci. Plant Nutr. 2022, 22, 2857–2871. [Google Scholar] [CrossRef] [PubMed]
- Baasiri, M.; Ryan, J.; Mucheik, M.; Harik, S. Soil application of a hydrophilic conditioner in relation to moisture, irrigation frequency and crop growth. Commun. Soil Sci. Plant Anal. 1986, 17, 573–589. [Google Scholar] [CrossRef]
- Khan, K.; Sharif, M.; Azeem, I.; Ibadullah; Khan, A.; Ali, S.; Khan, I.; Khan, A. Phosphorus Solubility from Rock Phosphate Mixed Compost with Sulphur Application and Its Effect on Yield and Phosphorus Uptake of Wheat Crop. Open J. Soil Sci. 2017, 7, 401–429. [Google Scholar] [CrossRef]
- Poudel, P.; Jaishi, U.; Poudel, L.; Poudel, M. Evaluation of Wheat Genotypes under Timely and Late Sowing Conditions. Int. J. Appl. Sci. Biotechnol. 2020, 8, 161–169. [Google Scholar] [CrossRef]
- El-Kherbawy, M.; Abdel-Aal, Y.; El-Ghany, M.A. Response of some wheat cultivars to different levels of nitrogen. J. Soil Sci. Agric. Eng. 2009, 34, 5639–5647. [Google Scholar] [CrossRef]
- Kandil, A.; Sharief, A.; Seadh, S.; Altai, D. Role of humic acid and amino acids in limiting loss of nitrogenfertilizer and increasing productivity of some wheat cultivars grown under newly reclaimed sandy soil. Int. J. Adv. Res. Biol. Sci. 2016, 3, 123–136. [Google Scholar]
- Gunes, A.; Inal, A.; Alpaslan, M.; Cakmak, I. Genotypic variation in phosphorus efficiency between wheat cultivars grown under greenhouse and field conditions. Soil Sci. Plant Nutr. 2006, 52, 470–478. [Google Scholar] [CrossRef]
- H-Emam, D. Quantifying the Determinants of Improved Wheat Variety Adoption in Egypt: Binary Response Models. Sci. J. Agric. Sci. 2022, 4, 24–33. [Google Scholar] [CrossRef]
- El-Hamdi, K.; El-Soud, M.A.; El-Sanat, G. Effect of some soil amendments application on the productivity of wheat and soybean, mobility and availability of nitrogen. J. Soil Sci. Agric. Eng. 2007, 32, 7953–7965. [Google Scholar] [CrossRef]
- Bayoumy, M.; Khalifa, T.; Aboelsoud, H. Impact of some Organic and Inorganic Amendments on some Soil Properties and Wheat Production under Saline-Sodic Soil. J. Soil Sci. Agric. Eng. 2019, 10, 307–313. [Google Scholar] [CrossRef]
Disclaimer/Publisher’s Note: The statements, opinions and data contained in all publications are solely those of the individual author(s) and contributor(s) and not of MDPI and/or the editor(s). MDPI and/or the editor(s) disclaim responsibility for any injury to people or property resulting from any ideas, methods, instructions or products referred to in the content. |
© 2022 by the authors. Licensee MDPI, Basel, Switzerland. This article is an open access article distributed under the terms and conditions of the Creative Commons Attribution (CC BY) license (https://creativecommons.org/licenses/by/4.0/).