Abstract
The spatiotemporal heterogeneity of rice canopy leaves at different leaf positions is very important for non-destructive monitoring under Cadmium (Cd) stress, and is one of the key problems that need to be solved urgently in modern agriculture. This study aims to explore the temporal and spatial heterogeneity of chlorophyll content and fluorescence in rice canopy leaves under different Cd stress concentrations. The responses of the relative chlorophyll content (SPAD) and Chlorophyll fluorescence (ChlF) parameters to Cd stress in the tillering, heading, and filling stages were analyzed through pot experiments with three Cd concentrations: 0.20 mg·kg−1 (CK), 0.60 mg·kg−1 (Cd1), and 1.60 mg·kg−1 (Cd2). Results showed that the canopy leaf SPAD value increased with increasing Cd concentration. Compared with CK, the leaf SPAD value in the Cd1 and Cd2 treatments were 1.91–3.45% and 5.52–12.01% lower, respectively. The SPAD value of the lower leaves was higher in the tillering stage, while the SPAD value of the upper leaves was higher in the heading and filling stages. The non-photochemical quenching coefficient (NPQ) of the third leaf (D3), the initial fluorescence yield (Fo) of the second leaf (D2), and the maximum photochemical efficiency (Fv/Fm) of photosystem II (PSII) in the tillering stage; the NPQ, Fo, and Fv/Fm of the D3 in the heading stage; and the NPQ, Fo, Fv/Fm, and Fv/Fm of the D2 in the filling stage were more sensitive to Cd stress than the other leaves and ChlF parameters.
1. Introduction
Cadmium (Cd) is a heavy metal with strong biological mobility that is not necessary for crop growth. Its biological toxicity is significant [1]. Rice (Oryza sativa L.) is a Cd-sensitive crop that easily absorbs Cd from the soil environment and accumulates in the plant leaves and other organs, seriously affecting the growth and development, and safety quality of the rice [2]. More than one-fifth of arable land in China is polluted by metals [3] and approximately 2.8 × 10³ km2 of agricultural soils are contaminated with Cd [4]. Especially in Guizhou, the center of karst, the background value of soil cadmium in cultivated land is 0.659 mg·kg−1, which is about 6.7 times the background value in China [5]. Although traditional chemical detection methods can accurately detect the contents of heavy metals in rice, the operation is complex, time-consuming, and destroys the plants [6]. Timely, rapid, and non-destructive monitoring of Cd pollution stress in rice is crucial for future large-scale non-destructive monitoring of Cd pollution in rice and is also one of the key issues to be solved in smart agriculture.
Cd accumulation inhibits the metabolic process of rice, leading to a significant decline in the chlorophyll content of the plant leaves [7], and there are differences in the changes in the different growth stages and under different stress levels. One study found that under Cd stress, the chlorophyll content of rice leaves decreased significantly [8], but the chlorophyll content of the rice canopy leaves at different leaf positions had their own vertical distribution differences. The chlorophyll content of the lower leaves was the highest before the heading stage; while from the beginning of the heading stage, the chlorophyll content of the upper leaves was the highest [9]. Therefore, the effect of Cd in the different growth stages on the chlorophyll content of rice leaves at different canopy positions requires further study. Photosynthesis is the mechanism by which crops obtain material and energy, and it is very sensitive to Cd stress [10,11]. Cd stress has a negative impact on crop photosynthesis [12,13]. Monitoring the response of the photosynthesis of the canopy leaves of rice plants under Cd stress is crucial to achieving non-destructive monitoring of Cd pollution in rice. However, traditional methods for measuring gas exchange are time-consuming and laborious, and they can only measure part of the photosynthetic information [14]. In contrast, the Chlorophyll fluorescence (ChlF) technique has the advantages of a high efficiency, non-destructive analysis, and high-throughput. It can measure the information about the light energy absorption, transmission, and dissipation of the leaves [15,16] and can quantify the degree of damage to the crop leaves under Cd stress [17]. It has become one of the important technical means of detecting the physiological conditions of crops under heavy metal stress. Monitoring the changes in the ChlF parameters of Chinese cabbage leaves under lead (Pb) stress using the ChlF technique revealed that Pb stress significantly increased the initial fluorescence yield (Fo) and maximum fluorescence yield (Fm) of the Chinese cabbage leaves, and it significantly reduced the maximum photochemical efficiency (Fv/Fm) of the photosystem II (PSII) [18]. A growth test of Chinese cabbage under different zinc (Zn) stress concentrations revealed that the Fv/Fm decreased with increasing Zn concentration and gradually increased with decreasing Zn concentration, finally attaining a value close to the control [19]. It was also found that under chromium (Cr) stress, the Fv/Fm and the photochemical quenching coefficient (qP) of tomato leaves decreased significantly, while the non-photochemical quenching coefficient (NPQ) increased significantly [20]. There are significant spatial differences in the activity and energy use efficiency of PSII centers of crop canopy leaves in different leaf positions [21,22,23]. Therefore, it is particularly necessary to study the temporal and spatial heterogeneity of the ChlF parameters in different leaf positions in the rice plant canopy under Cd stress in the different growth stages.
In summary, the purpose of this study was to explore the temporal and spatial heterogeneity of the chlorophyll content and the fluorescence response of rice canopy leaves at different leaf positions under Cd stress in the different growth stages. The goals were to clarify the photosynthetic characteristics of the leaves under different Cd stress concentrations and to explore the dynamic vertical distribution characteristics of the relative chlorophyll content and ChlF parameters of the leaves at different leaf positions.
2. Materials and Methods
2.1. Experimental Design
A rice pot experiment (Figure 1) was conducted in the Guiyang Comprehensive Test Station of the Guizhou Academy of Agricultural Sciences in March–October 2021 (106°39′20″ E, 26°29′59″ N). The rice variety was Jingliangyou 534, the pot planting soil was yellow, the pH was 6.58, the organic matter content was 115.01 g·kg−1, the alkali hydrolyzed nitrogen content was 49.25 mg·kg−1, the available phosphorus content was 5.96 mg·kg−1, and the available potassium content was 153.90 mg·kg−1. The background value of soil Cd was 0.20 mg·kg−1, and 0.20 mg·kg−1 was the risk screening value for Cd in the rice fields. The experiment was conducted by setting three exogenous Cd concentration addition treatments, CK (0), Cd1 (0.20 mg·kg−1), Cd2 (0.40 mg·kg−1), and the added Cd was CdCl2 (Shanghai Aladdin biochemical technology Co., Ltd., Shanghai, China), and the actual values after addition were CK (0.20 mg·kg−1), Cd1 (0.60 mg·kg−1), and Cd2 (1.60 mg·kg−1). In the tillering stage, heading stage, and filling stage of the rice growth, the relative chlorophyll content, Cd content, ChlF parameters, and photosynthetic parameters of the rice canopy leaves at different leaf positions under different Cd concentrations were measured.
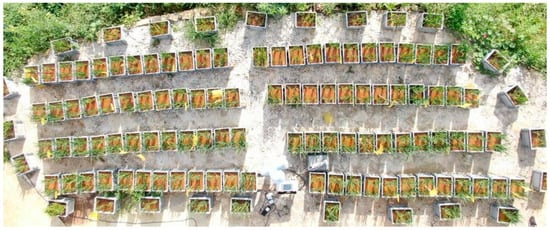
Figure 1.
Aerial photo of rice potting experiment.
2.2. Determination of Relative Chlorophyll Content
A portable chlorophyll meter (SPAD-502 Plus, Konica Minolta, Tokyo, Japan) was used to measure the relative chlorophyll content of the leaves in situ (Figure 2). During the measurement, three rice plants with uniform growth were selected and labeled. The top, central, and basal positions of the first leaf (D1), second leaf (D2), third leaf (D3), and fourth leaf (D4) were measured. Each position was measured six times, and the average value was taken as the relative chlorophyll content (SPAD) value for the position. During the measurement, positions where the leaf veins were concentrated were avoided and direct sunlight was properly blocked to ensure the accuracy of the measurement [24].
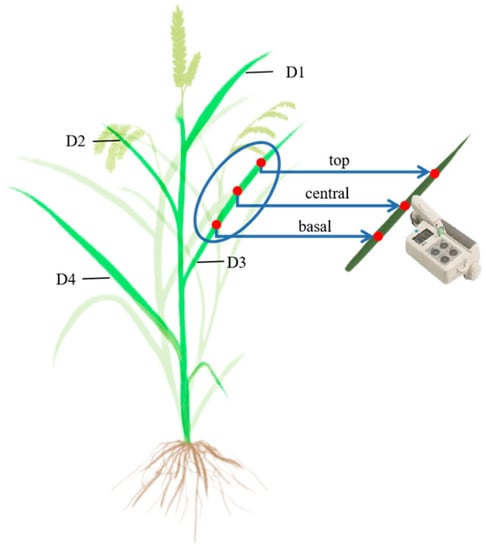
Figure 2.
Schematic diagram of the determination of the relative chlorophyll content. The red dots represent the actual measuring points, namely the top, central and basal.
2.3. Determination of Chlorophyll Fluorescence Parameters
A portable fluorescence meter (Junior PAM, Heinz Walz GmbH, Bavaria, Germany) was used to measure the ChlF parameters. The middle position of the marked leaf was selected as the measuring point, and the leaf was fully dark adapted for 30 min. The real-time fluorescence yield (F) of the leaf, the maximum fluorescence yield when the action light was turned on (Fm’), the actual photosynthetic efficiency (Y (II)) of PSII, the relative electron transfer rate (ETR) of PSII, the initial fluorescence yield when the action light was turned on (Fo’), the photochemical quenching coefficient (qP, qL), the non-photochemical quenching coefficient (NPQ, qN), the quantum yield of the PSII non-regulatory energy dissipation (Y (NO)), the quantum yield of the PSII regulatory energy dissipation (Y (NPQ)), the initial fluorescence yield when the action light was turned off (Fo), the maximum fluorescence yield when the action light was turned off (Fm), and the maximum photochemical quantum yield (Fv/Fm) of the PSII were measured [25].
2.4. Determination of Photosynthetic Parameters
The photosynthetic parameters of the rice in the heading stage were measured using a portable photosynthetic apparatus (GFS-3000, Heinz Walz GmbH, Bavaria, Germany). At 10:00–11:00 a.m. on a sunny day, the CO2 concentration was set to 400 μmol mol−1, the light intensity was set to 1200 μmol·m−2 s−1, the airflow rate was set to 0.5 L min−1, the leaf temperature was 25 °C, and the relative humidity was set to 70%. Rice leaves with the same growth trend were selected to measure the net photosynthetic rate (Pn), transpiration rate (Tr), stomatal conductance (Gs), and intercellular CO2 concentration (Ci) of the top two leaves (D2) of the rice plant [26].
2.5. Determination of Cd Content of Leaves
An inductively coupled plasma optical emission spectrometer (ICP-OES, Thermo Fisher Scientific, Waltham, MA, USA) was used to measure the Cd content of the leaves. The rice leaves were blanched at 105 °C for 30 min, dried in an oven at 75 °C to a constant weight, and thoroughly crushed using a solid sample grinder. Then, 0.2000 g of the leaf sample was weighed, 5 mL of nitric acid (HNO3) was added, and the sample was digested in a 120 °C graphite digestion instrument for 2 h until there was no sediment in the digestion tank. Then, the temperature was adjusted to 150 °C to evaporate the acid. The sample was removed and allowed to cool. The sample was diluted to a volume of 50 mL in a volumetric flask, filtered, and analyzed via ICP-OES [27].
2.6. Statistical Analysis
The test data were analyzed by one-way analysis of variance (ANOVA) and least significant difference (LSD) tests using SPSS 24.0 software (SPSS Inc., Chicago, IL, USA) to calculate the significance of different treatments on the measured parameters.
3. Results
3.1. Effects of Different Cd Stress Concentrations on Cd Content of Rice Canopy Leaves
The dynamic vertical distribution characteristics of the Cd content in the different leaf positions in the different growth stages of the rice plant under different Cd stress concentrations are shown in Figure 3. In the three growth stages, the Cd content of the rice leaves at different leaf positions increased significantly with increasing Cd stress concentration. The Cd content of the rice leaves in the Cd1 and Cd2 treatments increased by 56.48% and 296.96%, respectively, compared with the CK treatment in the late tillering stage, by 39.72% and 248.30% in the heading stage, respectively, and by 45.72% and 141.92% in the filling stage, respectively. The Cd contents of the leaves at different leaf positions were the lowest in the heading stage, the second lowest in the late tillering stage, and the highest in the filling stage. In the tillering stage and heading stage, the Cd contents of the leaves at different leaf positions in treatments CK, Cd1, and Cd2 were as follows: D1 < D2 < D3 < D4. During the grouting period, the Cd contents of the leaves in the CK treatment were as follows: D2 < D3 < D1. In treatment Cd1, the Cd contents of the leaves were as follows: D3 < D1 < D2. In treatment Cd2, the Cd contents of the leaves were as follows: D1 < D2 < D3.
Figure 3.
Effect of different Cd stress concentrations on Cd content of rice canopy leaves during different growth stages ((a) Tillering; (b) Heading; (c) Filling). D1-D4 represent the leaf position from top to bottom of the plant.
3.2. Temporal and Spatial Changes in Chlorophyll Content of Rice Canopy Leaves
The dynamic changes and vertical distribution characteristics of the SPAD values of the rice leaves at different leaf positions in the different growth stages under different Cd concentrations are shown in Figure 4. The SPAD values of the rice leaves decreased with increasing Cd stress concentration in the three growth stages. The SPAD values of the rice leaves in treatments Cd1 and Cd2 were 3.45% and 6.91% lower than those in CK in the tillering stage, 1.91% and 5.25% lower in the heading stage, and 1.93% and 12.01% lower in the filling stage.
Figure 4.
Rice canopy leaves of the relative chlorophyll content during different growth stages ((a) Tillering; (b) Heading; (c) Filling). The black dot represents the average value of SPAD at the top, central and basal. D1–D4 represent the leaf position from top to bottom of the plant, lowercase letters indicate significant differences.
The SPAD values of the rice leaves increased gradually from the tillering stage to the heading stage, reached the maximum value in the heading stage, and decreased rapidly from the heading stage to the filling stage. The SPAD values of the leaves at different leaf positions decreased after the heading stage, and the range of the decrease was as follows: Cd2 > Cd1 > CK. The SPAD values of the leaves of treatments Cd2, Cd1, and Ck in the filling stage were 7.46%, 4.98%, and 4.80% lower than those in the heading stage, respectively.
In the tillering stage, in treatment CK, the leaf SPAD values were D3 > D4 > D2 > D1; and in treatments Cd1 and Cd2 they were D3 > D2 > D4 > D1. In the heading stage, the SPAD values of treatment CK were D2 > D3 > D1 > D4, those of Cd1 were D2 > D1 > D3 > D4, and those of Cd2 were D1 > D2 > D4 > D3. During the grouting period, the SPAD values of treatment CK were D2 > D1 > D3, those of Cd1 were D1 > D2 > D3, and those of Cd2 were D2 > D3 > D1. In addition, the SPAD values of the D1, D2, D3, and D4 blades were as follows: basal > central > top.
3.3. Effects of Different Cd Stress Concentrations on Photosynthetic Parameters of Rice Leaves in the Heading Stage
Figure 4 shows that the SPAD values of the rice canopy leaves reached the maximum in the heading stage, and the chlorophyll content was closely related to photosynthesis under Cd stress [28]. Figure 5 shows the changes in the photosynthetic parameters of the rice leaves under different Cd stress concentrations in the heading stage. Compared with CK, as the Cd stress concentration increased, the Pn, Gs, Tr, and Ci values of the rice leaves decreased. The Pn values of treatments Cd 1 and Cd 2 decreased by 11.10% and 13.41%, respectively, compared with CK. The Gs values decreased by 19.39% and 40.78%, respectively, compared with CK. The Tr values decreased by 9.24% and 26.71%, respectively, compared with CK. The Ci values decreased by 5.66% and 12.43%, respectively, compared with CK.
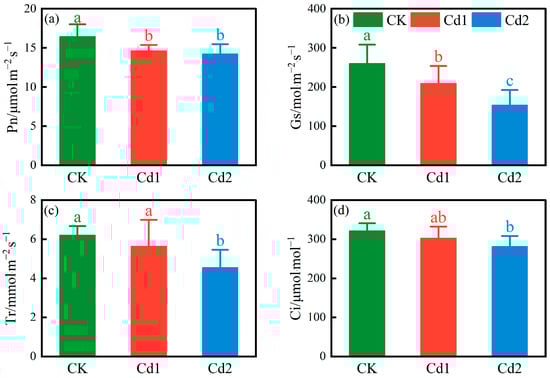
Figure 5.
Changes in photosynthetic parameters of rice leaves under different Cd stress concentrations((a) Net photosynthetic rate (Pn); (b) Stomatal conductance (Gs); (c) Transpiration rate (Tr); (d) intercellular CO2 concentration (Ci)), lowercase letters indicate significant differences.
3.4. Responses of Chlorophyll Fluorescence Parameters of Rice Canopy Leaves to Different Cadmium Concentrations
The results of the cluster thermogram analysis of the different Cd stress concentrations and ChlF parameters are shown in Figure 6. The change in the color on the heat map directly reflects the change in the ChlF parameter with increasing Cd stress concentration. The 14 ChlF parameters can be divided into four categories. In the tillering stage, the first category includes qL; the second category includes Y (NPQ), NPQ, qN, and qP; the third category includes Fv/Fm, Y (NO), Fo, Fo’, ETR, and Y (II); and the fourth category includes Fm, Fm’, and F. In the heading stage, the first category includes qL; the second category includes Fo, NPQ, and Fo’; the third category includes Fm, Y (NPQ), qN, and qP; and the fourth category includes Fv/Fm, Y (NO), ETR, Y (II), Fm’, and F. In the grouting period, the first category includes Y (NPQ), NPQ, and qN; the second category includes ETR, Y (II), and Fm’; the third category includes Fo, qL, and Fo’; and the fourth category includes Fm, Y (NPQ), qP, Fv/Fm, and F. In the tillering and filling stages, CK was the first type, and Cd1 and Cd2 were the second types. In the heading stage, CK and Cd1 were the first types, and Cd2 was the second type.
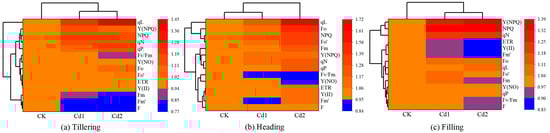
Figure 6.
Cluster heat maps of different Cd stress concentrations and Chlorophyll fluorescence parameters during different growth stages ((a) Tillering; (b) Heading; (c) Filling). Taking the CK treatment as the control (CK treatment equals 1, denoted by orange) and parameters of another treatment of the stage are expressed by a fraction relative to the corresponding value of the CK treatment. The redder the color is, the bigger it is relative to CK, and the bluer the color is, the smaller it is relative to CK.
3.5. Effects of Different Cadmium Concentrations on Chlorophyll Fluorescence Parameters of Rice Canopy Leaves at Different Positions
The changes in the ChlF parameters of the rice leaves at different leaf positions under different Cd stress concentrations are shown in Figure 7. In treatments CK and Cd1, in tillering stage, the NPQ of the D3 leaves was lower than that of the D2 and D4 leaves and was greater than that of the D1 leaves. The NPQ values at the different leaf positions were D4 > D2 > D3 > D1 and D2 > D4 > D3 > D1 for treatments Ck and Cd1. As the Cd stress concentration increased, the NPQ of the D3 leaves increased rapidly. The NPQ values at the different leaf positions in treatment Cd2 were D4 > D3 > D2 > D1. In treatment CK, the Fo values of the D2 leaves were the largest, and the Fo values at the different leaf positions were D2 > D4 > D1 > D3. The Fo values of the D2 and D3 leaves were smaller than those of the D1 leaves in treatments Cd1 and Cd2. The Fo values at the different leaf positions were D4 > D1 > D2 > D3 and D1 > D4 > D2 > D3 for treatments Cd1 and Cd2. It can be concluded that the NPQ of the D3 leaves and the Fo of the D2 leaves were more sensitive to the Cd stress than the other leaves in the tillering stage. In treatments CK and Cd1, in the heading stage, the NPQ values of the D3 leaves were lower than those of the D2 and D4 leaves and were larger than those of the D1 leaves. The NPQ values at the different leaf positions were D4 > D2 > D3 > D1. The NPQ values of the D3 leaves increased rapidly in treatment Cd2, and the NPQ values at the different leaf positions were D3 > D4 > D2 > D1. In treatment CK, the Fo values of the D2 and D3 leaves were lower than those of the D1 leaves, and the Fo values at the different leaf positions were D4 > D1 > D3 > D2. The Fo values of the D2 and D3 leaves were greater than those of the D1 leaves in treatments Cd1 and Cd2, and the Fo values at the different leaf positions were D4 > D2 > D3 > D1 and D3 > D4 > D2 > D1. It can be concluded that in the heading stage, the NPQ and Fo values of the D3 leaves were more sensitive to the Cd stress than the other leaves. During the grouting period, the NPQ values of the D2 leaves in treatments CK and Cd1 were lower than those of the D1 and D4 leaves, and the NPQ values at the different leaf positions were D1 > D3 > D2 and D3 > D1 > D2. The NPQ values of the D2 leaves increased rapidly in treatment Cd2, and the NPQ values at the different leaf positions were D2 > D3 > D1. In treatment CK, the Fo values of the D2 and D3 leaves were lower than those of the D1 leaves, and the NPQ values at the different leaf positions were D1 > D2 > D3. The Fo values of the D2 leaf were greater than those of the D1 leaves in treatments Cd1 and Cd2, and the Fo values at the different leaf positions were D3 > D2 > D1 and D2 > D1 > D3. It can be concluded that in the filling stage, the NPQ and Fo values of the D2 leaves were more sensitive to the Cd stress than the other leaves.
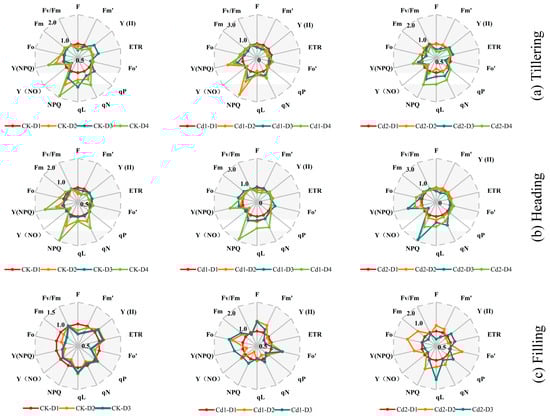
Figure 7.
Radar plots of the CK, Cd1, and Cd2 treatment with a series of important parameters derived from the Chlorophyll fluorescence during different growth stages ((a) Tillering; (b) Heading; (c) Filling). These parameters for each leaf are the average of all samples with the CK, Cd1, and Cd2 treatment. Taking each leaf at the D1 position as the control (each parameter equals 1, denoted by a red circle) and the parameters of another leaf of the stage are expressed by a fraction relative to the corresponding value of the D1 layer leaf, the number of the outermost circle represents the maximum value of its scale mark. Lines of different colors represent values from D1 to D4.
As the difference in the Fv/Fm value at the different leaf positions in Figure 6 is affected by the legend coverage, it is difficult to see the difference intuitively. Figure 8 shows the results of the impact analysis of the different Cd concentrations on the Fv/Fm value at the different leaf positions in the rice canopy. In treatments CK and Cd1, in the tillering stage, the Fv/Fm values of the D2 leaves were lower than those of the D1 leaves, and the Fv/Fm values at the different leaf positions were D4 > D2 > D3 > D1 and D2 > D4 > D3 > D1. As the Cd concentration increased, the Fv/Fm values of the D2 leaves increased rapidly. The Fv/Fm values at the different leaf positions in treatment Cd2 were D2 > D3 > D1 > D4. It can be concluded that in the tillering stage, the Fv/Fm value of the D2 leaves was more sensitive to the Cd stress than those of the other leaves. In treatment CK, in the heading stage, the Fv/Fm values of the D3 leaves were greater than those of the D1 and D2 leaves. As the Cd concentration increased, the Fv/Fm values of the D3 leaves decreased rapidly. In treatments Cd1 and Cd2, the Fv/Fm values of the D3 leaves were lower than those of the D1 and D2 leaves, and the Fv/Fm values at the different leaf positions were D1 > D2 > D4 > D3 and D1 > D2 > D3 > D4. It can be concluded that in the heading stage, the Fv/Fm value of the D3 leaves was more sensitive to the Cd stress than those of the other leaves. In treatment CK, in the filling stage, the Fv/Fm values of the D2 and D3 leaves were greater than those of the D1 leaves, and the Fv/Fm values at the different leaf positions were D2 > D3 > D1. As the Cd concentration increased, the Fv/Fm values of the D2 and D3 leaves decreased rapidly. In treatments Cd1 and Cd2, the Fv/Fm values of the D2 and D3 leaves were lower than those of the D1 leaves. The Fv/Fm values at the different leaf positions were D1 > D2 > D3. It can be concluded that in the filling stage, the Fv/Fm values of the D2 and D3 leaves were more sensitive to the Cd stress than those of the other leaves.
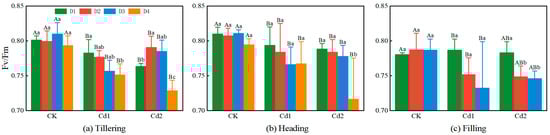
Figure 8.
Effect of different cadmium stress concentrations on Fv/Fm of rice canopy leaves at different leaf positions during different growth stages ((a) Tillering; (b) Heading; (c) Filling). Uppercase letters indicate significant differences between CK, Cd1, and Cd2, and lowercase letters indicate significant differences between D1, D2, D3, and D4.
4. Discussion
4.1. Effects of Different Cd Stress Concentrations on Cd Content of Rice Canopy Leaves
There are differences in the Cd contents of rice leaves in the different growth stages, and the tillering stage and filling stage are the key periods for Cd accumulation [29]. In this study, it was found that the Cd contents of the leaves were the lowest in the heading stage, while the Cd contents of the leaves were relatively high in the tillering and filling stages, which is consistent with previous research results [30]. Rice plants grow vegetatively in the tillering stage, and their biomass increases rapidly. Cd enters the rice leaves with the nutrients so the Cd content of the leaves is high in the tillering stage [31]. In the tillering stage and heading stage, as the leaf position moved downward, the Cd content of the leaves increased, indicating that the Cd had a significant downward enrichment trend. The younger the leaves were, the lower the Cd content was.
4.2. Vertical Distribution Characteristics of Relative Chlorophyll Content under Different Cd Stress Concentrations
Chlorophyll is the main executor of photosynthesis in crop leaves, and it is responsible for the absorption, transmission, and energy conversion of light energy. Cd stress reduces the chlorophyll content of crop leaves [32,33]. In this study, it was found that the SPAD value of the rice leaves decreased with increasing Cd concentration, which is consistent with previous research results [32,33,34]. There are many reasons for the reduction of the chlorophyll content under Cd stress. For example, Cd inhibits the biosynthesis of chlorophyll by reducing the activity of ATPase in the plasma membrane, increasing lipid peroxidation, and reducing the activity of the enzymes involved in CO2 fixation [35]. Cd causes Fe2+ deficiency and has a negative impact on the photosynthetic system [36]. Cd interferes with the absorption of water, Ca, Mg, K, and P, leading to a reduction of the chlorophyll content [37].
The SPAD values of the rice leaves reached the maximum in the heading stage, which may indicate that the rice plant was in a vigorous growth period with sufficient sunshine [38]. The rapid decrease in the SPAD value during the filling may be due to the natural senescence of the leaves [39]. In the tillering stage, the three functional leaves (D1, D2, and D3) of the rice plant increased as the leaf position moved upward, and D4 was always smaller than D3. The SPAD value decreased as the leaf position moved downward in the heading stage and filling stage. This may be because the leaves at different leaf positions play different roles (source or sink) in the growth and development of the rice plant. In the vegetative growth stage, the leaves are a sink; while in the reproductive growth stage, the leaves act as a source. The continuous change in the relationship between the sink and the source leads to significant spatiotemporal variations in the chlorophyll content [9]. In addition, the SPAD values at different measuring positions are different [40]. The thicker the blade is, the larger the SPAD value will be [41], which may be the reason why the SPAD value gradually increases from the top to the basal.
4.3. Effects of Different Cd Concentrations on Photosynthetic Gas Exchange Parameters of Rice Leaves in the Heading Stage
Photosynthesis is a systematic process involving photosynthetic pigments, a photosystem, an electron transfer system, and a CO2 assimilation mode [42]. It is highly sensitive to Cd stress, and even a low concentration of Cd can inhibit crop photosynthesis [43]. Pn is a determinant of rice growth and dry matter accumulation [44]. The adsorption of an excessive amount of Cd leads to a reduction of the net photosynthetic rate and the synthesis of chlorophyll [45]. In this study, consistent results were obtained, that is, the Cd stress reduced the Pn and SPAD values. The decrease in the Gs was one of the earliest reactions to the decrease in photosynthesis under Cd stress [46]. Ci and Tr reflected the diffusion and fixation rates of CO2 [47]. In this study, it was found that Pn, Gs, Ci, and Tr decreased significantly with increasing Cd stress concentration, which is consistent with previous research results [43]. It can be concluded that the photosynthesis of the rice leaves was extremely sensitive to Cd stress, and the Cd stress led to a significant reduction in the stomatal conductance and transpiration rate, thus inhibiting the supply of CO2, leading to a significant decrease in the intercellular CO2 concentration, and ultimately leading to a significant reduction in the net photosynthetic rate.
Photosynthesis is jointly controlled by stomatal factors and non-stomatal factors [48]. If the change trends of Ci and Pn are consistent, the stomatal factors are the main cause of the change in photosynthesis, and the non-stomatal factors are the main cause when the trends are not consistent. In this study, it was found that the Cd stress decreased the Ci and Pn values, indicating that the stomatal factors were the main reason for the reduction of photosynthesis, which is consistent with previous research results [49]. The main reason Cd stress reduces rice plant photosynthesis is that K+ flows from the guard cells to the auxiliary cells, leading to reduced swelling of the guard cells and finally closure of the stomata [50,51,52]. Cd stress also inhibits chlorophyll biosynthesis and RuBisCO activity [53], increases the concentration of soluble hexose in leaves, inhibits photosynthetic genes, and reduces the CO2 assimilation rate [54].
4.4. Effects of Different Cadmium Stress Concentrations on Chlorophyll Fluorescence Parameters of Rice Leaves
The ChlF can accurately reflect the process of light energy absorption and transmission by crops and can directly affect biological processes such as the electron transfer rate, proton gradient establishment, and adenosine triphosphate (ATP) synthesis. It is a powerful tool for studying the physiological responses of crops under heavy metal stress [55,56]. In this study, it was found that under Cd stress, the ChlF parameters Fo and NPQ increased, while Fv/Fm, ETR, and Y (II) decreased, which is consistent with previous research results [20,57]. The increase in the Fo value is a significant feature of the inactivation of or the damage to PSII [58]. As the Cd stress concentration increased, the range of the increase in Fo became larger, indicating that the light inhibition was weaker in treatment Cd1; while in treatment Cd2, PSII of the rice plant was damaged. Fv/Fm is usually between 0.80 and 0.84. Under non-stress conditions, its value changes very little, but it decreases significantly under environmental stress, so it can be used as an indicator of photoinhibition [57]. The Fv/Fm value of treatment CK was about 0.80, while those of treatments Cd1 and Cd2 were significantly lower than 0.80, indicating that Cd1 and Cd2 were under high Cd stress. It can be concluded that the Cd stress caused photoinhibition, which damaged the potential active center of PSII and inhibited the primary photosynthesis reaction. Y (II) reflects the actual photosynthetic efficiency of PSII. Crops dissipate excess excitation energy by activating the NPQ pathway to protect the photosynthetic apparatus from damage, so the NPQ value increases under heavy metal stress [59]. In this study, it was found that Y (II) decreased and NPQ increased significantly under Cd stress, indicating that the photosynthetic electron transport activity in the rice leaves decreased under Cd stress, and more light energy was absorbed and dissipated through non-photochemical pathways, revealing the self-protection mechanism of the rice leaves. These results are consistent with previous research results [60]. It can be concluded that Cd stress inhibited the photosynthetic electron transfer ability of PSII, reduced the electron transfer rate, and the rice plant dissipated the excess light energy through non-radiation energy channels to protect its own photosynthetic apparatus. ETR is the electron transfer rate of PSII. Cd stress affects the electron transfer of PSII first, thereby reducing the reaction activity of PSII and inhibiting photosynthesis. In this study, it was found that as the Cd stress increased, the ETR significantly decreased, indicating that the Cd stress damaged the chloroplast ultrastructure of the rice leaves, inhibited the electron transfer rate, and finally decreased the efficiency of the light energy conversion and photosynthesis.
In the tillering stage and filling stage, there were differences between treatments Cd1 and Cd2 and treatment CK; while in the heading stage, treatments CK and Cd1 were divided into one type, which was different from that of Cd2. The results show that the Cd stress had a greater effect in the tillering and filling stages than in the heading stage.
4.5. Significant Spatiotemporal Characteristics of Leaf Photochemistry
During the natural senescence of rice plants, the photosynthetic activity (Fv/Fm) and chlorophyll content decrease, so the ChlF also decreases [61]. The senescence mode of rice leaves is sequential senescence, that is, senescence from the lower leaves to the upper leaves [62]. Cd stress also accelerates crop senescence [63] and inhibits the photosynthesis of rice plants [43,64]. In this study, it was found that in the heading stage, the Cd content of the leaves increased and the chlorophyll content decreased as the leaf position moved downward. In the heading stage, the Cd content of the leaves was low, but the chlorophyll content was high, which may be the reason why more photosynthetic activity occurred in the middle and upper leaves in the heading stage.
In this study, it was found that there was no significant change in the Fv/Fm of the canopy leaves in treatment CK, but under Cd stress, the Fv/Fm decreased as the leaf position moved downward. This indicates that the Cd stress changed the spatial distribution of the rice canopy leaves. This is consistent with the results of the Cd content distribution and chlorophyll content distribution in the canopy leaves. It can be concluded that the natural senescence of the leaves, the excessive accumulation of Cd in the leaves, and the reduction of the chlorophyll content may all be reasons why the lower leaves had a lower maximum photochemical efficiency.
The magnitude of Fo is related to the chlorophyll content and the degree of damage to PSII. Fo decreases with decreasing chlorophyll content, while damage to the photochemical structure causes Fo to increase [65]. Therefore, the direction of the change in Fo depends on the factors that play a leading role in these processes. In the tillering stage, there was no significant change in Fo in the treatment of CK. In treatments Cd1 and Cd2, the Fo values of D1, D2, and D3 decreased as the leaf position moved downward, but it increased in D4. This shows that the destruction of the photochemical structure of the upper leaves in the tillering stage played a leading role in the increase in the Fo value, while the increase in the Fo value of the D4 leaves was due to the joint effect of the increase in the chlorophyll content and the destruction of the photochemical structure. In the heading stage and filling stage, the Fo values of D2 and D3 were greater than that of D1 in treatment CK, which may be the reason why the chlorophyll contents of D2 and D3 were higher. The Fo value increased, the chlorophyll content decreased, and the Cd content increased as the position of the leaves moved downward in treatments Cd1 and Cd2, indicating that the destruction of the photochemical structure in the lower leaves played a leading role. It can be concluded that in treatment CK, the Fo value was mainly affected by the chlorophyll content; while in treatments Cd1 and Cd2, the Fo value was mainly affected by the Cd stress. In the tillering and heading stages, NPQ increased as the leaf position moved downward, indicating that under the dual effects of natural aging and Cd stress, the heat dissipation of PSII was higher in the lower leaves, which is consistent with previous research results [61]. This may be due to the reduction of the chlorophyll content, which leads to the reduction of the light energy captured by the photosynthetic organs, thus reducing the risk of photoinhibition. The degradation of chlorophyll can retransfer the released nitrogen and phosphorus to other functional leaves in order to maintain the vitality of the upper leaves as much as possible [66]. Regulating the energy dissipation Y (NPQ) dissipates the light energy absorbed by PSII in the form of heat to achieve self-protection, which is consistent with the changing trend of NPQ, indicating that the lower leaves of the rice plant can dissipate excess light energy through self-regulation to achieve self-protection.
5. Conclusions
In this study, we investigated the characteristics of the vertical distribution of relative leaf Chl content and fluorescence response within the rice canopy at different fertility periods. We demonstrated that Cd stress increased the Cd content in rice leaves and decreased the SPAD values, thus reducing photosynthesis and fluorescence parameters. The SPAD values were higher in the lower leaves at the tillering stage and higher in the upper leaves at the tasseling and filling stages. D3 leaves (NPQ) and D2 leaves (Fo, Fv/Fm) at the tillering stage, D3 leaves (NPQ, Fo, Fv/Fm) at the tasseling stage, D2 leaves (NPQ, Fo, Fv/Fm), and D3 leaves (Fv/Fm) at the filling stage are sensitive leaf positions and fluorescence parameters for monitoring Cd stress response in rice at different reproductive periods. These findings provide a new and feasible means to understand the relationship between physiological properties between canopy and individual leaves and to monitor Cd contamination levels non-destructively over a large area.
Author Contributions
Conceptualization, X.H. and Y.T.; Methodology, X.H., H.C. (Hongxing Chen), Software, X.H., H.C. (Hongxing Chen), Y.T. and W.Z.; Validation, X.H. and X.C.; Formal analysis, X.H., H.C. (Hui Chen) and Y.T.; Investigation, X.H. and C.F.; Resources, X.H. and X.C.; Data curation, X.H.; Writing—original draft, X.H.; Supervision, T.H. and Z.G. All authors have read and agreed to the published version of the manuscript.
Funding
This research was funded by the National Natural Science Foundation of China (4216070281); and the Guizhou University Doctoral Fund (2019-39).
Institutional Review Board Statement
Not applicable.
Informed Consent Statement
Informed consent was obtained from all subjects involved in the study.
Data Availability Statement
The data presented in this study are available upon request from the author.
Acknowledgments
The authors express their gratitude to the editor and the reviewers for their constructive comments. We also greatly thank the LetPub English service for the editing assistance of the paper.
Conflicts of Interest
The authors declare no conflict of interest.
References
- Shahid, M.; Dumat, C.; Khalid, S.; Niazi, N.K.; Antunes, P. Cadmium Bioavailability, Uptake, Toxicity and Detoxification in Soil-Plant System. Rev. Environ. Contam. Toxicol. 2017, 241, 73–137. [Google Scholar] [CrossRef]
- Liang, C.; Xiao, H.; Hu, Z.; Zhang, X.; Hu, J. Uptake, transportation, and accumulation of C60 fullerene and heavy metal ions (Cd, Cu, and Pb) in rice plants grown in an agricultural soil. Envion. Pollut. 2018, 235, 330–338. [Google Scholar] [CrossRef] [PubMed]
- Tang, Y.; Qiu, R.; Zeng, X.; Fang, X.; Yu, F.; Zhou, X.; Wu, Y. Zn and Cd hyperaccumulating characteristics of Picris divaricata Vant. Int. J. Environ. Pollut. 2009, 38, 26–38. [Google Scholar] [CrossRef]
- Liu, F.; Liu, X.; Ding, C.; Wu, L. The dynamic simulation of rice growth parameters under cadmium stress with the assimilation of multi-period spectral indices and crop model. Field Crops Res. 2015, 183, 225–234. [Google Scholar] [CrossRef]
- Chen, W.; Yang, Y.; Xie, T.; Wang, M.; Peng, C.; Wang, R. Challenges and Countermeasures for Heavy Metal Pollution Control in Farmlands of China. Acta Pedol. Sin. 2018, 55, 261–272. (In Chinese) [Google Scholar] [CrossRef]
- Fu, J.; Zhou, Q.; Liu, J.; Liu, W.; Wang, T.; Zhang, Q.; Jiang, G. High levels of heavy metals in rice (Oryza sativa L.) from a typical E-waste recycling area in southeast China and its potential risk to human health. Chemosphere 2008, 71, 1269–1275. [Google Scholar] [CrossRef]
- Xue, Z.C.; Gao, H.Y.; Zhang, L.T. Effects of cadmium on growth, photosynthetic rate and chlorophyII content in leaves of soybean seedlings. Biol. Plantarum. 2013, 57, 587–590. [Google Scholar] [CrossRef]
- Adhikari, A.; Lee, K.; Khan, M.A.; Kang, S.; Adhikari, B.; Imran, M.; Jan, R.; Kim, K.; Lee, I. Effect of Silicate and Phosphate Solubilizing Rhizobacterium Enterobacter ludwigii GAK2 on Oryza sativa L. under Cadmium Stress. J. Microbiol. Biotechnol. 2020, 30, 118–126. [Google Scholar] [CrossRef]
- Zhang, J.; Wan, L.; Igathinathane, C.; Zhang, Z.; Cen, H. Spatiotemporal Heterogeneity of ChlorophyII Content and Fluorescence Response within Rice (Oryza sativa L.) Canopies Under Different Nitrogen Treatments. Front. Plant Sci. 2021, 12, 645977. [Google Scholar] [CrossRef]
- Bidabadi, S.S.; Abolghasemi, R.; Zheng, S.J. Grafting of watermelon (Citrullus lanatus cv. Mahbubi) onto different squash rootstocks as a means to minimize cadmium toxicity. Int. J. Phytoremediat. 2018, 20, 730–738. [Google Scholar] [CrossRef]
- Chen, Q.; Zhang, X.; Liu, Y.; Wei, J.; Shen, W.; Shen, Z.; Cui, J. Hemin-mediated alleviation of zinc, lead and chromium toxicity is associated with elevated photosynthesis, antioxidative capacity; suppressed metal uptake and oxidative stress in rice seedlings. Plant Growth Regul. 2017, 81, 253–264. [Google Scholar] [CrossRef]
- Wang, C.; Cheng, T.; Liu, H.; Zhou, F.; Cao, T. Nano-selenium controlled cadmium accumulation and improved photosynthesis in indica rice cultivated in lead and cadmium combined paddy soils. J. Environ. Sci. 2021, 103, 336–346. [Google Scholar] [CrossRef] [PubMed]
- Liu, H.; Zhang, C.; Wang, J.; Zhou, C.; Feng, H.; Mahajan, M.D.; Han, X. Influence and interaction of iron and cadmium on photosynthesis and antioxidative enzymes in two rice cultivars. Chemosphere 2017, 171, 240–247. [Google Scholar] [CrossRef] [PubMed]
- Ivanov, D.A.; Bernards, M.A. ChlorophyII fluorescence imaging as a tool to monitor the progress of a root pathogen in a perennial plant. Planta 2016, 243, 263–279. [Google Scholar] [CrossRef]
- Baker, N.R.; Eva, R. Applications of chlorophyII fluorescence can improve crop production strategies: An examination of future possibilities. J. Exp. Bot. 2004, 55, 1607–1621. [Google Scholar] [CrossRef] [PubMed]
- Baker, N.R. ChlorophyII fluorescence: A probe of photosynthesis in vivo. Annu. Rev. Plant Biol. 2008, 59, 89–113. [Google Scholar] [CrossRef] [PubMed]
- Gorbe, E.; Calatayud, A. Applications of chlorophyII fluorescence imaging technique in horticultural research: A review. Sci. Hortic. 2012, 138, 24–35. [Google Scholar] [CrossRef]
- Tan, Z.; Xuan, Z.; Wu, C.; Cheng, Y.; Xu, C.; Ma, X.; Wang, D. Effects of Selenium on the AsA-GSH System and Photosynthesis of Pakchoi (Brassica chinensis L.) Under Lead Stress. J. Soil Sci. Plant Nut. 2022, 22, 5111–5122. [Google Scholar] [CrossRef]
- Bączek-Kwinta, R.; Antonkiewicz, J. Differential Physiological Response and Potential Toxicological Risk of White Cabbage Grown in Zinc-Spiked Soil. Agronomy 2022, 12, 2186. [Google Scholar] [CrossRef]
- Alam, P.; Balawi, T.H.; Altalayan, F.H.; Hatamleh, A.A.; Ashraf, M.; Ahmad, P. Silicon attenuates the negative effects of chromium stress in tomato plants by modifying antioxidant enzyme activities, ascorbate–glutathione cycle and glyoxalase system. Acta Physiol. Plant 2021, 43, 110. [Google Scholar] [CrossRef]
- Feng, W.; He, L.; Zhang, H.Y.; Guo, B.B.; Zhu, Y.J.; Wang, C.Y.; Guo, T.C. Assessment of plant nitrogen status using chlorophyII fluorescence parameters of the upper leaves in winter wheat. Eur. J. Agron. 2015, 64, 78–87. [Google Scholar] [CrossRef]
- Meng, Q.; Siebke, K.; Lippert, P.; Baur, B.; Weis, M.E. Sink-Source Transition in Tobacco Leaves Visualized Using ChlorophyII Fluorescence Imaging. New Phytol. 2001, 151, 585–595. [Google Scholar] [CrossRef] [PubMed]
- Larbi, A.; Vázquez, S.; El-Jendoubi, H.; Msallem, M.; Abadía, J.; Abadía, A.; Morales, F. Canopy light heterogeneity drives leaf anatomical, eco-physiological, and photosynthetic changes in olive trees grown in a high-density plantation. Photosynth. Res. 2015, 123, 141–155. [Google Scholar] [CrossRef] [PubMed]
- Bari, M.A.; El-Shehawi, A.M.; Elseehy, M.M.; Naheen, N.N.; Rahman, M.M.; Kabir, A.H. Molecular characterization and bioinformatics analysis of transporter genes associated with Cd-induced phytotoxicity in rice (Oryza sativa L.). Plant Physiol. Bioch. 2021, 167, 438–448. [Google Scholar] [CrossRef]
- Figueroa, F.L.; Álvarez-Gómez, F.; Del Rosal, Y.; Celis-Plá, P.S.M.; González, G.; Hernández, M.; Korbee, N. In situ photosynthetic yields of cave photoautotrophic biofilms using two different Pulse Amplitude Modulated fluorometers. Algal Res. 2017, 22, 104–115. [Google Scholar] [CrossRef]
- Yudina, L.; Sherstneva, O.; Sukhova, E.; Grinberg, M.; Mysyagin, S.; Vodeneev, V.; Sukhov, V. Inactivation of H+-ATPase Participates in the Influence of Variation Potential on Photosynthesis and Respiration in Peas. Plants 2020, 9, 1585. [Google Scholar] [CrossRef] [PubMed]
- Martínez-Rubio, D.; Grindlay, G.; Llaver, M.; Wuilloud, R.G.; Mora, J. Development of preconcentration strategies for the simultaneous ultratrace determination of As, Cd and Pb in foods by ICP-OES: Knotted-reactor vs dispersive liquid-liquid microextraction. J. Anal. Atom. Spectrom. 2020, 35, 933–942. [Google Scholar] [CrossRef]
- Liang, T.S.; Liu, C.X.; Kang, J.Q.; Jing, Z.H.; Lv, J.Y. Effects of Sulfuron Cadmium Accumulation, Photosynthesis and Some Other Physiological Characteristics of Pakchoi (Brassica chinensis L.) Under Cadmium Stresses. J. Agro-Environ. Sci. 2015, 34, 1455–1463. (In Chinese) [Google Scholar] [CrossRef]
- Shi, J.; Li, Z.W.; Gong, W.Q.; Pan, G.X. Uptake and Partitioning of Cd and Zn by Two Non-hybrid Rice Cultivarsin Different Growth Stages: Effect of Cultivars, Soil Type and Cd Spike. Asian J. Ecotoxicol. 2007, 2, 32–40. (In Chinese) [Google Scholar]
- Wang, K.R.; Gong, H.Q. Comparative studies on the difference of the uptake and redistribution of environmental Cd by two Genic rice. Agro-Environ. Prot. 1996, 15, 145–149. (In Chinese) [Google Scholar]
- Ding, Y.; Zong, L.G.; Xu, X.Y.; Liu, G.R. Effect of cadmium on the growth and quality of rice (Oryza sativa L.) in different growth period. Ecol. Environ. Sci. 2009, 18, 183–186. (In Chinese) [Google Scholar]
- Vaculík, M.; Pavlovič, A.; Lux, A. Silicon alleviates cadmium toxicity by enhanced photosynthetic rate and modified bundle sheath’s cell chloroplasts ultrastructure in maize. Ecotox. Environ. Saf. 2015, 120, 66–73. [Google Scholar] [CrossRef] [PubMed]
- Lysenko, E.A.; Klaus, A.A.; Pshybytko, N.L.; Kusnetsov, V.V. Cadmium accumulation in chloroplasts and its impact on chloroplastic processes in barley and maize. Photosynth. Res. 2015, 125, 291–303. [Google Scholar] [CrossRef]
- Hammami, H.; Parsa, M.; Bayat, H.; Aminifard, M.H. The behavior of heavy metals in relation to their influence on the common bean (Phaseolus vulgaris) symbiosis. Environ. Exp. Bot. 2022, 193, 104670. [Google Scholar] [CrossRef]
- Ouni, Y.; Mateos-Naranjo, E.; Abdelly, C.; Lakhdar, A. Interactive effect of salinity and zinc stress on growth and photosynthetic responses of the perennial grass, Polypogon monspeliensis. Ecol. Eng. 2016, 95, 171–179. [Google Scholar] [CrossRef]
- Haider, F.U.; Cai, L.; Coulter, J.A.; Cheema, S.A.; Farooq, M. Cadmium toxicity in plants: Impacts and remediation strategies. Ecotox. Environ. Saf. 2021, 211, 111887. [Google Scholar] [CrossRef]
- Amari, T.; Ghnaya, T.; Abdelly, C. Nickel, cadmium and lead phytotoxicity and potential of halophytic plants in heavy metal extraction. S. Afr. J. Bot. 2017, 111, 99–110. [Google Scholar] [CrossRef]
- Liu, Z.H.; Tang, Y.L.; Chang, J.; Lou, J. Correlation Analysis between Leaf ChlorophyII Content and Spectral Absorption Variables for Rice. Chin. Agric. Sci. Bull. 2009, 25, 68–71. (In Chinese) [Google Scholar]
- Li, Q.; Qi, L.Y.; Yin, L.N.; Wang, S.Y.; Deng, X.P. Relationship between Lipid and Flag Leaf Senescence Induced by Low Nitrogen Stress during Grain filling of Wheat. Acta Agron. Sin. 2018, 44, 1221–1228. [Google Scholar] [CrossRef]
- Li, G.H.; Ding, Y.F.; Xue, L.H.; Wang, S.H. Research progress on diagnosis of nitrogen nutrition and fertilization recommendation for rice by use chlorophyII meter. Plant Nutr. Fertil. Sci. 2005, 11, 412–416. (In Chinese) [Google Scholar] [CrossRef]
- Li, J.W. The Diagnosis of Rice N Status Based on Leaf Physioecological Characteristics; Zhejiang University: Hangzhou, China, 2010. [Google Scholar]
- Atabayeva, S.D.; Rakhymgozhina, A.B.; Nurmahanova, A.S.; Kenzhebayeva, S.S.; Usenbekov, B.N.; Alybayeva, R.A.; Asrandina, S.S.; Tynybekov, B.M.; Amirova, A.K. Rice Plants (Oryza sativa L.) under Cd Stress in Fe Deficiency Conditions. Biomed. Res. Int. 2022, 2022, 7425085. [Google Scholar] [CrossRef] [PubMed]
- Cao, F.B.; Cai, Y.; Liu, L.; Zhang, M.; He, X.Y.; Zhang, G.P.; Wu, F.B. Differences in photosynthesis, yield and grain cadmium accumulation as affected by exogenous cadmium and glutathione in the two rice genotypes. Plant Growth Regul. 2015, 75, 715–723. [Google Scholar] [CrossRef]
- Li, J.; Cang, Z.; Jiao, F.; Bai, X.; Zhang, D.; Zhai, R. Influence of drought stress on photosynthetic characteristics and protective enzymes of potato at seedling stage. J. Saudi Soc. Agric. Sci. 2017, 16, 82–88. [Google Scholar] [CrossRef]
- Sun, Z.; Wang, L.; Chen, M.; Wang, L.; Liang, C.; Zhou, Q.; Huang, X. Interactive effects of cadmium and acid rain on photosynthetic light reaction in soybean seedlings. Ecotox. Environ. Saf. 2012, 79, 62–68. [Google Scholar] [CrossRef] [PubMed]
- Ashraf, M.; Harris, P.J.C. Photosynthesis under stressful environments: An overview. Photosynthetica 2013, 51, 163–190. [Google Scholar] [CrossRef]
- Hou, W.; Yan, J.; Jákli, B.; Lu, J.; Ren, T.; Cong, R.; Li, X. Synergistic Effects of Nitrogen and Potassium on Quantitative Limitations to Photosynthesis in Rice (Oryza sativa L.). J. Agric. Food Chem. 2018, 66, 5125–5132. [Google Scholar] [CrossRef]
- Perfus-Barbeoch, L.; Leonhardt, N.; Vavasseur, A.; Forestier, C. Heavy metal toxicity: Cadmium permeates through calcium channels and disturbs the plant water status. Plant J. 2002, 32, 539–548. [Google Scholar] [CrossRef]
- Liu, X.; Liu, L.; Hu, J.; Guo, J.; Du, S. Improving the potential of red SIF for estimating GPP by downscaling from the canopy level to the photosystem level. Agric. Forest Meteorol. 2020, 281, 107846. [Google Scholar] [CrossRef]
- Per, T.S.; Masood, A.; Khan, N.A. Nitric oxide improves S-assimilation and GSH production to prevent inhibitory effects of cadmium stress on photosynthesis in mustard (Brassica juncea L.). Nitric. Oxide. 2017, 68, 111–124. [Google Scholar] [CrossRef]
- Bernardini, A.; Salvatori, E.; Guerrini, V.; Fusaro, L.; Canepari, S.; Manes, F. Effects of high Zn and Pb concentrations on Phragmites australis (Cav.) Trin. Ex. Steudel: Photosynthetic performance and metal accumulation capacity under controlled conditions. Int. J. Phytoremediat. 2016, 18, 16–24. [Google Scholar] [CrossRef]
- Zouari, M.; Ben Ahmed, C.; Elloumi, N.; Bellassoued, K.; Delmail, D.; Labrousse, P.; Ben Abdallah, F.; Ben Rouina, B. Impact of proline application on cadmium accumulation, mineral nutrition and enzymatic antioxidant defense system of Olea europaea L. cv Chemlali exposed to cadmium stress. Ecotox. Environ. Saf. 2016, 128, 195–205. [Google Scholar] [CrossRef] [PubMed]
- Khan, N.A.; Asgher, M.; Per, T.S.; Masood, A.; Fatma, M.; Khan, M.I.R. Ethylene Potentiates Sulfur-Mediated Reversal of Cadmium Inhibited Photosynthetic Responses in Mustard. Front. Plant Sci. 2016, 7, 1628. [Google Scholar] [CrossRef] [PubMed]
- Takai, T.; Adachi, S.; Taguchi-Shiobara, F.; Sanoh-Arai, Y.; Iwasawa, N.; Yoshinaga, S.; Hirose, S.; Taniguchi, Y.; Yamanouchi, U.; Wu, J.; et al. A natural variant of NAL1, selected in high-yield rice breeding programs, pleiotropically increases photosynthesis rate. Sci. Rep. 2013, 3, 2149. [Google Scholar] [CrossRef]
- Stirbet, A.; Lazár, D.; Kromdijk, J.; Govindjee. ChlorophyII a fluorescence induction: Can just a one-second measurement be used to quantify abiotic stress responses? Photosynthetica 2018, 56, 86–104. [Google Scholar] [CrossRef]
- He, X.; Richmond, M.; Williams, D.V.; Zheng, W.; Wu, F. Exogenous Glycinebetaine Reduces Cadmium Uptake and Mitigates Cadmium Toxicity in Two Tobacco Genotypes Differing in Cadmium Tolerance. Int. J. Mol. Sci. 2019, 20, 1612. [Google Scholar] [CrossRef] [PubMed]
- Xiao, M.; Li, Y.; Wang, J.; Hu, X.; Wang, L.; Miao, Z. Study on the Law of Nitrogen Transfer and Conversion and Use of Fertilizer Nitrogen in Paddy Fields under Water-Saving Irrigation Mode. Water 2019, 11, 218. [Google Scholar] [CrossRef]
- Schnettger, B.; Critchley, C.; Santore, U.J.; Graf, M.; Krause, G.H. Relationship between photoinhibition of photosynthesis, D1 protein turnover and chloroplast structure: Effects of protein synthesis inhibitors. Plant Cell Environ. 1994, 17, 55–64. [Google Scholar] [CrossRef]
- Zhou, M.L.; Shen, G.S.; Zhao, R.R.; Gao, Z.Y.; Chen, g.p.; Shi, F.C. Effects of Lead Stress on Photosynthesis and Physiological and Biochemical Characteristics of Amorpha fruticosa. J. Agric. Resour. Environ. 2017, 34, 286–292. (In Chinese) [Google Scholar] [CrossRef]
- He, H.; Yang, R.; Jia, B.; Chen, L.; Fan, H.; Cui, J.; Yang, D.; Li, M.; Ma, F. Rice Photosynthetic Productivity and PSII Photochemistry under Nonflooded Irrigation. Sci. World J. 2014, 2014, 839658. [Google Scholar] [CrossRef]
- Cordon, G.; Lagorio, M.G.; Paruelo, J.M. ChlorophyII fluorescence, photochemical reflective index and normalized difference vegetative index during plant senescence. J. Plant Physiol. 2016, 199, 100–110. [Google Scholar] [CrossRef]
- Wiedemuth, K.; Müller, J.; Kahlau, A.; Amme, S.; Mock, H.; Grzam, A.; Hell, R.; Egle, K.; Beschow, H.; Humbeck, K. Successive maturation and senescence of individual leaves during barley whole plant ontogeny reveals temporal and spatial regulation of photosynthetic function in conjunction with C and N metabolism. J. Plant Physiol. 2005, 162, 1226–1236. [Google Scholar] [CrossRef] [PubMed]
- Robert, C.; Marie-Odile, B.; Bertrand, N.; Lannou, A.C. Wheat leaf photosynthesis loss due to leaf rust, with respect to lesion development and leaf nitrogen status. New Phytol. 2005, 165, 227–241. [Google Scholar] [CrossRef] [PubMed]
- Farooq, M.A.; Detterbeck, A.; Clemens, S.; Dietz, K.J. Silicon-induced reversibility of cadmium toxicity in rice. J. Exp. Bot. 2016, 67, 3573–3585. [Google Scholar] [CrossRef] [PubMed]
- Tu, W.; Li, Y.; Zhang, Y.; Zhang, L.; Liu, H.; Liu, C.; Yang, C. Diminished photoinhibition is involved in high photosynthetic capacities in spring ephemeral Berteroa incana under strong light conditions. J. Plant Physiol. 2012, 169, 1463–1470. [Google Scholar] [CrossRef] [PubMed]
- Sun, J.W.; Fu, X.S.; Xi, H.; Cai, C.; Wang, T.H. Gas exchange and chlorophyII fluorescence research on different position leaves of rice plant. J. Zhejiang Univ. (Agric. Life Sci.) 2007, 33, 277–283. (In Chinese) [Google Scholar]
Disclaimer/Publisher’s Note: The statements, opinions and data contained in all publications are solely those of the individual author(s) and contributor(s) and not of MDPI and/or the editor(s). MDPI and/or the editor(s) disclaim responsibility for any injury to people or property resulting from any ideas, methods, instructions or products referred to in the content. |
© 2022 by the authors. Licensee MDPI, Basel, Switzerland. This article is an open access article distributed under the terms and conditions of the Creative Commons Attribution (CC BY) license (https://creativecommons.org/licenses/by/4.0/).