Article

Interpreting Variety–Location–Fertilizer Interactions to Enhance Foxtail Millet Productivity in Northern China

1
Hebei Coarse Grain Research Laboratory, National Millet Improvement Center, Millet Research Institute, Hebei Academy of Agriculture and Forestry Sciences, Shijiazhuang 050035, China
2
Cereal Crops Institute, Henan Academy of Agricultural Sciences, Zhengzhou 450002, China
3
National Engineering Laboratory for Crop Molecular Breeding, Institute of Crop Sciences, Chinese Academy of Agricultural Sciences, Beijing 100081, China
4
Shandong Zibo Academy of Agricultural Sciences, Zibo 255033, China
*
Author to whom correspondence should be addressed.
These authors contributed equally to this work.
Agronomy 2022, 12(9), 2216; https://doi.org/10.3390/agronomy12092216
Submission received: 15 August 2022 / Revised: 12 September 2022 / Accepted: 15 September 2022 / Published: 17 September 2022
(This article belongs to the Section Soil and Plant Nutrition)

Abstract

:
Foxtail millet (Setaria italica (L.) P. Beauv.) is an important traditional cereal crop in dryland ecological agriculture in China and is widely grown in India, the United States, and Nigeria. It is of significance to understand the variety–location–fertilizer (V–L–F) interaction for highly efficient production. Therefore, a two-year field experiment was conducted with six varieties in five locations, and data were analyzed by combined ANOVA analysis, redundancy analysis (RDA), and additive main multiplicative interaction (AMMI). The results showed that the mean sum of squares was significantly different among years, locations, varieties, fertilizations, and their interactions, except for Y–V and V–F interactions. The contributions of various factors to yield variation varied, location was the largest contributor (38.7%), followed by year (33.6%), and variety and fertilizer contributed 7.1% and 3.2%, respectively. JI25 was widely adapted, and its yield was stable and higher than that of others over diverse environments in two years. The RDA results showed that two principal components explained more than 66.1% of the yield variance, while more than 63.0% of the variances were clustered in the first factor. Excessive single rainfall or total rainfall and air temperature (especially minimum temperature) were significantly associated with the millet yield. The results offered an important reference for variety layout, natural resource potential mining, and formulation of efficient green cultural practices.

1. Introduction

Foxtail millet (Setaria italica (L.) P. Beauv.) is an important cereal crop, which is widely grown in arid and semi-arid areas of China, India, the United States, and Nigeria due to its excellent drought and barren resistance, short growth, and long suitable sowing windows [1,2]. Foxtail millet is rich in protein, folic acid, vitamin E, carotenoid, selenium, and other important nutrients, playing a positive role in maintaining human health [3,4]. In northern China, foxtail millet is a necessary nourishing food for postpartum mothers and daily food for all ages [5,6].
Restrictive factors affecting the yield of foxtail millet include inappropriate planting location [7], unstable climate [8,9], diseases and pests [10], inappropriate variety selection, and improper agronomic measures [11,12]. Some studies showed the main restrictive factor affecting the grain yield is the genotype without ideal trait, while some showed it is selection of planting site (location) [13,14]. In contrast, whether variety, location, or fertilizer were the main restrictive factors affecting grain yield of foxtail millet is not determined. Previous research results defined the suitable variety or fertilization level in a specific location and provided better theoretical guidance for local millet cultivation [15,16,17]. However, most of the conclusions based on the one-way test in a specific environment are unable to explore the best matching mode of crop varieties, environment, and cultivation measures, or to explain the regulation mechanisms of cultivation measures in environmental factors, variety characteristics, and yield. The field performance of crop varieties is resulted by interaction effect and random error of varieties, environment, and cultivation measures. Crop, environment, and cultivation measures are interrelated and interact with each other to form a farmland crop cultivation system [18,19]. The great majority of studies displayed that environmental effects and interaction effects are closely related to the spatial location and interannual fluctuation of crop planting, accounting for more than 50% of the total variance of variety performance [20,21], and even a higher proportion if the effects of cultivation measures are accumulated [22]. Concurrently, a few studies suggested that environmental effects were lower than the those of varieties [23]. Regarding the importance of cultural practices and varieties in production, there are few research due to the increased difficulty of work and analysis. In addition, the research conclusions vary due to the differences in research objects, environments, and methods. For instance, a study on maize in Ethiopia revealed that cultivation management (plant density) accounted for 37% of yield variation, while varieties only accounted for 6% [22]. Nevertheless, an inconsistent finding was observed in a research on soybean conducted in Argentina, which suggested that the effects of genotype was greater than those of cultivation management (sowing date) [24]. However, given that there are few studies on the interaction mechanism of millet varieties, environment, and cultivation measures, objectives of this study are to (I) evaluate the effects of varieties, location, and fertilization and their interactions, (II) recommend varieties with wide adaptation and high yield, and (III) identify the key soil and meteorological factors influencing fertilization effect.

2. Materials and Methods

2.1. Foxtail Millet Genotypes
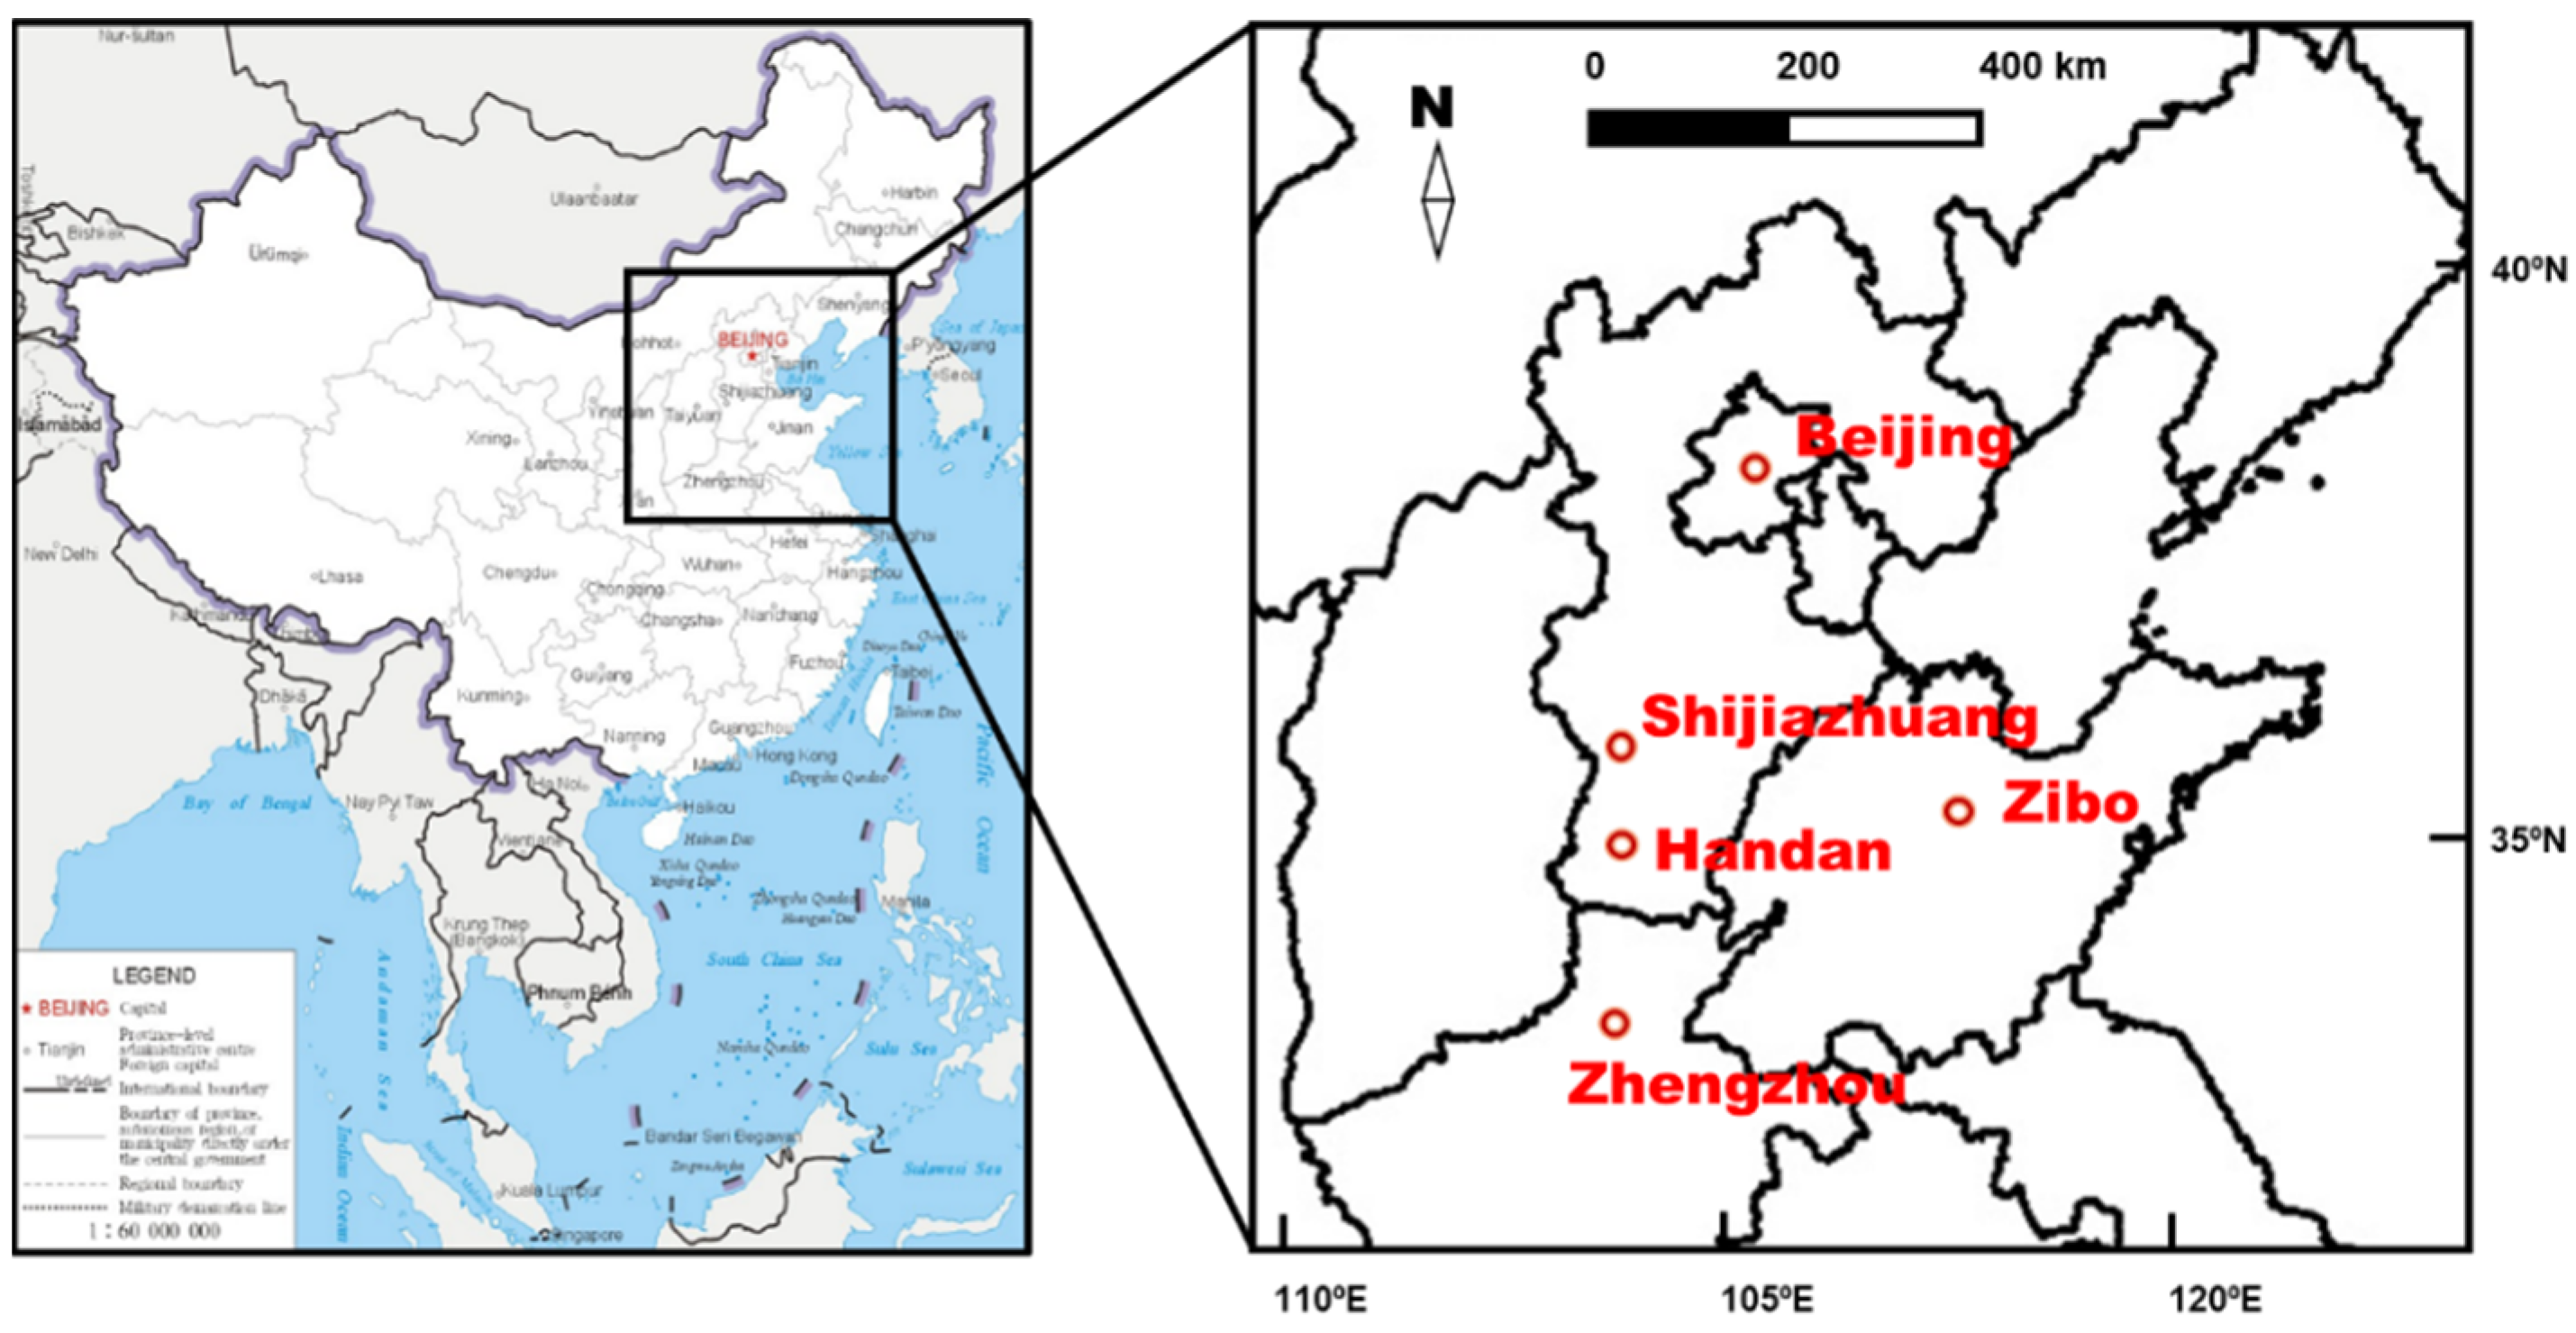
Six foxtail millet varieties were selected to evaluate the effects of five different locations and four fertilization treatments. These varieties were the dominant or common ones in the main planting areas of summer millet in China (Table 1).

2.2. Study Sites

The field experiments were conducted in five locations (as shown in Figure 1) in 2020~2021: Zhengzhou, Zibo, Shijiazhuang, and Handan where were the main summer millet-producing areas in China, and Beijing where was a general summer millet-producing area (Table 2). Previous crop was not found in Beijing, and that in the other 4 places was winter wheat in both years of the research. Soil samples were collected in 0~30 cm before fertilizers to detect the pH value on 1:1 water to soil suspension. After they were treated with 2.0 mol·L−1 potassium chloride (KCl), the contents of ammonium nitrogen (AN), nitrate-nitrogen (NN), available phosphorus (P), and available potassium (K) were detected by using an Alliance continuous flow analyzer. The collected soil samples were air-dried, ground, and sieved using a 2.0 mm mesh. The Olen method was employed to test the readily available phosphorus of the soil. K was extracted with 1.0 mol·L−1 NH4OAc and determined by a flame photometry.
The climatic conditions were obviously different in rainfall, sunshine hours, air temperature, and air humidity in these five places with fluctuations among years (Figure 2). For example, the rainfall and air humidity in Handan were the highest, and the sunshine hours in Zibo were significantly more than others in 2020.

2.3. Experimental Design and Filed Management

The four fertilization treatments were set and applied as a basal dressing: no fertilization (F0), low fertilization (N 75, P 20, and K 21 kg·ha−1, F1), medium fertilizer (N 150, P 41, and K 42 kg·ha−1, F2), and high fertilizer (N 300, P 82, and K 83 kg·ha−1, F3). N, P, and K fertilizers were derived from urea (46% N), calcium superphosphate (7% P) and potassium sulfate (41% K), respectively. The basis for setting the fertilization amount of F1, F2, and F3 was listed below: arranging data of 12 published research papers about foxtail millet fertilization, extracting and summarizing the best fertilization amount data of each paper, and obtaining the range and median of the best fertilization amount. The median was undertaken as the medium fertilization amount data (F2). Once range of the best fertilization amount was referred to, the fertilization amounts of F1 and F3 were 0.5 times and 2 times of F2, respectively.
A split-plot design was adopted in the experiment. Four fertilization treatments were undertaken as the main plots, with 18 split plots each, which were composed of 6 varieties with 3 repetitions. Plots at 10~15 m2 in size were used in five locations, with a row spacing of 0.40 m. At the 5~6 leaves stage of foxtail millet, inter-tillage was carried out to ensure 0.6 million plants per hectare.
The growth period was recorded, including the seedling emergence stage, booting stage, flowering stage, and mature stage. At flowering and maturity, 6 plants were randomly sampled from each plot and assessed for average height and hand harvesting. All plants were divided into leaves, stems, ears, dried, and weighed. At maturity, a quadrat was harvested to determine the yield of each plot, where each quadrat was manually harvested in an area of 3.96 m2, converted to yield per hectare. At the maturity stage, 10 spike were randomly collected from each plot to evaluate the average spike length and width. After natural air-drying, the average spike weight per plant was obtained by weighing, and after threshing, the average grain weight per spike was obtained.

2.4. Statistical Analysis

Combined ANOVA, biplots of AMMI model, and all the genetic and environmental variability parameters for each factor were calculated in Data Procession System V14.10 [25]. Least significance difference (LSD) at 0.05/0.01/0.001 probability were adopted to estimate the significance between the independent variables and dependent variables. Redundancy analysis (RDA) was performed to identify the edaphic factors that influenced yield using the statistical program Canoco ver. 5. Histogram, scatter plot, and Pearson correlation analysis were carried out in OriginPro ver. 2022 (OriginLab Corporation, Northampton, MA, USA).

3. Results

3.1. Mean Performance of Subjects and Analysis of Variance
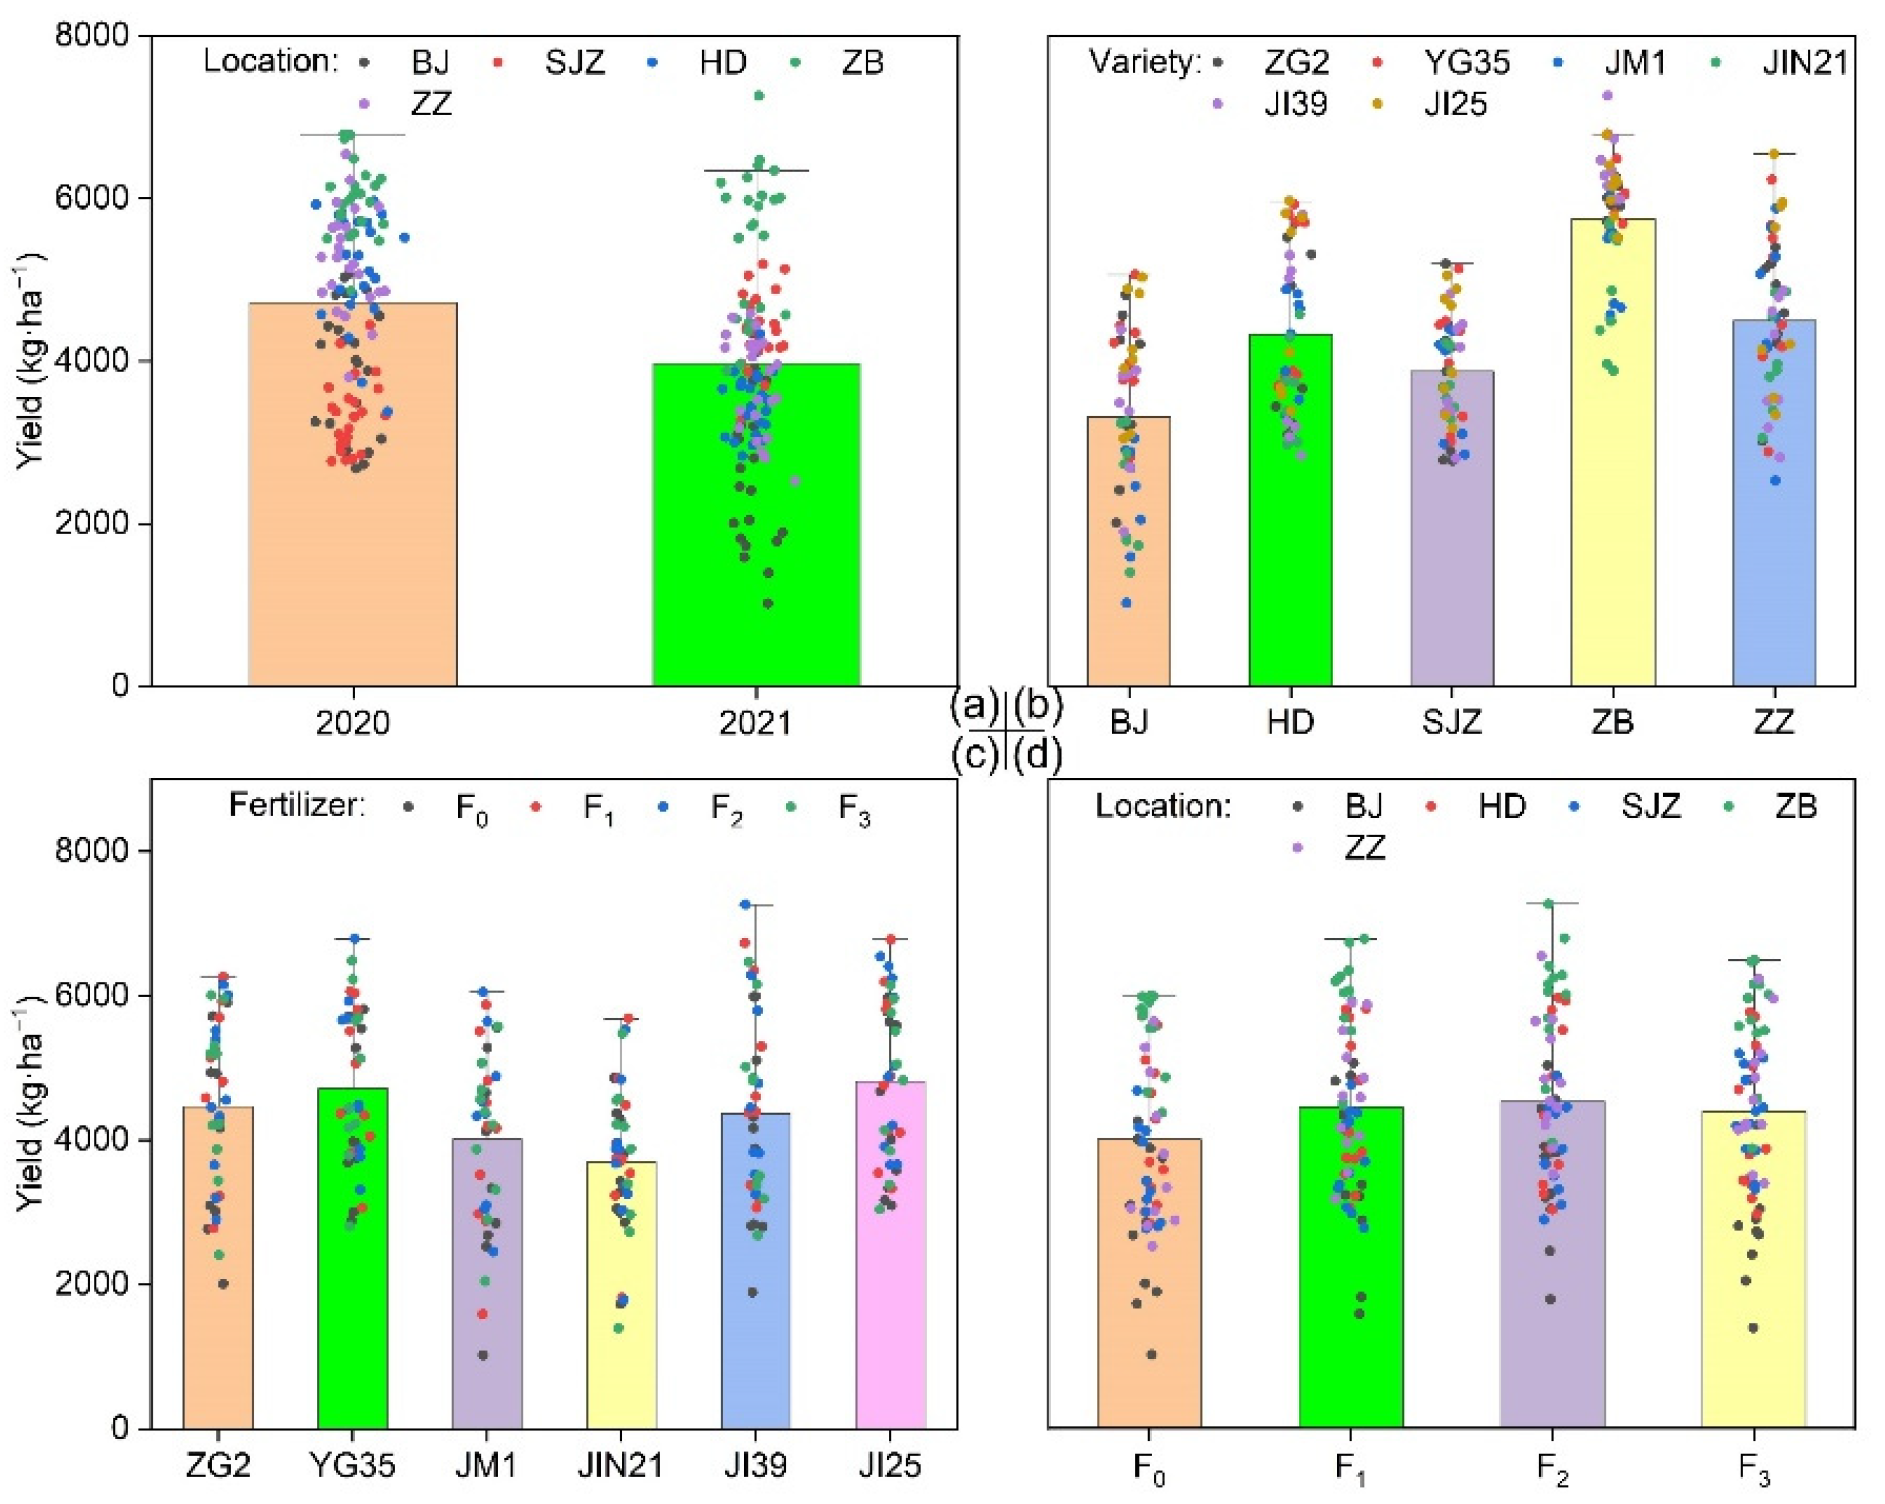
The combined ANOVA on all tested environments showed that all trait variations were very significant in location, variety, and fertilization, except height in fertilization (Table 3). Spike length (SL), spike width (SW), grain weight (GWE), and yield were mainly affected by location. The plant height and spike weight (SWE) were mainly affected by varieties and interaction of year and location, respectively.
All trait’ variations were very significant in location, variety, and fertilization, except dry matter accumulation after anthesis (DMAA) and dry matter harvest index (DMHI) in fertilization (Table 4). Matured straw (MST) and matured dry matter were mainly affected by year. Matured spike (MSP), flowered spike (FSP), and DMHI were mainly affected by location. Flowered straw (FST) and flowered dry matter (FDM) were mainly affected by variety. MST and FST were mainly affected by year. DMAA was mainly affected by interaction of year and location.
The combined ANOVA (Table 5) of all tested environments in two years indicated extremely significant yield variability. The mean sum of squares showed a significant variation among year, location, variety, fertilization, and their interaction, except Y–V interaction and V–F interaction. Grain yield displayed that 38.7% of the variations was contributed by location, whereas 33.6%, 7.1%, and 3.2% were contributed by year, variety, and fertilizer, respectively. Among all the interactions, the proportion of Y–L interaction was the highest.
The combined ANOVA for all the test locations revealed the presence of highly significant variation for yield (Table 6). The mean sum of squares showed a significant variation among year, variety, fertilizer, and Y–V interaction. In addition, interactions among the five locations are different. For example, the V–F interaction was highly significant in Beijing, Shijiazhuang, and Handan, indicating that the effects of fertilization and varieties were bidirectional and mutual, and yield could be further improved through appropriate cultivar selection and fertilization management. The V–F interaction was not significant in Zibo and Zhengzhou, suggesting the responses of all varieties to fertilization pattern were relatively consistent.

3.2. Mean Yield

Yield varied widely among genotypes, environments, and fertilization (Figure 3). The yield in 2020 (4725 kg·ha−1) was higher than that in 2021 (3969 kg·ha−1) (Figure 3a). The highest yield was observed in Zibo, followed by Zhengzhou and Handan, which were 5744 kg·ha−1, 4491 kg·ha−1, and 4326 kg·ha−1, respectively. The large variations in average yield among the varieties were observed in Beijing and Zhengzhou due to the larger range of scatter plots (Figure 3b). The average yields of varieties JI24 and YG35 were higher than those of other varieties across five locations. Additionally, the large variations in yield among the fertilizer treatments were observed in JM1 and JI39 due to the larger range of the scatter plots (Figure 3c). Compared with other fertilization treatments, the average yield of F2 treatment was the highest.

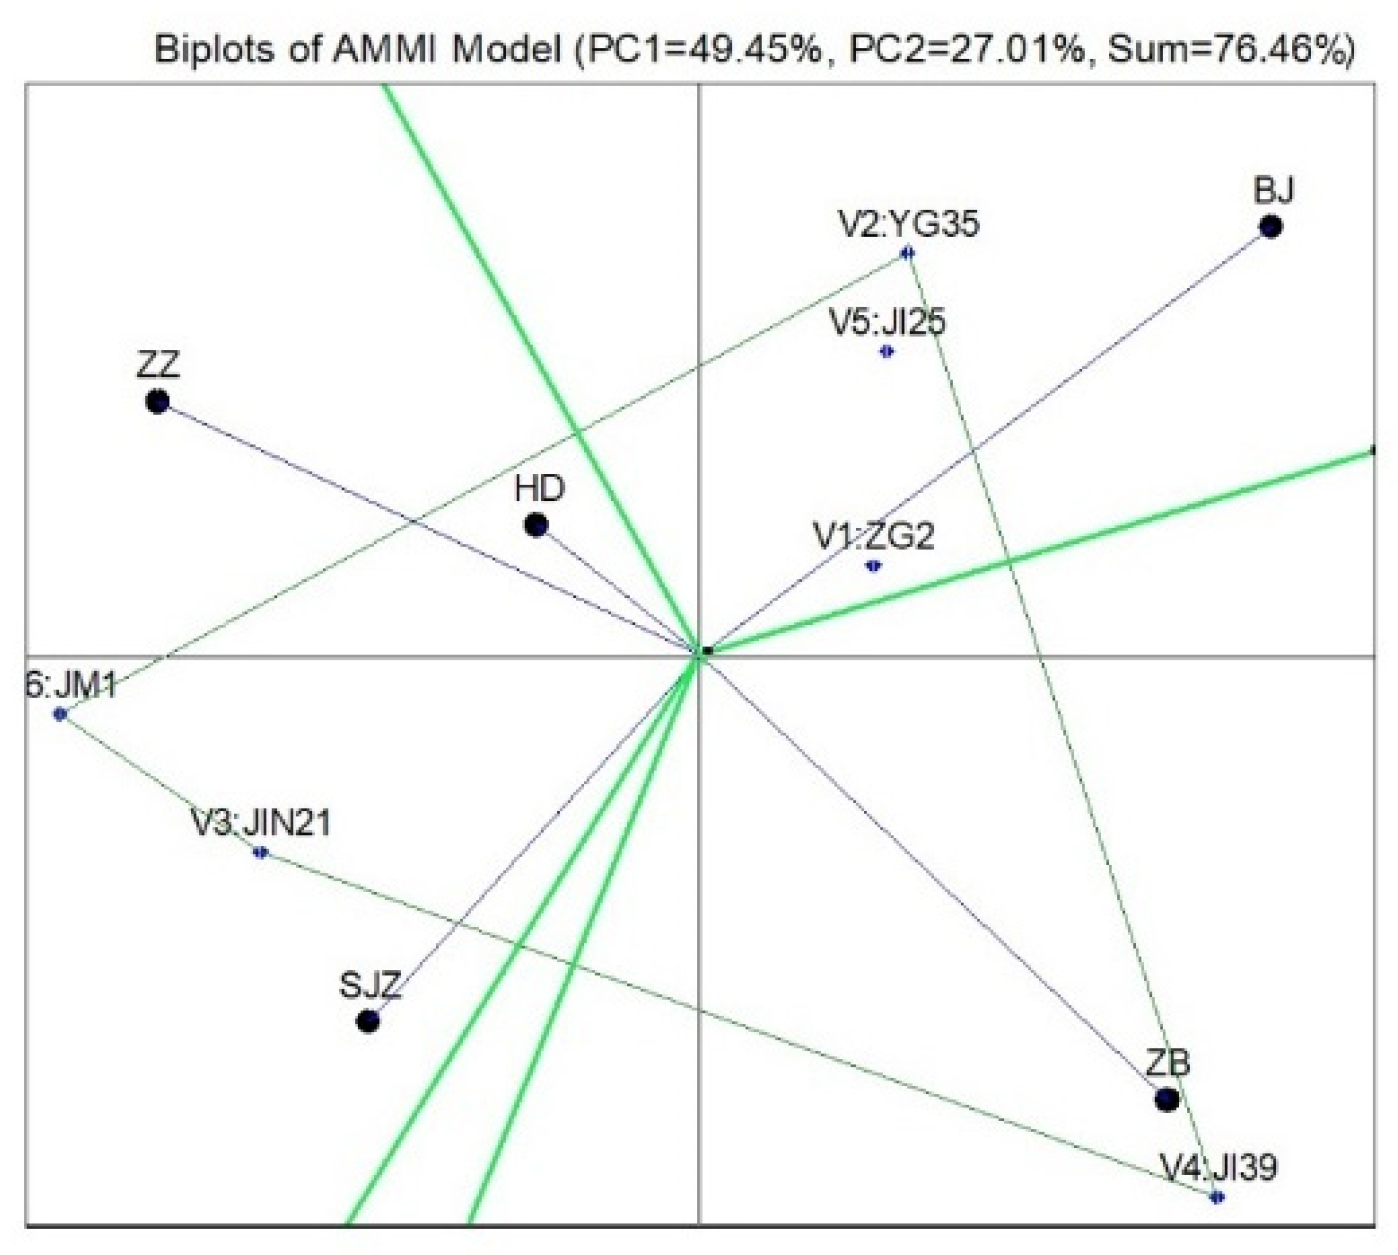
3.3. Variety and Its Adaptability

When the Shukla model was adopted to calculate the high-yield performance and stability of varieties, only three factors (years, locations, and varieties) were included, with the exclusion of fertilization treatment. Before the Shukla model was operated, the yield values per 4 fertilization patterns in the same repetition were averaged. Table 7 revealed that the JI25 showed the highest mean yield, followed by YG35, ZG2, JI39, JM1, and JIN21. The JM1 showed the largest Shukla’s stability variance, followed by JI39, JIN21, YG35, JI25, and ZG2. The mean yields of JI25 and YG35 were ranked forefront, with low Shukla’s stability variation and very good comprehensive evaluation. The mean yields of JIN21 and JM1 were ranked backward, with high Shukla’s stability variation and poor/general comprehensive evaluation.
AMMI biplot was utilized to visually represent the yield potential, comprising the variety, stability level, and association of test environments. Figure 4 depicts the relationship between summer millet genotypes and environments. The AMMI biplot was constructed between the first two principal components that explained 76.5% of V–L interaction, in which IPCA1 and IPCA2 contributed 49.5% and 27.0%, respectively. The perpendicular projection from the genotype to the environmental vector reflected the amount of interaction with the environment. Meanwhile, the length of the vector of an environment from the biplot origin meant that it was proportional to the amount of L–V interaction. Apart from that, strong interactive forces were elicited by the environments with longer vectors, whereas weak interactive forces were triggered by those with shorter vectors. With respect to the environment in Beijing, the strongest interactive forces were witnessed, followed by Zibo and Zhengzhou. On the contrary, the weakest interactive forces were observed in Handan. Since the clustered genotypes behaved similarly across environments, almost analogous yield performances were presented amid the variety YG35, JI25, and ZG2. Additionally, given that the genotype and the environment with markers in the same direction from the origin presented a positive interaction, a negative and a small interaction was displayed in those with makers in opposite directions and at right angles individually. The genotype JI39 presented a positive L–V interaction with environment in Zibo, and genotypes YG35, JG25, and ZG2 had the positive L–V interactions with environment in Beijing. Similarly, genotypes ZG2 and JIN21 displayed negative L–V interactions with Beijing and Shijiazhuang, respectively. Albeit dispersion of varieties in biplot indicated that they were different to diverse locations, an acute angle between Handan and Zibo vectors revealed a positive correlation, while the obtuse or nearly right angle of Beijing with Zhengzhou, Handan, Shijiazhuang, and Zibo, and Zhengzhou to Zibo suggested no correlation (Figure 4).
The varieties farthest from each direction were connected to green straight lines, such as JI39, JM1, YG35, and JIN21, to form a quadrilateral and four vertical lines (green dotted lines) on the four sides through the center, dividing the diagram into four sectors and the environment into three sectors. Zhengzhou, Handan, and Shijiazhuang were in a group, while Zibo and Beijing were in the other group. The varieties located at the top corner of the quadrilateral were with the highest yields in each environment in the sector. For example, YG35 witnessed the highest yield in Beijing, while ZG2 showed the lowest yield.

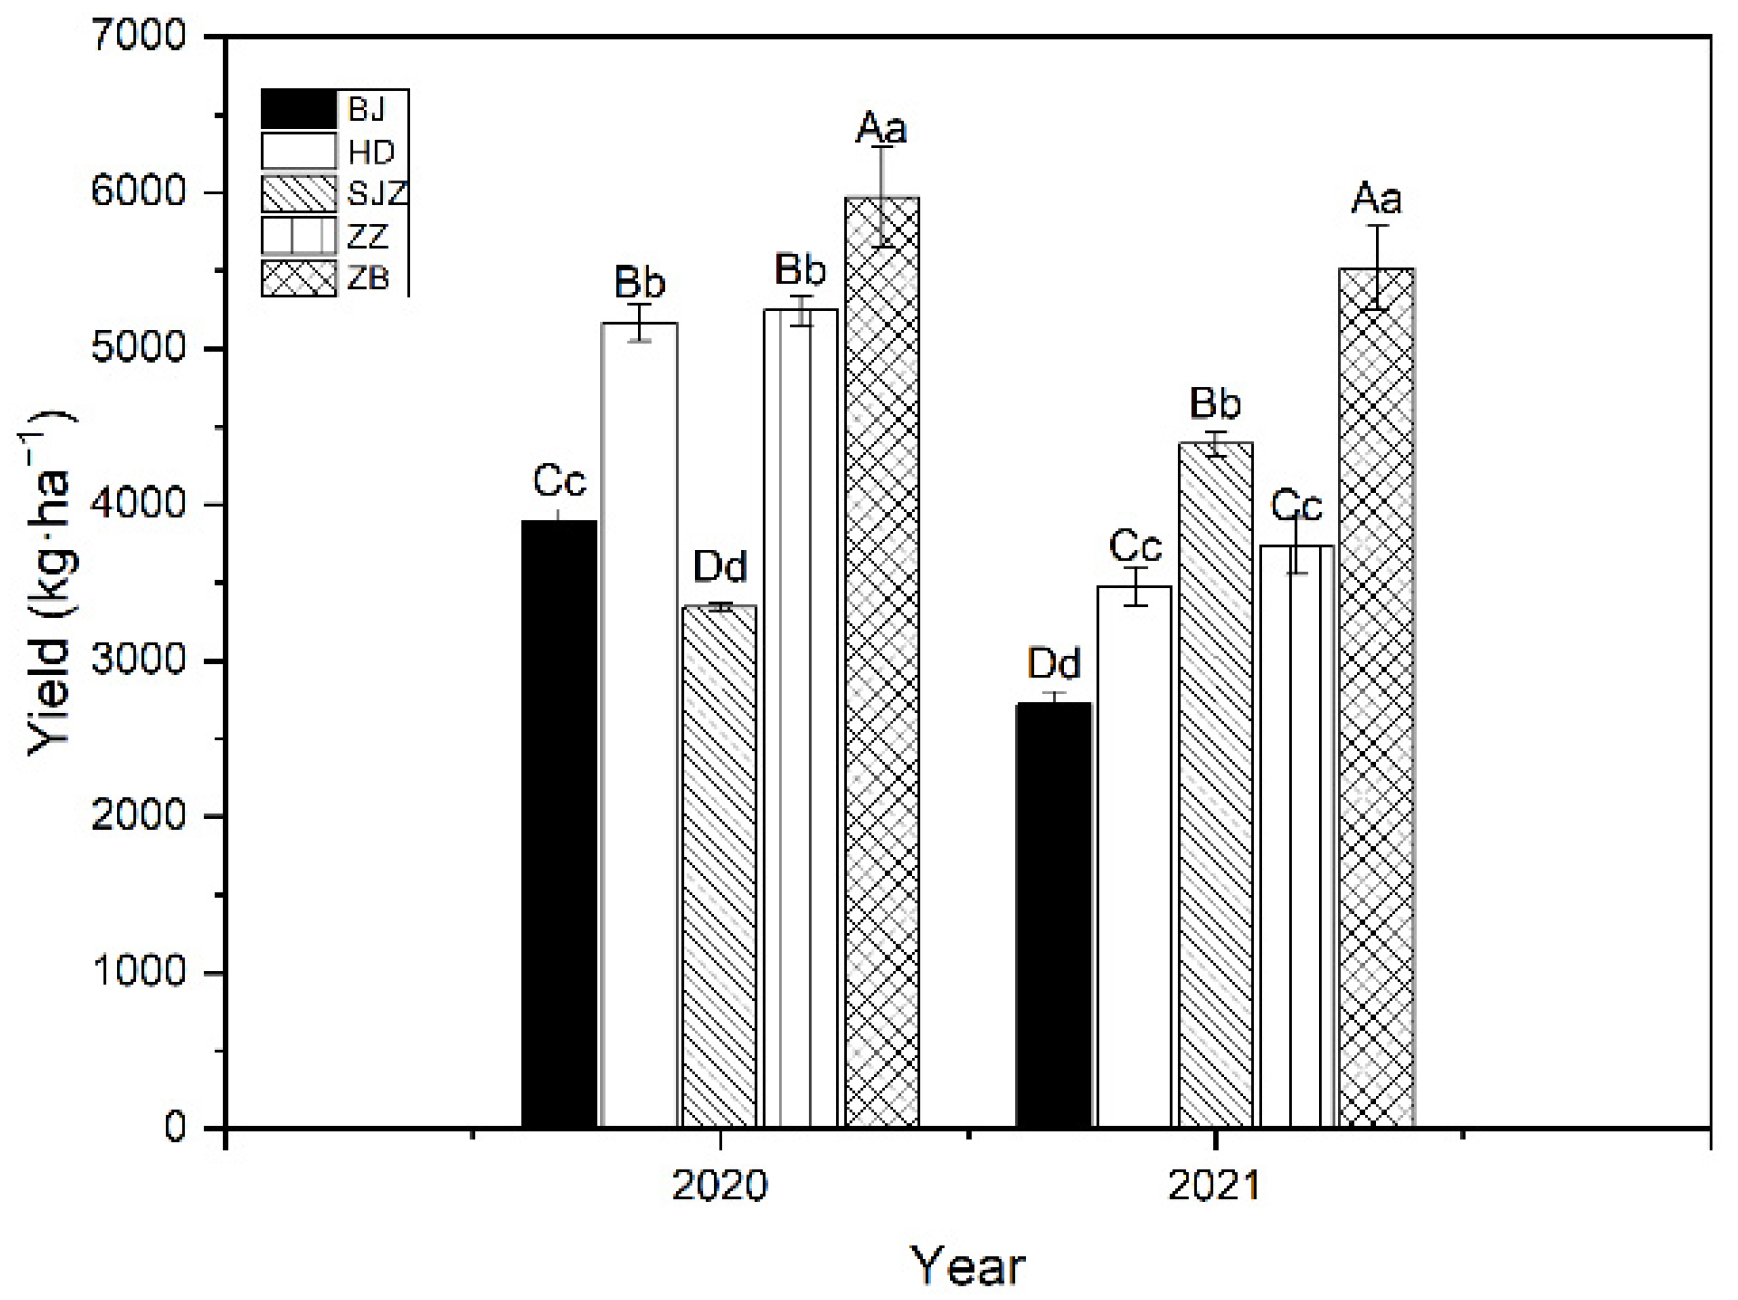
3.4. Location and Year
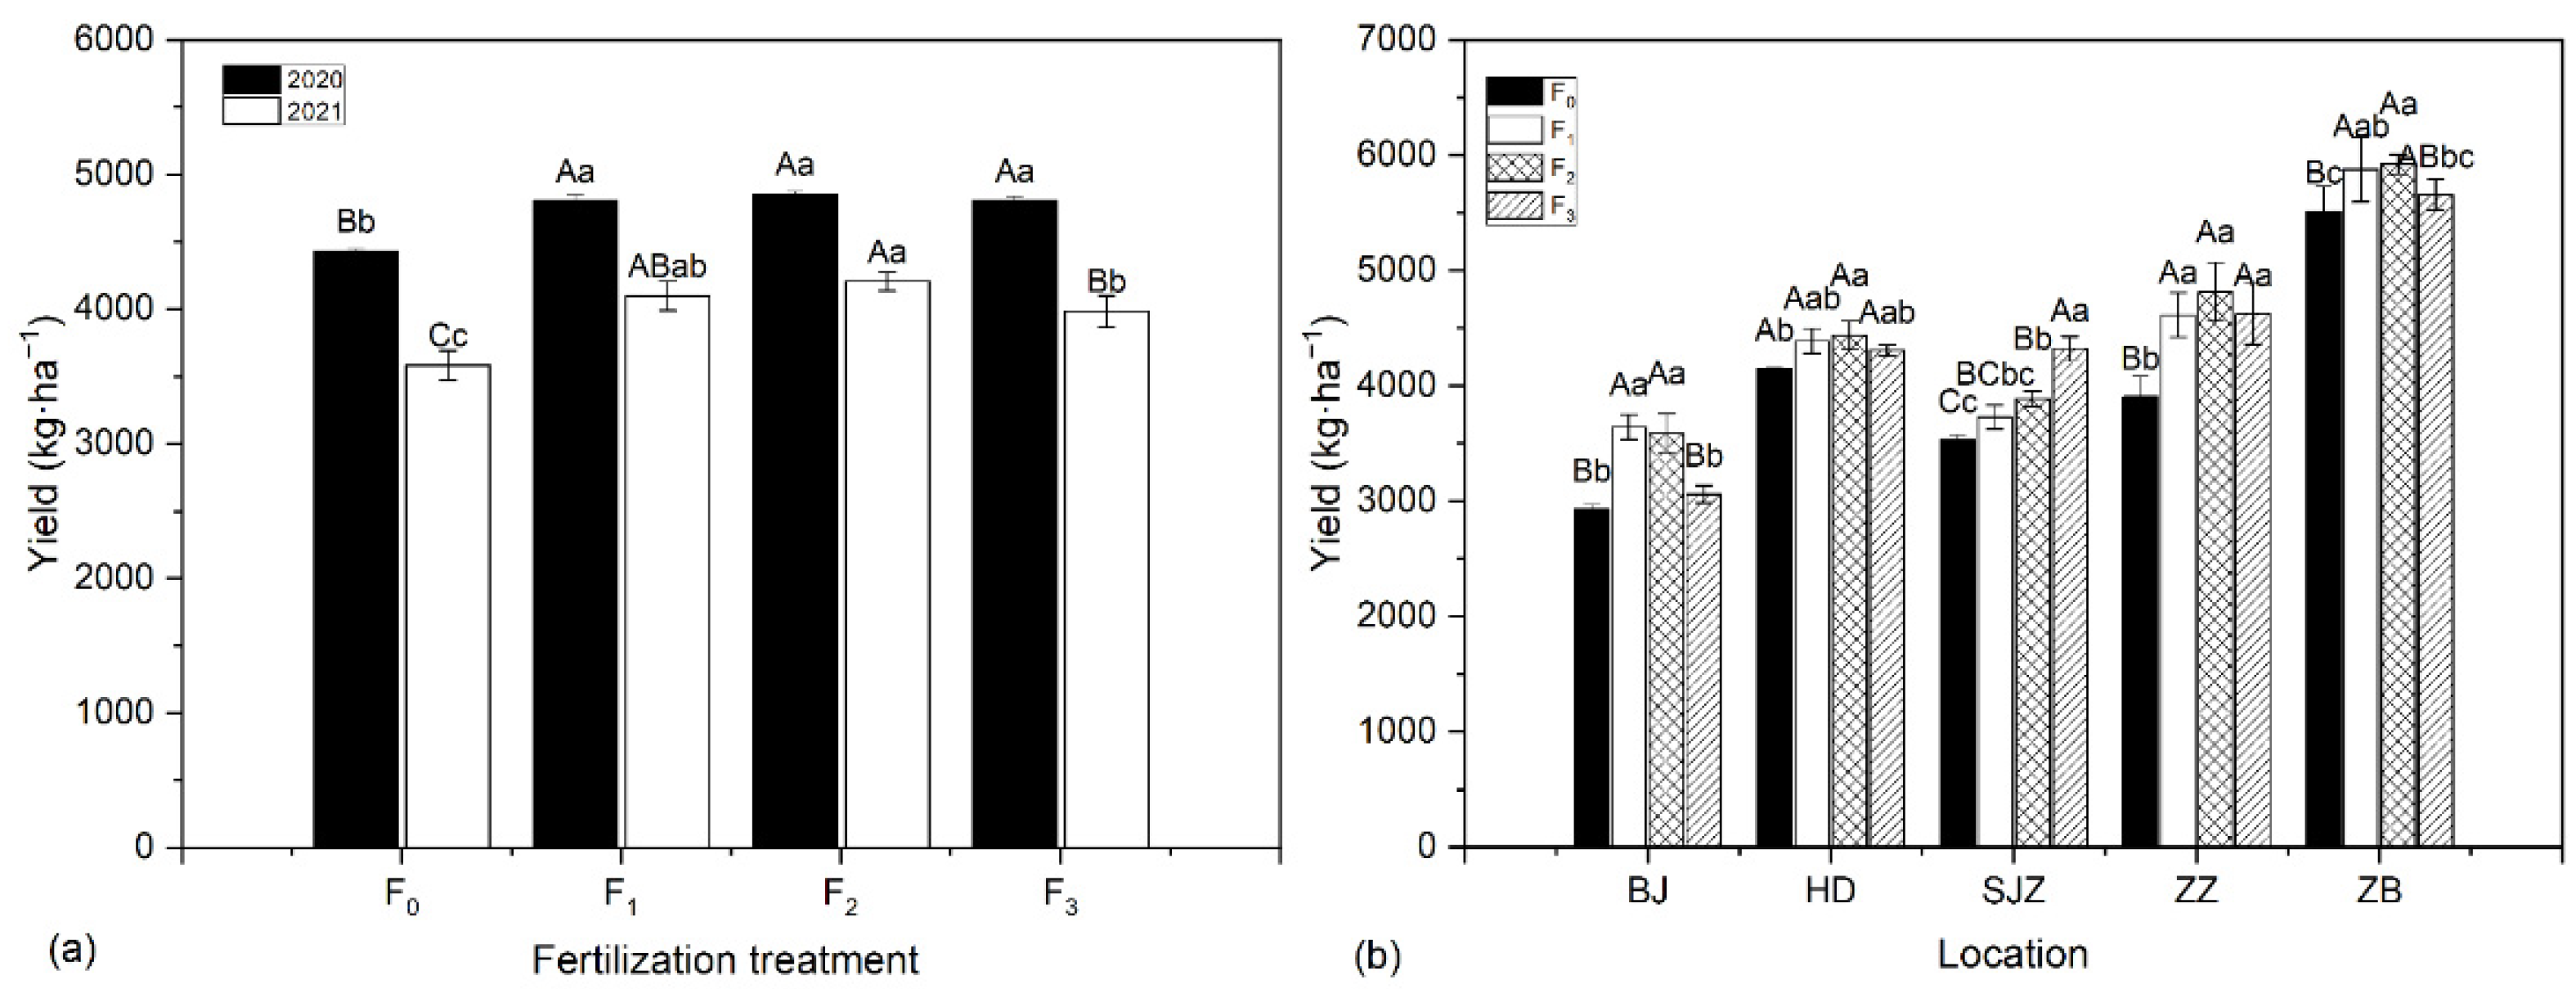
Yields varied widely among year and location (Figure 5). A higher mean yield in 2020 (3347~5970 kg·ha−1) was observed than that in 2021 (2721~5518 kg·ha−1). The average yield of five locations decreased in 2020~2021, except Shijiazhuang; specifically, the highest yield was achieved in two years in Zibo, and yields at other locations (e.g., Handan, Zhengzhou, and Shijiazhuang) varied greatly from year to year.
Both year and location were environmental factors, and they showed strong interaction (Table 8). Therefore, the year and location were integrated into a comprehensive environmental factor (or CE, for short), then an analysis of variance for CE and varieties was carried out. The effect of CE and the effect of variety had a very significant impact on yield. The yield of JG39 in Zibo in 2021 was the highest, reaching 6518 kg·ha−1, which was 41.3% higher than the lowest yield at the same place in the same year (JM1 4612 kg·ha−1). The current results clearly indicated that Zibo provided optimum environmental conditions for the cultivation of summer millet, and the average yield of summer millet in Zibo was 27.9~73.6% higher than that in the other four locations. Grain yield displayed that 77.6% of the variation was contributed by year and location, whereas 20.0% of that was contributed by variety.

3.5. Fertilization

Proper nutrient management was very important to improve crop yields and maintain a balanced farmland system. Fertilizer improved grain yields in the present study, and the response of foxtail millet yield to fertilizer level for an individual variety grown at a particular location was mostly curvilinear (Figure 6). When only considering the effects of fertilization treatment and year, the mean yield increased first and then decreased from F0 to F3, and the mean yield of F2 treatment was the highest, and the response trends of yield to fertilization were similar in 2020 and 2021, and the overall yield in 2021 was significantly lower than that in 2020 (Figure 6a). When only considering the effects of fertilization treatment and location, the effects of fertilization on yield were changeable due to different locations. Specifically, yield increased first and then decreased curvilinearly from F0 to F3 in Beijing, Handan, Zibo, and Zhengzhou. However, the yield increased nearly linearly from F0 to F3 in Shijiazhuang. F2 treatment in Handan, Zibo, and Zhengzhou showed the highest yield, F1 treatment in Beijing, and F3 treatment in Shijiazhuang showed the highest yields (Figure 6b).

3.6. RDA Analysis of Yield vs. Climate and Soil Factors

From the date of seed sowing to the end of maturity, every 15 days was marked as a growth stage of foxtail millet, and there were seven stages in total. The maximum, minimum, mean, or sum of air temperature, rainfall, humidity, and sunshine hours in each stage was obtained, and 77 meteorological factors were finally gathered. A total of 25 important meteorological factors were clarified after the correlation coefficient between yield and 77 meteorological factors, and their significant difference was compared. The clarified factors, along with five soil factors and yield, were analyzed based on distance redundancy analysis (Figure 7). The RDA results showed that solely two RDA components explained more than 66.1% of the yield variance, while more than 63.0% of the variance was clustered in the first factor. In addition, the correlation between five soil nutrient factors and yield was different. Soil available phosphorus and soil pH value were significantly negatively correlated with yield, and soil K, AN, and NN were slightly negatively correlated with the yield. In general, the correlation coefficient between yield and climate factors was higher than that with soil nutrients. Yield showed a strong positive correlation with 5Hn, 6Tx, 3St, 6St, 4Hn, 5H, 4T, 6T, 3S, etc., and a strong negative correlation with 2Rx, 6Rx, 3Rx, 3Tn, 6Rt, etc. Zibo, with the highest yield, showed a strong positive correlation with 4Hn, 5H, 5Hx, 6S, 5Rt, 2St, 5Hn, and 4H; while Beijing, with the lowest yield, showed a strong negative correlation with 3Tx, 2T, and 6Tx.

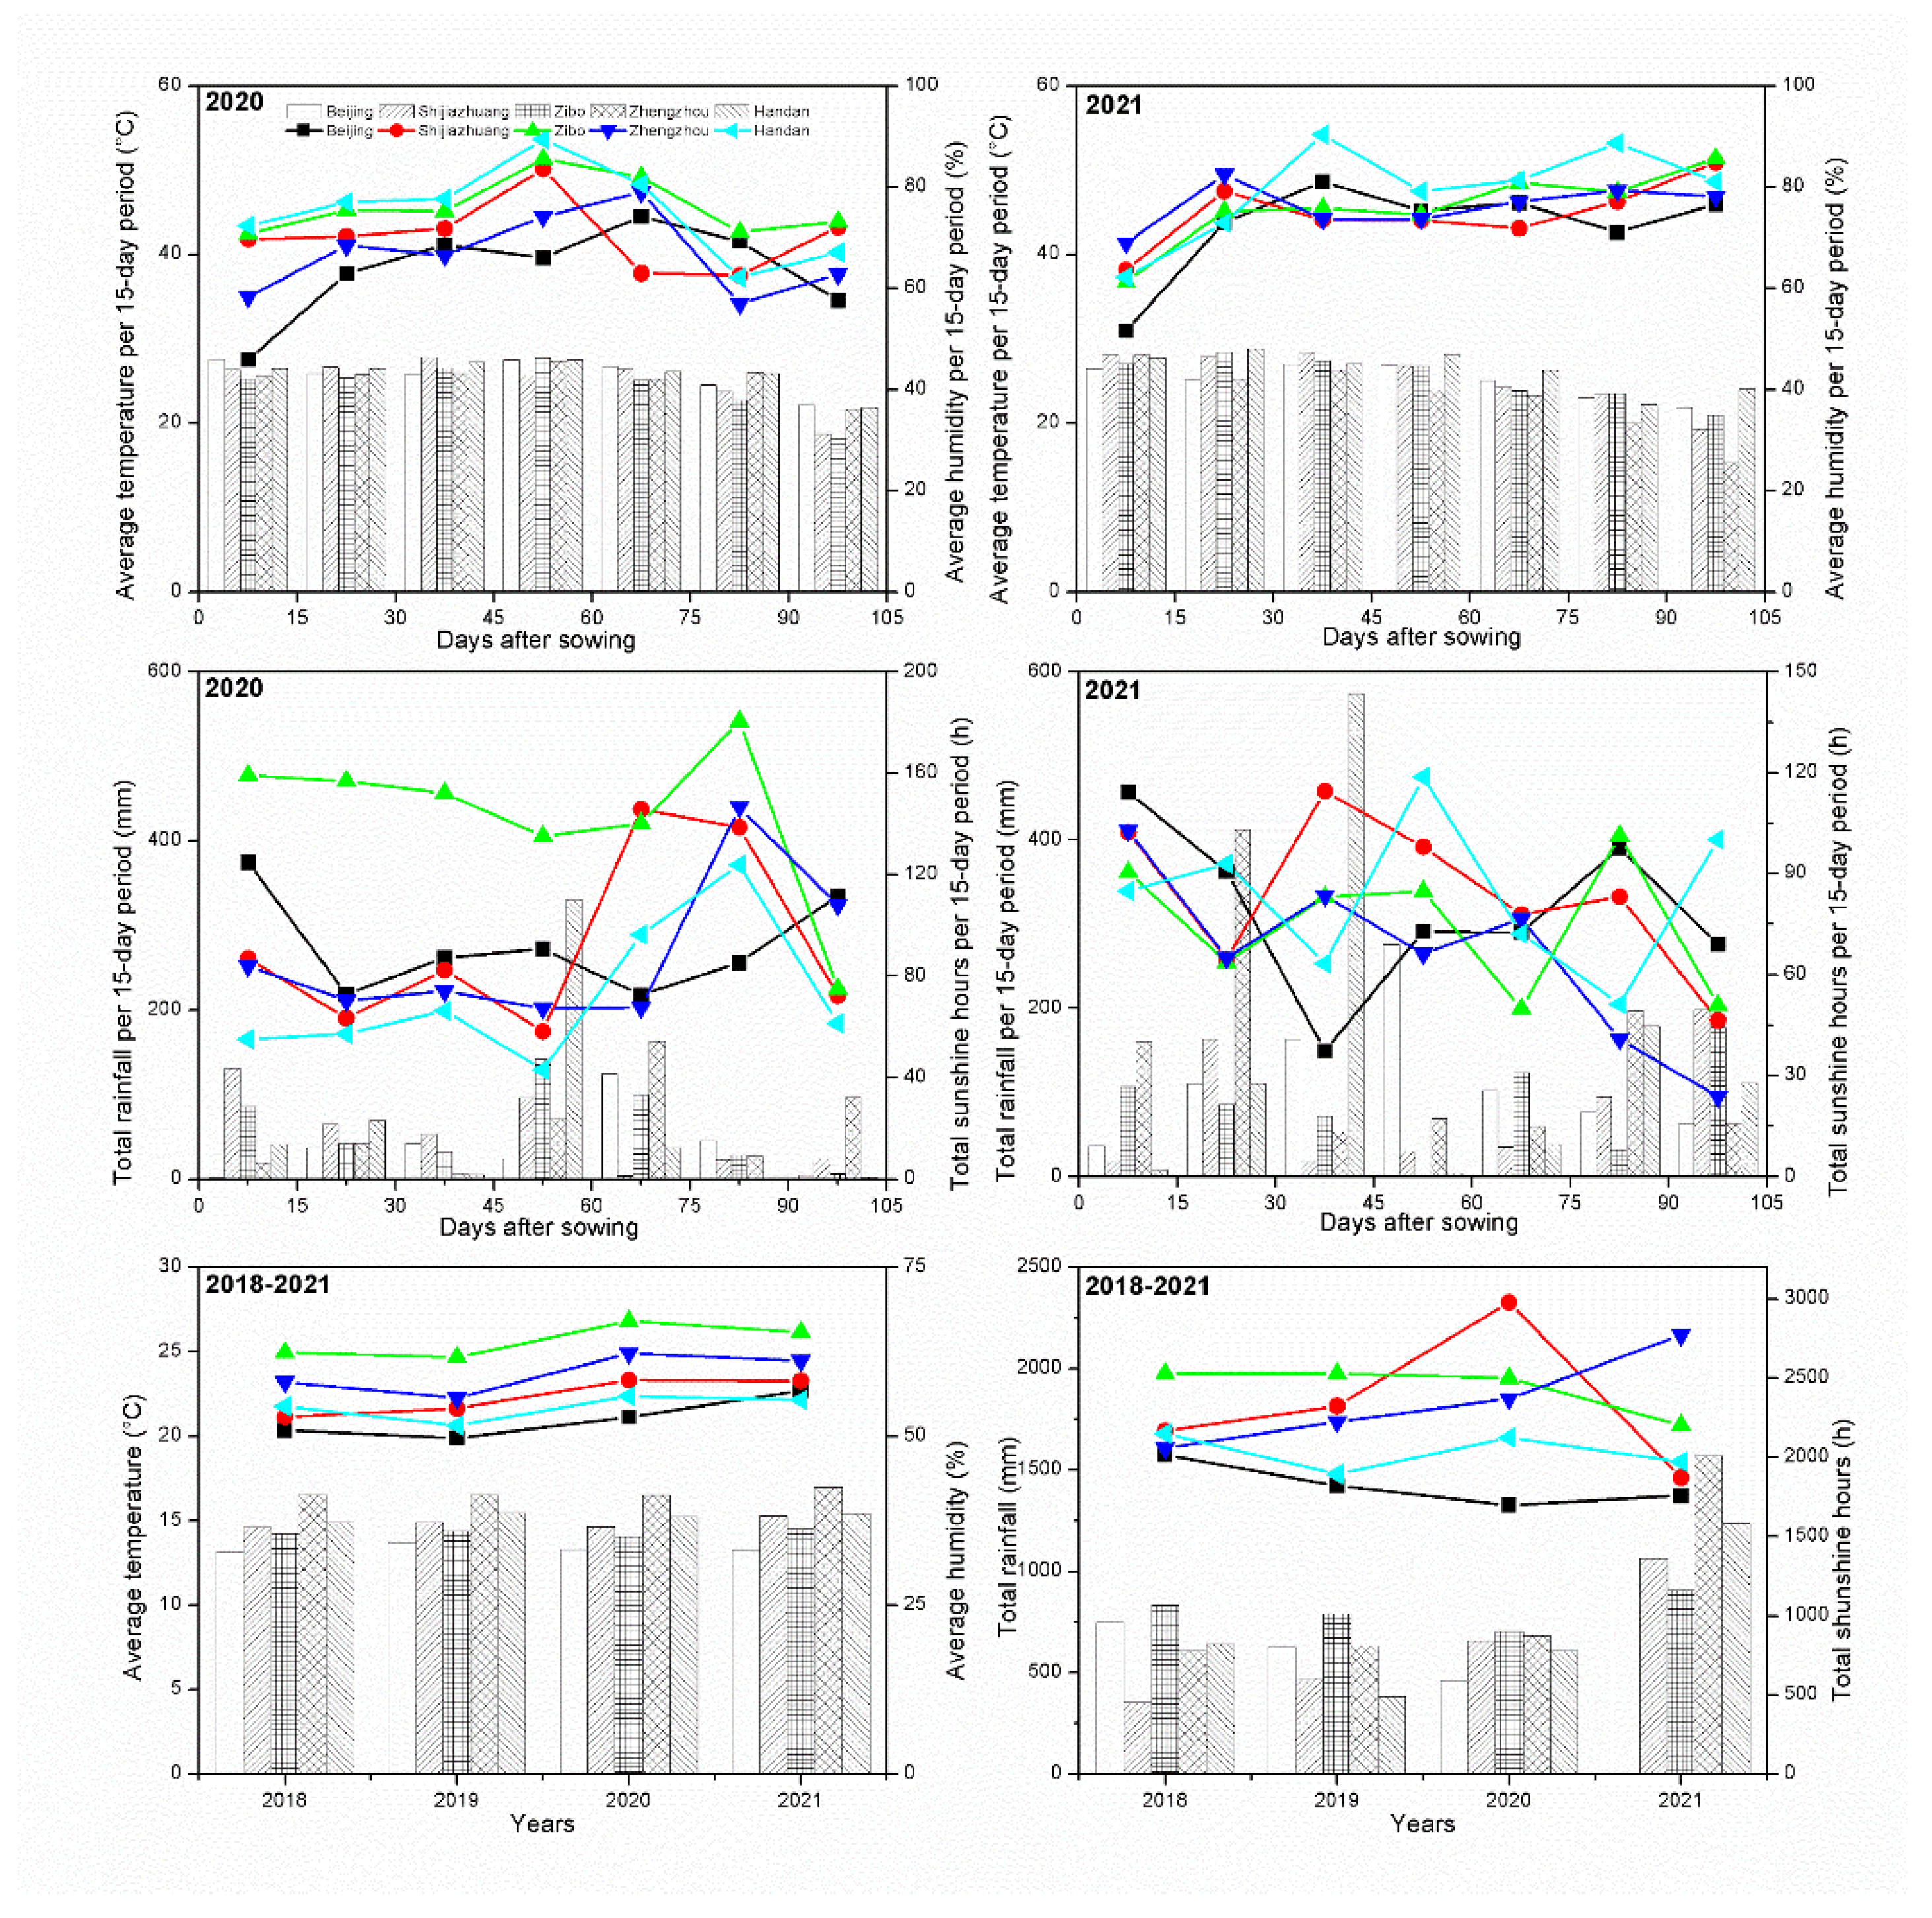
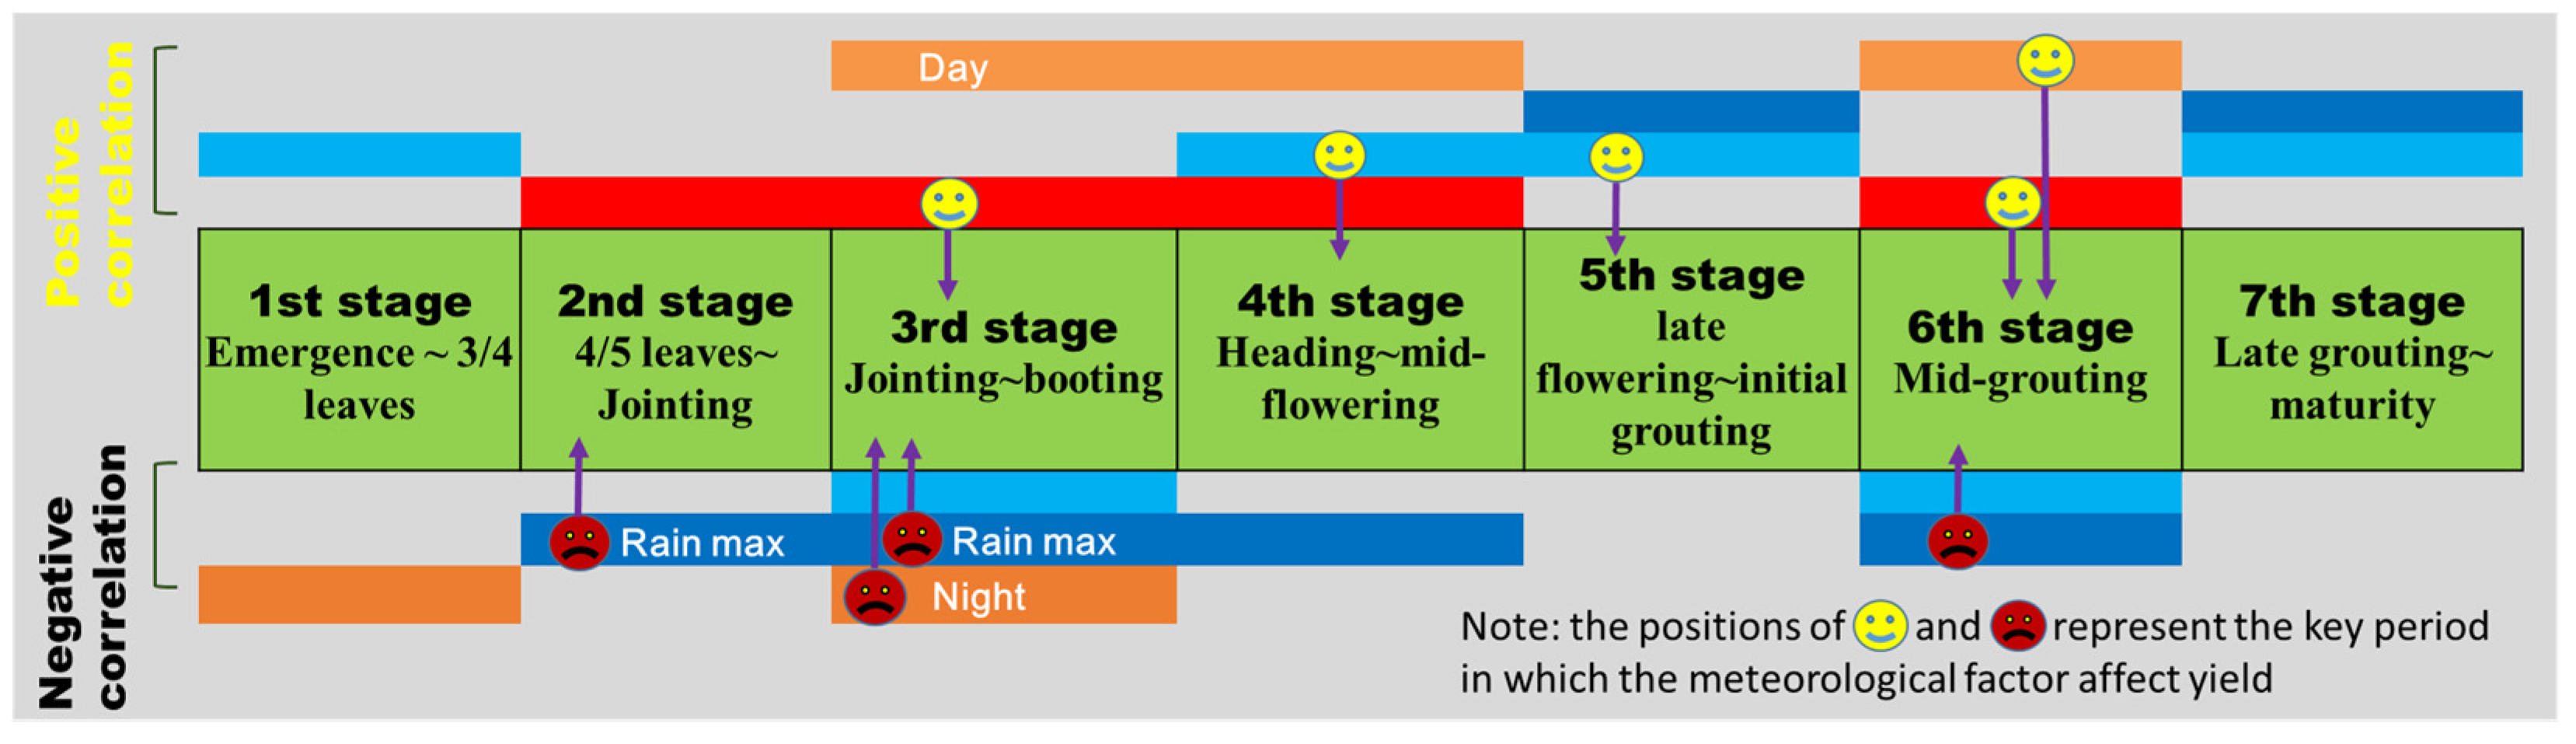
3.7. Time Sequence of Meteorological Factors Affecting Summer Millet Growth

According to RDA results of yield, climate, and soil factors (3.6), a picture (Figure 8) in which the key meteorological factors affected summer millet yield was made. The conditions favorable to grain yield are described below. During the period from 4/5 leaves to the mid-flowering stage and mid-grouting stage, sufficient sunshine would promote the accumulation of photosynthetic products. Apart from that, the high temperature at jointing~booting and mid-grouting stage was beneficial to growing, heading, and flowering of crops, and high humidity at emergence~3/4 leaves stage, heading~maturity except mid-grouting could help to protect seedlings from drought stress and protect pollen and stigma from a high-temperature burn. Ample rainfall at flowering~maturity except mid-grouting was conducive to nutrient absorption and substance assimilation.
The conditions unfavorable to grain yield are described below. During the period from seed emergence to 3/4 leaves, it was a daunting task for young seedlings to withstand high air temperature. From the 4/5 leaf stage to jointing, however, it would not only weaken the photosynthesis of seedlings but also lead to unstable rooting and lodging of plants if a single rainfall was excessive. Moreover, during jointing and booting, high temperature at night could cause stem cells to elongate faster and thinner, and the plants were not resistant to lodging, susceptible to late spring coldness, and thus the spike differentiation time was shortened. During the mid-grouting period, excessive rainfall would weaken the accumulation of photosynthetic products.

4. Discussion

4.1. Location-Variety Interaction and Variety Selection

The variety effect was only next to environment in the contribution to the yield, and significant genetic variations among the varieties and significant V–L interaction were popular [20,21], indicating it was of significance to select a suitable variety in a specific environment. Some extreme factors in growing environments (e.g., high temperatures that surpassed historical records at any time) could affect the growth and development of foxtail millet greatly in summer seasons, so resistance to high temperature was very important. In our other studies, JI25 and YG35 showed stronger resistance to high temperature than the other four varieties. When the night temperature increased by 2 °C in an artificial climate box, the booting days of ZG2, JG39, JM1, and JIN21 were significantly reduced, and the spike weight decreased significantly, while the booting days of JI25 and YG35 were not significantly shortened and the spike weight decreased slightly (unpublished). Because the growth period of summer millet spanned all summer, identifying high-yielding cultivars with stable booting days was one of the best means to tackle unpredictable growing conditions.
Varieties with yield stability were not necessarily high-yielding. If any variety performed well in a specific environment, it could be recommended for that specific environment to maximize its genotypic potential. Varieties with lower Shukla’s variance values and higher mean values indicated stable responsiveness to the environment and higher mean performance, whereas those with high Shukla’s variance values and low mean values suggested high responsiveness to the environment and below-average performance. These varieties with high Shukla’s variance values and low mean values would not be recommended for general cultivation but showed suitable discrimination of environment because of being highly sensitive. JI39, with high Shukla’s variance and high mean values of yield, was very productive under favorable conditions, and thus JI39 could be recommended for cultivation in places with fewer sunshine hours and more cloudy days. In areas with overproduction, it should focus on the stability of varieties rather than high yield. Farmers required high-yield varieties that were particularly suitable for the area with suitable environmental conditions. However, under general conditions, breeders and sellers often prefer a variety to be relatively stable in various environments, and its yield is not lower than the average yield. Such a variety should have a higher yield and relative degree of stability.

4.2. Key Environment Factors Affecting Yield

In general, summer millet in rain-fed agroecosystems completes its life cycle by being exposed to multiple and unpredictable abiotic stresses (e.g., high rainfall conditions and high temperatures within the same planting season). It was difficult to know why Zibo could become a suitable environment simply based on Figure 2 since the meteorological factors were conventional, and only the average or sum of meteorological factors were displayed. The effects of average temperature, rainfall, humidity, and light on crop yield have been studied many times [20,26,27]. However, it was difficult to find out which meteorological factors really affected the development of crops if no more detailed climate discrimination and smaller date intervals were provided to interpret the influence of meteorological factors more comprehensively and accurately on crop growth or yield. Therefore, when these were added in this study, yield showed a different correlation with temperature on 31~45 days (3T).
Previous studies have shown that increased temperature reduces the yield of the crop. Heat stress after heading significantly reduced the kernel weight, seed setting rate, and grains per spike of malt barley [28]. Paddy yields of six common rice varieties from Arkansas were reduced by 6.2% after the temperature increased by 1 °C in the average growing season temperature [29]. Studies on foxtail millet have shown that the appropriate average temperature was 19.3~22.7 °C from emergence to jointing. When the temperature increased by 1 °C, the interval days would be shortened by about 3 days [30]. A study in rice cropping systems showed that nighttime warming of less than 1 °C shortened the length of the crop’s pre-flowering phase and prolonged the length of the post-flowering phase, resulting in a great reduction in the length of the crop [31]. In the current study, air temperature (especially minimum temperature) from jointing to booting was negatively associated with days to booting and flowering, which proved that the increased night temperature led to the early termination of booting and the beginning of flowering. The negative correlation between temperature and grain spike width increased the reliability concluded in this study. In other words, the shortened interval days caused by temperature increase reduced the time of young panicle differentiation, finally resulting in decline of the grain yield.
Excessive rainfall could positively or negatively affect crop yields and vary by region and season. An experiment in Scotland found a strong positive relationship between growing season rainfall and simulated yield and underscored that rainfall was more essential than the temperature for spring barley production [32]. One of the reasons explaining the increased grain yield with rainfall was that the lower number of females/inflorescence was significantly positively correlated with the average monthly rainfall during the first three months of the corresponding inflorescence opening [33]. Excessive rainfall could significantly reduce the maize yield in cool regions and in poorly drained soils. This yield loss was exacerbated under high preseason soil water storage [34]. This study revealed that the damage of extreme rainfall at the seedling~booting stage is mainly sourced from excess water rather than total rainfall. Foxtail millet was weak and thin at the seedling stage, with difficulty withstanding the impact of high-intensity rainfall. Poor soil drainage leading to deficit oxygen, instability, and difficulty in nutrients absorbing of root also aggravated the plight of crops.
The interception of irradiation by cloud cover associated with rainfall events has become an increasingly important limiting factor in crop production in China [35]. This study found that there was a positive correlation between sunlight time and yield due to different growth periods, and the effects of sunshine hours on yield mainly occurred at the late jointing to booting stage. The main reason for yield loss caused by shading was the reduction in grain number, and the yield declines of various varieties were different [36].

4.3. Fertilization in Foxtail Millet

It was believed that when the amount of fertilization exceeded the threshold, the yield would no longer increase significantly, and many adverse environmental events may occur, such as changes in soil pH, accumulation of soil nitrogen, and pollution of groundwater [12]. In this study, yields in Beijing, Zibo, and Zhengzhou increased first and then decreased curvilinearly with the increase in fertilization amount, so the F1 pattern was recommended as a reasonable fertilization amount with a high yield; In Shijiazhuang, the yield increased nearly linearly with the increase in fertilization amount, so F3 pattern was recommended, and in Handan, the yield was hardly affected by the fertilization amount, so F1 pattern was recommended.
Several factors should be considered to improve fertilization efficiency. Fertilization could interact with varieties and location, so it was better to understand the effect of related factors to optimize the fertilization protocol. Variety adaptability difference was one of the main reasons that affected the fertilization efficiency. Fertilization efficiency in Shijiazhuang and Zhengzhou was much higher than that of variety, and that in Zhengzhou and Handan was the opposite. The large variation of variety performance due to adaptability difference increased the interpretation of variety’s effect on yield while weakening the interpretation of the fertilization effect in both Zhengzhou and Handan. In this study, the yield among the fertilizer treatments showed a great difference in JM1 and JI39 compared to other varieties, indicating that it was feasible to improve the yield of the two varieties through fertilization measures.
Soil nutrient difference was another main reason that affected fertilization efficiency. Shijiazhuang showed low soil fertility, which was easily affected by fertilization. The negative correlation between soil available phosphorus and grain yield was stronger than that of other soil nutrients. Because the soil phosphorus content in the test site was high, and the yield of summer millet did not increase significantly after fertilization. Similarly, there was a negative correlation between soil nitrate-nitrogen and yield, which was due to the excessive accumulation of soil nitrate-nitrogen caused by the abuse of nitrogen fertilizer. The above results showed that in the summer valley area, the input of phosphorus fertilizer and nitrogen fertilizer should be reduced to ensure that the fertilizer was not wasted and the grain yield was considerable.
Climate was the third reason that affected fertilization efficiency. Compared with the situation in 2020, the yield in Beijing in 2021 dropped significantly due to increased rainfall, lower temperature, and insufficient light time during the critical periods (jointing~booting stages), which greatly affected the yield and fertilizer utilization. It was found in this study that the yield was strongly affected by rainfall in the early growth stages because the surface runoff and leaching weakened the fertilization effect.

5. Conclusions

The large sum of squares and the significant impact of V–L interaction confirmed the role of the environment in the performance of varieties. The mean sum of squares showed significant variation among year, location, variety, fertilization, and their interaction, except for Y–V interaction and V–F interaction. Grain yield suggested that the location and year contributed up to 38.7% and 33.6% of the variation, respectively, whereas only 7.1% and 3.2% of the variation existed in variety and fertilizer, respectively. JI25 was widely adapted, and its yields was stable and the highest for two years. AMMI and Shukla analysis provided similar results, identifying the best matching varieties and environments. Excessive single rainfall or total rainfall and air temperature (especially minimum temperature) were significantly associated with the production of summer millet.

Author Contributions

Field experiment, data processing, and writing, J.C. and Y.Z.; Field experiment and data collection, M.L., N.X., S.G., Y.L., J.L., Z.W., F.G. and P.Y.; Design, analysis, writing and revision, X.X. and S.L. All authors have read and agreed to the published version of the manuscript.

Funding

This research is supported by the National Key R&D Program of China (2019YFD1001700), HAAFS Basic Science and Technology Contract Project (HBNKY-BGZ-02), China Agriculture Research System (CARS-06-14.5-A23), and Technical System of Coarse Cereals and Bean Industry in Hebei Province (HBCT2018070205).

Data Availability Statement

Not applicable.

Acknowledgments

This research was accomplished by many staffs in the institutions above, only part of them were listed as the authors. The authors thank Guiying Li, Shutao Dai, Fajiang Gong, Xiaorui Fu and Huike Liu for their assistance with data collection, Xianmin Diao, Yanan Guan and Xiaojiao Chai for foxtail millet seeds, Guiying Li for helpful insights and discussion of the literature.

Conflicts of Interest

The authors declare no conflict of interest.

References

  1. Sharma, N.; Niranjan, K. Foxtail millet: Properties, processing, health benefits, and uses. Food Rev. Int. 2018, 34, 329–363. [Google Scholar] [CrossRef]
  2. Patimah, S.; Arundhana, A.I.; Mursaha, A.; Syam, A. Development of foxtail millet and flying fish flour-based cookies as functional food. Curr. Res. Nutr. Food Sci. 2019, 7, 504–516. [Google Scholar] [CrossRef]
  3. Rodge, S.M.; Bobade, H.P. Convenience foods from foxtail millet and garden cress seed. Int. J. Agric. Eng. 2018, 11, 164–168. [Google Scholar] [CrossRef]
  4. Zhao, W.; Fan, Z. Glycemic response of foxtail millet food. J. Chin. Cereal Oils Assoc. 2021, 36, 180–186. [Google Scholar] [CrossRef]
  5. Marak, N.R.; Malemnganbi, C.C.; Marak, C.R.; Mishra, L.K. Functional and antioxidant properties of cookies incorporated with foxtail millet and ginger powder. J. Food Sci. Technol. 2019, 56, 5087–5096. [Google Scholar] [CrossRef]
  6. Sachdev, N.; Goomer, S.; Singh, L.R. Foxtail millet: A potential crop to meet future demand scenario for alternative sustainable protein. J. Sci. Food Agric. 2021, 101, 831–842. [Google Scholar] [CrossRef]
  7. Ataei, R.; Shiri, M.R. Multi-environment evaluation of foxtail millet advanced lines for forage yield stability. Genetika 2020, 52, 835–850. [Google Scholar] [CrossRef]
  8. Liu, Y.; Zhang, D.; Li, P.; Zong, Y.; Hao, X. Interactive effect of elevated CO2 concentration and drought on photosynthetic and physiological indexes of foxtail millet. Chin. J. Eco-Agric. 2021, 29, 500–508. [Google Scholar] [CrossRef]
  9. Kour, D.; Rana, K.L.; Yadav, A.N.; Sheikh, I.; Kumar, V.; Dhaliwal, H.S.; Saxena, A.K. Amelioration of drought stress in Foxtail millet (Setaria italica L.) by P-solubilizing drought-tolerant microbes with multifarious plant growth promoting attributes. Environ. Sustain. 2020, 3, 23–34. [Google Scholar] [CrossRef]
  10. Qingjie, F.; Yingying, Z.; Aili, S.; Zhanmin, X.; Liang, K. Damage symptoms and damage degree of main diseases and pests in foxtail millet in Chengde area. Plant Dis. Pests 2018 2018, 9, 12–16. [Google Scholar] [CrossRef]
  11. Sahoo, I.; Satish, P.; Hussain, S.A.; Sharma, S.H.K. Influence of integrated nutrient management practices on yield and economics of foxtail millet varieties. Int. J. Chem. Stud. 2020, 8, 1990–1992. [Google Scholar] [CrossRef]
  12. Zhang, X.; Kamran, M.; Li, F.; Xue, X.; Jia, Z.; Han, Q. Optimizing fertilization under ridge-furrow rainfall harvesting system to improve foxtail millet yield and water use in a semiarid region, China. Agric. Water Manag. 2020, 227, 105852. [Google Scholar] [CrossRef]
  13. Kandel, M.; Dhami, N.; Rijal, T.; Shrestha, J. Yield stability and test location representativeness in foxtail millet [Setaria italica (L.) Beauv.] genotypes. Genet. Biodivers. J. 2020, 4, 74–83. [Google Scholar] [CrossRef]
  14. Yang, Y.; Qin, L.; Wang, R.; Chen, E.; Yin, X.; Liu, Y.; Zhang, S.; Cong, X.; Li, G.; Wang, L.; et al. Effects of climatic factors under diverse ecological conditions on foxtail millet (Setaria italica) yield in Shandong. Sci. Agric. Sin. 2020, 53, 1348–1358. [Google Scholar] [CrossRef]
  15. Juhaeti, T. Foxtail millet (Setaria italica (L.) P. Beauv) cultivated on difference of nitrogen source fertilization and population. In Proceedings of the AIP Conference Proceedings, Malang, Indonesia, 13–14 March 2019. [Google Scholar]
  16. Shejawale, D.D.; Hymavathi, T.V.; Manorama, K.; Zabeen, F. Effect of processing on nutraceutical properties of foxtail millet (Setaria italica) varieties grown in India. J. Food Meas. Charact. 2016, 10, 16–23. [Google Scholar] [CrossRef]
  17. Reddy, M.U.M.; Roja, M.; Reddy, M.D.; Barman, S. Effect of nitrogen and phosphorus management on growth and yield of foxtail millet [Setaria Italica L.] during summer season in odisha, India. Indian J. Agric. Res. 2020, 54, 242–246. [Google Scholar] [CrossRef]
  18. Owusu, G.A.; Nyadanu, D.; Owusu-Mensah, P.; Adu Amoah, R.; Amissah, S.; Danso, F.C. Determining the effect of genotype × environment interactions on grain yield and stability of hybrid maize cultivars under multiple environments in Ghana. Ecol. Genet. Genomics 2018, 9, 7–15. [Google Scholar] [CrossRef]
  19. Chairi, F.; Aparicio, N.; Serret, M.D.; Araus, J.L. Breeding effects on the genotype × environment interaction for yield of durum wheat grown after the Green Revolution: The case of Spain. Crop J. 2020, 8, 623–634. [Google Scholar] [CrossRef]
  20. Singamsetti, A.; Shahi, J.P.; Zaidi, P.H.; Seetharam, K.; Vinayan, M.T.; Kumar, M.; Singla, S.; Shikha, K.; Madankar, K. Genotype × environment interaction and selection of maize (Zea mays L.) hybrids across moisture regimes. F. Crop. Res. 2021, 270, 108224. [Google Scholar] [CrossRef]
  21. Mohamed, M. Genotype by environment interactions for grain yield in bread wheat (Triticum aestivum L.). J. Plant Breed. Crop Sci. 2013, 7, 150–157. [Google Scholar] [CrossRef] [Green Version]
  22. Seyoum, S.; Rachaputi, R.; Fekybelu, S.; Chauhan, Y.; Prasanna, B. Exploiting genotype x environment x management interactions to enhance maize productivity in Ethiopia. Eur. J. Agron. 2019, 103, 165–174. [Google Scholar] [CrossRef]
  23. Zhang, S.; Huang, G.; Zhang, J.; Huang, L.; Cheng, M.; Wang, Z.; Zhang, Y.; Wang, C.; Zhu, P.; Yu, X.; et al. Genotype by environment interactions for performance of perennial rice genotypes (Oryza sativa L./Oryza longistaminata) relative to annual rice genotypes over regrowth cycles and locations in southern China. F. Crop. Res. 2019, 241, 107556. [Google Scholar] [CrossRef]
  24. Madias, A.; Di Mauro, G.; Vitantonio-Mazzini, L.N.; Gambin, B.L.; Borrás, L. Environment quality, sowing date, and genotype determine soybean yields in the Argentinean Gran Chaco. Eur. J. Agron. 2021, 123, 126217. [Google Scholar] [CrossRef]
  25. Tang, Q.-Y.; Zhang, C.-X. Data processing system (DPS) software with experimental design, statistical analysis and data mining developed for use in entomological research. Insect Sci. 2013, 20, 254–260. [Google Scholar] [CrossRef] [PubMed]
  26. Sawan, Z.M. Climatic variables: Evaporation, sunshine, relative humidity, soil and air temperature and its adverse effects on cotton production. Inf. Process. Agric. 2018, 5, 134–148. [Google Scholar] [CrossRef]
  27. Zhang, Q.; Wang, S.; Sun, Y.; Zhang, Y.; Li, H.; Liu, P.; Wang, X.; Wang, R.; Li, J. Conservation tillage improves soil water storage, spring maize (Zea mays L.) yield and WUE in two types of seasonal rainfall distributions. Soil Tillage Res. 2022, 215, 105237. [Google Scholar] [CrossRef]
  28. Ni, S.; Zhao, H.; Zhang, G. Effects of post-heading high temperature on some quality traits of malt barley. J. Integr. Agric. 2020, 19, 2674–2679. [Google Scholar] [CrossRef]
  29. Lyman, N.B.; Jagadish, K.S.V.; Nalley, L.L.; Dixon, B.L.; Siebenmorgen, T. Neglecting rice milling yield and quality underestimates economic losses from high-temperature stress. PLoS ONE 2013, 8, e72157. [Google Scholar] [CrossRef]
  30. Yu, J.; Lu, Y.; Shuzhi, J.; Wei, Z.; Zhongwei, R.; Ying, T.; Lei., D. Study on suitable temperature and precipitation index of coarse grain millet during growth period in Northwest Liaoning. Anhui Agron. Bull. 2016, 22, 25–27. [Google Scholar] [CrossRef]
  31. Chen, J.; Chen, C.; Tian, Y.; Zhang, X.; Dong, W.; Zhang, B.; Zhang, J.; Zheng, C.; Deng, A.; Song, Z.; et al. Differences in the impacts of nighttime warming on crop growth of rice-based cropping systems under field conditions. Eur. J. Agron. 2017, 82, 80–92. [Google Scholar] [CrossRef]
  32. Cammarano, D.; Hawes, C.; Squire, G.; Holland, J.; Rivington, M.; Murgia, T.; Roggero, P.P.; Fontana, F.; Casa, R.; Ronga, D. Rainfall and temperature impacts on barley (Hordeum vulgare L.) yield and malting quality in Scotland. F. Crop. Res. 2019, 241, 107559. [Google Scholar] [CrossRef]
  33. Samarasinghe, C.R.K.; Meegahakumbura, M.K.; Dissanayaka, H.D.M.A.C.; Kumarathunge, D.; Perera, L. Variation in yield and yield components of different coconut cultivars in response to within year rainfall and temperature variation. Sci. Hortic. 2018, 238, 51–57. [Google Scholar] [CrossRef]
  34. Li, Y.; Guan, K.; Schnitkey, G.D.; DeLucia, E.; Peng, B. Excessive rainfall leads to maize yield loss of a comparable magnitude to extreme drought in the United States. Glob. Chang. Biol. 2019, 25, 2325–2337. [Google Scholar] [CrossRef] [PubMed]
  35. Gao, Z.; Feng, H.-Y.; Liang, X.-G.; Zhang, L.; Lin, S.; Zhao, X.; Shen, S.; Zhou, L.-L.; Zhou, S.-L. Limits to maize productivity in the North China Plain: A comparison analysis for spring and summer maize. F. Crop. Res. 2018, 228, 39–47. [Google Scholar] [CrossRef]
  36. Liang, X.-G.; Gao, Z.; Shen, S.; Paul, M.J.; Zhang, L.; Zhao, X.; Lin, S.; Wu, G.; Chen, X.-M.; Zhou, S.-L. Differential ear growth of two maize varieties to shading in the field environment: Effects on whole plant carbon allocation and sugar starvation response. J. Plant Physiol. 2020, 251, 153194. [Google Scholar] [CrossRef]
Figure 1. Locations of the study sites.
Agronomy 12 02216 g001
Figure 2. Air temperature (vertical bars), rainfall (vertical bars), sunshine hours (scatter and line), and humidity (scatter and line) in five sites in 2018–2021.
Agronomy 12 02216 g002
Figure 3. Foxtail yield variation among year (a), locations (b), varieties (c), and fertilizer (d) in the year 2020–2021 cropping seasons in China. The histogram represents the average yield, the scatter represents the yield data of all samples, and the median ± interquartile range (IQR) with bars represents the range within 1.5 IQR. The scatter of different colors represents different treatment methods (such as location, variety, and fertilization).
Agronomy 12 02216 g003
Figure 4. Polygon view of the AMMI biplot for 6 varieties evaluated across 5 study sites in 2020–2021. ZZ, SJZ, BJ, ZB, and HD represent 5 study sites. JIN21, JI25, JI39, YG35, JM1, and ZG2 represent 6 varieties.
Agronomy 12 02216 g004
Figure 5. Effects of year and location on yield. Different lowercase and uppercase letters on columns suggest the differences are statistically significant at p < 0.05 and p < 0.001 according to LSD test, respectively.
Agronomy 12 02216 g005
Figure 6. Effects of fertilizer–year (a) and fertilizer–location (b) on yield. Different lowercase and uppercase letters on columns indicate the results are significantly different at p < 0.05 and p < 0.001 according to LSD test, respectively.
Agronomy 12 02216 g006
Figure 7. RDA analysis of yield, climate, and soil factors (2020–2021). ZZ, SJZ, BJ, ZB, and HD represent 5 study sites; pH, AN, NN, K, and P represent soil pH, ammonium nitrogen, nitrate-nitrogen, available potassium, and available phosphorus, respectively; The capital letters R, S, T, and H represent the average values of rainfall, sunshine time, air temperature, and air humidity, respectively. When the capital letter is followed by the small letters x, n, and t, they represent the maximum, minimum, and total values of the climate factors, respectively. The numbers in front of the uppercase letters represent the stages after seed germination. For example, 6Tn represents the minimum temperature in the 6th stage after seed germination, and 7S represents the average sunshine time in the 7th stage.
Agronomy 12 02216 g007
Figure 8. The period and meteorological factors that affect summer millet yield. The green squares represent the growth period of summer millet, with the factors positively related to yield shown above the green squares and the factors negatively related to yield displayed below the green square. Red, orange, light blue, and dark blue bars represent sunshine time, air temperature, air humidity, and rainfall, respectively, and the positions of the face symbol represent the key period in which the meteorological factor affects yield.
Agronomy 12 02216 g008
Table 1. Description of the study varieties.
VarietyBreeding InstitutionsMaturityDTM 1 (Days)DTB 2 (Days)DTA 3
(Days)
Height
(cm)
JG25Crop Research Institute of Shandong Academy of Agricultural SciencesLate90 44 50 137
JG39Millet Research Institute of Hebei Academy of Agricultural and Forestry SciencesMedium86 41 47 134
JIN21Institute of Cash Crops, Shanxi Academy of Agricultural SciencesLate91 44 49 164
JM1Chifeng Academy of Agriculture and Animal HusbandryEarly83 39 46 132
YG35Henan Anyang Academy of Agricultural SciencesEarly83 39 46 135
ZG2Institute of crop science, Chinese Academy of Agricultural SciencesMedium88 43 49 130
1 days from germination to physiological maturity, 2 days from germination to anthesis, and 3 days from germination to booting stage.
Table 2. Description of the study sites.
Location NameRegion Soil Parameters (0~30 cm)Sowing and
Harvesting Date
TypepHP *K *AN *NN *20202021
Zhengzhou (ZZ)Henan Province, ChinaLoamy clay8.11 29.14 126.67 17.8839.74 18 June,
16 September
11 June,
9 September
Zibo (ZB)Shandong Province, ChinaSandy clay7.97 6.39 138.00 9.39 10.66 19 June,
21 September
19 June,
17 September
Beijing (BJ)Beijing, ChinaSilty clay8.26 25.22 97.11 9.25 24.66 6 June,
20 September
10 June,
21 September
Shijiazhuang (SJZ)Hebei Province, ChinaLoamy clay7.81 22.21 98.00 7.89 4.17 22 June,
20 September
23 June,
21 September
Handan (HD)Hebei Province, ChinaSilty clay8.05 17.49 308.00 8.32 23.08 12 June,
10 September
2 July,
30 September
* mg/kg.
Table 3. Interaction effect of year, location, variety and fertilization on yield traits of foxtail millet.
TreatmentSL (cm)SW (cm)SWE (g·plant−1)GWE (g·plant−1)Height (cm)Yield (kg·ha−1)
Year
2020 19.4 b2.4 a16.6 a13.2 a140.1 a3720.5 b
2021 19.8 a2.3 b16.8 a13.2 a137.7 b4973.5 a
Location
Beijing20.7 a2.8 a18.4 a15.2 a148.2 a3862.6 d
Shijiazhuang19.7 b2.0 e15.1 c11.0 d138.0 b4442.3 b
Handan19.6 b2.3 c17.3 b12.6 c131.2 c4865.1 a
Zibo19.9 b2.5 b17.1 b14.5 b139.0 b4187.2 c
Zhengzhou18.1 c2.2 d15.5 c12.9 c137.9 b4378.8 b
Variety
ZG219.6 c2.3 d16.5 bc13.1 c130.1 e4281.7 d
YG3520.0 b2.4 bc16.7 bc13.6 bc135.2 bc4552.3 c
JIN2120.4 a2.2 e16.2 c11.9 d164.1 a4652.8 b
JI3918.9 d2.3 cd16.8 b13.9 b134.5 c4882.2 a
JI2520.6 a2.4 b18.5 a14.4 a136.9 b3755.1 f
JM118.2 e2.5 a15.4 d12.4 d132.4 d3959.9 e
Fertilizer
F019.3 b2.3 b16.0 c12.7 c137.5 b4644.7 b
F119.5 b2.4 a17.0 ab13.6 a138.7 ab3896.1 d
F219.8 a2.4 a16.6 b13.1 bc139.2 ab4805.2 a
F319.9 a2.4 a17.1 a13.5 ab139.7 a4042.9 c
F-value and significance
Year (Y)10.3 **114.1 ***1.0 NS0.1 NS22.4 ***678.0 ***
Location (L)54.4 ***289.3 ***53.9 ***105.6 ***114.9 ***779.6 ***
Variety (V)42.2 ***21.7 ***26 ***27.1 ***412.8 ***142.6 ***
Fertilizer (F)5.6 ***8.4 ***8.5 ***7.4 ***2.5 NS64.4 ***
Y × L16.6 ***20.4 ***84.7 ***67.6 ***40.8 ***293.2 ***
Y × V12.2 ***9.5 ***7.6 ***5.0 ***2.8 *2.0 NS
Y × F2.2 NS3.2 *1.5 NS2.1 NS1.7 NS2.7 *
L × V5.1 ***4.0 ***7.5 ***7.7 ***5.7 ***20.4 ***
L × F8.8 ***13.6 ***17.2 ***14.4 ***7.5 ***11.0 ***
V × F1.4 NS2.3 **2.6 ***3.0 ***1.3 NS1.6 NS
Y × L × V6.1 ***5.1 ***2.5 ***3.1 ***3.0 ***12.6 ***
Y × L × F2.3 **5.6 ***6.4 ***6.2 ***5.4 ***2.0 *
Y × V × F1.1 NS0.8 NS1.5 NS1.4 NS0.7 NS2.3 **
L × V × F1.8 ***1.6 **0.9 NS1.1 NS0.8 NS1.6 **
Y × L × V × F2.0 ***1.3 NS1.2 NS1.2 NS0.7 NS1.5 *
SL: spike length; SW: spike width; SWE: spike weight; GWE: grain weight; Height: plant height, Yield: yield per hectare. Means in a column followed by different lowercase letters are significantly different at p < 0.05 according to LSD test. * means p < 0.05, ** means p < 0.01, *** means p < 0.001, and NS means non-significant.
Table 4. Interaction effect of year, location, variety and fertilization on agronomic traits of foxtail millet.
TreatmentMSP
(g·plant−1)
MST
(g·plant−1)
FSP
(g·plant−1)
FST
(g·plant−1)
MDM
(g·plant−1)
FDM
(g·plant−1)
DMAA
(g·plant−1)
DMHI
(g·g−1)
Year
2020 15.0 a12.8 a2.0 a11.3 a27.8 a13.3 a14.6 a5.4 × 10−1 b
2021 14.0 b11.2 b2.0 a10.5 b25.2 b12.5 b12.7 b5.5 × 10−1 a
Location
Beijing13.3 c13.9 a2.1 b11.9 a27.1 b14.0 a13.3 c4.9 × 10−1 e
Shijiazhuang12.3 d11.5 c2.0 b10.5 c23.8 d12.5 cd11.3 d5.2 × 10−1 d
Handan16.3 a12.1 b1.8 c10.2 c28.4 a12.0 d16.3 a5.8 × 10−1 b
Zibo15.1 b10.3 d2.3 a10.6 c25.4 c12.9 bc12.6 c5.9 × 10−1 a
Zhengzhou15.6 b12.2 b1.8 c11.3 b27.8 ab13.1 b14.7 b5.6 × 10−1 c
Variety
ZG214.6 b11.3 c2.1 a11.0 b25.9 c13.2 b12.8 d5.6 × 10−1 b
YG3514.8 b11.1 c2.0 b9.7 c25.9 c11.7 c14.2 ab5.7 × 10−1 b
JIN2113.5 c14.4 a2.0 b13.1 a28.0 ab15.1 a12.9 cd4.8 × 10−1 e
JI3914.6 b12.4 b1.9 b11.0 b27.0 b13.0 b14.1 bc5.4 × 10−1 d
JI2515.8 a12.7 b1.9 b11.4 b28.6 a13.2 b15.3 a5.5 × 10−1 c
JM113.8 c9.9 d2.1 a9.1 d23.7 d11.19 c12.5 d5.8 × 10−1 a
Fertilizer
F013.9 b11.5 c1.8 c10.3 b25.4 c12.1 c13.2 b5.5 × 10−1 ab
F114.5 a11.8 bc2.0 b10.9 a26.3 b12.8 b13.5 ab5.5 × 10−1 a
F214.7 a12.1 b2.1 ab11.2 a26.8 ab13.2 ab13.5 ab5.5 × 10−1 ab
F314.2 c12.6 a2.1 a11.2 a27.6 a13.3 a14.3 a5.4 × 10−1 b
F-value and significance
Year(Y)29.2 ***114.5 ***0.1 NS17.2 ***72.7 ***18.4 ***30.4 ***28.3 ***
Location(L)62.0 ***60.7 ***35.7 ***13 ***30.0 ***15.5 ***27.1 ***224.2 ***
Variety(V)12.6 ***73.4 ***5.5 ***45.1 ***21.5 ***45.4 ***6.8 ***115.1 ***
Fertilizer(F)6.5 ***9.7 ***23.6 ***5.4 **9.2 ***10.5 ***1.8 NS1.8 NS
Y × L49.3 ***67.2 ***23.3 ***17.9 ***62.0 ***19.0 ***31.2 ***23.2 ***
Y × V6.3 NS1.8 NS4.9 ***1.4 NS4.7 ***2.4 *3.4 **6.1 ***
Y × F0.5 NS0.3 NS0.4 NS0.9 NS0.1 NS1.3 NS0.5 NS2.9 *
L × V3.3 ***4.2 ***10.4 ***3.5 ***3.6 ***5.9 ***1.9 **4.3 ***
L × F11.3 ***7.2 ***9.5 ***2.4 **11.2 ***4.1 ***7.0 ***3.1 ***
V × F0.5 NS0.7 NS1.5 NS1.0 NS0.4 NS1.3 NS0.9 NS1.3 NS
Y × L × V4.2 ***5.9 ***3.6 ***1.2 NS5.4 ***1.7 *4.9 ***5.2 ***
Y × L × F2.5 **2.5 ***2.6 ***2.0 *2.7 **2.9 ***1.3 NS1.9 *
Y × V × F1.0 NS1.2 NS0.6 NS0.3 NS1.1 NS0.4 NS0.9 NS1.0 NS
L × V × F1.0 NS0.7 NS2.1 ***1.0 NS0.8 NS1.4 NS1.1 NS1.1 NS
Y × L × V × F1.0 NS1.0 NS0.7 NS0.4 NS1.0 NS0.6 NS0.9 NS0.7 NS
FSP: spike weight at flowering stage; FST: straw weight at flowering stage; FDM: total weight at flowering stage; MSP: spike weight at maturity stage; MST: straw weight at maturity stage; MDM: total weight at maturity stage; DMAA: dry matter accumulation after anthesis; DMHI: dry matter harvest index. Means in a column followed by different lowercase letters are significantly different at p < 0.05 according to LSD test. * means p < 0.05, ** means p < 0.01, *** means p < 0.001, and NS means non-significant.
Table 5. ANOVA for yield traits studied along with its contribution toward total variation among six varieties of foxtail millet at five study sites with four fertilizer treatments.
FactorSum of SquaresDegrees of FreedomMean SquareF-ValueVariation Contribution
Year (Y)1.0 × 10811.03 × 108678.01 ***33.62%
Location (L)4.7 × 10841.18 × 108779.60 ***38.66%
Variety (V)1.1 × 10852.16 × 107142.61 ***7.07%
Fertilizer (F)2.9 × 10739.76 × 10664.42 ***3.19%
Y × L1.8 × 10844.44 × 107293.22 ***14.54%
Y × V1.5 × 10652.99 × 1051.97 NS0.10%
Y × F1.2 × 10634.02 × 1052.65 *0.13%
L × V6.2 × 107203.09 × 10620.38 ***1.01%
L × F2.0 × 107121.67 × 10611.04 ***0.55%
V × F3.6 × 106152.39 × 1051.57 NS0.08%
Y × L × V3.8 × 107201.92 × 10612.64 ***0.63%
Y × L × F3.6 × 106122.98 × 1051.96 *0.10%
Y × V × F5.2 × 106153.50 × 1052.31 **0.11%
L × V × F1.5 × 107602.46 × 1051.63 **0.08%
Y × L × V × F1.4 × 107602.30 × 1051.52 *0.08%
Residual7.3 × 1074801.52 × 105 0.05%
Total1.1 × 107719
* means p < 0.05, ** means p < 0.01, *** means p < 0.001, and NS means non-significant.
Table 6. ANOVA for yield traits studied along with its contribution toward total variation among six varieties of foxtail millet with four fertilizer treatments.
FactordfBeijingShijiazhuangHandanZiboZhengzhou
MSF-ValueMSF-ValueMSF-ValueMSF-ValueMSF-Value
Year (Y)15.0 × 107294.71 ***3.9 × 107392.7 ***1.0 × 1081049.87 ***7.4 × 10635.38 ***8.2 × 107445.96 ***
Variety (V)51.5 × 10790.40 ***8.1 × 1058.07 ***4.5 × 10646.57 ***9.6 × 10646.11 ***3.8 × 10620.73 ***
Fertilizer (F)34.7 × 10628.25 ***4.0 × 10640.48 ***5.8 × 1055.94 ***1.3 × 1066.35 ***5.8 × 10631.36 ***
Y × V57.0 × 1054.19 **1.6 × 10615.59 ***2.3 × 10623.44 ***2.2 × 10610.34 ***1.3 × 1066.85 ***
Y × F34.6 × 1052.76 *3.7 × 1040.37 NS7.1 × 1040.73 NS2.6 × 1051.26 NS7.6 × 1054.11 **
V × F153.6 × 1052.17 *2.1 × 1052.12 *2.4 × 1052.46 **1.7 × 1050.81 NS2.4 × 1051.31 NS
Y × V × F153.6 × 1052.12 *5.3 × 1040.53 NS2.9 × 1052.96 ***2.9 × 1051.39 NS2.8 × 1051.53 NS
Residual961.7 × 105 1.0 × 10⁵ 9.8 × 10⁴ 2.1 × 10⁵ 1.8 × 10⁵
Total143
* means p < 0.05, ** means p < 0.01, *** means p < 0.001, and NS means non-significant.
Table 7. Analysis of high yield and stability of varieties.
VarietiesHigh Yield ParametersShukla’s Stability ParametersAdaptation
Area
Comprehensive
Evaluation
Yield (kg·ha−1)Effect SizeVarianceDegree of Variation
JI254813.9466.638,885.64.1All five placesVery good
YG354721.2373.858,238.55.1All five placesVery good
ZG24467.4120.021,094.93.3All five placesGood
JI394366.519.1188,664.79.9All five placesFairly good
JM14013.2−334.2209,438.811.4All five placesGeneral
JIN213701.9−645.4126,973.99.6All five placesPoor
Table 8. ANOVA for yield traits studied along with its contribution toward total variation among 6 varieties of foxtail millet with ten year and location treatments.
Year and LocationJM1JI25JG39JIN21YG35ZG2
2020BJ2877 Cc4690 Aa3897 Bb3021 Cc4426 Aa4458 Aa
2020HD4762 Bc5785 Aa5305 Ab3995 Cd5787 Aa5363 Ab
2020SJZ 3062 Bc3505 ABab3263 ABbc3718 Aa3457 ABabc3079 Bc
2020ZZ 5468 Bbc6011 Aa4646 CDd4513 Dd5672 ABab5168 BCc
2020ZB 5675 BCbc6239 Aa6291 Aa5391 Cc6289 Aa5940 ABab
2021BJ1779 Cc3547 Aa2945 Bb1683 Cc3668 Aa2709 Bb
2021HD3767 Aa3686 ABab3085 Cc3189 BCc3798 Aa3353 ABCbc
2021SJZ4270 BCb4845 Aa4460 ABab3761 Cc4492 ABab4518 ABab
2021ZZ3860 Aab3807 Aab3256 Bc3572 ABbc3890 Aab4038 Aa
2021ZB4612 Cc6025 ABb6518 Aa4176 Cd5732 Bb6047 ABb
ANOVAdfMean squareF-valuepVariation contribution%
Year and location (CE)920,919,435.5342.6 <0.00177.63%
Variety55,403,222.0 88.5 <0.00120.05%
(CE) × Variety45564,220.5 9.2 <0.0012.09%
Means in a column followed by different lowercase and uppercase letters are significantly different at p < 0.05 and p < 0.001 according to LSD test, respectively.
Publisher’s Note: MDPI stays neutral with regard to jurisdictional claims in published maps and institutional affiliations.

