Article

Quantitative Trait Analysis Shows the Potential for Alleles from the Wild Species Arachis batizocoi and A. duranensis to Improve Groundnut Disease Resistance and Yield in East Africa

by
Danielle A. Essandoh
1,
Thomas Odong
1,
David K. Okello
2,
Daniel Fonceka
3,4,
Joël Nguepjop
3,4,
Aissatou Sambou
5,
Carolina Ballén-Taborda
6,7,
Carolina Chavarro
6,
David J. Bertioli
6,8 and
Soraya C. M. Leal-Bertioli
6,9,*
1
Department of Agricultural Production, College of Agricultural and Environmental Sciences, Makerere University, Kampala P.O. Box 7062, Uganda
2
National Semi-Arid Resources Research Institute (NaSARRI), Serere 806, Uganda
3
CIRAD, UMR AGAP, Thiès BP 3320, Senegal
4
AGAP, University of Montpellier, CIRAD, INRAE, Institut Agro, 34398 Montpellier, France
5
Centre d’Etude Régional pour l’Amélioration de l’Adaptation à la Sécheresse (CERAAS), Institut Sénégalais de Recherches Agricoles (ISRA), Route de Khombole, Thiès BP 3320, Senegal
6
Center for Applied Genetic Technologies, University of Georgia, 111 Riverbend Road, Athens, GA 30602, USA
7
Department of Plant and Environmental Sciences, Clemson University, Clemson, SC 29634, USA
8
Department of Crop and Soil Sciences, University of Georgia, Athens, GA 30602, USA
9
Department of Plant Pathology, University of Georgia, Athens, GA 30602, USA
*
Author to whom correspondence should be addressed.
Agronomy 2022, 12(9), 2202; https://doi.org/10.3390/agronomy12092202
Submission received: 8 July 2022 / Revised: 14 August 2022 / Accepted: 6 September 2022 / Published: 16 September 2022
(This article belongs to the Topic Plant Breeding, Genetics and Genomics)

Abstract

:
Diseases are the most important factors reducing groundnut yields worldwide. In East Africa, late leaf spot (LLS) and groundnut rosette disease (GRD) are the most destructive diseases of groundnut. Limited resistance is available in pure pedigree cultivated groundnut lines and novel sources of resistance are required to produce resistant new varieties. In this work, 376 interspecific lines from 3 different populations derived from crosses with the wild species A. duranensis, A. ipaënsis, A. batizocoi and A. valida were phenotyped for 2 seasons and across 2 locations, Serere and Nakabango, in Uganda. Several genotypes showed a higher yield, a larger seed, an earlier flowering, and similar resistance to the local cultivar checks. Genotypic data was used to construct a linkage map for the AB-QTL population involving the cross between Fleur11 and [A. batizocoi x A. duranensis]4x. This linkage map, together with the phenotypic data was used to identify quantitative trait loci controlling disease resistance. These lines will be useful in combining good agronomic traits and stacking disease resistance to improve the groundnut crop in sub-Saharan Africa.

1. Introduction

Cultivated peanut, or groundnut (Arachis hypogaea L.) is an allotetraploid (2n = 4x = 40), native to South America [1,2]. The crop is cultivated widely for oilseed, feed, and food in tropical and sub-tropical regions of the world and serves as an important source of income that contributes significantly to food security and reduces poverty in developing countries. A large proportion (25% to 64%) of N in the peanut crop is derived from N fixation in the root nodules, it is also a relatively drought tolerant crop [3,4]. It requires few inputs for growth and development making it a suitable crop for small-holder farmers in sub-Saharan Africa who practice low input agriculture [5]. Groundnut is also a rotation crop routinely used for breaking disease and pest cycles. All parts of the crop are used as feed and food [6]. The returns for groundnuts greatly surpass those reported for soybeans and sunflower making it a preferred legume and oilseed [6,7]. This crop is, however, highly susceptible to diseases such as groundnut rosette disease (GRD), caused by the Groundnut Rosette Virus (GRV) and late leaf spot (LLS), caused by the fungus Nothopassalora personata (Berk & M.A. Curtis) U. Braun, C. Nakash., Videira & Crous syn. Cercosporidium personatum]. Groundnut rosette disease (GRD) is the most destructive disease in sub-Saharan Africa causing yield losses of up to 100% depending on the growth stage at which the infection occurs [3,8,9]. The disease occurs every growing season with its severity increasing in crops that are grown late in the season [10,11]. Late leaf spot (LLS) is prevalent in all groundnut growing regions with adverse effects on the quality of the seed and haulm reducing its value as animal feed [10,12].
Breeding efforts for host-plant resistance and germplasm evaluation in Uganda have led to the establishment of groundnut lines with acceptable levels of field resistance to GRD and LLS Okello [6,13]. In all analyzed released cultivars, resistance to GRD is mainly to the viral component of the disease complex which does not render immunity and can be overcome under high inoculum pressure [11,14,15,16,17,18]. This was evident from the breakdown of resistance in Serenut 4T a widely grown GRD resistant variety in Uganda under high aphid pressure [6,13]. Furthermore, continuous selection and little use of exotic germplasm in peanut improvement programs in Uganda has narrowed the genetic base of existing varieties and reduced the possible allelic combinations for disease and pest resistance [6,18].
Due to the limited resistance amongst the current cultivars and the use of few elite varieties as parents, novel sources of resistances are required in cultivated groundnut varieties. Several efforts have been made to introgress alleles from wild species into cultivated species with studies centering on improving pest and disease resistance. Fortunately, strong resistance to many pests and diseases have been reported in the secondary gene pool of Arachis consisting of 32 wild diploid species of the section Arachis [4]. Resistance to GRD and LLS has been previously described in wild species of groundnut [19,20]. A major difficulty in the introgression of wild alleles into cultivated species is the infertility of primary hybrids between most wild by cultivated groundnut crosses owing to the ploidy differences [4,21]. Despite the challenges, increasingly efficient hybridization schemes and increasing ease of marker technologies which allow efficient hybrid confirmation and tracking of wild genetics in breeding programs are allowing the use of wild diploid species for improving cultivated groundnut on an unprecedented scale [4,21,22,23,24]. An example of a “legacy” cultivated groundnut line which has wild species pedigree is ICGV-SM 96715 (PI 598133). This line was developed at ICRISAT Malawi by crossing cultivated groundnut cv. Makulu Red with a tetraploid interspecific derivative line ‘Samaru 38’/Arachis diogoi V10602// ‘Samaru 61’ [25]. This line (ICGV-SM 96715) was used to create two GRD resistant varieties, Naronut 1R and Naronut 2T [26] and under review). Another Ugandan variety, Serenut 2 (ICGV-SM 90704, also resistant to GRD, does not have recorded wild species in its pedigree [27]. These varieties have high acceptance by farmers, as they have moderate resistance to LLS, but unfortunately, they also have very low yield. Another example of the influence of wild species in peanut breeding is the previously substantially overlooked impact of A. cardenasii GKP 10017. Genetic analysis and pedigree research identified the genetics of this wild species in peanuts from 30 countries around the world including Africa: in Burkina Faso, Ghana, Mali, Malawi, Mozambique, Niger, Nigeria, Republic of Guinea, Togo, Senegal, South Africa, Sudan, Uganda, and Zambia [28]. Because of their resistance to leaf spots and rust, when unsprayed with fungicides peanuts with wild genetics from A. cardenasii yielded almost double the locally grown peanut cultivars of pure pedigree (without wild alleles).
Research to broaden the gene pool of cultivated groundnut using wild relative has been undertaken in Senegal resulting in the development of two AB-QTL populations and CSSL lines [23,24,29]. These lines have been used to decipher the molecular basis of complex yield traits, determine the regions important for domestication [23,24,30], investigate the meiotic behavior of tetraploid groundnut [29] and to improve local varieties [31] These lines were transferred to Uganda as part of a Peanut Innovation Lab (USAID) project, with the aim of using them in local and regional breeding programs. Here we tested these lines for GRD, LLS and agronomic traits. QTLs were identified for LLS and GRD resistance. Several lines had stronger resistance to LLS, earlier flowering, larger seed, and higher yield than local checks. They are candidates for stacking resistance and improving agronomic traits of local varieties. This study exemplifies the potential and usefulness of groundnut wild relatives for the improvement of the crop in sub-Saharan Africa.

2. Materials and Methods
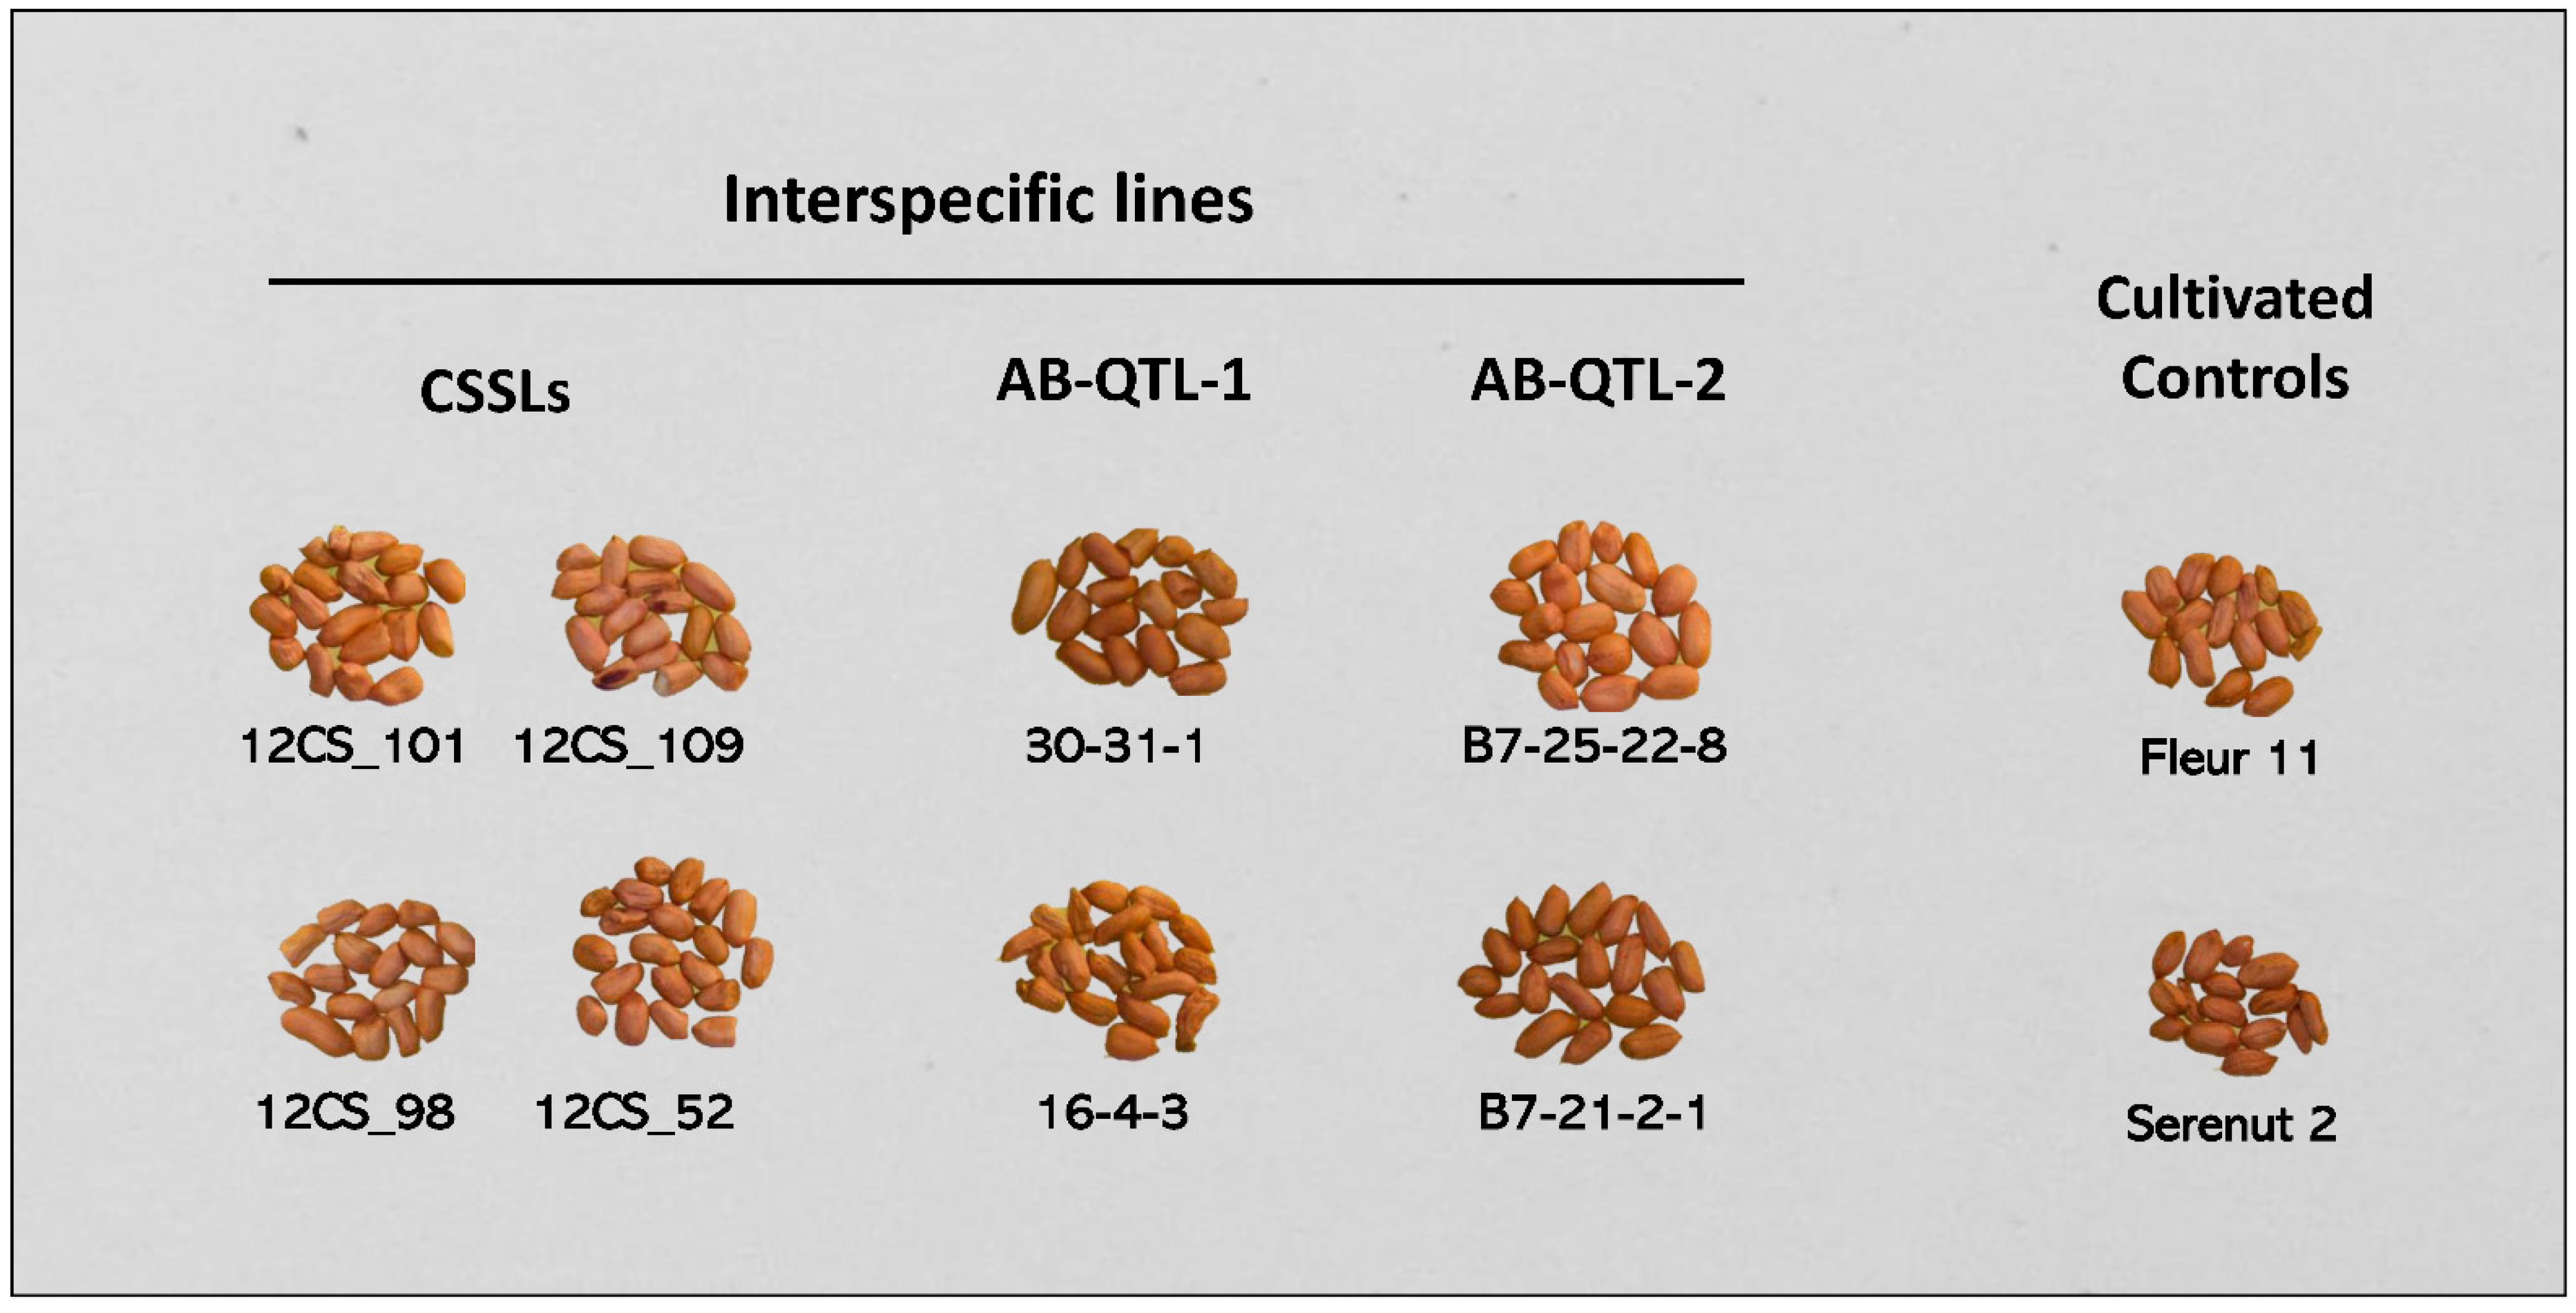
2.1. Populations

Three structured genetic populations were used in this study. All populations have as recurrent parent, Fleur 11, an elite Spanish-type variety, widely cultivated in West Africa.
Population 1 (AB-QTL-1): advanced backcross population of 133 individuals developed using Fleur11 and the induced allotetraploid ‘ISATGR 278-18’ [29]. ISATGR 278-18 is derived from a cross between A. batizocoi—ICG 13160 (GKBSPSc 30082, PI 468328) and A. duranensis—ICG 8138 (GKP 10038, PI 262133) [32].
Population 2 (AB-QTL-2): advanced backcross population of 198 individuals developed using Fleur11 and the induced allotetraploid ‘ISATGR-52B’ allotetraploid ‘ISATGR-52B’ [A. duranensis and A. valida]4x [33].
Population 3 (CSSL): population of chromosome substitution segment lines, derived from a cross between Fleur11 and the allotetraploid AiAd (=IpaDur1 = [A. ipaensis KG30076 x A. duranensis V14167]4x [34,35]. Each line has one or few wild segments covering 2.3–3% of the genome and all individuals cover most of the wild allotetraploid genome [23,36]. Forty-five individuals were tested here.

2.2. Field Experiment

A total of 376 interspecific derivatives (described above) were evaluated in rainfed conditions under high disease pressure in Uganda. Local cultivars ‘Naronut 1R’, ‘Naronut 2T’ and ‘Serenut 2’ were used as resistant controls for GRD and LLS. Fleur11, the recurrent parent, was used as the reference cultivated genotype to assess the effect of wild introgressions.
Field evaluations were conducted at the National Semi-Arid Resources Research Institute (NaSARRI), Serere district and in Nakabango during the second rainy season of 2019 (2019B, September–January) and the first rainy season of 2020 (2020A, March–August). Serere district, Eastern Uganda has a humid and hot climate that receives an annual rainfall of 1000–1200 mm. The region is located 1140 m above sea level with an average temperature of 28 °C and humidity of 55%. Nakabango is in the South-eastern region of Uganda in Jinja district and receives an annual rainfall of 1000–1324 mm. The region is located 1188 m above sea level with an average temperature of 22 °C and humidity of 78%. Both areas are hotspots for groundnut rosette and late leaf spot diseases. All genotypes (tests and checks) were set in a 19 × 20 Alpha Lattice with two-replicates. The plot size was 1 m × 0.90 m. Each plot consisted of two 75 cm rows, with a planting rate of five plants per row, with inter-row spacing of 45 cm. Inter plot distance was 60 cm and spacing between replications was 2 m. Weeding was done manually three times until harvest. Some of the plants were heavily rosetted and therefore produced few or no seeds. For each plot, to assess the number of pods per plant, five randomly selected plants were taken and the pod number on each recorded. Plants were harvested manually. All pods and shelled, seed were weighed thus giving the yield per plot as g/0.9 m2. The yield was then converted to g/m2.

2.3. Phenotypic Screening for Late Leaf Spot (LLS) and Groundnut Rosette Disease (GRD)

Genotype response to late leaf spot (LLS) was assessed as disease severity scoring using a modified nine-point scale [9], where a score of 1 was rated as highly resistant with no disease symptoms (HR), 2 = resistant with Lesions present largely on lower leaves, 3 = resistant with lesions present largely on lower leaves, very few on middle leaves, 4 = resistant with lesions on lower and middle leaves but severe on lower leaves no defoliation, 5 = moderately resistant with lesions present on all lower and middle leaves; over 50% defoliation of lower leaves, 6 = moderately resistant with severe lesions on lower and middle leaves, 7 = susceptible with lesions on all leaves but less severe on top leaves, 8 = susceptible with defoliation of all lower and middle leaves; severe lesions on top leaves and 9 = highly susceptible with almost all leaves defoliated, leaving bare stems; some leaflets may remain, but show severe leaf spots. Scoring was done at 30, 60 and 90 days after planting (DAP) and at harvest. Area Under the Disease Progress Curve (AUDPC) of LLS severity was calculated as described by Shaner and Finney [37] to analyze disease progression.
Genotype response to groundnut rosette disease (GRD) was observed in two ways, recording incidence and severity. (1) Incidence was expressed as the percentage of plants infected with GRD over the total number of plants in the plot (percentage of disease incidence, PDI). PDI evaluations were done at 4, 8 and 12 weeks after planting and at harvest; and (2) GRD severity was evaluated at harvest, based on the intensity of disease attack using the score described by [11], where 1 = highly resistant with no or negligible leaf symptoms, 2 = resistant with rosette symptoms on 1–20% foliage, but no obvious stunting, 3 = moderately resistant with rosette symptoms on 21–50% foliage and stunting, 4 = susceptible with severe rosette symptoms on 51–70% foliage and stunting and 5 = susceptible with severe symptoms on 71–100% foliage, stunted or dead plants. Area Under the Disease Progress Curve (AUDPC) of percentage of disease incidence was calculated as described by Shaner and Finney [37] to analyze incidence progression.

2.4. Agronomic Evaluations

Agronomic data collected were number of days to 50% flowering, number of pods per plant, pod yield (g/m2), and 100 seed weight. The trait of days to 50% flowering was recorded on plot basis, daily, from sowing to the day when 50% of the plants had at least one flower each. Number of pods per plant was recorded on five plants at harvest. Hundred seed weight (g) and grain yield (g/m2) were measured after pods were shelled and dried to <13% moisture content.

2.5. Data Analysis

Basic statistical analyses (mean and standard deviation) were calculated for each trait. An analysis of variance (ANOVA) with Tukey’s test was performed to estimate the genetic, location, season, block, and interaction effects, as
Y i j k l = μ + g i + L j + S l + B / R k l + G x L i j + G x S i l + G x L x S i j l + ε i j k l
Y i j k l = Response variable, μ = Overall mean, gi = Genotype effect, Lj = location effect, Sl = season effect, βj/Rkl = effect of the block within replicate, G x L i j = effect of “Genotype x location”, G x S i l = effect of the “Genotype x season”, G x L x S i j l = effect of “Genotype x location x season”, ε i j k l = residual.
Data on disease incidence and severity were fitted to linear mixed models using lme function built in lme4 package in R (R Core Team (2020). Means generated from the Analysis of variance were separated using Tukey’s Test.
To assess and quantify the genetic variability among the interspecific lines, heritability in broad sense were estimated (H2) as
H2 = σ2G/(σ2G + σ2GE/e + σ2ε/re)
where, H2 = broad-sense heritability; σ2G = genotypic variance; σ2GE = variance of genotype × environment interaction; σ2ε = error variance; e = environment number; and r = number of replications. The heritability estimates were classified as described by Johnson et al. [38]: low (0–30), medium (30.1–60), high (60.1 and above).
Correlation coefficients (r) between all the traits across locations were calculated using ‘cor’ function in R [39].

2.6. SNP Genotyping, Analysis and Data Filtering

The population AB-QTL-1 = Fleur11 x [A. batizocoi x A. duranensis]4x was genotyped for QTL discovery. Genomic DNA of 133 individuals was extracted from leaves using the DNeasy Plant Mini Kit (QIAGEN), according to manufacturer’s instructions. DNAs were quantified with Pico Green and samples were submitted for genotyping with the ‘Axiom Arachis v02’ 58 K high-density SNP array [40]. The genotypic data were extracted and processed and analyzed using the Axiom Analysis Suite 2.0 software v5.0 (http://www.thermofisher.com, Santa Barbara, CA, USA, accessed on 6 May 2020). Polymorphic markers were filtered using Microsoft Excel with the following parameters: (a) markers with different calls between the diploid parents of the allotetraploid and between the tetraploid parents were selected (b) no missing data or heterozygote (AB) calls in the diploid or tetraploid controls were included and (c) SNPs with more than 20% of heterozygote and missing calls were discarded. The polymorphic markers for the A and B genomes were ordered by physical position based on the A. duranensis and A. ipaënsis reference genomes [41]. This order was used for the QTL mapping analysis for 1440 markers selected with known position.

2.7. Genetic Mapping and QTL Discovery

The physical map in combination with phenotypic measurements for late leaf spot and groundnut rosette disease resistance, were used for QTL identification using R/qtl software following the procedure described in “A guide to QTL mapping with R/qtl” [42]. In total, 133 individuals were used for map construction. Due to the spike observed in the phenotype data distribution at zero (null phenotype), a two-part binary plus normal analysis method was employed using the scanone function of R/qtl. A total of 1000 permutations were used to identify genome-wide LOD significance thresholds at 1% and 5% level of significance [43]. Using the bayesint function an LOD support interval with lodint function in R/qtl, a 99% Bayesian credible interval was calculated. The percentage of phenotypic variability explained by a QTL (R2) and the estimated effect of each QTL was assessed using the effectplot function in R/qtl [44].

3. Results

Cultivated and interspecific lines showed good emergence, showing no signs of dormancy. Development was normal. Phenotypic evaluations were performed across two environments over two seasons. The two locations (Serere and Nakabanko) are hot spots for leaf spot and groundnut rosette disease (GRD). In all seasons and both places there was high incidence of diseases, but in the 2020A season in Nakabango, GRD was particularly strong, which severely suppressed yield (Supplementary Figure S1a–h, Supplementary Table S1). There was variation for some agronomic traits found between the different populations (e.g., Table 1) and large variation within each population (Table 1, Supplementary Figure S2a–e). The combined analysis of variance showed a significant genotype x season for all the traits and genotype x location interaction (p ≤ 0.001) between genotypes for all traits.

3.1. Agronomic Evaluation

3.1.1. Total Yield (g/m2)

All populations and controls yielded approximately 60% more in Serere (average 61.5 g/m2, controls 78.7) than in Nakabango (average 38.5 g/m2, controls 44.1). There was a lot of variation per season: The season 2019B average yield was 83.6 g/m2 whereas in 2020A, average yield was only 14.2 g/m2. Pooled data from all seasons and locations shows that yield ranged from zero (when plants were stunted, heavily infected by GRD) and 131.4 g/m2. All three populations had similar yield, but a one-way ANOVA with Tukey’s test demonstrated that individuals from AB-QTL-2 population (derived from introgression of A. duranensis and A. valida) produced significantly higher yields than individuals from CSSL populations (derived from introgression of A. ipaensis and A. duranensis; see Supplementary Figure S2a). Contrary to expectation, Fleur11, which is not adapted to local conditions, yielded similar to locally adapted varieties (Supplementary Table S1, Figure S1a). Several of the interspecific lines outperformed the local checks for yield parameters: the best yielding lines were from the AB-QTL-2 population, B7-32-8-4, B7-32-7-6, B7-21-2-3 and B7-25-22-8, representing up to a 54% yield increase compared to Serenut 2 (Figure 1a, Supplementary Table S1). There was a large variation between seasons and environments. However, some lines presented good levels of yield stability, they were: 12CS-110 (CSSL population), B7-23-10-5, B7-32-7-6, B7-26-6-6 and B7-32-8-4 (AB-QTL2 population) (Supplementary Table S1).

3.1.2. 100-Pod Weight—Proxy for Seed Size

Population CSSL and AB-QTL-1 had similar pod weight distribution, and AB-QTL-2 had a larger 100-pod weight (Supplementary Figure S2b). Transgressive segregation was observed: Original allotetraploids generally have a small seed [45], the recurrent parent Fleur11 has a 100-pod weight of 94.4 g. In total 199 segregant lines exceeded this value, and 111 segregant lines exceeded all local checks (Supplementary Table S1). Some of the best lines are shown in Figure 2; 12CS_98 (113.5 g), 12CS_101 (112.4 g), 30-31-1 (115.4 g), 16-4-3 (114.3 g), B7-25-22-8 (133.9 g), and B7-21-2-1 (125.9 g).
All three populations had similar days to 50% flowering (DTF) with an overall average of 32.54 days (Supplementary Figure S2b), whilst the controls were: Naronut 1R (35.0 d) Naronut 2T (35.5 d), Serenut2 (36.7 d) and Fleur11 (31.8 d). All lines had earlier DTF than the local checks. The earliest genotypes are B7-26-16-3 (29.3 d), 11_28_8 and 3_1_5 (both with 30.5 d) (Figure 1b, Table 1).

3.1.3. Earliness

All three populations had similar days to 50% flowering (DTF) with an overall average of 32.54 days (Supplementary Figure S2c), whilst the controls were: Naronut 1R (35.0 d) Naronut 2T (35.5 d), Serenut2 (36.7 d) and Fleur11 (31.8 d). All lines had earlier DTF than the local checks. The earliest genotypes are B7-26-16-3 (29.3 d), 11_28_8 and 3_1_5 (both with 30.5 d) (Figure 1b, Table 1).

3.2. Disease Evaluation

The sites of Serere and Nakabanko are hot spots for leaf spot and GRD. In all seasons there was high incidence of both diseases (Supplementary Figure S1a–h), but in the 2020A season in Nakabango, GRD incidence and severity were particularly high, which had a large impact on yield (Supplementary Figure S2e–h, Supplementary Table S1).

3.2.1. Late Leaf Spot Resistance

Disease incidence was more severe in the experimental plots during the 2020A season in comparison with the 2019B season (Supplementary Table S1). Local checks had score values of 4.5–6.3 at harvest, and Fleur11 had a score average of 6.88 across environments and seasons. Frequency distribution of the pooled data shows that values for segregants were skewed towards susceptibility at all stages (Figure 3a,b). At physiological maturity, most individuals were susceptible to LLS with values greater than 6 whereas 12 genotypes were only as moderately resistant as the best check, Serenut 2. Infection by Late leaf spot induced a mean plant damage of 6.81 and a standard deviation of 0.968 for AB-QTL-1 population. Individuals from CSSL population had a mean plant damage of 6.90 and recorded a standard deviation of 1.003. Similarly, individuals from AB-QTL-2 population had an average plant damage of 6.81 and a standard deviation of 0.968. A one-way ANOVA with Tukey’s test was done comparing the averages of each population. It demonstrated that all three populations have similar responses to late leaf spot (Supplementary Figure S2d). In total, two hundred and thirty-nine (239) interspecific lines showed lower infection rates than the recurrent parent.

3.2.2. Groundnut Rosette Disease Resistance

Extensive variation was observed amongst the different individuals with visible disease symptoms ranging from 1–4 for rosette severity and 5.13–67% for Percentage Disease Incidence. Most of the interspecific lines showed higher disease mean scores than the local resistant checks (Naronut 1R, Naronut 2T and Serenut 2) at all the scoring stages with the recurrent parent Fleur 11, showing moderate resistance (Figure 3c,d and Supplementary Table S1). Comparing the three populations, AB-QTL-2 had slightly lower values, but a one-way ANOVA with Tukey’s test showed no significant differences in rosette severity among the three populations (Supplementary Figure S2e).
To pinpoint the relationship between traits, correlation coefficients (r) between the traits across environments were calculated (Figure 4). Positive and highly significant correlations were observed between yield components: pod number per plant and seed yield (0.67), pod number per plant and pod yield (0.69), pod yield and seed yield (0.92). Groundnut rosette percentage disease incidence (PDI) at 12 weeks and GRD severity were negatively correlated with pod number per plant (−0.54), grain yield (−0.45) and pod yield (−0.47) (p < 0.001). PDI AUDPC was negatively and highly correlated with number of pods per plant, grain yield and pod yield and positive and highly correlated with PDI at 12 weeks (0.81). LLS AUDPC was positively correlated with LLS at 12 weeks and at harvest and significantly (p < 0.001). Surprisingly, moderate positive correlation was observed between LLS at 12 weeks with grain (0.17) and pod yield (0.13), LLS at harvest with grain (0.17) and pod yield (0.12). Strong correlation between data obtained at different times for GRD, showing robustness of data collection. There was strong negative correlation between GRD and yield (−0.46 to −0.18) and no significant correlation between GDR and LLS resistance (Figure 4).

3.3. Analysis of Variance and Heritability for Groundnut Rosette and Late Leaf Spot Diseases across Two Locations

The analysis of variance showed significant differences (p ≤ 0.001) between genotypes for LLS and GRD at different physiological stages across the two locations (Supplementary Figure S1a–h). The estimated broad sense heritability for LLS across the three populations ranged from low to moderate (0–0.56) with the highest heritability estimates observed for AB-QTL-2 (Table 2) at LLS at 12 weeks. Similarly, estimated broad sense heritability estimates across the three populations ranged from 0–0.48 with the highest heritability estimates observed for AB-QTL-2. Higher heritability estimates values were obtained for yield traits and ranged from 17% to 64%. With the highest heritability estimate obtained for hundred seed weight.

3.4. Identification of QTL for Disease Resistance

Genotyping data of the 133 BC2F5 lines of the AB-QTL-1 population (Fleur11 x (A. batizocoi ICG13160 x A. duranensis-ICG 8138) was analyzed to check for polymorphic markers to perform QTL mapping. In order to identify the polymorphic markers for the A and B genomes (A. duranensis and A. batizocoi, respectively), the PI and collector numbers for the diploid progenitors of the allotetraploid parent ISATGR 278-18, were identified in the ICRISAT database. The genotyping of the diploid progenitor was confirmed in a phylogenetic tree made at the University of Georgia Athens (UGA) including most of the accessions available for the Arachis section (unpublished data). Arachis batizocoi ICG13160 corresponded to the collector number 30082 and PI 468328, and its position on the phylogenetic tree was correct inside the A. batizocoi cluster. A. duranensis ICG 8138 corresponded to the collector number 10038 and PI 262133 and its position in the tree was as expected inside the A. duranensis cluster. SNP markers were filtered using the identity of these two accessions. In order to identify the polymorphic markers useful for QTL mapping, the following parameters were used as filters in Excel: the markers with different calls between the diploid parents of the allotetraploid and between the tetraploid parents were selected; no missing data or heterozygote (AB) calls in the diploid or tetraploid controls were included; the SNPs with more than 20% of heterozygote and missing calls were discarded. The polymorphic markers for the A and B genomes were sorted by physical position based on the A. duranensis and A. ipaënsis reference genomes [41]. This order was used for the QTL mapping analysis for 1437 markers selected with known positions. These 1437 SNP markers were ordered into 20 linkage groups (LGs) to create a framework genetic map for QTL analysis (Supplementary Figure S3). LOD significance threshold estimated for each trait ranged from 2.75 to 2.84 (Table 3). QTL analysis using phenotypic and genotypic data resulted in the identification of six QTLs in total in the Fleur11 x (A. batizocoi x A. duranensis)4x population (Table 3). QTLs were identified in the four linkage groups (LG). The phenotypic variation explained (PVE %) by these QTLs ranged from 7.96% (QTL A08_22758270) to a maximum of 12.56% (QTL B04_10528843) (Table 3).
Using these 1437 SNP markers, a framework genetic map was created and used for QTL analysis. LOD significance threshold estimated for each trait ranged from 2.75 to 2.84 (Supplementary Figure S3). QTL analysis using phenotypic and genotypic data resulted in the identification of six QTLs in total in the Fleur11 x (A. batizocoi x A. duranensis)4x population (Table 3). QTLs were identified in the four linkage groups (LG). The phenotypic variation explained (PVE %) by these QTLs ranged from 7.96% (QTL A08_22758270) to a maximum of 12.56% (QTL B04_10528843) (Table 3).

3.4.1. QTL for LLS Resistance

Two QTLs were identified for LLS resistance with PVE of 9.43 and 9.60% with both mapped to the B sub genome (Table 2). QTL B04_9708846 (Phenotypic variance explained (PVE) = 9.43%) and ‘Araip.B04_17705669’ (PVE = 9.60%) were detected in 2020A in Nakabango with LOD scores of 3.04 and 3.0 respectively at genome-wise α = 0.05 threshold and Bayes interval of 7.08–90.02 (Table 3). For all the QTLs, resistance alleles were derived from the synthetic [A. batizocoi x A. duranensis]4x. With the analysis of the phenotypic effects of nearest markers linked to QTLs contributing to late leaf spot resistance, the presence of (A. batizocoi x A. duranensis)4x alleles of locus B04_17705669 (LG B04) and B04_9708846 (LG B04) contributed, respectively, to a reduction of 11.11% and 10.85% of LLS disease (Figure 5a,b).

3.4.2. QTL for GRD Resistance

Three QTLs for GRD were identified at Nakabango in 2020A (resistance values scored at 4, 8 weeks, AUDPC) and one at Serere in 2020A (GRD severity). QTLs for GRD resistance were identified at 4 and 8 weeks at a significance level of 5% on linkage group B04 and B05 at LOD scores of 2.75 and 2.9 respectively. Similarly, a QTL was identified at 5% level of significance for GRD AUDPC at LOD scores of 2.81 and another QTL detected for GRD severity in Serere 2020A season at 5% level of significant at a LOD score of 2.78. The largest effect QTL in the study was found on chromosome B04 with Bayesian interval of 6.62–115.86 Mb with a peak at marker 10528843 (Table 3). Lower values for GRD disease were contributed by alleles from the synthetic (A. batizocoi × A. duranensis)4x, on B04, B01 and B05 (Figure 5c–e). An allele on A08 for GRD resistance was also contributed by Fleur 11, the recurrent parent in this population (Figure 5f).

3.5. Identification of Markers Linked to Yield and 100-Seed Weight

The population CSSL (Fleur11 x [A. ipaënsis x A. duranensis]4x) has been previously genotyped using SSRs [23] and extensively evaluated for agronomic traits [30,46]. In this study, 45 individuals of this population were evaluated in 2 environments and in 2 seasons. Based on the pooled data, 29 individuals outperformed the recurrent parent Fleur11. The two lines with heaviest seed weight, 12CS_98 and 12CS_101 had 14% heavier seed than the local check Serenut 2. In total 17 lines outperformed Naronut 2T and 33 outperformed Naronut 1R for yield (Supplementary Table S1). Using results from previously genotyping data, we listed the wild introgressed segments present in the genome of the lines with the top largest seeds, and the markers associated with the segments (Figure 6). SSR Markers associated with the introgressed segments of 12CS_98 are: Seq18A08_A3, gi-0832_A and TC9E08_A1 and associated with 12CS_101 are: PM050_B, seq19D06_B and AC2C02_B1 (primer sequences can be found in [46]).

4. Discussion

Late leaf spot and groundnut rosette disease (GRD) are the most important biotic constraints to groundnut production in sub-Saharan Africa. As an effort to introgress alleles from wild species into the cultivated species, three interspecific populations were developed in Senegal and transferred to Uganda under the Peanut Innovation Lab—Feed the Future program. Therefore, the present study was conducted to evaluate interspecific lines in two groundnut growing regions in Uganda to test their potential for incorporation in the breeding program for East Africa.

4.1. Variations per Location and Season

In this study, there was large variation in collected phenotypes according to the location and the season. In Nakabango, both diseases were more prevalent, which dramatically influenced yields. Given that groundnut is amongst the major food crops in Nakabango district, higher GRD and incidence could be partially attributed to the proximity to sources of primary inoculum of GRD which increases disease pressure. Earlier research has also shown that “Red Beauty”, a highly susceptible variety to GRD is the main groundnut variety grown in Nakabango district, contributing to abundance of inoculum that may remain on volunteer plants and/or alternative hosts [5,47]. GRD scores in 2019B were generally lower than in 2020A. The differences between the two seasons could be partially attributed to environmental factors such as temperature, humidity, and wind speed. High wind speed was reported to have a negative influence on population buildup of aphids causing them to be blown away and lowering their populations. During the study period, wind speed was much higher at Nakabango in 2019B (59.5 km/h) than in Serere in 2020A (31.4 km/h). Accordingly, this may help to explain the results of the study.
Disease ratings and agronomic traits of the interspecific lines were greatly influenced by season and location (Supplementary Table S1), indicating significant Genotype x Environment (G x E) interaction. This emphasizes the importance of evaluations of genotypes in multiple seasons and locations and suggests the possibility of identifying resistant genotypes with specific adaptability to target locations.

4.2. Phenotypic Evaluation and Selection of Superior Lines

Local varieties Naronut 2T and Naronut 1R presented strong levels of GRD resistance. All these varieties are derived from a line ICGV-SM 86715 that has the wild species Arachis diogoi V10602 in its pedigree [25,26] hence we conclude that the resistance likely derives from this wild accession. A. diogoi V10602 has also been observed as resistant to other viral diseases [4]. In the present study, moderate levels of resistance were recorded for the interspecific lines, with the local variety Serenut 2 showing the highest level of resistance (4.5) (Figure 3). Interspecific lines, B7-25-22-8, B12-14-2-2, B7-21-12-5 and B7-30-9-8 from the population AB-QTL-2 (Fleur11 x [A. valida x A. duranensis]) and 11_28_15 and 1_13_1 from the population AB-QTL-1 (Fleur11 x [A. batizocoi x A. duranensis]4x) recorded significant lower mean disease scores ranging from 4–6 compared to local checks and the recurrent parent (Fleur11). Considering that the recurrent parent, Fleur 11 exhibited high severity, the resistance observed amongst the plants can most plausibly be attributed to genes inherited from the wild species of the allotetraploids used as donor parent. Introgression of alleles from wild species was in accord with previous studies that demonstrated the presence of resistance to late leaf spots in wild groundnut species and their derived neotetraploids, including A. batizocoi, A. valida (K/B-genomes) and A. duranensis (A-genome species) [48,49]. The lines found here with moderate-high resistance to GRD and/or LLS can be used for stacking alleles for durable resistance.
The yield potential in sub-Saharan Africa is reduced because of the prevalence of both abiotic and biotic factors [10,50,51]. It is worth noting that, although the lines tested here did not have significantly superior resistance to LLS or GRD than the wild-derived locally popular varieties, several yielded significantly higher and had larger seeds (as per 100 seed weight). This is an indication of the usefulness of the interspecific lines as parents in crosses to improve yield and stack resistances in existing varieties in Uganda. Among the most resistant genotypes, B7-32-8-4 from the population AB-QLT2 (Fleur11 x [A. valida x A. duranensis]4x) was the best performing, with consistent yields consistently greater than the local checks across the two environments. High yielding is an important trait for farmers, hence the resistant cultivars identified in the study could be included in a breeding program. Several lines also flowered earlier than the local cultivars. Earliness is a very desirable trait especially in environments with a short rainy season. Uganda has bimodal rainfall, and most predominantly groundnut growing areas have two cropping cycles using early maturing varieties (<90 days). Late maturing varieties (Virginia market types) are grown in longer rainy season areas. The next step of this work will be to verify pod maturity of these same lines.

4.3. QTL Identification

Understanding the genetics of GRD and LLS resistance would create the opportunity to use DNA markers to facilitate selection and the development of LLS and GRD resistant genotypes. Hence, we used data from the AB-QTL-1 ([Fleur11 x (A. batizocoi x A. duranensis]4x) population to discover QTLs governing LLS and GRD resistance. For this we used the individual environment datasets separately. Our linkage map consisted of 1440 SNP markers. All the detected QTL were environment specific, an indication that none of the QTL were stable in phenotypic expression. For example, a QTL for GRD resistance, namely QTL B04_10528843 (with 12.56% PVE), was detected in Nakabango in the first season (2020A) and explained an estimated 12.56% of variation but was not detected in Serere during the same season. The inconsistency of QTLs across the two locations may be explained by the possible environmental influence on QTL expression and high error variance in the individual environments, consequently restricting the transferability of results from the QTL analysis across environments. Further tests will be needed to refine these analyses.
Several efforts have been made to identify QTLs for important diseases of groundnut such as ELS, LLS, rust and TSMV [52,53,54,55]. In the present study, more SNPs were identified on the B-subgenome LGs compared to the A-subgenome LGs. Five QTLs were identified on the B-subgenome LGs and one on the A-subgenome LG. For LLS resistance, two QTLs on LG B04 were identified: severity at 12 weeks after planting and for AUDPC in Nakabango; phenotypic variation of 9.43 and 9.60% explained respectively. Both QTL had positive effects associated with wild alleles, an indication of the contribution of wild alleles towards resistance. For GRD, QTLs were identified for all traits evaluated, except for PDI at 12 weeks with PVE values ranging from 7.90–12.56% (Table 3). Four QTLs were identified on four different linkage groups, with one wild-derived QTL having negative additive effect located on LG A08 (Table 3). Curiously, this QTL is located within a cluster of TIR-NBS-LRR class resistance genes present in the Arachis duranensis genome [41]. The low correlation coefficient between late leaf spot and groundnut rosette parameters and the different locations of their associated QTLs suggests that no gene with pleiotropic effects is responsible for these disease variations in each region.
The positions of the QTLs found in the research were compared with previous QTL studies for LLS and GRD resistance [53,54,56,57,58]. No overlapping QTLs were found from these studies for LLS resistance with the single exception of a QTL on chromosome A08 for resistance to GRD severity (22.76–23.42 Mbp) that overlaps with a QTL for LLS resistance identified by [59]. This supports the notion that this region on chromosome A08 has genes playing role in defense against diseases.

4.4. Usefulness of Lines to the Groundnut Breeding Program

Currently, the only sources of resistance to GRD and late leaf spots in Uganda are the recent Serenut and Naronut varieties. Continuous selfing and limited use of few exotic germplasm has further narrowed the genetic base of current varieties. Therefore, the identified lines present novel sources of resistance that can be used to broaden the genetic base of current lines in Uganda. In the present study, high yielding interspecific lines of Spanish market type were field tested in two locations during two seasons with the main intention of identifying resistance to LLS and GRD. Whilst resistances found were generally not superior to the current local cultivars, they can be pyramided, increasing resistance levels and durability. Further to this initial goal, other useful agronomic traits were also found, such as higher yield, larger seeds and early flowering. The identified lines can be used in crosses to widen the genetic base of current varieties for yield and disease resistance. This carries great potential to improve groundnut production and better livelihoods in Uganda and other countries in East and Central Africa.

Supplementary Materials

The following supporting information can be downloaded at: https://www.mdpi.com/article/10.3390/agronomy12092202/s1, Table S1: Data on the populations AB-QTL-1 = Fleur11 x [A. batizocoi x A. duranensis]4x, AB-QTL-2 = Fleur11 x [A. valida x A. duranensis]4x and CSSL = Fleur11 x [A. ipaensis x A. duranensis]4x evaluated in two seasons in two locations in Uganda; Figure S1: Boxplots for late leaf spot and groundnut rosette diseases across locations and years; Figure S2: Violin plots displaying yield (g), Days to 50% flowering (DTF), 100 seed weight, LLS score and GRD severity amongst interspecific populations; Figure S3: A genetic linkage map of the population AB-QTL-1 = Fleur11 x [A. batizocoi x A. duranensis]4x obtained through the genotyping analysis of 133 BC2F5 plants using Axiom Arachis v02.

Author Contributions

Conceptualization: S.C.M.L.-B. and D.K.O.; supervision: D.K.O., T.O. and S.C.M.L.-B.; writing and editing: D.A.E., S.C.M.L.-B., D.J.B. and D.F.; resources: D.F.; methodology: D.A.E.; formal analysis: T.O., C.B.-T. and C.C.; investigation: D.A.E., J.N. and A.S.; original draft preparation: D.A.E.; project administration: D.K.O. and S.C.M.L.-B.; funding acquisition: D.K.O. and S.C.M.L.-B. All authors have read and agreed to the published version of the manuscript.

Funding

This work was supported by the United States Agency for International Development (USAID) through Cooperative Agreement No. 7200AA 18CA00003 to the University of Georgia as management entity for U.S. Feed the Future Innovation Lab for Peanut (2018–2023). The contents are the responsibility of the authors and do not necessarily reflect the views of USAID or the United States Government. Supplemental funding was provided by the Scholarship Advert for Short Term Academic Mobility (SCIFSA) and the Regional Universities Forum for Capacity Building in Agriculture (RUFORUM).

Data Availability Statement

Not applicable.

Acknowledgments

The authors would like to acknowledge Jenny Leverett, Kevin Turner and Mark Hopkins for technical assistance.

Conflicts of Interest

The authors declare no conflict of interest.

References

  1. Bertioli, D.J.; Jenkins, J.; Clevenger, J.; Dudchenko, O.; Gao, D.; Seijo, G.; Leal-Bertioli, S.C.M.; Ren, L.; Farmer, A.D.; Pandey, M.K.; et al. The genome sequence of segmental allotetraploid peanut Arachis hypogaea. Nat. Genet. 2019, 51, 877–884. [Google Scholar] [CrossRef]
  2. Kochert, G.; Stalker, H.T.; Gimenes, M.; Galgaro, L.; Lopes, C.R.; Moore, K. RFLP and cytogenetic evidence on the origin and evolution of allotetraploid domesticated peanut, Arachis hypogaea (Leguminosae). Am. J. Bot. 1996, 83, 1282–1291. [Google Scholar] [CrossRef]
  3. Chintu, J.M.M. Breeding Groundnut for Resistance to Rosette Disease and Its Aphid Vector, Aphis craccivora Koch in Malawi. Ph.D. Thesis, University of KwaZulu-Natal, Durban, South Africa, 2013. [Google Scholar]
  4. Stalker, H.T. Utilizing wild species for peanut improvement. Crop Sci. 2017, 57, 1102–1120. [Google Scholar] [CrossRef]
  5. Naidu, R.A.; Kimmins, F.M.; Deom, C.; Subrahmanyam, P.; Chiyembekeza, A.J.; van der Merwe, P.J.A. Groundnut rosette: A virus disease affecting groundnut production in sub-Saharan africa. Plant Dis. 1999, 83, 700–709. [Google Scholar] [CrossRef]
  6. Okello, D.K.; Biruma, M.; Deom, C.M. Overview of groundnuts research in Uganda: Past, present and future. Afr. J. Biotechnol. 2010, 9, 6448–6459. [Google Scholar]
  7. Laker-Ojok, R. Returns to Oilseed and Maize Research in Uganda. In The Case of Groundnut and Sesame. MSU International Development Working Paper No. 45; University of Michigan, Department of Agronomical Economic: East Lansing, MI, USA, 1996. [Google Scholar]
  8. Subrahmanyam, P.; Hildebrand, G.L.; Naidu, R.A.; Reddy, L.J.; Singh, A.K. Sources of resistance to groundnut rosette disease in global groundnut germplasm. Ann. Appl. Biol. 1998, 132, 473–485. [Google Scholar] [CrossRef]
  9. Subrahmanyam, P.; McDonald, D.; Waliyar, F.; Reddy, L.J.; Nigam, S.N.; Gibbons, R.W.; Rao, V.R.; Singh, A.K.; Pande, S.; Reddy, P.M.; et al. Screening Methods and Sources of Resistance to Rust and Late Leaf Spot of Groundnut. In Technical Report Information Bulletin No 47; Tropics ICRIftS-A, Ed.; International Crops Research Institute for the Semi-Arid Tropics: Patancheru, Andhra Pradesh, India, 1995. [Google Scholar]
  10. Mohammed, K.E.; Afutu, E.; Odong, T.L.; Okello, D.K.; Nuwamanya, E.; Grigon, O.; Rubaihayo, P.R.; Okori, P. Assessment of groundnut (Arachis hypogaea L.) genotypes for yield and resistance to late leaf spot and rosette diseases. J. Exp. Agric. Int. 2018, 21, 1–13. [Google Scholar] [CrossRef]
  11. Waliyar, F.; Kumar, P.; Ntare, B.; Monyo, E.; Nigam, S.; Reddy, A.; Osiru, M.; Diallo, A. A Century of Research on Groundnut Rosette Disease and Its Management. In Information Bulletin; Tropics TRICRIftS-A, Ed.; International Crops Research Institute for the Semi-Arid Tropics: Patancheru, Andhra Pradesh, India, 2007; Volume 75. [Google Scholar]
  12. Wangai, A.; Pappu, S.; Pappu, H.; Deom, C.; Naidu, R. Distribution and characteristics of groundnut rosette disease in Kenya. Plant Dis. 2001, 85, 470–474. [Google Scholar] [CrossRef]
  13. Okello, D.K.; Akello, L.B.; Odong, T.L. Groundnut rosette disease symptoms types distribution and management of the disease in Uganda. Afr. J. Plant Sci. 2014, 8, 153–163. [Google Scholar]
  14. Nutman, F.J.; Roberts, F.M.; Williamson, J.G. Studies of varietal resistance in the groundnut, (Arachis hypogaea L.) to rosette disease. Rhod. J. Agric. Res. 1964, 2, 63–77. [Google Scholar]
  15. Bock, K.; Murant, A.; Rajeshwari, R. The nature of the resistance in groundnut to rosette disease. Ann. Appl. Biol. 1990, 117, 379–384. [Google Scholar] [CrossRef]
  16. Olorunju, P.E.; Kuhn, C.W.; Demski, J.W.; Misari, S.M.; Ansa, O.A. Disease reactions and yield performance of peanut genotypes grown under groundnut rosette and rosette-free field environments. Plant Dis. 1991, 75, 1269–1273. [Google Scholar] [CrossRef]
  17. Deom, C.M.; Naidu, R.A.; Chiyembekeza, A.J.; Ntare, B.R.; Subrahmanyam, P. Sequence diversity within the three agents of groundnut rosette disease. Phytopathology 2000, 90, 214–219. [Google Scholar] [CrossRef] [Green Version]
  18. Deom, C.M.; Okello, D.K. Developing Improved Varieties of Groundnut. In Achieving Sustainable Cultivation of Grain Legumes; Sivasankar, S., Bergvinson, D., Gaur, P., Kumar, S., Beebe, S., Tamo, M., Eds.; Burleigh Dodds Scientific Publishing: Cambridge, UK, 2018; Volume 2. [Google Scholar]
  19. Subrahmanyam, P.; Naidu, R.A.; Reddy, L.J.; Kumar, P.L.; Ferguson, M.E. Resistance to groundnut rosette disease in wild Arachis species. Ann. Appl. Biol. 2001, 139, 45–50. [Google Scholar] [CrossRef]
  20. Pande, S.; Rao, J.N. Resistance of wild Arachis species to late leaf spot and rust in greenhouse trials. Plant Dis. 2001, 85, 851–855. [Google Scholar] [CrossRef]
  21. Stalker, H.T.; Tallury, S.; Ozias-Akins, P.; Bertioli, D.J.; Leal-Bertioli, S. The value of diploid peanut relatives for breeding and genomics. Peanut Sci. 2013, 40, 70–88. [Google Scholar] [CrossRef]
  22. Bertioli, D.J.; Seijo, G.; Freitas, F.O.; Valls, J.F.; Leal-Bertioli, S.C.; Moretzsohn, M.C. An overview of peanut and its wild relatives. Plant Genet. Resour. 2011, 9, 134–149. [Google Scholar] [CrossRef]
  23. Fonceka, D.; Tossim, H.; Rivallan, R.; Vignes, H.; Lacut, E.; de Bellis, F.; Faye, I.; Ndoye, O.; Leal-Bertioli, S.; Valls, J.; et al. Construction of chromosome segment substitution lines in peanut (Arachis hypogaea L.) using a wild synthetic and QTL mapping for plant morphology. PLoS ONE 2012, 7, e48642. [Google Scholar] [CrossRef]
  24. Fonceka, D.; Tossim, H.A.; Rivallan, R.; Vignes, H.; Faye, I.; Ndoye, O. Fostered and left behind alleles in peanut: Interspecific QTL mapping reveals footprints of domestication and useful natural variation for breeding. BMC Plant Biol. 2012, 12, 26. [Google Scholar] [CrossRef]
  25. Moss, J.P.; Singh, A.K.; Reddy, L.J.; Nigam, S.N.; Subrahmanyam, P.; McDonald, D.; Reddy, A.G.S. Registration of ICGV 87165 Peanut Germplasm Line with Multiple Resistance. Crop Sci. 1998, 37, 1028. [Google Scholar] [CrossRef]
  26. Okello, D.; Deom, C.; Puppala, N. Registration of ‘Naronut 2T’ groundnut. J. Plant Regist. 2021, 15, 62–67. [Google Scholar] [CrossRef]
  27. Van der Merwe, P.J.A.; Subrahmanyam, P.; Hildebrand, G.L.; Reddy, L.J.; Nigam, S.N.; Chiyembekeza, A.J.; Busolo-Bulafu, C.M.; Kapewa, T. Registration of groundnut cultivar ICGV-SM 90704 with resistance to groundnut rosette. Int. Arachis Newsl. 2001, 21, 19–20. [Google Scholar]
  28. Bertioli, D.J.; Clevenger, J.; Godoy, I.J.; Stalker, H.T.; Wood, S.; Santos, J.F.; Ballén-Taborda, C.; Abernathy, B.; Azevedo, V.; Campbell, J.; et al. Legacy genetics of Arachis cardenasii in the peanut crop shows the profound benefits of international seed exchange. Proc. Natl. Acad. Sci. USA 2021, 118, e2104899118. [Google Scholar] [CrossRef]
  29. Nguepjop, J.R.; Tossim, H.-A.; Bell, J.M.; Rami, J.-F.; Sharma, S.; Courtois, B.; Mallikarjuna, N.; Sane, D.; Fonceka, D. Evidence of genomic exchanges between homeologous chromosomes in a cross of peanut with newly synthetized allotetraploid hybrids. Front. Plant Sci. 2016, 7, 1635. [Google Scholar] [CrossRef] [Green Version]
  30. Tossim, H.-A.; Nguepjop, J.R.; Diatta, C.; Sambou, A.; Seye, M.; Sane, D.; Rami, J.-F.; Fonceka, D. Assessment of 16 peanut (Arachis hypogaea L.) CSSLs derived from an interspecific cross for yield and yield component traits: QTL validation. Agronomy 2020, 10, 583. [Google Scholar] [CrossRef]
  31. Faye, I.; Hodo-Abalo, T.; Ndoye, O.; Fonceka, D. Dossier Technique D’homologation de Nouvelles Variétés D′Arachide; ISRA, Ed.; Ministry of Agriculture: Dakar, Senegal, 2016; Volume 34. [Google Scholar]
  32. Mallikarjuna, N.; Senthilvel, S.; Hoisington, D. Development of new sources of tetraploid Arachis to broaden the genetic base of cultivated groundnut (Arachis hypogaea L.). Genet. Resour. Crop Evol. 2011, 58, 889–907. [Google Scholar] [CrossRef]
  33. Sambou, A. Genetic Studies and Mapping of Beneficial Alleles from Wild Species to Improve Agronomic Traits in Cultivated Groundnut (Arachis hypogaea L.); University of Legon: Accra, Ghana, 2017. [Google Scholar]
  34. Fávero, A.P.; Simpson, C.E.; Valls, F.M.J.; Velo, N.A. Study of evolution of cultivated peanut trough crossability studies among Arachis ipaënsis, A duranensis and A hypogaea. Crop Sci. 2006, 46, 1546–1552. [Google Scholar] [CrossRef]
  35. Leal-Bertioli, S.C.M.; Godoy, I.J.; Santos, J.F.; Doyle, J.J.; Guimarães, P.M.; Abernathy, B.L.; Jackson, S.A.; Moretzsohn, M.C.; Bertioli, D.J. Segmental allopolyploidy in action: Increasing diversity through polyploid hybridization and homoeologous recombination. Am. J. Bot. 2018, 105, 1053–1066. [Google Scholar] [CrossRef]
  36. Fonceka, D.; Hodo-Abalo, T.; Rivallan, R.; Faye, I.; Sall, M.N.; Ndoye, O.; Favero, A.P.; Bertioli, D.J.; Glaszmann, J.C.; Courtois, B.; et al. Genetic mapping of wild introgressions into cultivated peanut: A way toward enlarging the genetic basis of a recent allotetraploid. BMC Plant Biol. 2009, 9, 103. [Google Scholar] [CrossRef]
  37. Shaner, G.; Finney, R.E. The effect of nitrogen fertilization on the expression of slow-mildewing resistance in Knox wheat. Phytopathology 1977, 67, 1051–1056. [Google Scholar] [CrossRef]
  38. Johnson, H.W.; Robinson, H.; Comstock, R. Estimates of genetic and environmental variability in soybeans 1. Agron. J. 1955, 47, 314–318. [Google Scholar] [CrossRef]
  39. Team, R.D.C. R: A Language and Environment for Statistical Computing. In R Foundation for Statistical Computing; R Core Team: Vienna, Austria, 2014. [Google Scholar]
  40. Korani, W.; Clevenger, J.P.; Chu, Y.; Ozias-Akins, P. Machine learning as an effective method for identifying true single nucleotide polymorphisms in polyploid plants. Plant Genome 2019, 12, 180023. [Google Scholar] [CrossRef]
  41. Bertioli, D.J.; Cannon, S.B.; Froenicke, L.; Huang, G.; Farmer, A.D.; Cannon, E.K.S.; Liu, X.; Gao, D.; Clevenger, J.; Dash, S.; et al. The genome sequences of Arachis duranensis and Arachis ipaensis, the diploid ancestors of cultivated peanut. Nat. Genet. 2016, 48, 438–446. [Google Scholar] [CrossRef]
  42. Broman, K.W. Sen S; Springer: Berlin, Germany, 2009. [Google Scholar]
  43. Churchill, G.A.; Doerge, R.W. Empirical threshold values for quantitative trait mapping. Genetics 1994, 138, 963–971. [Google Scholar] [CrossRef]
  44. Broman, K.W.; Wu, H.; Sen, S.; Churchill, G.A. R/qtl: QTL mapping in experimental crosses. Bioinformatics 2003, 19, 889–890. [Google Scholar] [CrossRef]
  45. Leal-Bertioli, S.C.; Moretzsohn, M.C.; Santos, S.P.; Brasileiro, A.C.; Guimarães, P.M.; Bertioli, D.J.; Araujo, A.C. Phenotypic effects of allotetraploidization of wild Arachis and their implications for peanut domestication. Am. J. Bot. 2017, 104, 379–388. [Google Scholar] [CrossRef]
  46. Alyr, M.H.; Pallu, J.; Sambou, A.; Nguepjop, J.R.; Seye, M.; Tossim, H.A.; Djiboune, Y.R.; Sane, D.; Rami, J.F.; Fonceka, D. Fine-mapping of a wild genomic region involved in pod and seed size reduction on chromosome A07 in peanut (Arachis hypogaea L.). Genes 2020, 11, 1402. [Google Scholar] [CrossRef]
  47. Mugisa, I.O.; Karungi, J.; Akello, B.; Ochwo-Ssemakula, M.K.N.; Biruma, M.; Okello, D.K.; Otim, G. Assessing the effect of farmers’ practices on the severity of groundnut rosette virus disease in Uganda. Afr. J. Agric. Res. 2015, 10, 995–1003. [Google Scholar] [CrossRef]
  48. Gonzales, M.; Kemerait, R.; Bertioli, D.; Bertioli, S. Strong resistance to early and late leaf spot in peanut-compatible wild-derived induced allotetraploids. Plant Dis. 2022. [Google Scholar] [CrossRef]
  49. Michelotto, M.D.; Barioni, W., Jr.; Resende, M.D.V.; Godoy, I.J.; Leonardecz, E.; Fávero, A.P. Identification of fungus resistant wild accessions and interspecific hybrids of the genus Arachis. PLoS ONE 2015, 10, e0128811. [Google Scholar] [CrossRef]
  50. Bua, B.; Opio, M. Variability in reactions of groundnuts varieties to groundnut rosette virus isolates from Uganda. Am. J. Exp. Agric. 2014, 4, 541–549. [Google Scholar] [CrossRef]
  51. Tshilenge-Lukanda, L.; Nkongolo, K.K.C.; Kalonji-Mbuyi, A.; Kizungu, R.V. Epidemiology of the groundnut (Arachis hypogaea L.) leaf spot disease: Genetic analysis and developmental cycles. Am. J. Plant Sci. 2012, 2012, 19476. [Google Scholar]
  52. Clevenger, J.; Chu, Y.; Chavarro, C.; Botton, S.; Culbreath, A.; Isleib, T.G.; Holbrook, C.C.; Ozias-Akins, P. Mapping late leaf spot resistance in peanut (Arachis hypogaea) using QTL-seq reveals markers for marker-assisted selection. Front. Plant Sci. 2018, 9, 83. [Google Scholar] [CrossRef]
  53. Khera, P.; Pandey, M.K.; Mallikarjuna, N.; Sriswathi, M.; Roorkiwal, M.; Janila, P.; Sharma, S.; Shilpa, K.; Sudini, H.; Guo, B. Genetic imprints of domestication for disease resistance, oil quality, and yield component traits in groundnut (Arachis hypogaea L.). Mol. Genet. Genom. 2019, 294, 365–378. [Google Scholar] [CrossRef]
  54. Kolekar, R.M.; Sujay, V.; Shirasawa, K.; Sukruth, M.; Khedikar, Y.P.; Gowda, M.V.C.; Pandey, M.K.; Varshney, R.K.; Bhat, R.S. QTL mapping for late leaf spot and rust resistance using an improved genetic map and extensive phenotypic data on a recombinant inbred line population in peanut (Arachis hypogaea L.). Euphytica 2016, 209, 147–156. [Google Scholar] [CrossRef]
  55. Pandey, M.K.; Khan, A.W.; Singh, V.K.; Vishwakarma, M.K.; Shasidhar, Y.; Kumar, V.; Garg, V.; Bhat, R.S.; Chitikineni, A.; Janila, P.; et al. QTL-seq approach identified genomic regions and diagnostic markers for rust and late leaf spot resistance in groundnut (Arachis hypogaea L.). Plant Biotechnol. J. 2017, 15, 927–941. [Google Scholar] [CrossRef]
  56. Han, S.; Yuan, M.; Clevenger, J.P.; Li, C.; Hagan, A.; Zhang, X.; Chen, C.; He, G. A SNP-based linkage map revealed QTLs for resistance to early and late leaf spot diseases in peanut (Arachis hypogaea L.). Front. Plant Sci. 2018, 9, 1012. [Google Scholar] [CrossRef]
  57. Liang, Y.; Baring, M.; Wang, S.; Septiningsih, E.M. Mapping QTLs for leafspot resistance in peanut using SNP-based next-generation sequencing markers. Plant Breed. Biotechnol. 2017, 5, 115–122. [Google Scholar] [CrossRef]
  58. Zhou, X.; Xia, Y.; Liao, J.; Liu, K.; Li, Q.; Dong, Y.; Ren, X.; Chen, Y.; Huang, L.; Liao, B.; et al. Quantitative trait locus analysis of late leaf spot resistance and plant-type-related traits in cultivated peanut (Arachis hypogaea L.) under multi-environments. PLoS ONE 2016, 11, e0166873. [Google Scholar] [CrossRef]
  59. Leal-Bertioli, S.C.; Jose, A.C.; Alves-Freitas, D.M.; Moretzsohn, M.C.; Guimaraes, P.M.; Nielen, S. Identification of candidate genome regions controlling disease resistance in Arachis. BMC Plant Biol. 2009, 9, 112. [Google Scholar] [CrossRef] [Green Version]
Figure 1. Frequency distribution of yield (g/m2) (a) and Days to flowering (b) among the three interspecific populations: AB-QTL1, AB-QTL2 and CSSLs. Number of individuals in y-axis and phenotypic values in x-axis. Local checks are indicated by red arrows and most productive lines indicated by black arrows.
Agronomy 12 02202 g001
Figure 2. Examples of seeds of the three interspecific populations: CSSLs (Fleur11 x [A. ipaënsis x A. duranensis]4x), AB-QTL1 (Fleur11 x [A. batizocoi x A. duranensis]4x), AB-QTL2 (Fleur11 x [A. duranensis x A. valida]4x) and cultivated controls. Note that Fleur 11 is the female parent of all three populations.
Agronomy 12 02202 g002
Figure 3. Frequency distribution of disease resistance in all three populations: LLS severity at harvest (a), LLS Area Under the Disease Progression Curve (AUDPC) (b), GRD Severity at harvest (c) and GRD Area Under the Disease Progression Curve (AUDPC) (d). Local checks are indicated by red arrows.
Agronomy 12 02202 g003
Figure 4. Pearson correlations for yield, LLS and GRD evaluated over 3 years. Dark blue for the highest positive value and dark red for the highest negative value and white for the lowest value on the heatmap scale. Values with *, ** and *** implies significant at p = 0.05, p < 0.01 and p < 0.001 respectively. LLS_4 = Late Leaf Spot at 4 weeks; LLS_8 = Late Leaf Spot at 8 weeks; LLS_12 = Late Leaf Spot at 12 weeks; LLS_H = Late Leaf Spot at harvest; LLS AUDPC = Late Leaf Spot Area Under the disease Progress Curve; PDI_4 = Percentage Disease Incidence at 4 weeks, PDI_8 = Percentage Disease Incidence at 4 weeks; PDI_12 = Percentage Disease Incidence at 12 weeks; GRD AUDPC = groundnut rosette disease Area Under Disease Progress Curve.
Agronomy 12 02202 g004
Figure 5. QTL effect plot of Log transformed data from mapping population AB-QTL1 = Fleur11 x [A. batizocoi x A. duranensis]4x) on chromosome B04: LLS severity at 12 weeks in Nakabango in the 2020 season (a), LLS AUDPC in Nakabango in the 2020 season (b), GRD PDI@8 weeks in Nakabango in the 2020 season (c); chromosome B01: GRD PDI AUDPC in Nakabango in the 2020 season (d); chromosome B05: GRD PDI @ 4 weeks in Nakabango in the 2020 season (e) and chromosome A08: GRD severity in Serere in the 2020 season (f). Phenotype values on logarithmic scale (Y-axis) as a function of genotypic class (X-axis). Wild = effect of allele from wild donor; cultivated = effect of allele from cultivated donor. Bars at each genotypic class represent standard error of mean.
Agronomy 12 02202 g005
Figure 6. Graphical genotypes of the 122 CSSLs [derived from Arachis hypogaea cv. Fleur 11 and the allotetraploid AiAd (= IpaDur1 = [A. ipaensis KG30076 x A. duranensis V14167]4x). SSR markers are represented vertically. Chromosome substitution lines are represented horizontally. The dark blue areas represent wild chromosome segments, while the light blue areas represent the Fleur11 genetic background. Red areas represent the wild supernumerary chromosome segments. More details to the markers and lines represented in this figure can be found in Fonceka et al., 2012 [23]. Two of the lines with largest seed are highlighted here along with the respective SSR marker: 12CS_098/A04_06.7.8. and 12CS_101/A08_03.4.
Agronomy 12 02202 g006
Table 1. Mean, range and p-values yield component traits for three population of interspecific lines of groundnut in Serere, 2019B season.
MeanRange
TraitAB-QTL2AB-QTL1CSSLFleur11AB-QTL2AB-QTL1CSSLp
PNP15.4 a15.9 a16.9 a21.3 a6.6–26.06.6–21.47.9–25.60.37
HSW68.1 a65.41 b70.65 a67.1 ab38.2–95.738.7–88.551.9–92.00.00
SY103.9 b85.3 ab117.3 a150.6 ab14.5–239.810.5–221.737.0–283.30.03
DTF32.7 a32.8 a32.60 a31.5 a30.0–3528.2–36.230.7–35.70.48
NB: PNP = Pod number per plant, HSW = 100 seed weight, SY = seed yield in g/m2, DTF = Day to 50% flowering, AB-QTL2 = (Fleur11 x [A. valida x A. duranensis]4x), AB-QTL1 = (Fleur11 x [A. batizocoi x A. duranensis]4x), CSSL = Fleur11 x [A. ipaensis x A. duranensis]4x. Values proceeded by the same letter are not significantly different from each other at p < 0.05.
Table 2. Means, standard error, coefficient of variation (CV %) and heritability for groundnut rosette and late leaf spot diseases.
TraitAB-QTL1AB-QTL2CSSLDif
Mean ± SECV %H2Mean ± SECV %H2Mean ± SECV %H2
LLS@4WEEKS1.73 ± 0.0214.6101.72 ± 0.0230.90.061.70 ± 0.0333.50.32*
LLS@8WEEKS3.56 ± 0.0211.050.143.48 ± 0.0215.10.113.50 ± 0.0314.30**
LLS@12WEEKS5.94 ± 0.0310.840.495.91 ± 0.0211.20.565.98 ± 0.058.80.24**
LLS@Harvest6.80 ± 0.0310.410.396.82 ± 0.0210.40.546.0.09 ± 0.058.70.32**
LLS AUDPC221.80 ± 0.88319.420.45218.91 ± 0.7210.90.43220.18 ± 1.4910.10.19**
PDI@4WEEKS3.00 ± 0.2982.561.14 × 10−132.94 ± 0.24281.103.14 ± 0.50200.00ns
PDI@8WEEKS25.21 ± 0.9232.090.1023.01 ± 0.7060.10.3926.45 ± 1.5169.90.07**
PDI@12WEEKS47.31 ± 1.2226.28NC45.38 ± 0.9936.80.4046.17 ± 2.0123.50.21**
GRD Severity2.55 ± 0.0647.120.042.44 ± 0.0530.70.482.48 ± 0.1018.9 **
GRD AUDPC151.10 ± 44.4347.66NC141.30 ± 34.7049.20.43153 ± 74.4845.60.11**
* Indicates significant differences at p < 0.05. ** indicates significance difference at p < 0.01 between means of AB-QTL1 (Fleur11 x [A. batizocoi x A. duranensis]4x), AB-QTL2 (Fleur11 x [A. valida x A. duranensis]4x) and CSSL (Fleur11 x [A. ipaensis x A. duranensis]4x tested by one-way ANOVA using Tukey’s test; ns, non-significance. LLS = late leaf spot. PDI = percentage of groundnut rosette disease incidence. GRD = groundnut rosette disease. AUDPC = area under the disease progress curve. NC = not calculated.
Table 3. Details of QTLs for LLS and GRD resistance identified in the AB-QTL1 population (Fleur11 x [A. batizocoi × A. duranensis]4x).
Trait NameTrait
Description
Nearest MarkerLGPhysical Position (Mb)LODp-ValLOD Threshold (5%)99% Bayes
Interval (Mb)
R2 (%)
LLS_12_WEEKS_NAK_20LLS@12 wk Nakabango 2020B04_17,705,669B0417.703.040.042.797.08–90.029.43
LLS_AUDPC_NAK_20LLS AUDPC Nakabango 2020B04_9,708,846B049.713.000.032.847.08–90.029.60
GRD_PDI_SEV_SER_20GRD Severity Serere 2020A08_22,758,270A0822.803.200.022.7822.76–23.427.90
GRD_PDI_AUDPC_NAK_20GRD AUDPC Nakabango 2020B01_62,384,869B0162.402.810.052.777.45–121.3711.04
GRD_PDI_8_WEEKS_NAK_20GRD PDI@8 wk Nakabango 2020B04_10,528,843B0410.502.760.052.756.62–115.8612.56
GRD_PDI_4_WEEKS_NAK_20GRD PDI@4 wk Nakabango 2020B05_138,125,178B05138.003.230.032.941.5–146.5811.51
LLS_12_WEEKS_NAK_20 = late leaf spot at 12 weeks at Nakabango, 2020; LLS_AUDPC_NAK_20 = late leaf spot AUDPC at Nakabango, 2020; GRD_SEV_SER_20 = groundnut rosette disease severity at Serere 2020; GRD_PDI_AUDPC_NAK_20 = Groundnut Rosette disease Area Under Disease progress curve at Nakabango, 2020; GRD_PDI_8_WEEKS_NAK_20 = Percentage Disease Incidence at 8 weeks at Nakabango, 2020; GRD_PDI_4_WEEKS_NAK_20 = Percentage disease incidence at 4 weeks at Nakabango, 2020; LG = Linkage group; LOD = Logarithm of odds; p-val = significance level; R2 = Proportion of the phenotypic variance explained by the QTL.
Publisher’s Note: MDPI stays neutral with regard to jurisdictional claims in published maps and institutional affiliations.

