Article

QTL Analysis and Heterosis Loci of Effective Tiller Using Three Genetic Populations Derived from Indica-Japonica Crosses in Rice

1
State Key Laboratory of Hybrid Rice, Key Laboratory for Research and Utilization of Heterosis in Indica Rice, Ministry of Agriculture, College of Life Sciences, Wuhan University, Wuhan 430072, China
2
Wuhan Wuda-Tianyuan Biotechnology Co., Ltd., Wuhan 430072, China
3
Shenzhen Branch, Guangdong Laboratory for Lingnan Modern Agriculture, Genome Analysis Laboratory of the Ministry of Agriculture, Agricultural Genomics Institute at Shenzhen, Chinese Academy of Agricultural Sciences, Shenzhen 518120, China
*
Author to whom correspondence should be addressed.
These authors contributed equally to this work.
Agronomy 2022, 12(9), 2171; https://doi.org/10.3390/agronomy12092171
Submission received: 18 August 2022 / Revised: 5 September 2022 / Accepted: 7 September 2022 / Published: 13 September 2022
(This article belongs to the Special Issue A Themed Issue in Memory of Academician Zhu Yingguo (1939–2017))

Abstract

:
Effective panicle numbers (PNs) and Tiller numbers (TNs) are important traits affecting rice (Oryza sativa L.) architecture and grain yield. However, the molecular mechanisms underlying PN and TN heterosis remain unknown in rice. In addition, new PN- or TN-related genes need to be detected and discovered. In this study, in order to detect rice quantitative trait loci (QTLs) and the heterosis-related loci of PN or TN in rice, we developed a high generation recombinant inbred line (RIL) population from a cross of two elite cultivars, Luohui9 (Xian/Indica) and RPY geng (Geng/Japonica), and two testcross hybrid populations derived from the crosses of RILs and two cytoplasmic male sterile lines, YTA (Xian/Indica) and Z7A (Geng/Japonica). Finally, nine QTLs of PN across four seasons were identified, and two QTLs of TN in 191HB were mapped. Besides this, six heterosis-related QTLs of PN and five heterosis-related QTLs of TN were located. We found that heterosis-related QTLs of PN or TN covered multiple known genes, such as MOC1, TAC1 and OsETR2. Furthermore, homologous gene analysis identified one candidate gene of PN (LOC_10g25720). Together, these findings uncover multiple heterosis-related loci, and provide a new insight into the heterosis mechanism of PN and TN in rice.

1. Introduction

Rice (Oryza sativa L.) is a stable food and one of the major crops in the world. Owing to the impacts of population growth and limited arable land, breeders and scientists face the challenge of cultivating higher-yield potential crops. Rice yield is a complex agronomic trait composed of four main factors, including PN, grain number per panicle, seed setting rate and 1000 grain weight. PN is an important component of grain yield. Stable PN is one of the most important characteristics of ideal plant architecture [1]. Exploring the molecular genetic mechanisms of PN is a key strategy to increase grain yield.
The dynamic change in tiller numbers (TNs) may determine the final PN [2], and PN is highly associated with TN. TN is one of most unstable and complex agronomic traits controlled by multiple genes. In the past few decades, the genetic dissection of TN by high-density molecular marker linkage mapping has uncovered a large number of QTLs. The meta-analysis of QTLs was used to merge multiple QTLs from different rice genetic populations and identify consensus and stable QTLs, which enhanced the reliability of, and narrowed down, the confidence interval [3]. Given its high reliability, Meta-QTL (MQTL) has been widely used in crop breeding [4,5,6,7,8]. In total, 77 QTLs for TN, published from 1996 to 2019, been analyzed, resulting in 10 MQTLs in rice [9].
A tiller is mainly formed via two distinct processes: the formation of an axillary bud, and its subsequent outgrowth [10]. Several key genes controlling tiller and panicle numbers have been cloned through the isolation of rice tiller formation mutants, such as MOC1, MOC2, LAX1 and LAX2 [11,12,13]. As the first key gene controlling rice tillering, MOC1 encodes a GRAS family nuclear protein, and is mainly expressed in axillary buds, moreover, MOC1 initiates axillary bud growth and promotes their outgrowth in rice [14]. In addition, MOC1 acts as a co-activator of MOC3, and MOC3 can directly bind the promoter of FLORAL ORGAN NUMBER1 (FON1). MOC1 and MOC3 physically interact to regulate tiller bud outgrowth via the expression of FON1 [12]. MOC2 encodes cytosolic fructose-1,6-bisphosphatase 1 (FBP1) and promotes tiller bud outgrowth through participating in the sucrose biosynthesis pathway [15]. OsNAC23, a sugar-inducible NAC transcription factor, directly binds the promoter of the Tre6P phosphatase gene TPP1 and elevates Tre6P in rice. Furthermore, overexpressing OsNAC23 in three different rice cultivar backgrounds increases the Tre6P content, and enables the accumulation of more panicle numbers and a higher yield [16]. Moreover, few TN- or PN-related genes have been cloned through the mapping of genetic populations [17].
As a major determinant of rice architecture, rice tillering is found to be associated with multiple plant hormones, such as brassinosteroids (BRs), auxins, cytokinins (CKs), strigolactones (SLs), and ethylene. D10 encodes carotenoid cleavage dioxygenase 8 and affects rice tillering through participating in strigolactone biosynthesis; the expression of D10 is induced by the exogenous auxin [18], which indicates that rice tillering is affected by both auxin and SLs. Moreover, SLs integrate with CKs to regulate rice tillering. The interaction among SLs, CKs, and auxin controls rice tillering [19].
In this study, Luohui9 was found to be an elite Xian/Indica cultivar, and RPY geng was an elite Geng/Japonica cultivar. The F1 progeny of Luohui9 and RPY gneg exhibit obvious heterosis in terms of PN. In order to detect QTLs for PN and TN, and uncover the heterosis loci for PN and TN, a high-generation RIL population derived from the cross between Luohui9 and RPY geng was developed, and two testcross hybrid populations derived from the crosses of RILs and two cytoplasmic male sterile lines, YTA (Xian/Indica) and Z7A (Geng/Japonica), were constructed. A high-density bin map was constructed [20], and the genomes of Luohui9 and RPY geng were de novo assembled [6]. Nine QTLs of PN were detected in RILs, and six heterosis-related QTLs of PN were mapped in two testcross populations. Besides this, homologous blast identified new candidate genes in a novel QTL cluster. This study used three genetic populations to identify multiple QTLs and heterosis-related QTLs for PN, and provided new insight into the heterosis mechanism of PN in rice.

2. Materials and Methods

2.1. Plant Materials and Population Construction

Luohui9 has been used as the female parent to cross with RPY geng since 2011; the F1 plant was self-crossed, and then inbred over 10 generations by single-seed breeding to generate an RIL population containing 272 inbred lines [20,21]. To detect PN and TN heterosis-related QTLs, we used the RILs (F14) to cross with an Xian/Indica-type cytoplasmic male sterile line, YTA and a Geng/Japonica-type cytoplasmic male sterile line, ZTA, respectively, and generated two testcross hybrid populations, 209 YTA-TCF1 and 173 Z7A-TCF1.
In 2017–2018, RILs (F11, F12, F14, and F16) and their parents were planted in the experimental fields of the Ezhou Rice Breeding Experimental Base of Wuhan University in summer and autumn, and at the Rice Experimental Base of Tianyuan Co., Ltd. in Lingshui County, Hainan Province, in winter and spring every year. F11 was placed in HN (abbreviated as HN162), F12 in HB (abbreviated as HB171), F14 in HB (abbreviated as HB181), and F16 in HB (abbreviated as HB191). Two testcross hybrid populations and their parents were planted at the Hannan Breeding Experimental Base of Tianyuan Co., Ltd. in Hannan District, Wuhan City, Hubei Province from May to October 2019. All plants were planted under standard agricultural planting management procedures. A randomized complete block design was employed for RILs, and two testcross populations and 15 replications for Luohui9 and RPY geng were used to evaluate the overall uniformity of the experimental field.

2.2. Trait Statistics

Sixty plants of each line from RILs and two testcross populations were planted in six rows, with ten plants per row. The spacing of plants and lines was 13.3 cm × 20 cm and 30 cm, respectively. The PN of RILs was surveyed in the four environments (HB191, HB181, HB171, and HN162). The TN of RILs was surveyed in the HB191 environment. The PN and TN of two testcross populations (YTA-TCF1 and Z7A-TCF1 population) were investigated in the HB191 environment. Each inbred line was used to plant 60 individual plants. For PN, 5 individual plants were chosen and counted, and the average value of 5 individual plants of PN was considered as the value of the inbred line of PN. For TN, 9 individual plants were chosen and counted, and the average value of 9 individual plants of TN was considered as the value of the inbred line of TN.

2.3. Bin Mapping-Based QTL Analysis

The genetic linkage maps of 272 RILs, including 4578 bin blocks with the total bin-map distance of 2356.41 cm, were previously constructed in our lab [21]. The QTL mapping of PN and TN was performed in the R package “R/qtl” [22], the CIM interval mapping method was adopted, and the LOD threshold was set at 2.5. The confidence interval was calculated with the function “lodint” [23]. The drop value was set to 1.5. We filtered QTLs with regions greater than 7 Mb. The MQTLs of TN were derived from [6]. The visualization distributions of QTLs and PN-related known genes in the chromosome were generated by the Mapchart software [24].

2.4. Heterosis Analysis

For the mapping of heterosis-related loci, the MH, TH, and PH values were calculated by the formulas: MH = [F1 − (P1 + P2)/2]/[(P1 + P2)/2]; LH = [F1 − P2]/P2(P1 > P2); TH = [F1 − P1]/P1(P1 > P2) [25]. MH represents middle-parent heterosis, LH represents lower-parent heterosis, and TH represents transgressive heterosis, while P1 and P2 represent the parents. The QTL mapping of PN and TN heterosis-related indexes was performed using the R package “R/qtl” [22], while PN and TN heterosis-related indexes were counted by the MH, TH, and PH values with the formula y = 2x. The CIM interval mapping method was adopted and the LOD threshold was set at 2.5. The confidence interval was calculated with the function “lodint” [23]. The drop value was set at 1.5. We filtered QTLs with regions greater than 7 Mb.

2.5. Candidate Gene Prediction

Because most homologous genes have the same or similar functions, the protein sequences of 157 PN-related known genes were collected from http://rice.plantbiology.msu.edu/pub/data/Eukaryotic_Projects/o_sativa/annotation_bs/pseudomolecules/version_7.0/all.dir/ (accessed on 8 October 2021) as the query sequences for blast analysis. We extracted the protein sequence of the genes contained in the QTL region as blastdb. Homologous genes were identified with blast P with an evalue 1 × 10⁻²⁰. The protein sequence of the homologous genes was extracted from the RPY geng and Luohui9 genome documents for further sequence alignments by DNAman. Homologous genes with no difference between the parents were not considered as candidate genes. Further, the PNs for RILs with male parental genotypes and with female parent genotypes in multiple environments were compared. The homologous genes for which the male parental genotype and the female parental genotype manifested significant differences in terms of PNs for RILs in all four different environments were consider as the candidate genes [7,26].

3. Results

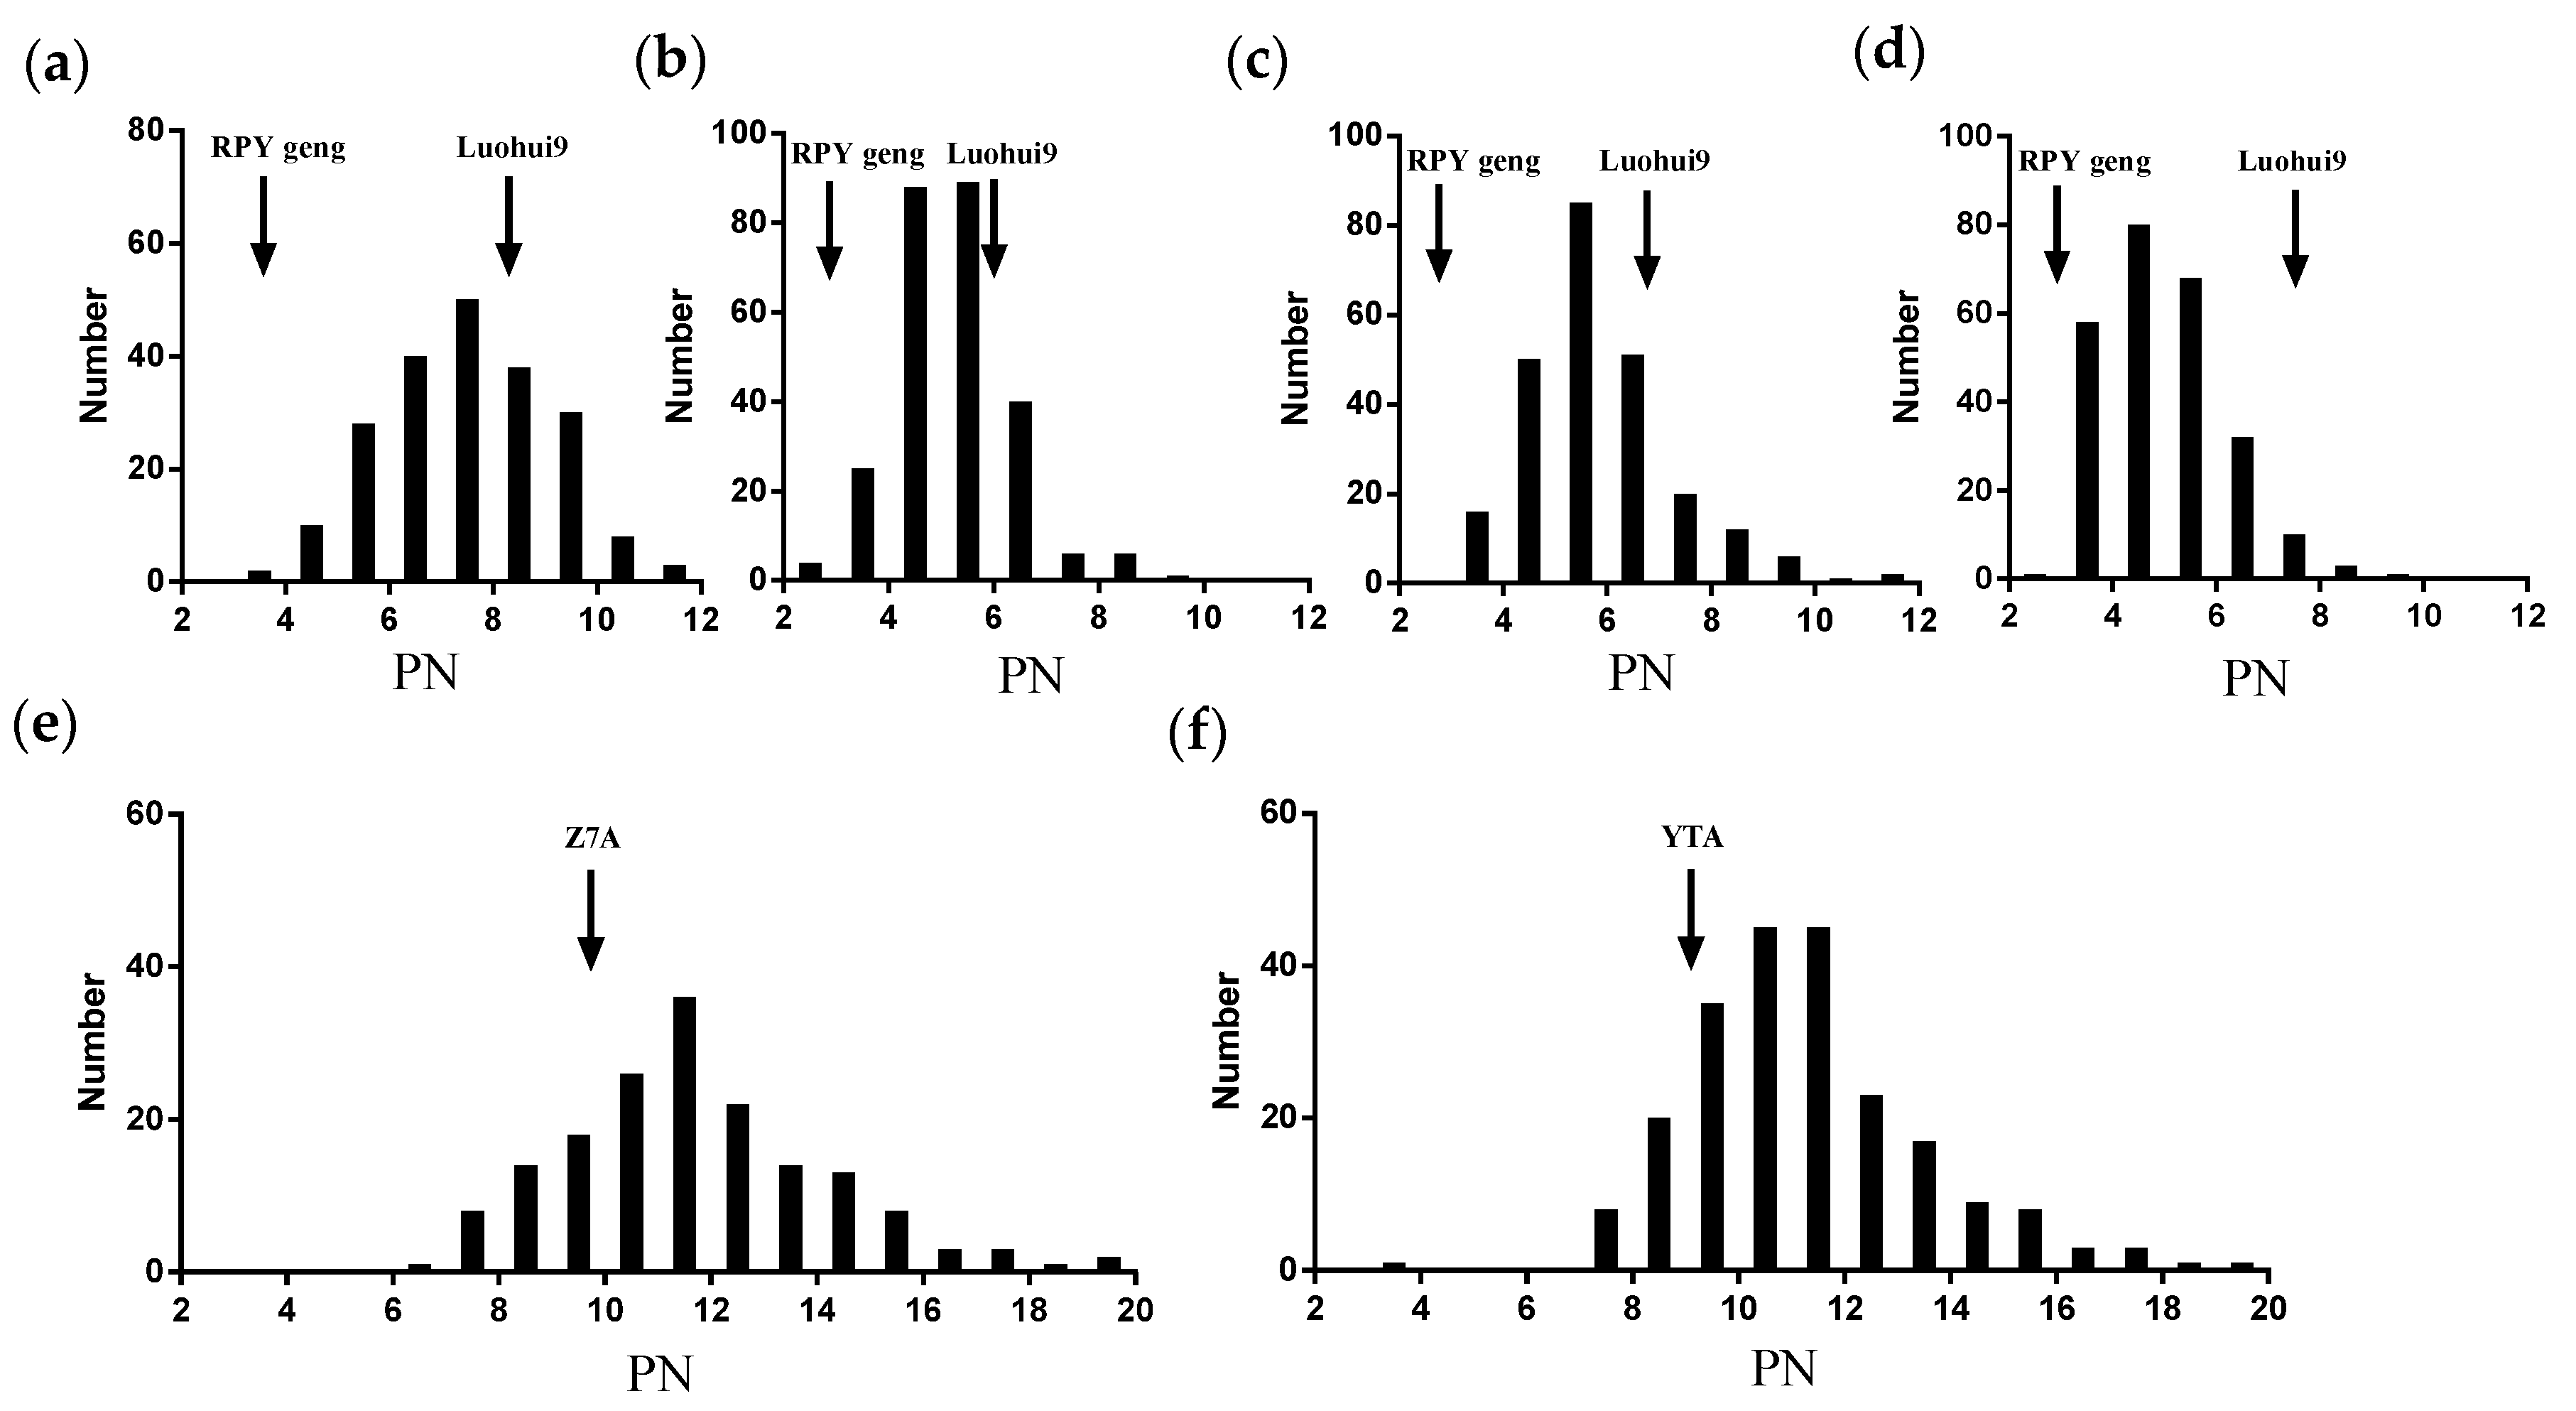
3.1. The Trait Performance of Effective Panicle Numbers per Plant (PN) from the RILs and the Testcross Hybrid Populations

Here, the PNs of RILs were investigated in Hubei (HB) or Hainan (HN) over four growing seasons. The PNs of the testcross hybrid populations were investigated in Hubei in 2019. The PNs in RILs and two testcross populations all showed normal distributions, indicating that PN and PN heterosis-related traits were typical quantitative traits involving multiple genes (Figure 1). The PN of Luohui9 was more than that of RPY geng. The phenotypic variation and average of the PN trait from RILs and two testcross populations were compared in HB191. The PN of RILs mainly ranged from 3.20 to 11.80, while that of the YTA-TCF1 population ranged from 4.00 to 20.00, and that of the ZTA-TCF1 population ranged from 7.00 to 20.00. The variations in PN in the testcross hybrid populations were larger than those in the RILs. Besides this, the average values of PN for RILs were significantly lower than those of the YTA-TCF1 population and the Z7A-TCF1 population (Supplemental Table S1).

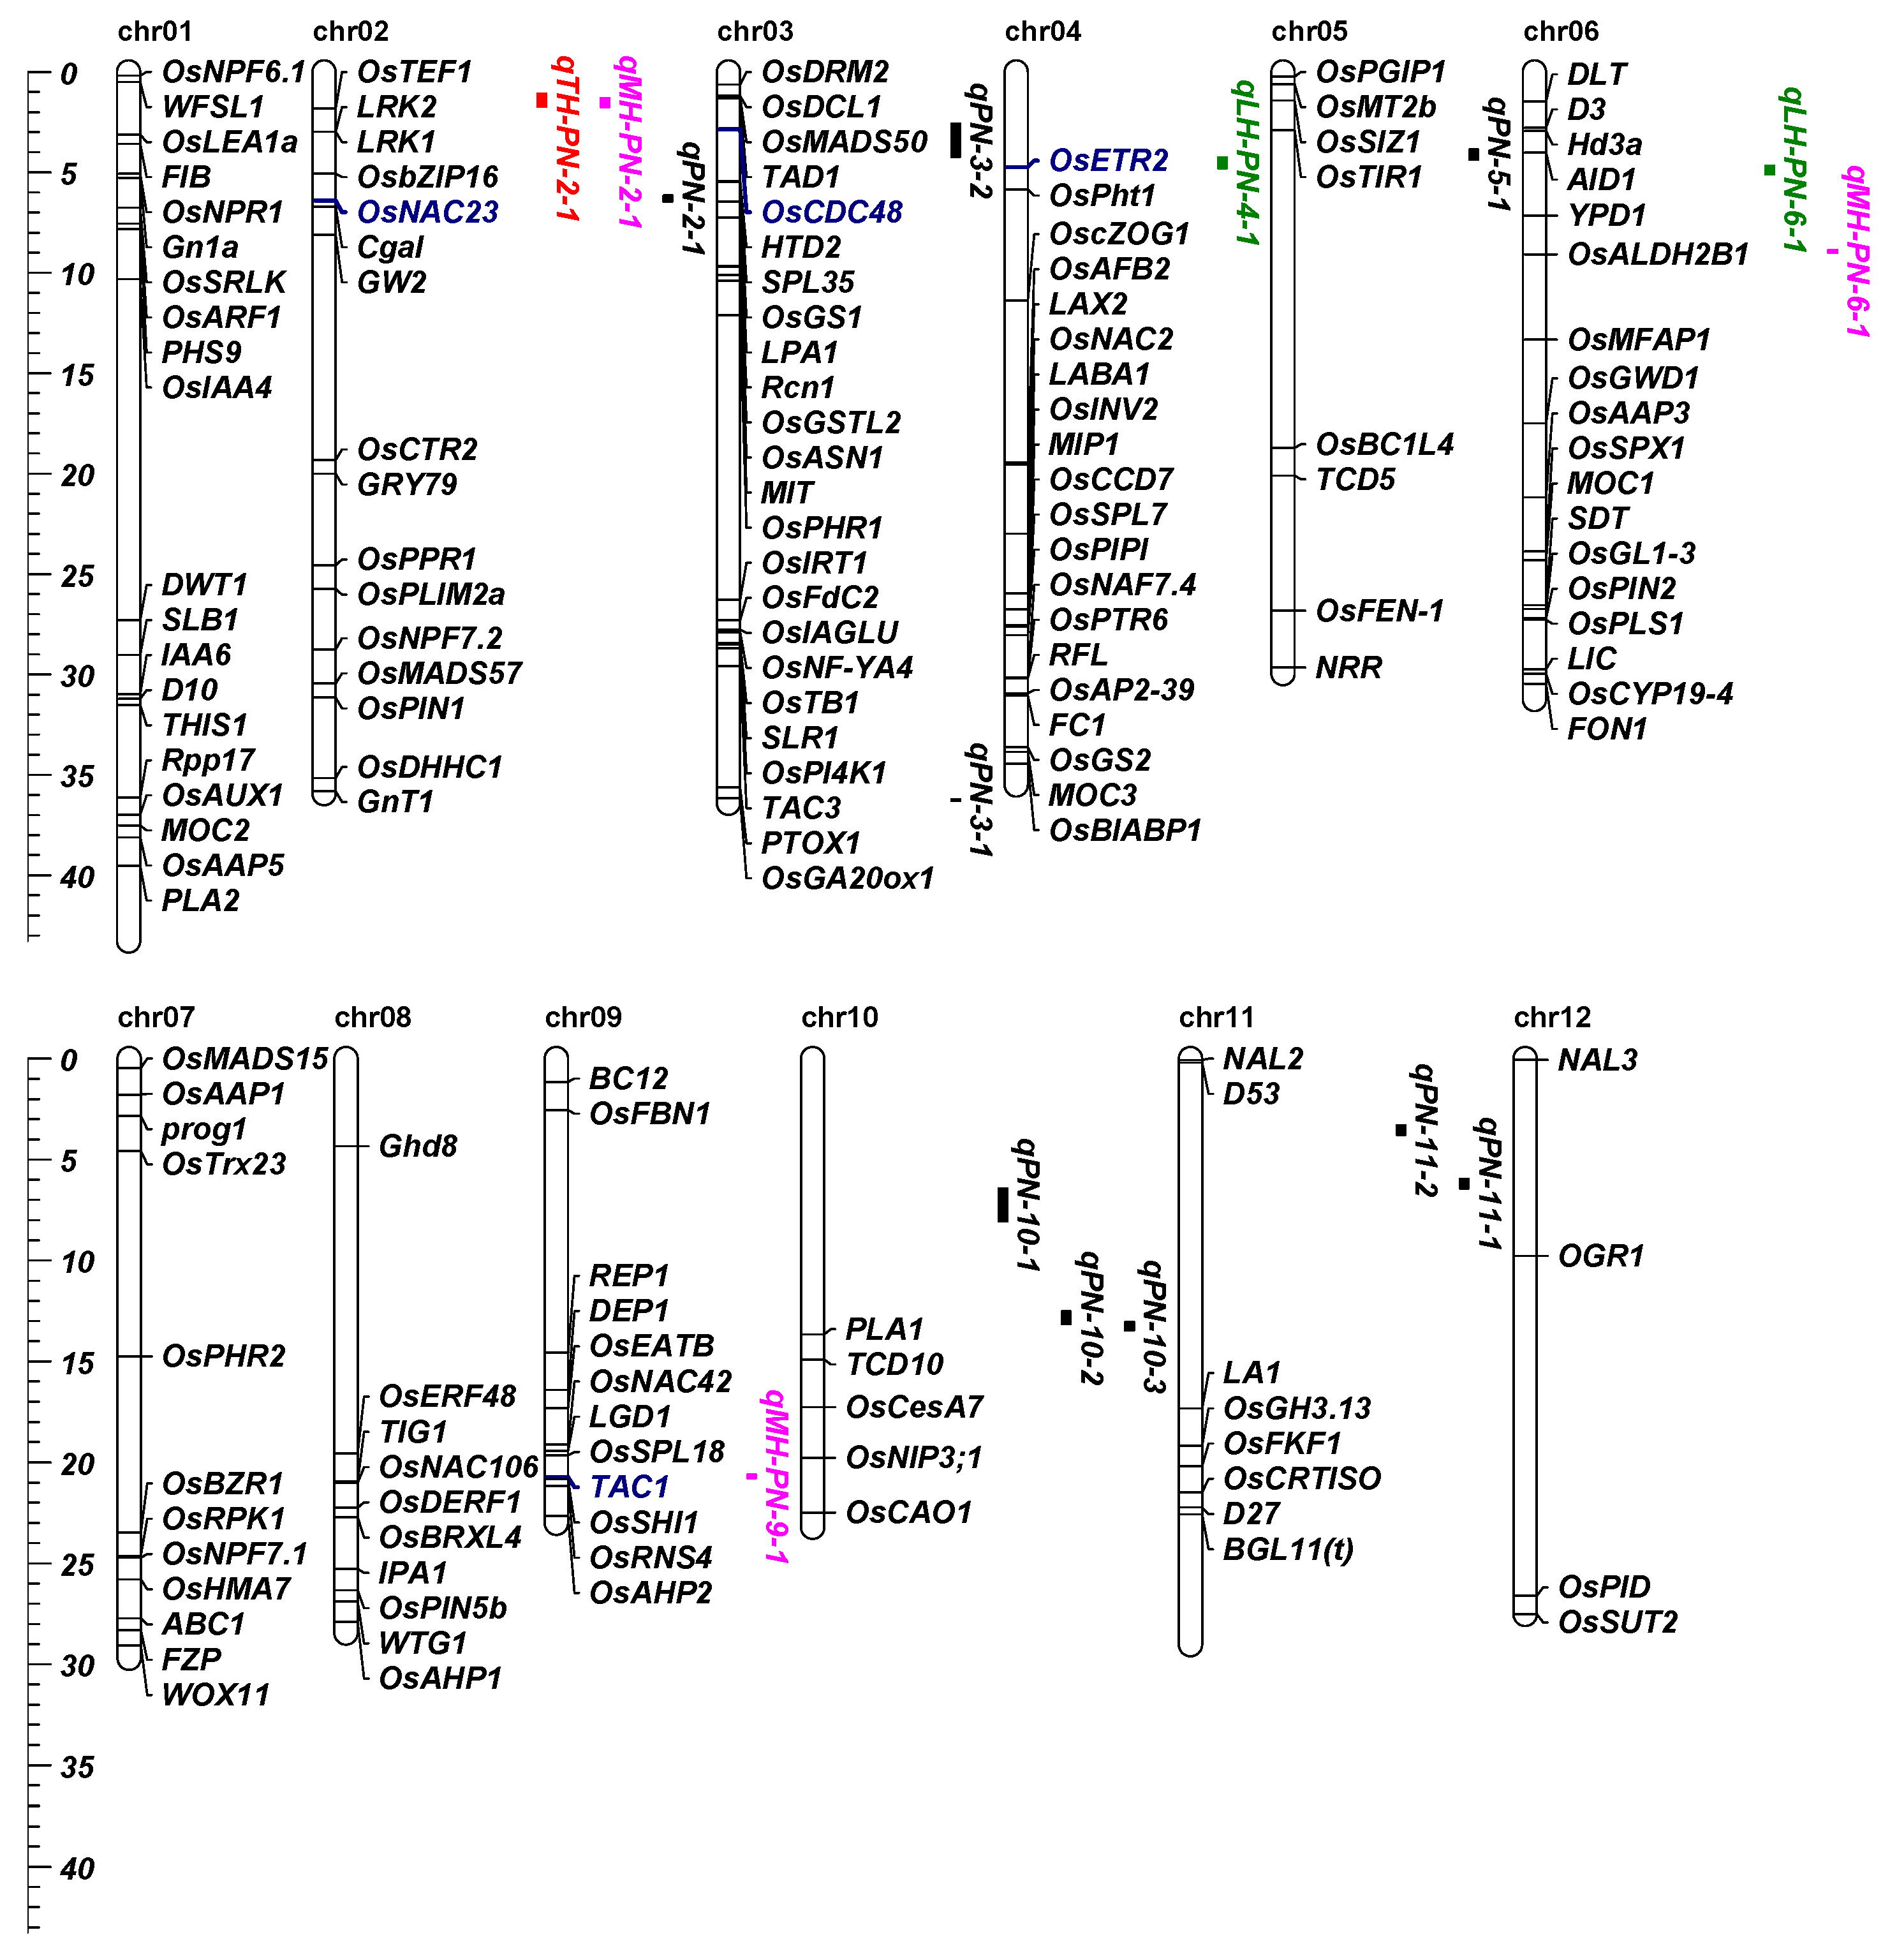
3.2. QTLs Detection in RILs and Heterosis-Related QTLs Detection in Two Testcross Hybrid Populations

Nine QTLs of PN were identified, explaining 4.83–10.80% of the phenotypic variation. Importantly, two QTLs, namely, qPN-10-2 and qPN-10-3, had a common region, with a size of 108 kb. In addition, qPN-10-2 and qPN-10-3 were detected in HB171 and HN162 separately, explaining 6.31% and 9.49% of the phenotypic variation (Supplemental Table S2).
Two testcross populations were used to detect heterosis-related QTLs of PN. A total of six heterosis-related QTLs of PN were mapped, explaining 4.76–11.11% of the phenotypic variation. Those six heterosis-related QTLs included a transgressive heterosis-related QTL (qTH-PN-2-1), three mid-parent heterosis-related QTLs (qMH-PN-2-1, qMH-PN-9-1 and qMH-PN-6-1), and two low-parent heterosis-related QTLs (qLH-PN-4-1 and qLH-PN-2-1) (Supplemental Table S3). No heterosis-related QTLs overlapped with QTLs for PN, which indicated that both heterosis-related QTLs and QTL for PN were independent.

3.3. Known Genes Affecting the PN of RILs in QTLs Interval

In this present study, 157 known PN-related genes were retrieved and compared with the position of the QTLs detected in this study. Two known genes, namely, OsNAC23 and OsCDC48, were covered by the QTLs of PN (Figure 2). OsCDC48 was located in qPN-3-2, and the major QTL explained 10.80% of the phenotypic variation. In addition, OsNAC23 was located in qPN-2-1, which explained 8.80% of the phenotypic variation. We compared PN with male/female parental genotypes of OsNAC23. The male parental genotype and female parental genotype of OsNAC23 for PN in RILs showed significant differences in the HB191 and HN162 environments (Figure 3a), suggesting that OsNAC23 had a great influence on PN. Besides this, the comparison of the PN of RILs with parental genotypes of OsCDC48 showed significant differences in the HB171 and HN162 environments (Figure 3b), indicating that OsCDC48 had a great influence on PN.

3.4. Kown Genes Acted as Heterosis-Related QTLs for PN

Six heterosis-related QTLs for PN were detected in two testcross populations, four heterosis-related QTLs were detected in the YTA-TCF1 population, and two heterosis-related QTLs were detected in the Z7A-TCF1 population. Among the 157 known PN-related genes, two genes (OsETR2 and TAC1) overlapped with heterosis-related QTL for PN. OsETR2 was located in qLH-PN-4-1, which was mapped in the YTA-TCF1 population. OsETR2 was mapped on chromosome 4 and acted as the ethylene receptor, encoding serine/threonine kinase. The effective panicles were reduced in the OsETR2-overexpressing plants [27]. Interestingly, in our previous research, we detected a grain-shaped heterosis-related QTL qTH-GLWR-4-1 in rice using the same YTA-TCF1 population, and found that qTH-GLWR-4-1 covered OsETR2 [21], which suggests that OsETR2 may play a vital role in the heterosis of yield-related traits, such as PN and grain shape. In addition, TAC1 was located in qMH-PN-9-1, which was mapped in the YTA-TCF1 population. TAC1 was a major QTL controlling the tiller angle in rice [28]. In this study, TAC1 was found in the PN heterosis-related QTL, and may result in the heterosis of PN. Whether OsETR2 and TAC1 play a vital role in heterosis remains to further explored.

3.5. Prediction of Candidate Gene in the QTL Cluster

We focused on the QTL cluster in chromosome 10, including qPN-10-2, and qPN-10-3. qPN-10-2 and qPN-10-3 were mapped in HB171 and HN162 separately. Besides this, qPN-10-2 and qPN-10-3 had a common QTL region. Interestingly, our other study also detected a QTL for other tiller numbers, namely, qTN-10-2 (10029667–13469285, 3.44 Mb), which completely covered qPN-10-2, in HN162 [20]. Among these, the overlap interval (13049716–13469285, only 0.42 Mb) of two QTLs (qPN-10-2, and qTN-10-2) was just 0.42 Mb, which indicates that the stable QTL in chromosome 10 controls TN and PN in both the HB environment and the HN environment. Moreover, no known PN-related genes were located in the QTL cluster. The common regions of qPN-10-2 and qTN-10-2 harbored 70 candidate genes. To search for new PN-related genes in the QTL cluster, 157 known PN-related genes were selected to search for homologous genes. Based on homolog identification, three genes (LOC_10g25720, LOC_Os10g25830, and LOC_Os10g25890) were obtained. The comparison of the differences between the male parental protein sequence and the female parental protein sequence of these three genes showed that LOC_10g25720 and LOC_Os10g25830 had such differences, while LOC_Os10g25890 had no differences between male parental protein sequence and female parental sequence (Table 1). The PNs for RILs with the male parental genotype and the female parent genotype of these three genes were compared; only LOC_10g25720 showed significant differences in all four different environments, while LOC_Os10g25830 and LOC_Os10g25890 only showed significant differences in HB171, and there were no significant findings in the other three environments (Figure 4). So, LOC_10g25720 was predicted to be the only candidate gene in the QTL cluster in chromosome 10. In addition, LOC_10g25720 was the D10 homologous gene.

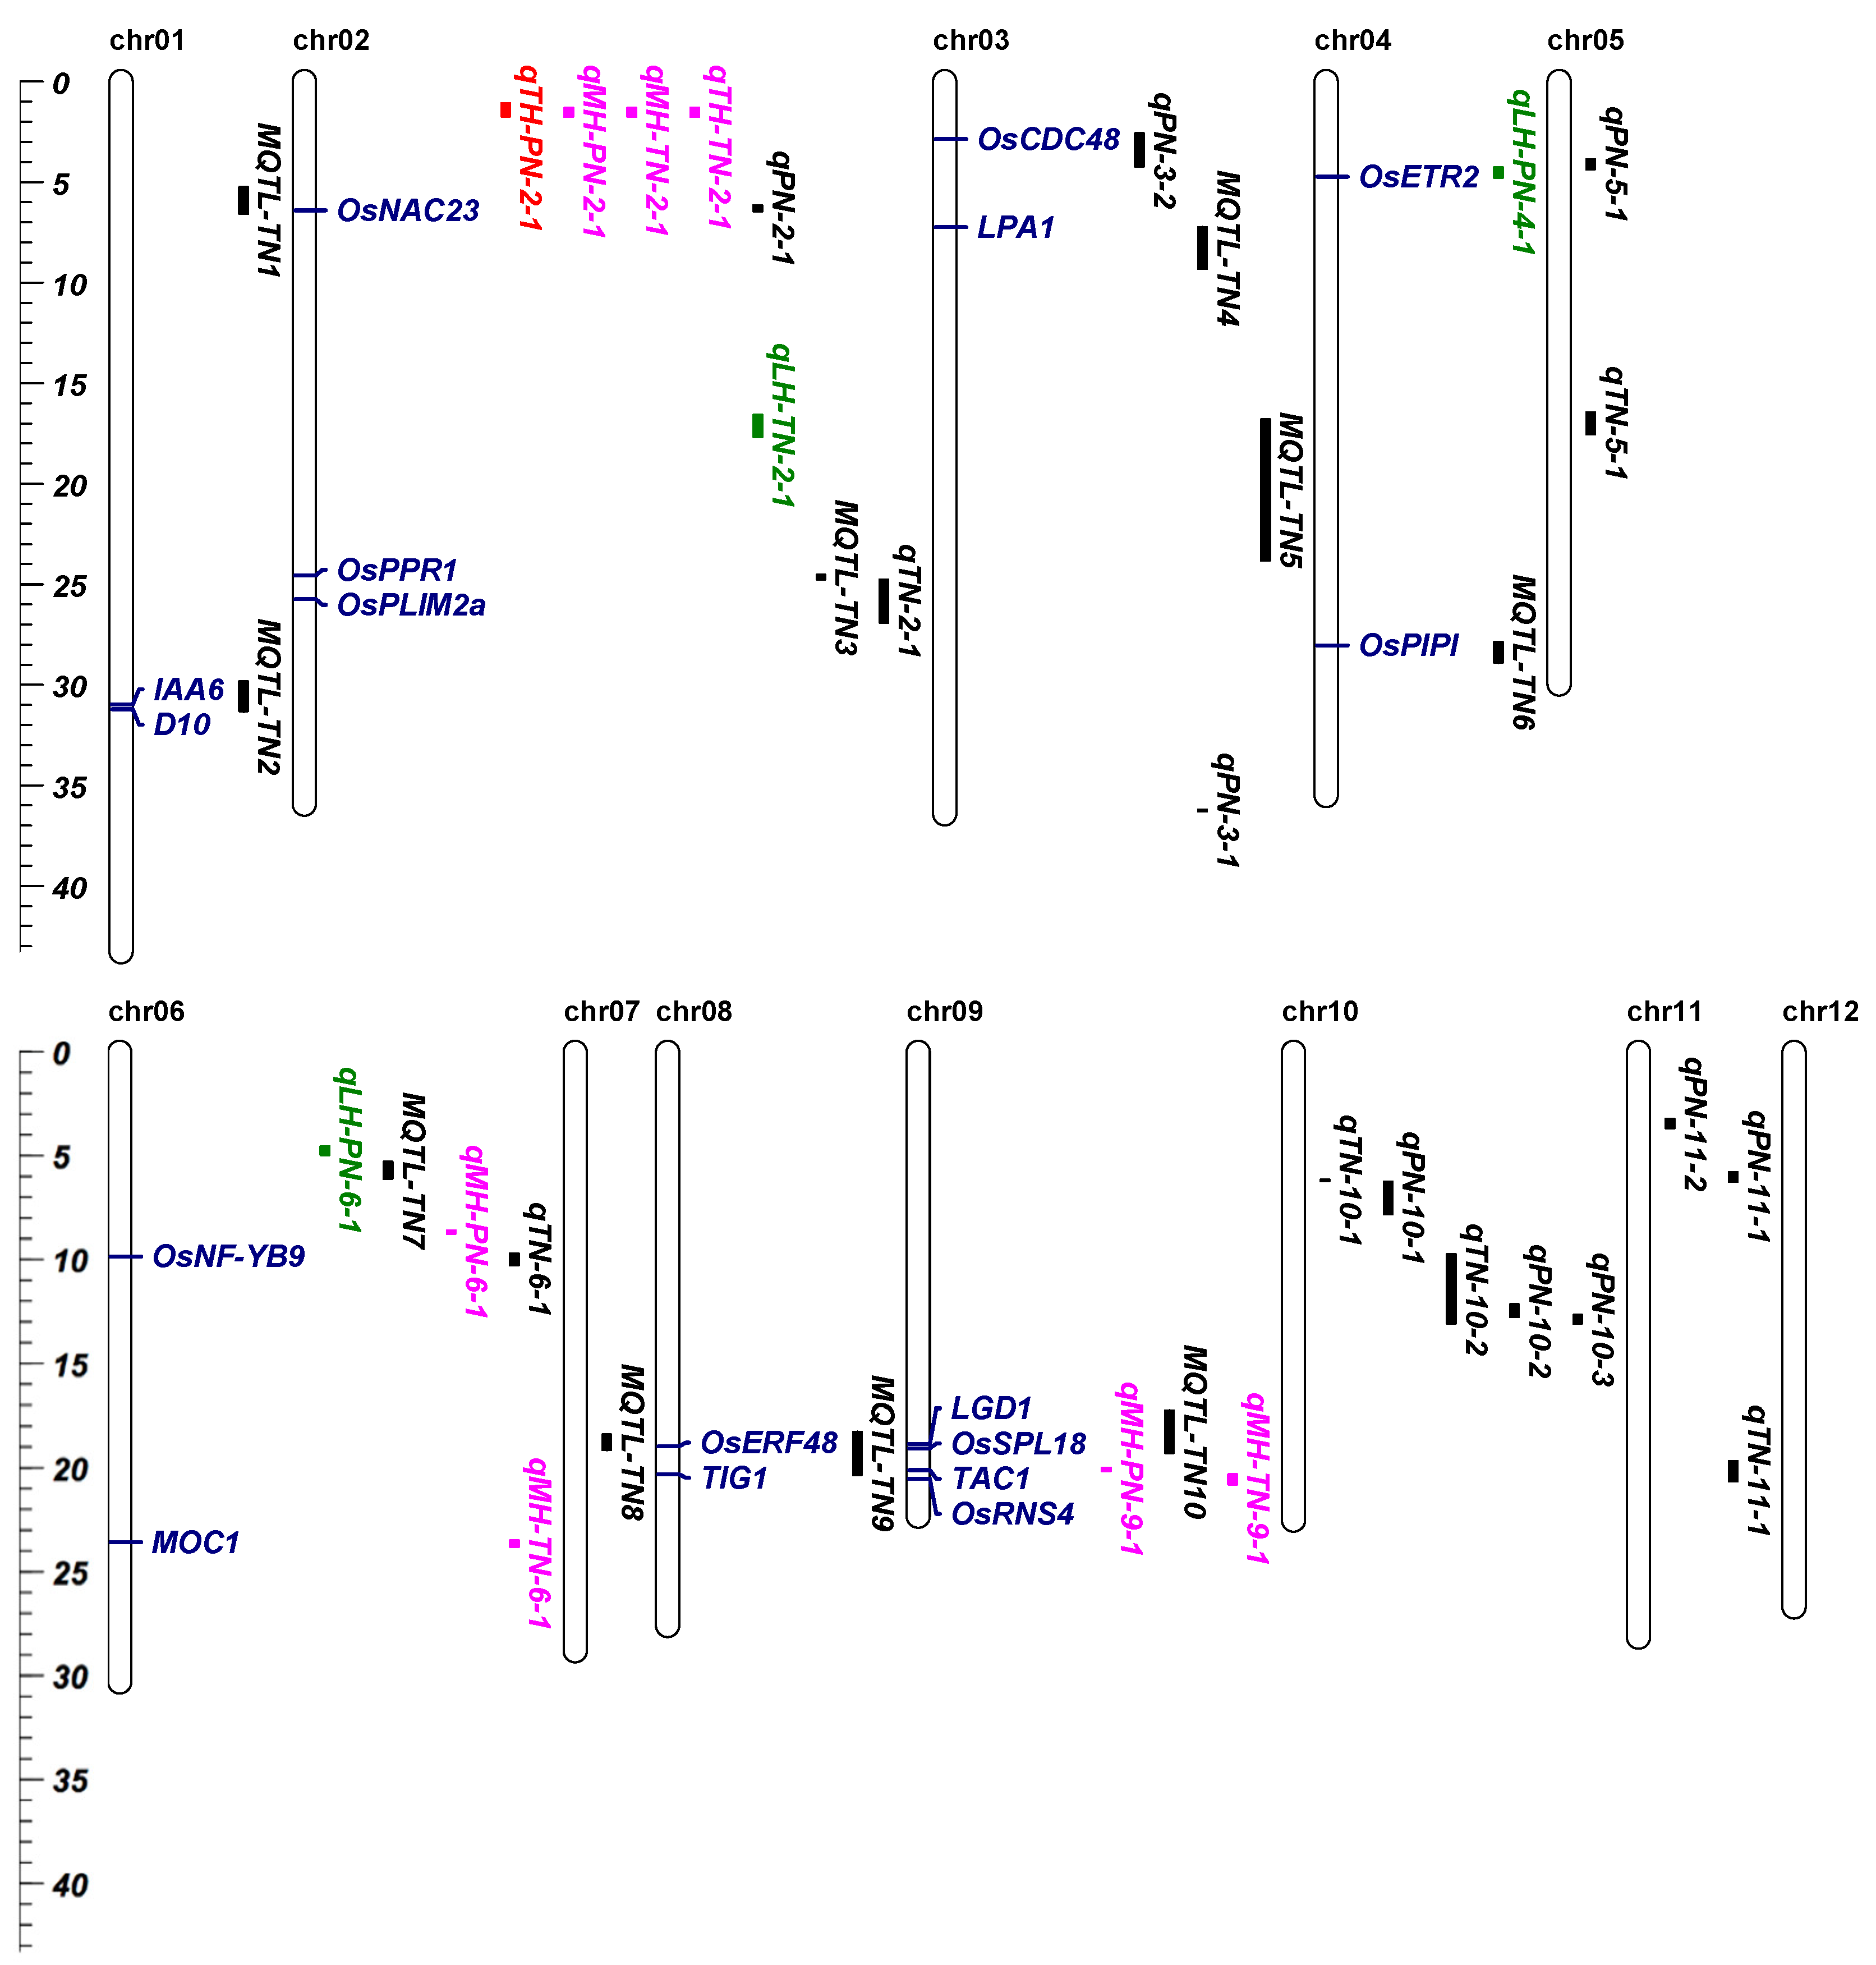
3.6. MQTLs and QTLs of Effective Tiller and Their Heterosis-Related Loci Cover Multiple Known Genes

In the next step of analysis, we detected QTLs of TN in the 191HB environment using the RIL population. qTN-6-1 and qTN-11-1 were detected, explaining 9.41% and 5.64% of the phenotypic variation (Table S4). Besides this, the heterosis-related QTLs of TN were mapped in the 191HB environment using two testcross populations. Three heterosis-related QTLs of TN were detected in the YTA-TCF1 population, including qMH-TN-2-1, qMH-TN-6-1 and qMH-TN-9-1. Interestingly, qMH-TN-6-1 covered MOC1. We compared the differences between the male and female parental protein sequence of MOC1, and found that there was no difference. Then, we further compared the difference between the male and female parental nucleotide sequences of MOC1, and the results show that, compared with the female parental nucleotide sequence of MOC1, the male parental nucleotide sequence of MOC1 had a 10 bp deletion in the intron region (Figure S1). Whether MOC1 plays a role in heterosis remains to be further explored. In addition, two heterosis-related QTLs of TN were detected in the Z7A-TCF1 population, including qTH-TN-2-1 and qLH-TN-2-1 (Table S5). Next, we collected the QTLs, the heterosis-related QTLs of PN and TN, QTLs of TN [20], and MQTLs of TN [9], and compared their loci (Figure 5). qTN-2-1 covered OsPPR1 and OsPLIM2a. Overexpressing OsPLIM2a can result in reducing rice tillers [29]. MQTL-TN2 covered OsIAA6 and D10. Besides this, MQTL-TN9 covered OsERF48 and TIG1. MQTL-TN10 covered LGD1 and OsSPL18. Moreover, LPA1 and OsPIPI were located in MQTL-TN4 and MQTL-TN4 separately. OsNF-YB9 was covered by qTN-6-1, and overexpressing OsNF-YB9 can result in increasing numbers of effective panicles [30].

4. Discussion

TN determines PN, and largely affects grain yield. Therefore, TN is one of the most important agronomic traits controlled by multiple genes. TN- or PN-related genes were detected through the mapping of RIL populations. It is reported that OsNAC23 affects rice grain size and grain weight [31]. A recent study reveal that Tre6P, OsNAC23 and SnRK1a physically interact to regulate sugar homeostasis and grain yield in rice [16]. In addition, Tre6P is a central sugar signal in plants, and OsNAC23 directly binds the promoter of the Tre6P phosphatase gene TPP1, while Tre6P has great potential to improve crop yield. The heterologous expression of the OsTPP1 in maize directly increased the yield by 9–49% [32]. The spraying of absorbable Tre6P precursor also increases wheat yield by 20% [33]. These studies indicate that OsNAC23 acts as a sugar indicator, and senses the availability of sugar for promoting rice growth. Moreover, OsNAC23 affected multiple rice agronomic traits, including grain size, grain weight and grain yield. However, whether OsNAC23 affected TN or PN is still unknown. We have observed that qPN-2-1 was detected using the RIL population, which contained OsNAC23. The male parental genotype and female parental genotype of OsNAC23 for PN in RILs showed significant differences between the HB191 and HN162 environments, suggesting that OsNAC23 had a great influence on PN. OsNAC23 might regulate effective panicle numbers through sensing the availability of sugar and participating in sugar signaling. Besides this, MQTL-TN2 covered D10 and OsIAA6. OsIAA6 encodes the Aux/IAA protein and is involved in the control of tiller outgrowth [34]. D10 encodes carotenoid cleavage dioxygenases and is conserved across species, such as arabidopsis, pea, and petunia, which is the rice ortholog of MAX4/RMS1/DAD1, and D10, induced by the exogenous auxin, controls rice tillering through participating in strigolactone biosynthesis and auxin signal transduction [18]. Interestingly, D10 homologous genes LOC_10g25720 and LOC_Os10g25890 were covered by qPN-10-2, which indicates that D10 and its homologous genes in rice may play vital roles in rice tillering through participating in strigolactone biosynthesis and auxin signaling transduction.
Discovering new PN- or TN-related genes is of great significant. PNs showed greater variation, and were more sensitive to changes in the geographical environment (Table S1). In this study, nine QTLs of PN were detected in RILs and seven QTLs (qPN-3-1, qPN-5-1, qPN-10-1, qPN-10-2, qPN-10-3, qPN-11-1 and qPN-11-2) were newly detected. Two QTLs of PN were detected in RILs, and one QTL, qTN-11-1, was newly detected. qPN-11-1 was 477.98 kb, containing 72 genes. qPN-3-1 was just 96.19 kb, containing 15 genes. A QTL cluster was found in chromosome 10, including qPN-10-2, qPN-10-3 and qTN-10-2. The overlap region of two QTLs (qPN-10-2 and qTN-10-2) was just 0.42 Mb, containing 63 genes. Such a narrow interval allowed us to reduce the number of candidate genes through the homolog identification of known genes. Based on homolog identification, three genes (LOC_10g25720, LOC_Os10g25830, and LOC_Os10g25890) were obtained. Only LOC_10g25720 showed significant differences in all of the four different environments, while LOC_Os10g25830 and LOC_Os10g25890 only showed significant differences in HB171, and no significant differences were found in the other three environments. PN phenotype data from multiple environments can increase the accuracy of the results used for gene genotyping.
To explore rice heterosis, lots of QTLs related to heterosis for various agronomic traits have been reported in different genetic populations [35,36,37], while few heterosis-related genes for PN or TN have been reported to date. In this study, we detected multiple PN and TN heterosis-related loci. An effective tiller heterosis-related QTL cluster (qTH-PN-2-1, qMH-PN-2-1, qTH-TN-2-1, qMH-TN-2-1) was found. qTH-PN-2-1, qMH-PN-2-1 qTH-TN-2-1, and qMH-TN-2-1 completely matched each other—the overlap region was 459.38 kb. The heterosis-related QTL qLH-PN-4-1 contains OsETR2. OsETR2 encodes serine/threonine kinase and acts as an ethylene receptor. Overexpressing OsETR2 results in reducing the effective panicles in rice [27]. In addition, in another research, OsETR2 and LOC_Os04g51950 were covered by heterosis-related QTL qTH-GLWR-4-1 and qTH-GLWR-4-2, separately [21]. Interestingly, LOC_Os04g51950 also encodes serine/threonine kinase HT1. Furthermore, a recent study reported that the yields of four TaCol-B5-overexpressing lines of Yangmai18 were increased by an average of 11.9% compared with non-transgenic Yangmai18. Further studies have shown that TaCol-B5 is activated by the phosphorylation of the serine/threonine protein kinase TaK4, and Ser269 of TaCol-B5 is the phosphorylation site of TaK4 [38]. These findings suggest that the serine/threonine protein kinase genes may play vital roles in heterosis for yield-related traits, such as grain weight, grain shape, TN and PN. Besides this, the heterosis-related QTL qLH-PN-4-1 contained TAC1. TAC1 is a major QTL controlling tiller angle [28]. No publication has reported that TAC1 can result in heterosis for PN. In this study, TAC1 may result in heterosis for PN, which provides a new insight into heterosis for PN in rice. qMH-TN-6-1 covered MOC1. MOC1 initiates axillary buds and affects tiller numbers in rice [14]. In this study, MOC1 may result in heterosis for TN in rice. Interestingly, we found there was no difference between the male and female parental protein sequence of MOC1, while compared with the female parental nucleotide sequence of MOC1, the male parental nucleotide sequence had a 10 bp deletion in the intron region (Figure S1). A previous study collected 240 rice cultivars and compared the nucleotide sequences of MOC1 for 240 rice cultivars. The results show that there was no difference in the coding region of the MOC1 gene, while the nocoding region showed differences [39]. In addition, the MOC1 gene was divided into six genotypes based on 21 SNP of MOC1 promoter, and the expression level of MOC1 with the MOC1-Hap4 genotype was slightly higher than that with the MOC1-Hap1 genotype [39]. This indicates that the MOC1 coding sequence is extremely conserved, and the noncoding region of MOC1 may affect the expression of MOC1. Therefore, we surmise that the differences in the MOC1 noncoding region may lead to differences in the expression of MOC1, and ultimately affect rice tillering, resulting in heterosis for TN.

5. Conclusions

In this study, we detected nine QTLs of PN, two QTLs of TN, six heterosis-related QTLs of PN and five heterosis-related QTLs of TN. We found that heterosis-related QTLs of PN and TN covered multiple known genes, such as MOC1, TAC1 and OsETR2. We conclude that the serine/threonine protein kinase genes may play vital roles in heterosis for yield-related traits, such as grain weight, grain shape, TN and PN. Moreover, we have predicted one PN-related candidate gene, LOC_10g25720. Our research uncovers multiple heterosis-related loci, and provides new insights into the heterosis mechanism of TN and PN in rice.

Supplementary Materials

The following supporting information can be downloaded at https://www.mdpi.com/article/10.3390/agronomy12092171/s1, Figure S1: Gene nucleotide sequence alignments of MOC1 in male parent, female parent and Nipponbare; Table S1: Summarized statistics for PN trait of RIL population, two testcross hybrid populations (YTA-TCF1 and Z7A-TCF1) and its parents; Table S2: QTLs for PN trait in RILs; Table S3: Low-parent, mid-parent and transgressive heterosis-related QTLs for PN trait in two testcross hybrid populations; Table S4: QTLs for TN trait in RILs; Table S5: Low-parent, mid-parent and transgressive heterosis-related QTLs for TN trait in two testcross hybrid populations.

Author Contributions

Y.L. and X.D. designed this study and developed the RIL population. X.D. and J.W. performed the experiment. X.D., W.K. and X.L. analyzed the data. X.D. wrote the manuscript. Y.L., J.Y., Y.J., M.Z., S.K. and T.S. helped in manuscript revision. X.D. and J.W. contributed equally to this work. All authors have read and agreed to the published version of the manuscript.

Funding

This study was supported by the National Key Research and Development Program of China (2016YFD0100400).

Institutional Review Board Statement

Not applicable.

Informed Consent Statement

Not applicable.

Data Availability Statement

All data generated or analyzed during this study are included in this published article (and its Supplementary Information files).

Conflicts of Interest

The authors declare no conflict of interest.

References

  1. Jiao, Y.Q.; Wang, Y.H.; Xue, D.W.; Wang, J.; Yan, M.X.; Liu, G.F.; Dong, G.J.; Zeng, D.L.; Lu, Z.F.; Zhu, X.D.; et al. Regulation of OsSPL14 by OsmiR156 defines ideal plant architecture in rice. Nat. Genet. 2010, 42, 541–544. [Google Scholar] [CrossRef] [PubMed]
  2. Ma, X.Q.; Li, F.M.; Zhang, Q.; Wang, X.Q.; Guo, H.F.; Xie, J.Y.; Zhu, X.Y.; Ullah Khan, N.; Zhang, Z.Y.; Li, J.J.; et al. Genetic architecture to cause dynamic change in tiller and panicle numbers revealed by genome-wide association study and transcriptome profile in rice. Plant J. 2020, 104, 1603–1616. [Google Scholar] [CrossRef] [PubMed]
  3. Arcade, A.; Labourdette, A.; Falque, M.; Mangin, B.; Chardon, F.; Charcosset, A.; Joets, J. BioMercator: Integrating genetic maps and QTL towards discovery of candidate genes. Bioinformatics 2004, 20, 2324–2326. [Google Scholar] [CrossRef] [PubMed]
  4. Zhang, X.C.; Shabala, S.; Koutoulis, A.; Shabala, L.; Zhou, M.X. Meta-analysis of major QTL for abiotic stress tolerance in barley and implications for barley breeding. Planta 2017, 245, 283–295. [Google Scholar] [CrossRef]
  5. Martinez, A.K.; Soriano, J.M.; Tuberosa, R.; Koumproglou, R.; Jahrmann, T.; Salvi, S.; Yield, Q.T. Lome distribution correlates with gene density in maize. Plant Sci. 2016, 242, 300–309. [Google Scholar] [CrossRef]
  6. Kong, W.L.; Deng, X.X.; Liao, Z.Y.; Wang, Y.B.; Zhou, M.A.; Wang, Z.H.; Li, Y.S. De novo assembly of two chromosome-level rice genomes and bin-based QTL mapping reveal genetic diversity of grain weight trait in rice. Front. Plant Sci. 2022, 13, 995634. [Google Scholar] [CrossRef]
  7. Kong, W.L.; Zhang, C.H.; Qiang, Y.L.; Zhong, H.; Zhao, G.Q.; Li, Y.S. Integrated RNA-seq analysis and Meta-QTLs mapping provide insight into cold stress response in rice seeding roots. Int. J. Mol. Sci. 2020, 21, 4615. [Google Scholar] [CrossRef]
  8. Kong, W.L.; Zhong, H.; Gong, Z.Y.; Fang, X.Y.; Sun, T.; Deng, X.X.; Li, Y.S. Meta-analysis of salt stress transcriptome responses in different rice genotypes at the seedling stage. Plants 2019, 8, 64. [Google Scholar] [CrossRef]
  9. Khahani, B.; Tavakol, E.; Shariati, V.; Fornara, F. Genome wide screening and comparative genome analysis for Meta-QTLs, ortho-MQTLs and candidate genes controlling yield and yield-related traits in rice. BMC Genom. 2020, 21, 294–318. [Google Scholar] [CrossRef]
  10. Zhang, C.Y.; Liu, J.; Zhao, T.; Gomez, A.; Li, C.; Yu, C.S.; Li, H.Y.; Lin, J.Z.; Yang, Y.Z.; Liu, B.; et al. A drought-inducible transcription factor delays reproductive timing in rice. Plant Physiol. 2016, 171, 334–343. [Google Scholar] [CrossRef] [Green Version]
  11. Oikawa, T.; Kyozuka, J. Two-step regulation of LAX PANICLE1 protein accumulation in axillary meristem formation in rice. Plant Cell. 2009, 21, 1095–1108. [Google Scholar] [CrossRef] [PubMed]
  12. Shao, G.N.; Lu, Z.F.; Xiong, J.S.; Wang, B.; Jing, Y.H.; Meng, X.B.; Liu, G.F.; Ma, H.Y.; Liang, Y.; Chen, F.; et al. Tiller bud formation regulators MOC1 and MOC3 cooperatively promote tiller bud outgrowth by activating FON1 expression in rice. Mol. Plant 2019, 12, 1090–1102. [Google Scholar] [CrossRef] [PubMed]
  13. Tabuchi, H.; Zhang, Y.; Hattori, S.; Omae, M.; Shimizu-Sato, S.; Oikawa, T.; Qian, Q.; Nishimura, M.; Kitano, H.; Xie, H.; et al. LAX PANICLE2 of rice encodes a novel nuclear protein and regulates the formation of axillary meristems. Plant Cell. 2011, 23, 3276–3287. [Google Scholar] [CrossRef] [PubMed]
  14. Li, X.Y.; Qian, Q.; Fu, Z.M.; Wang, Y.H.; Xiong, G.S.; Zeng, D.; Wang, X.Q.; Liu, X.F.; Teng, S.; Hiroshi, F.; et al. Control of tillering in rice. Nature 2003, 422, 618–621. [Google Scholar] [CrossRef]
  15. Koumoto, T.; Shimada, H.; Kusano, H.; She, K.C.; Iwamoto, M.; Takano, M. Rice monoculm mutation moc2, which inhibits outgrowth of the second tillers, is ascribed to lack of a fructose-1,6-bisphosphatase. Plant Biotechnol. 2013, 30, 47–56. [Google Scholar] [CrossRef]
  16. Li, Z.Y.; Wei, X.J.; Tong, X.H.; Zhao, J.; Liu, X.X.; Wang, H.M.; Tang, L.Q.; Shu, Y.Z.; Li, G.H.; Wang, Y.F.; et al. The OsNAC23-Tre6P-SnRK1a feed-forward loop regulates sugar homeostasis and grain yield in rice. Mol. Plant 2022, 15, 706–722. [Google Scholar] [CrossRef]
  17. Lei, L.; Zheng, H.L.; Wang, J.G.; Liu, H.L.; Sun, J.; Zhao, H.W.; Yang, L.M.; Zou, D. Genetic dissection of rice (Oryza sativa L.) tiller, plant height, and grain yield based on QTL mapping and metaanalysis. Euphytica 2018, 214, 109. [Google Scholar] [CrossRef]
  18. Arite, T.; Iwata, H.; Ohshima, K.; Maekawa, M.; Nakajima, M.; Kojima, M.; Sakakibara, H.; Kyozuka, J. DWARF10, an RMS1/MAX4/DAD1 ortholog, controls lateral bud outgrowth in rice. Plant J. 2007, 51, 1019–1029. [Google Scholar] [CrossRef]
  19. Zha, M.; Imran, M.; Wang, Y.; Xu, J.; Ding, Y.; Wang, S.H. Transcriptome analysis revealed the interaction among strigolactones, auxin, and cytokinin in controlling the shoot branching of rice. Plant Cell Rep. 2019, 38, 279–293. [Google Scholar] [CrossRef]
  20. Kong, W.L.; Deng, X.X.; Yang, J.; Zhang, C.H.; Sun, T.; Ji, W.J.; Zhong, H.; Fu, X.P.; Li, Y.S. High-resolution bin-based linkage mapping uncovers the genetic architecture and heterosis-related loci of plant height in indica-japonica derived populations. Plant J. 2022, 110, 814–827. [Google Scholar] [CrossRef]
  21. Deng, X.X.; Kong, W.L.; Sun, T.; Zhang, C.H.; Zhong, H.; Zhao, G.Q.; Liu, X.H.; Qiang, Y.L.; Li, Y.S. Bin mapping-based QTL analyses using three genetic populations derived from indica-japonica crosses uncover multiple grain shape heterosis-related loci in rice. Plant Genome 2022, 15, e20171. [Google Scholar] [PubMed]
  22. Arends, D.; Prins, P.; Jansen, R.C.; Broman, K.W. R/qtl: High-throughput multiple QTL mapping. Bioinformatics 2010, 26, 2990–2992. [Google Scholar] [CrossRef] [PubMed]
  23. Dupuis, J.; Siegmund, D. Statistical methods for mapping quantitative trait loci from a dense set of markers. Genetics 1999, 151, 373–386. [Google Scholar] [CrossRef] [PubMed]
  24. Voorrips, R.E. Mapchart: Software for the graphical presenttion of linkage maps and QTLs. J. Hered. 2002, 93, 77–78. [Google Scholar]
  25. Patrick, S.S.; Nathan, M.S. Progress toward understanding heterosis in crop plants. Annu. Rev. Plant Biol. 2013, 64, 71–88. [Google Scholar]
  26. Kong, W.L.; Zhang, C.H.; Zhang, S.C.; Qiang, Y.L.; Zhang, Y.; Zhong, H.; Li, Y.S. Uncovering the novel QTLs and candidate genes of sale tolerance in rice with linkage mapping, RTM-GWAS, and RNA-seq. Rice 2021, 14, 93. [Google Scholar] [CrossRef]
  27. Wuriyanghan, H.; Zhang, B.; Cao, W.H.; Ma, B.; Lei, G.; Liu, Y.F.; Wei, W.; Wu, H.J.; Chen, L.J.; Chen, H.W.; et al. The ethylene receptor ETR2 delays floral transition and affects starch accumulation in rice. Plant Cell. 2009, 21, 1473–1494. [Google Scholar] [CrossRef]
  28. Yu, B.S.; Lin, Z.W.; Li, H.X.; Li, X.J.; Li, J.Y.; Wang, Y.H.; Zhang, X.; Zhu, Z.F.; Zhai, W.X.; Wang, X.K.; et al. TAC1, a major quantitative trait locus controlling tiller angle in rice. Plant J. 2007, 52, 891–898. [Google Scholar] [CrossRef]
  29. Na, J.K.; Huh, S.M.; Yoon, I.S.; Byun, M.O.; Lee, Y.H.; Lee, K.O.; Kim, D. Rice LIM protein OsPLIM2a is involved in rice seed and tiller development. Mol. Breed. 2014, 34, 569–581. [Google Scholar] [CrossRef]
  30. Das, S.; Parida, S.K.; Agarwal, P.; Tyagi, A.K. Transcription factor OsNF-YB9 regulates reproductive growth and development in rice. Planta 2019, 250, 1849–1865. [Google Scholar] [CrossRef]
  31. Mathew, I.E.; Das, S.; Mahto, A.; Agarwal, P. Three rice NAC transcription factors heteromerize and are associated with seed size. Front. Plant Sci. 2016, 7, 1638. [Google Scholar] [CrossRef] [PubMed]
  32. Wang, L.; Lu, Q.T.; Wen, X.G.; Lu, C.M. Enhanced Sucrose Loading Improves Rice Yield by Increasing Grain Size. Plant Physiol. 2015, 169, 2848–2862. [Google Scholar] [CrossRef] [PubMed] [Green Version]
  33. Griffiths, C.A.; Sagar, R.; Geng, Y.; Primavesi, L.F.; Patel, M.K.; Passarelli, M.K.; Gilmore, I.S.; Steven, R.T.; Bunch, J.; Paul, M.J.; et al. Chemical intervention in plant sugar signalling increases yield and resilience. Nature 2016, 540, 574–578. [Google Scholar] [CrossRef] [PubMed]
  34. Jung, H.; Lee, D.K.; Choi, Y.D.; Kim, J.K. OsIAA6, a member of the rice Aux/IAA gene family, is involved in drought tolerance and tiller outgrowth. Plant Sci. 2015, 236, 304–312. [Google Scholar] [CrossRef]
  35. Huang, X.H.; Yang, S.H.; Gong, J.Y.; Zhao, Q.; Feng, Q.; Zhan, Q.L.; Zhao, Y.; Li, W.J.; Cheng, B.Y.; Xia, J.H. Genomic architecture of heterosis for yield traits in rice. Nature 2016, 537, 629–633. [Google Scholar] [CrossRef]
  36. Li, D.Y.; Huang, Z.Y.; Song, S.H.; Xin, Y.Y.; Mao, D.H.; Lv, Q.M.; Zhou, M.; Tian, D.M.; Tang, M.F.; Wu, Q.; et al. Integrated analysis of phenome, genome, and transcriptome of hybrid rice uncovered multiple heterosis-related loci for yield increase. Proc. Natl. Acad. Sci. USA 2016, 113, E6026–E6035. [Google Scholar] [CrossRef]
  37. Lin, Z.C.; Qin, P.; Zhang, X.W.; Fu, C.J.; Deng, H.C.; Fu, X.X.; Hunag, Z.; Jiang, S.Q.; Tang, X.Y.; Wang, X.F.; et al. Divergent selection and genetic introgression shape the genome landscape of heterosis in hybrid rice. Proc. Natl. Acad. Sci. USA 2020, 117, 4623–4631. [Google Scholar] [CrossRef]
  38. Zhang, X.Y.; Jia, H.Y.; Li, T.; Wu, J.Z.; Nagarajan, R.; Lei, L.; Powers, C.; Kan, C.C.; Hua, W.; Liu, Z.Y.; et al. TaCol-B5 modifies spike architecture and enhances grain yield in wheat. Science 2022, 376, 180–183. [Google Scholar] [CrossRef]
  39. Zhang, Z.Y.; Sun, X.M.; Ma, X.Q.; Xu, B.X.; Zhao, Y.; Ma, Z.Q.; Li, G.L.; Khan, N.U.; Pan, Y.H.; Liang, Y.T.; et al. GNP6, a novel allele of MOC1, regulates panicle and tiller development in rice. Crop J. 2020, 9, 57–67. [Google Scholar] [CrossRef]
Figure 1. The distribution pattern of the PN trait in RILs and two testcross hybrid populations. (ad) Column graphs of PN for RIL population in HB191 (a), HB181 (b), HB171 (c), and HN162 (d), respectively. (e,f) Column graph of PN for Z7A-TCF1 population (e) and YTA-TCF1 population (f) in HB191.
Agronomy 12 02171 g001
Figure 2. The position of quantitative trait locus (QTLs) for effective panicle numbers (PN) in recombinant inbred lines (RILs) and heterosis-related QTLs in two testcross hybrid populations, and the location comparison of them and PN-related known genes. The QTLs and heterosis-related QTLs located in this study are labeled on the right side of the chromosome; black represents the QTLs. Green, pink and red represent the relative low-parent, middle-parent and transgressive heterosis-related QTLs, respectively. The PN-related known genes were located in the chromosome. Blue represents the known genes covered by QTLs of PN, or heterosis. The Y-axis represents the physical distance (Mb) of the chromosomes.
Agronomy 12 02171 g002
Figure 3. PN trait comparison of RILs with parental genotypes of two known genes in multiple environments. (a) PN trait comparison of RILs with parental genotypes of OsNAC23 in multiple environments (HB191, HB181, HB171, HN162); (b) PN trait comparison of RILs with parental genotypes of OsCDC48 in multiple environments (HB191, HB181, HB171, HN162). RILs with the male parental genotype and female parental genotype of the OsNAC23 and OsCDC48 are marked by green dots and red dots in point clouds, respectively. * represents p < 0.05, ** represents p < 0.01, *** represents p < 0.001. PN: the effective panicle numbers per plant.
Agronomy 12 02171 g003
Figure 4. PN trait comparison of RILs with parental genotypes of LOC_10g25720 (a), LOC_10g25830 (b), and LOC_10g25890 (c) in multiple environments. RILs with the male parental genotype and female parental genotype of LOC_10g25720, LOC_10g25830, and LOC_10g25890 are marked by green dots and red dots in point clouds, respectively. * represents p < 0.05, ** represents p < 0.01, *** represents p < 0.001. PN: Effective panicle number.
Agronomy 12 02171 g004
Figure 5. The position of the quantitative trait locus (QTLs) for effective panicle numbers (PN), tiller numbers (TN) in recombinant inbred lines (RILs) and heterosis-related QTLs in two testcross hybrid populations, and the location comparison of them and MQTLs. The QTLs and heterosis-related QTLs located in this study are labeled on the right side of the chromosome; black represents the QTLs and MQTLs. Green, pink, and red represent the relative low-parent, middle-parent and transgressive heterosis-related QTLs, respectively. Blue represents the known genes, covered by QTLs, MQTLs and heterosis-related QTLs. The Y-axis represents the physical distance (Mb) of the chromosomes.
Agronomy 12 02171 g005
Table 1. Alignment results of parental protein sequences of three genes in qPN-10-2.
Gene IDGene Position (bp)Homologous Known GeneQTLsQTL Position (bp)Male Parental Gene/Female
Parental Gene
Difference of Protein
Sequence
LOC_Os10g2572013318548-
13322321
D10qPN-10-213238715-
13251104
FaEVM0003415.1/MoEVM0001835.1Yes
LOC_Os10g2583013387338-
13388803
MITqPN-10-213238715-
13251104
FaEVM0043545.1/MoEVM0016401.1Yes
LOC_Os10g2589013416622-
13421264
D10qPN-10-213238715-
13251104
FaEVM0032270.1/MoEVM0005566.1No
Note: Yes means there is a difference in the parent protein sequence; No means there is no difference in the parent protein sequence.
Publisher’s Note: MDPI stays neutral with regard to jurisdictional claims in published maps and institutional affiliations.

