Article

Genetic Gains in Grain Yield and Agronomic Traits of Argentinian Durum Wheat from 1934 to 2015

by
Ana Laura Achilli
1,2,
Pablo Federico Roncallo
1,2 and
Viviana Echenique
1,2,*
1
Centro de Recursos Naturales Renovables de la Zona Semiárida (CERZOS–CCT–CONICET Bahía Blanca), Camino de la Carrindanga km 7, Bahía Blanca 8000, Argentina
2
Departamento de Agronomía, Universidad Nacional del Sur (UNS), San Andrés 800, Bahía Blanca 8000, Argentina
*
Author to whom correspondence should be addressed.
Agronomy 2022, 12(9), 2151; https://doi.org/10.3390/agronomy12092151
Submission received: 12 August 2022 / Revised: 5 September 2022 / Accepted: 6 September 2022 / Published: 10 September 2022

Abstract

:
Understanding the basis of genetic gains in grain yield and yield-related traits is essential for designing future breeding strategies that lead to the development of higher-yielding wheat cultivars. The objectives of this study were to assess the changes in grain yield achieved by durum wheat breeding in Argentina and to identify the agronomic traits associated with these changes. To this end, a wide set of Argentinian cultivars was analyzed in three field trials. A significant linear trend (R2 = 0.55) was observed between the grain yield and the cultivar’s release year, with an increase of 26.94 kg ha−1 yr−1 from 1934 to 2015. The harvest index and grain number were key traits that explained the increases in grain yield. The number of grains per plant increased with the cultivar’s release year, while the thousand kernel weight remained unchanged. The grain yield showed an increase of 51% when comparing old cultivars (<1980) with intermediate ones (1980–1999), whereas the increase between intermediate and modern cultivars (2000+) was only 16%. Thus, the genetic gains were mostly associated with the incorporation of semi-dwarfism into the germplasm in the 1980s, with low genetic gains after that.

1. Introduction

Durum and bread wheat (Triticum turgidum L. var. durum and T. aestivum) are basic food crops for the human diet. Wheat is the most widespread crop all around the world [1]. Given the increase in global demand for food and the limited possibility of further expanding the growing area worldwide, increases in wheat production should be focused on increases in grain yield per unit area. Understanding the basis of genetic gains in yield and yield-related traits is essential for designing future breeding strategies that lead to the development of higher yielding wheat cultivars.
Many efforts have been made to estimate the genetic gains of wheat grain yield and the changes in yield-related traits over time. Genetic gains in bread wheat yield have been reported in many regions and time periods [2,3,4,5,6]. However, durum wheat has received less attention given the smaller area under cultivation and the regional distribution of the crop. Durum wheat represents approximately 5% of the global area cultivated with wheat [1], playing an important role in pasta production worldwide [7]. The Mediterranean region concentrates the largest consumers of durum wheat and is where most of its processing takes place [8,9]. In these areas, genetic gains of the crop have been widely studied. In Italy, De Vita et al. [10] and Pecetti and Annicchiarico [11] reported similar yield increases during the 20th century, with values of 19.9 and 17 kg ha−1 year−1, respectively. In Spain, Chairi et al. [12] reported yield gains in durum wheat of 24 kg ha−1 year−1 from 1980 to 2003, without any clear increases in yield from 2003 to 2010. Despite this, little is known about the genetic improvement in grain yield of durum wheat for non-Mediterranean regions.
Focusing study on yield-related traits could help to better understand the genetic basis involved in wheat yield improvement [13]. Grain yield improvements in bread and durum wheat, including pre and post Green Revolution cultivars, have been mainly associated with increases in the harvest index and decreases in plant height due to the greater partition of assimilates to the reproductive organs [14,15,16]. Among the yield components, grain yield increases from the old to the modern cultivars have been attributed largely to changes in grain number per unit area in bread wheat [15,17,18] as well as in durum wheat [10,19,20]. The grain number per spike also exhibited a clear trend in grain yield improvements [21,22], with increases of 0.14 and 0.08 grains spike−1 year−1 in the 20th century in Italian and Spanish durum wheat cultivars, respectively, which were attributed to increases in both the number of spikelets per spike and the number of grains per spikelet in the Italian cultivars, but only to increments in the number of grains per spikelet in the Spanish germplasm [23].
Durum wheat has been grown in Argentina for more than 80 years [24]. Argentina is ranked ninth internationally among pasta producing countries with a long tradition in pasta consumption (https://www.pasta-unafpa.org/, accessed date on 5 August 2022). Initially, durum wheat landraces were introduced, and local selections within these landraces were grown for farmers. Then, crosses made by breeders involving landraces and/or cultivars introduced mainly from Italy gave rise to new varieties used by farmers. In particular, the landrace Taganrog (Russian origin) and the old cultivar Cappelli (North Africa origin) introduced from Italy had a great influence on the Argentinian germplasm [25]. Subsequently, modern semi-dwarf cultivar development through crosses with CIMMYT germplasm has been widely adopted since the 1980s [24,25,26].
In Argentina, the genetic progress in grain yield from bread wheat has been extensively studied over a long period of time (1910s to 2010s) [15,22,27,28], being of 0.8 kg ha−1 yr−1 (1918 to 1940), 51 kg ha−1 yr−1 (1940 to 1999) and 14 kg ha−1 yr−1 (1999 to 2011). The high yield improvements obtained after 1940 have been attributed to increases in the grain number per unit area, which were associated with changes in the grain number per spike [28]. However, the genetic gains of durum wheat in Argentina have not yet been analyzed. These studies, together with the analyses of yield-related traits, can provide important information for breeding, adding value to the current understanding of durum wheat improvement worldwide.
The aims of this study were to determine the changes in grain yield achieved by durum wheat breeding in Argentina and to identify the yield-related traits associated with these changes. To address this objective, a wide set of Argentinian cultivars released from the 1930s to 2010s were grown in three field trials.

2. Materials and Methods

2.1. Plant Material and Experimental Design

Twenty-two durum wheat cultivars were assessed in the current study (Table 1). Nineteen out of the 20 commercial durum wheat cultivars registered in the National Register of Cultivars [29] developed in Argentina during 2015 or earlier were included. The landrace “Taganrog”, originally from Russia, which was one of first founder genotypes of Argentinian germplasm plus two genotypes derived from this landrace (“Candeal Durumbuck” and “Taganrog Vilela Fideos”) bred in Argentina were also tested. Cultivars were grown under rainfed field conditions in three different environments considered to be representative of the main durum wheat production area in the country. The experimental design was a randomized complete block with two replications in all environments.

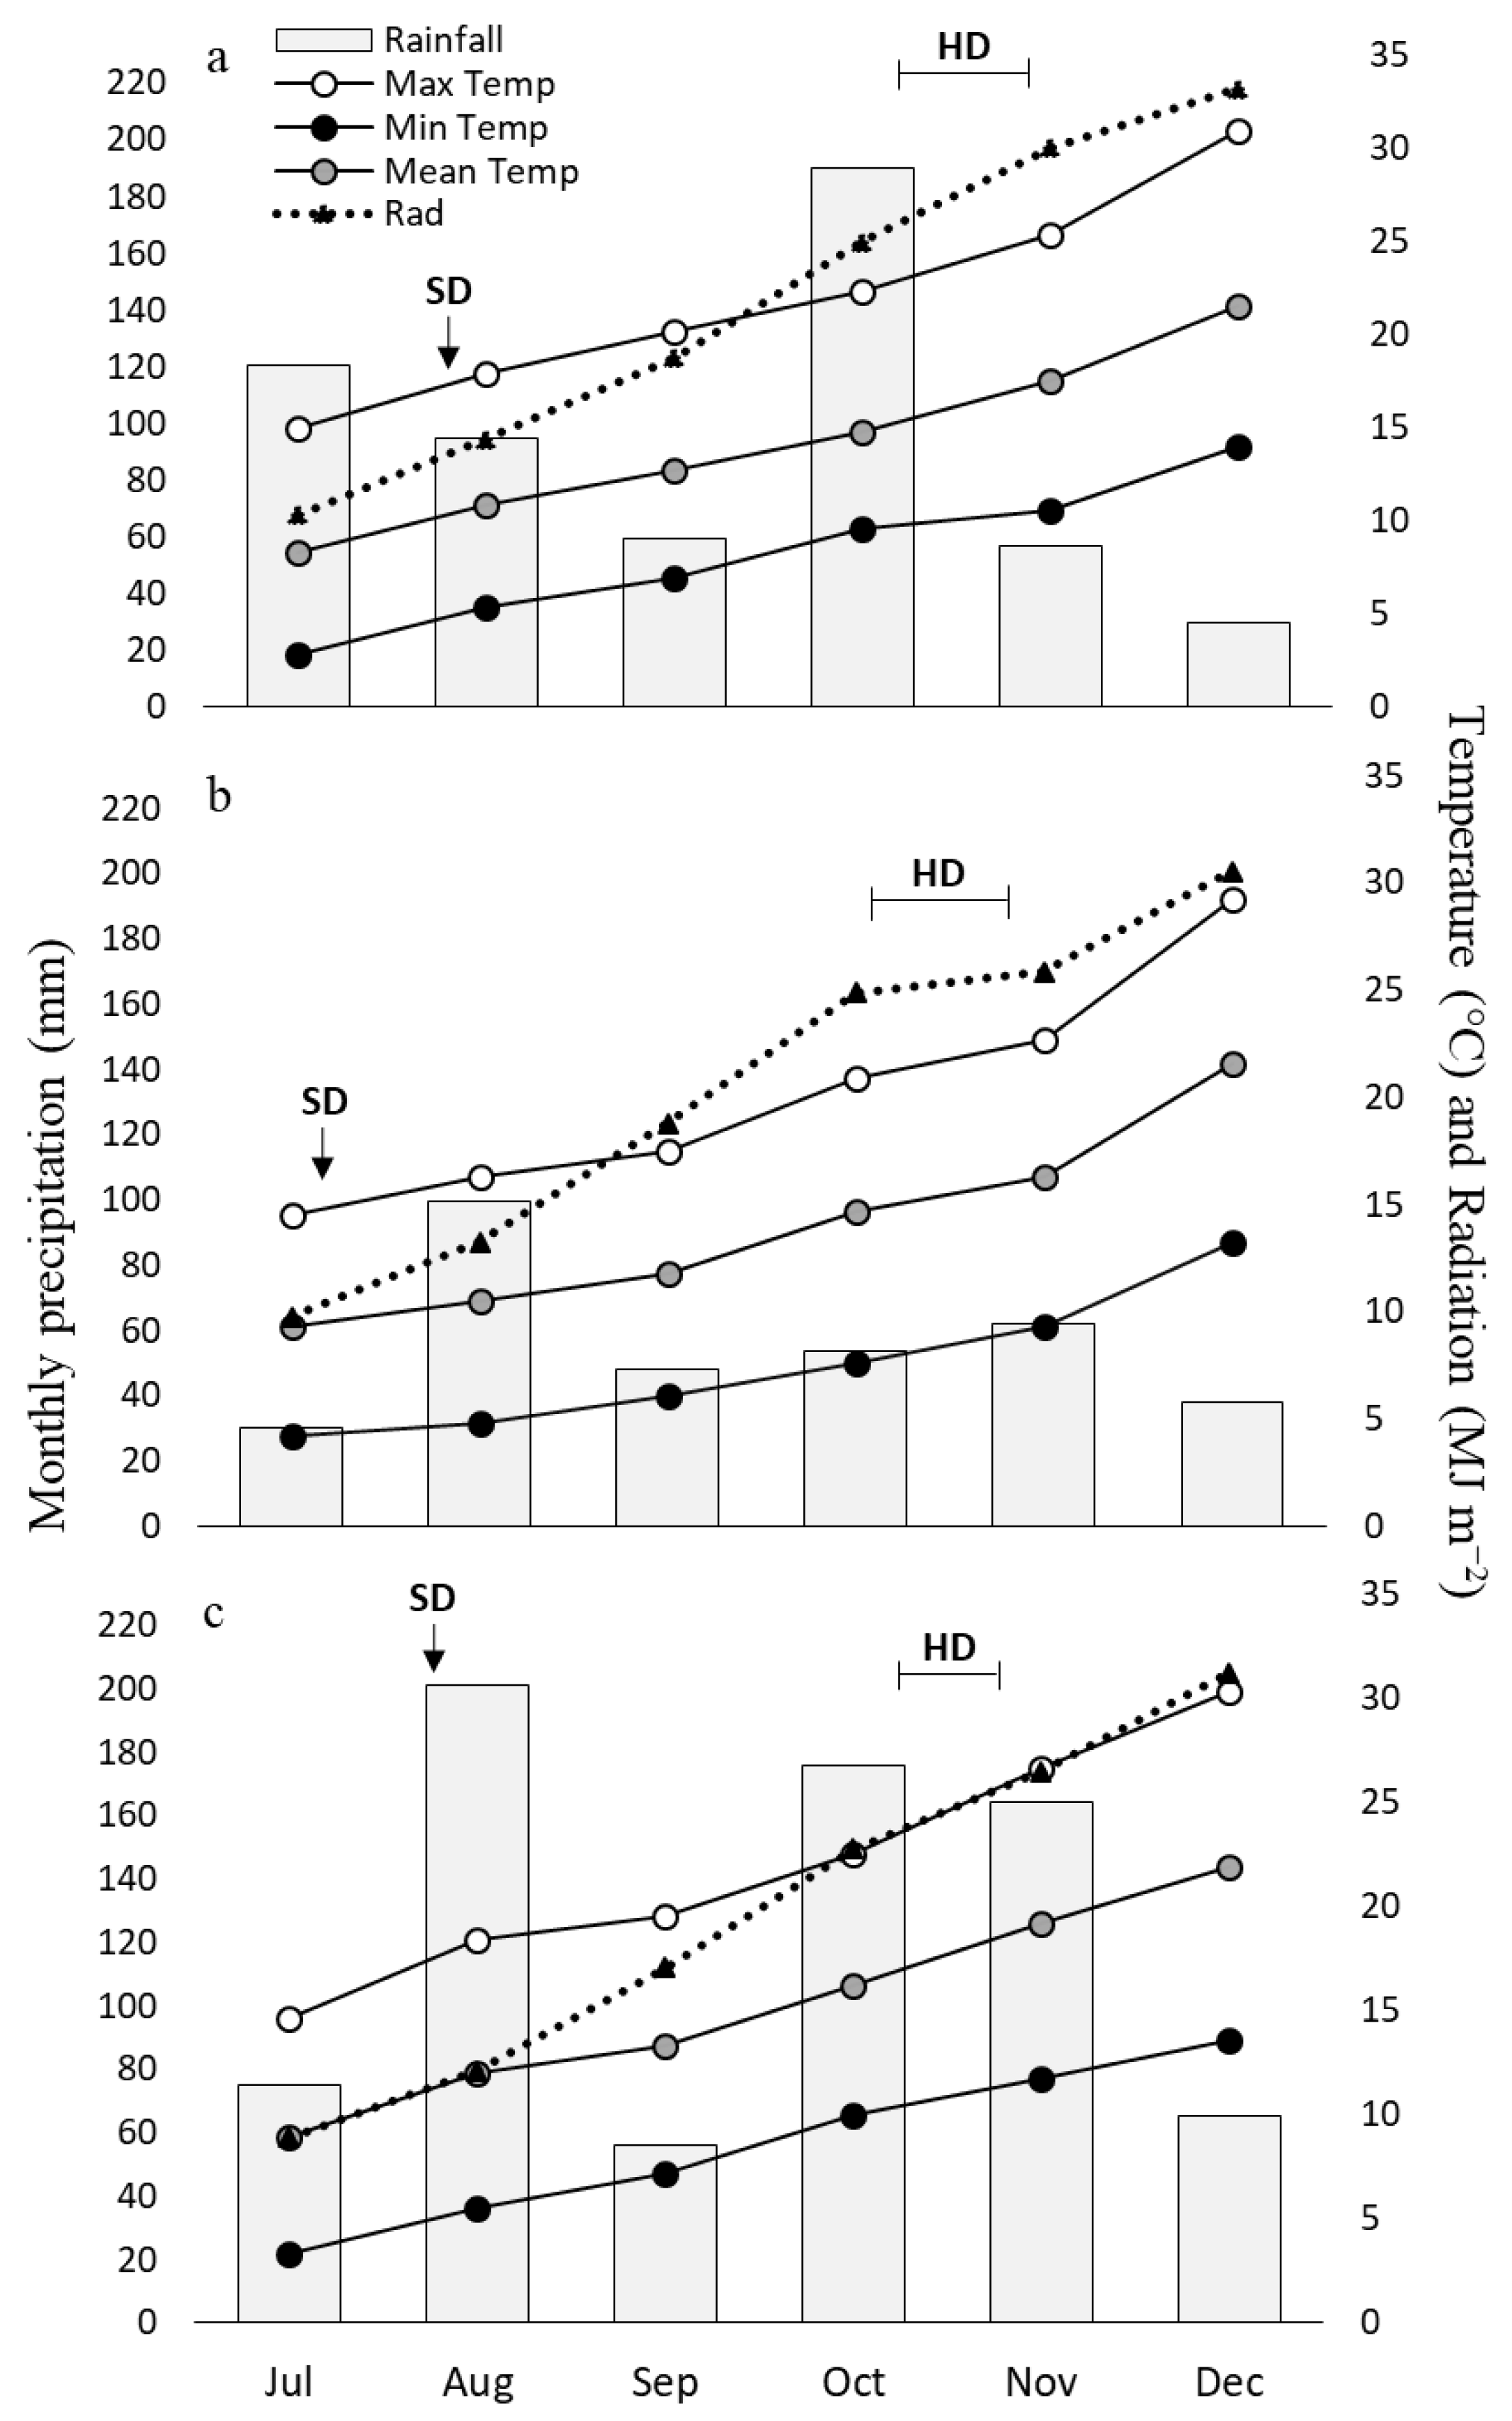
2.2. Growing Conditions

The field trials were conducted in Buenos Aires province in the experimental fields of the main durum wheat breeding programs in Argentina: (i) Asociación de Cooperativas Argentinas company located in Cabildo (CA) (39°36′ S, 61°64′ W), (ii) National Breeding Program, INTA Barrow (BW) (38°20′ S, 60°13′ W) and (iii) Buck Semillas S.A. company located in Pieres (PS) (37°46′ S, 58°18′ W). The experiments were carried out in 2014 (CA and PS) and 2017 (BW). The type of soil in CA is classified as Sandy-loam, while in BW and PS the soil is Clay-loam. Details of the soil tests performed before the sowing date of each experiment are shown in Table 2.
Plots consisted of seven rows of 6, 6.4 and 4.2 m in length in CA, BW and PS, respectively, with a distance of 18 cm apart in BW and 20 cm apart in CA and PS. To avoid border effects, smaller central areas of 5.5, 5 and 4.2 m2 were mechanically harvested in CA, BW and PS, respectively. All experiments were sown to obtain 300 plants per square meter. Sowing to harvest dates were 11 August to 27 December for CA, 22 July to 29 December for BW, and 6 August to 6 January for PS.
In all of the experiments, fertilizers were applied at sowing and tillering, and chemical weed controls were applied. The CA and PS trials were fertilized at sowing with 100 and 150 kg ha−1 of di-ammonium phosphate, respectively, whereas the BW trials were fertilized at sowing with 200 kg ha−1 of a chemical product with 10% nitrogen, 46% phosphorous pentoxide and 9% sulfur (MicroEssentials S9). All of the trials were fertilized at tillering with urea: 100 and 210 kg ha−1 in CA and BW, respectively, and 380 kg ha−1 in two applications in PS. Chemical weed control was performed using the products Axial (700 cm3 ha−1), 2,4D (500 cm3 ha−1) and Dicamba (150 cm3 ha−1) in CA, with Merit (6.5 g ha−1 + 100 cm3 ha−1) in BW and with commercial doses of Starane, Metsulfuron and Foxtrot in PS.
Mean temperatures were 15.5, 15 and 16.5 °C and the accumulated water was 431, 302 and 662 mm during the crop cycle in CA, BW and PS, respectively (Figure 1). Considering the same period, in the long term, the mean temperatures were 14.3, 13.7 and 12.9 °C and the accumulated water 245, 245 and 277 mm (in CA, BW and PS, respectively).

2.3. Measurements

Agronomic traits were evaluated in the 22 cultivars in the three environments. The grain yield was measured as the weight of clean whole grains from the entire harvest plot, expressed as kg ha−1. Additional measurements were performed per plot: heading date, as the number of days between emergence and when 50% of the spikes were at growth stage 55 [31]; thousand-kernel weight, calculated as the average weight (g) of three 100 grain samples; and grain protein content (%), measured in a clean sample of 30 g of grains from each plot using near-infrared spectroscopy (NIRS; FOSS®, Hillerod, Denmark), as an average of seven measurements, at 13.5% base humidity.
The remaining variables were measured on a plant basis. To this end, 10 plants were collected at random from the middle row of each plot at maturity. Plant height, aerial biomass, harvest index and the number of spikes from each plant were evaluated. Plant height (cm) was measured from the base to the top of the plant, including the awns. Aerial biomass (g) was recorded as the dry weight of the aerial part of the plant. Harvest index was calculated as the ratio between grain weight and aerial biomass from each plant. Spike number per plant was the number of fertile tillers per plant. Moreover, the number of spikelets and grains were counted for all of the spikes of each plant. The number of grains per plant was recorded as the sum of the grains of all of the spikes of the plant. The spikelet number per spike was measured considering all of the spikelets in each spike, and an average value per plant was obtained. The grain number per spikelet was estimated for each plant as the ratio between the mean grain number per spike and the mean spikelet number per spike. Plot values were obtained by averaging the mean values of the 10 plants.

2.4. Statistical Analyses

Linear regression and bi- or tri-linear models were applied to determine the genetic progress over time, considering the year of release of the cultivars (between 1934 and 2015) as the independent variable (x) and the agronomic traits as the dependent variable (y). The genetic progress for grain yield was also tested considering only the genotypes released between 1980 and 2015. Cultivar deviations from the mean of each environment were averaged across the three environments and were used in regression analyses for each trait.
For all traits, the analyses of variance (ANOVA) were carried out to compare the cultivars grouped in three time periods (<1980, 1980–1999, 2000+) using the restricted maximum likelihood (REML) approach in SAS (PROC MIXED; SAS University edition; SAS Institute, Inc., Cary, NC, USA). To this end, the time period was considered as the fixed effect and the effects of the genotype, the environment, the genotype × environment interaction and the block nested within environment as random. Least-squares means (LSMeans) for each time period (<1980, 1980–1999, 2000+) were calculated and, when the group (time period) effect was significant, the Tukey test at p < 0.05 was used for pairwise comparisons.

3. Results

Grain yield and heading date showed a wide range of variation between the genotypes. The mean values of grain yield were 2855.6 kg ha−1 (with a range of 1395–3804 kg ha−1) in CA, 4076.6 kg ha−1 (3033–5133 kg ha−1) in BW and 3071 kg ha−1 (1845–4798 kg ha−1) in PS. The ranges of heading date were 67.5 to 82.5 days, 76.5 to 92 days and 67.5 to 78 days in CA, BW and PS, respectively.
Comparing three time periods (before 1980, 1980–1999 and after 2000), the ANOVA revealed that all traits, except aerial biomass, thousand kernel weight, spikes per plant and spikelets per spike, changed significantly (p < 0.05) over time (Table 3). The grain yield per unit area showed differences between the three time periods, while the rest of the significant traits showed changes between the old cultivars (<1980) and those released in one or two subsequent time periods, without any differences between the intermediate (1980–1999) and modern (2000+) cultivars (Table 3).
Regression analyses considering the cultivar’s release year (independent variable) and traits (dependent variable) showed that the linear regression analysis fit better than bi- or tri-linear models for all of the traits based on the Bayesian information criterion (BIC). Linear regressions showing the relationship between the cultivar’s release year and all traits are plotted in Figure 2, Figure 3 and Figure 4.

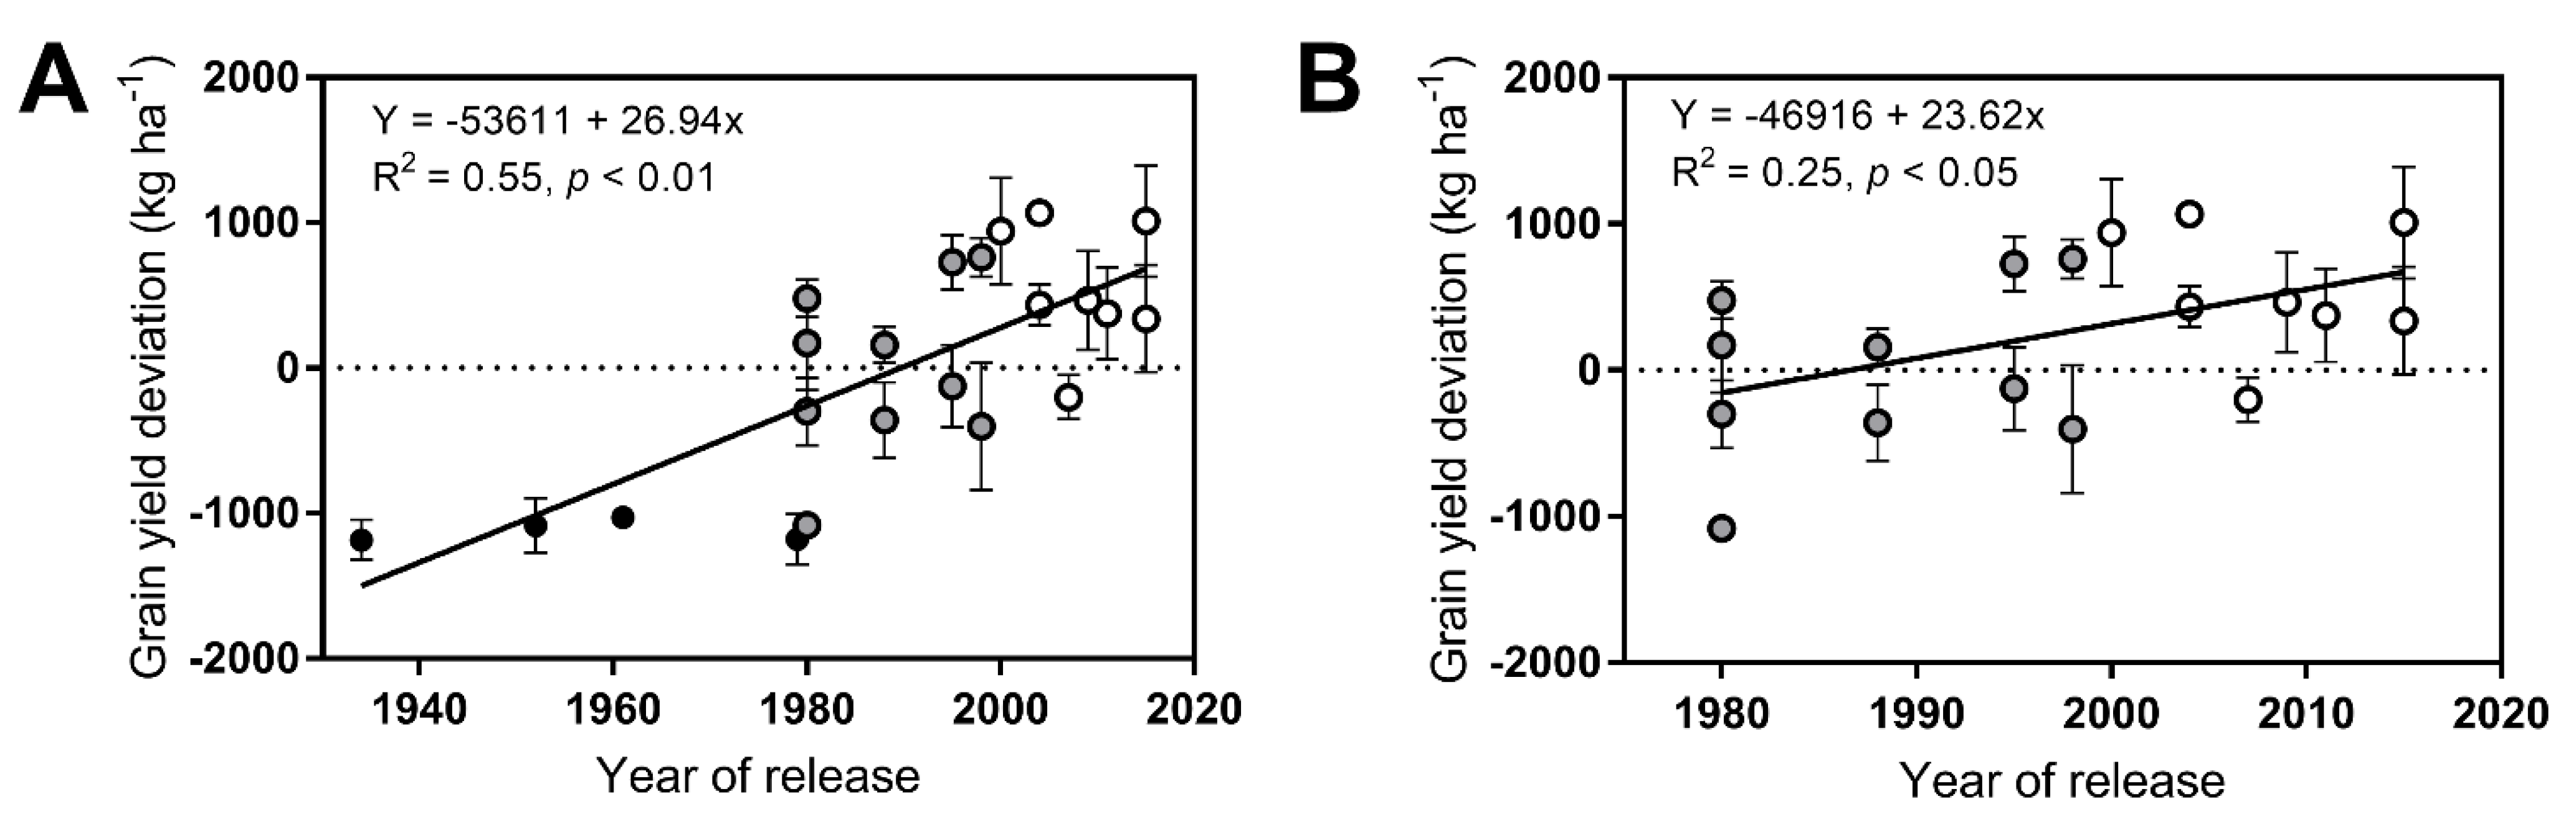
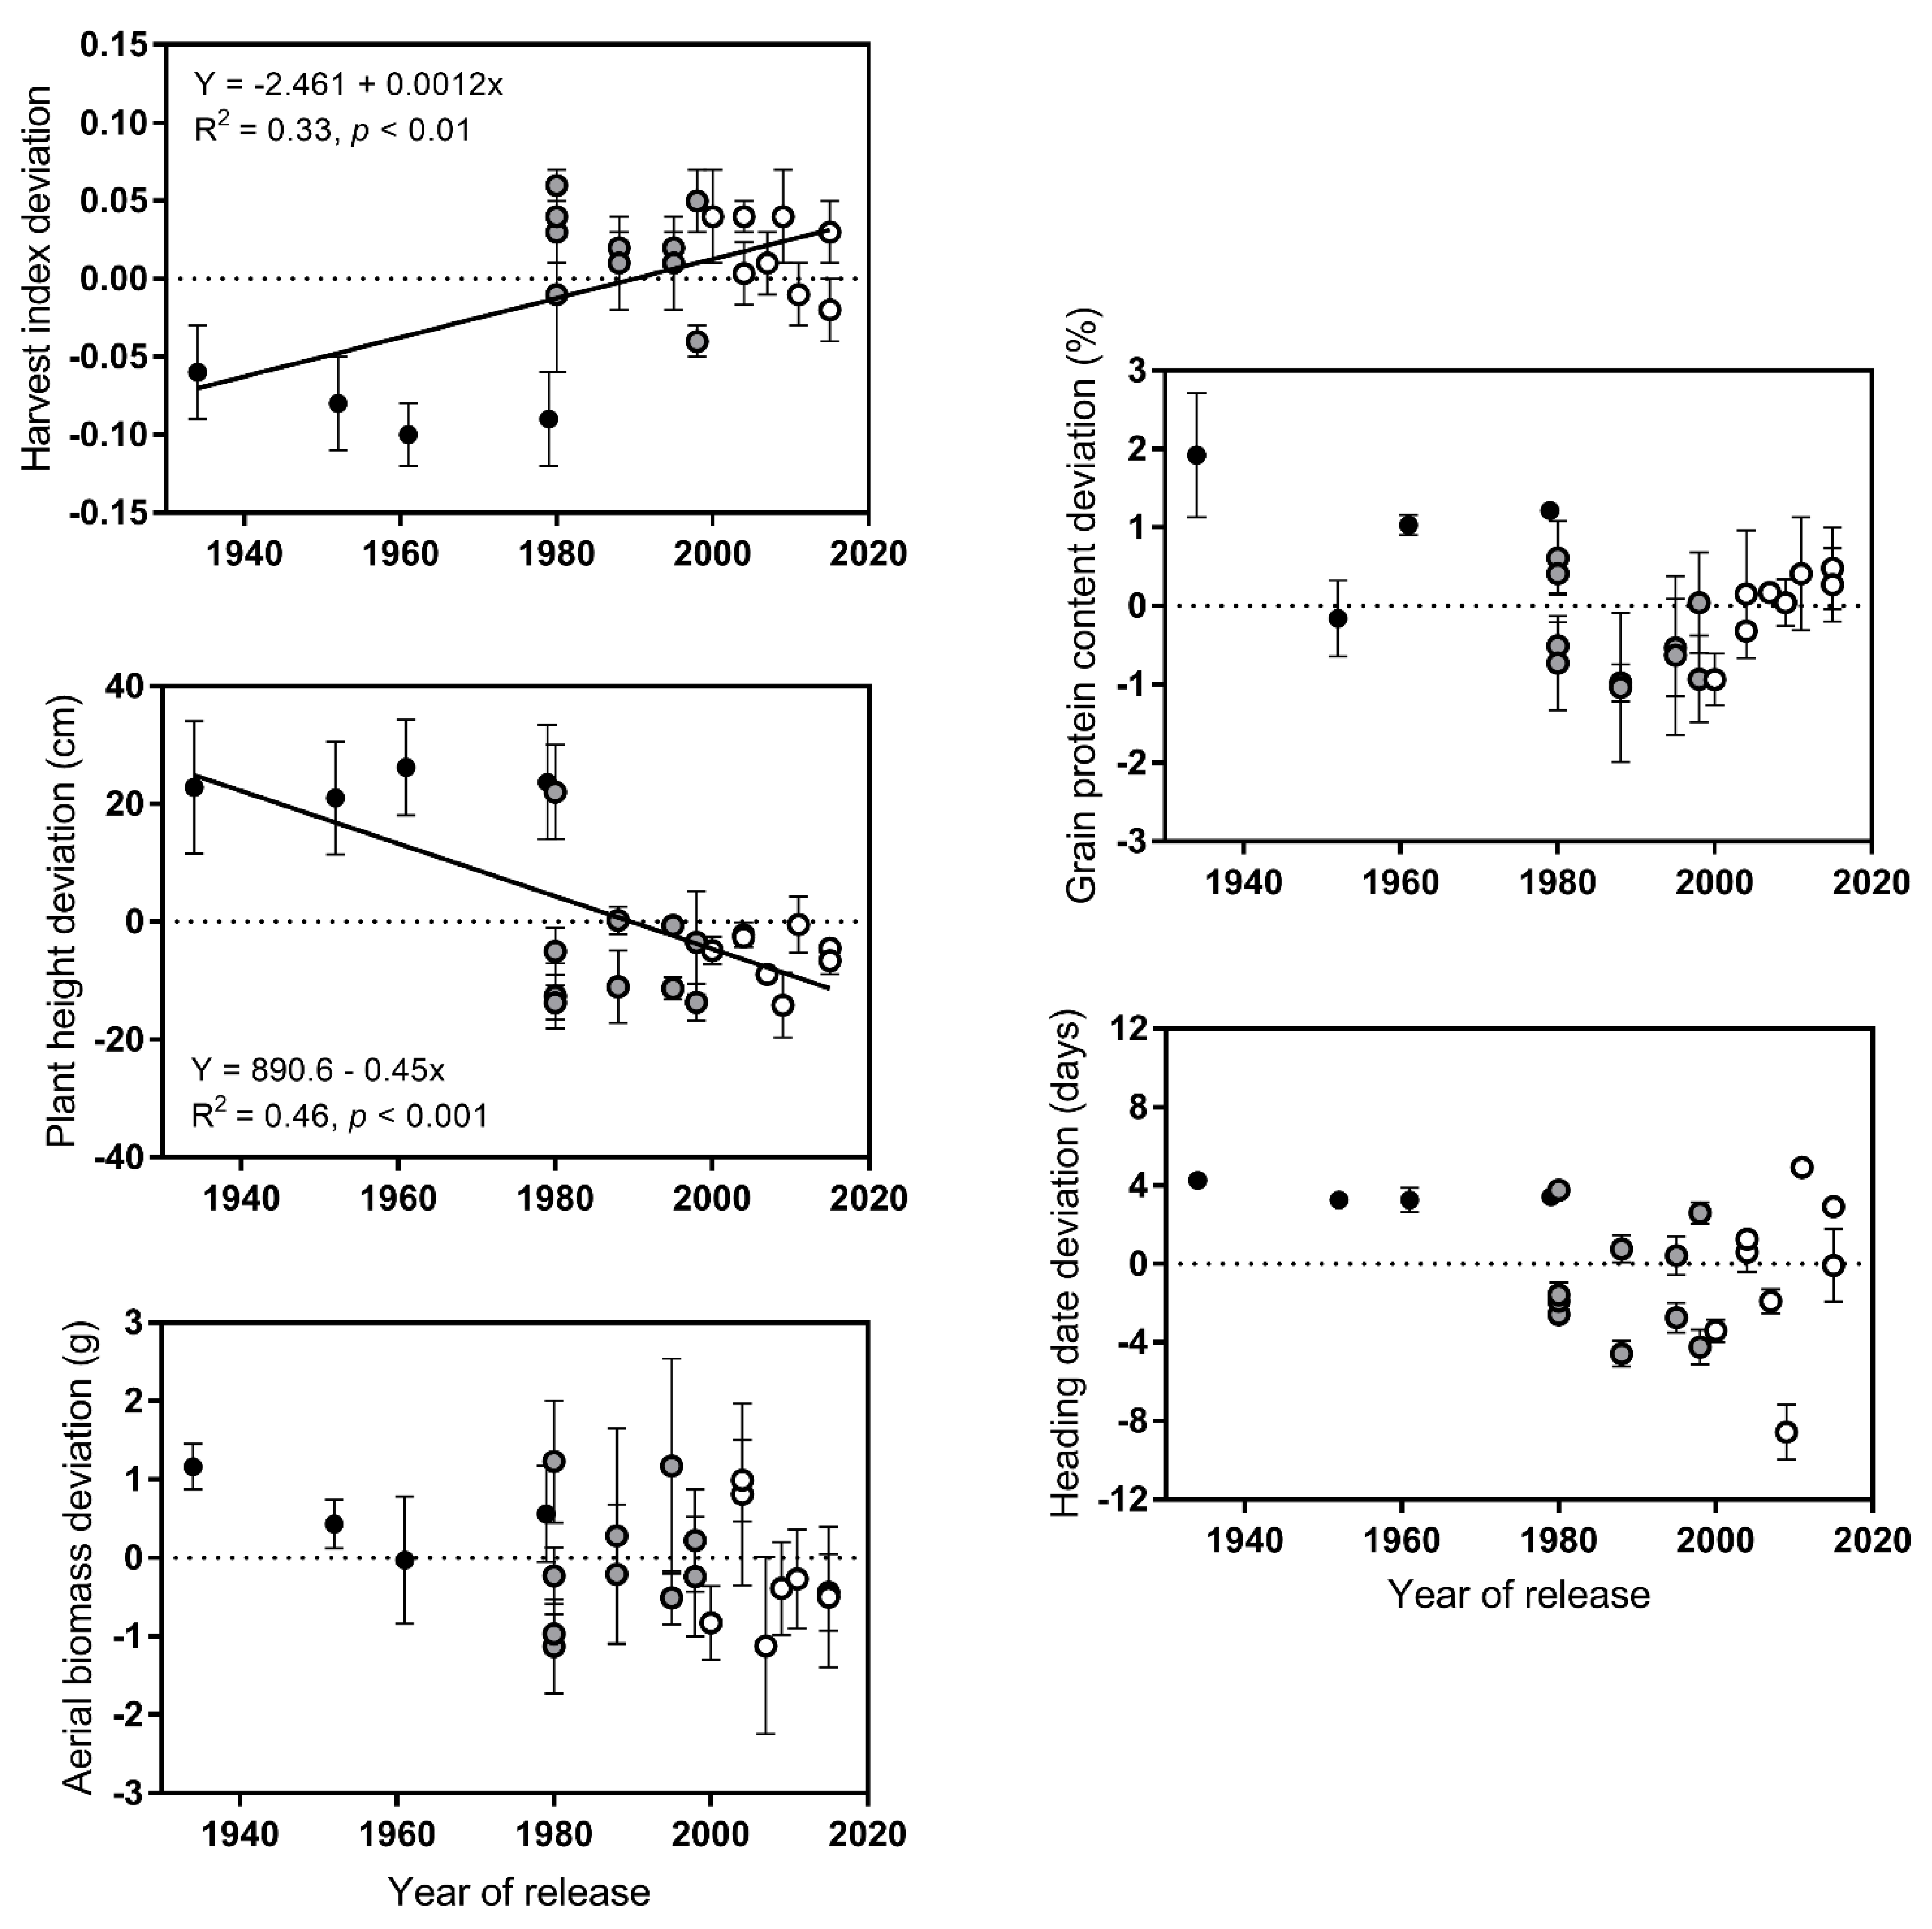
3.1. Grain Yield, Biomass Partition and Plant Height

The grain yield increased significantly from the old to intermediate cultivars by 51%, and from intermediate to modern by 16% (Table 3). A significant linear regression trend in grain yield (R2 = 0.55; p < 0.01) was observed over time, with an increase of 26.94 kg ha−1 yr−1 (0.81% yr−1) between 1934 and 2015 (Table 3 and Figure 2A). When the relationship between grain yield and the intermediate and modern cultivars was analyzed, a significant regression trend (R2 = 0.25; p < 0.05) was shown, with increases of 23.62 kg ha−1 yr−1 (Figure 2B). However, when only considering the semi-dwarf cultivars, the ones carrying the Rht-B1b allele (intermediate and modern cultivars without the tall Taganrog Buck Balcarce cultivar), no significant linear regression trend (R2 = 0.15; p = 0.12) was observed for grain yield.
Aerial biomass did not change over time, whereas the harvest index and plant height showed significant differences of 37% (0.10) and 24% (29 cm), respectively, in the old and modern cultivars (Table 3). Both of the latter traits showed a significant regression trend (R2 = 0.33; p < 0.01 for harvest index and R2 = 0.46; p < 0.001 for plant height) with the cultivar’s release year (Table 3 and Figure 3). The rates of genetic gains were 0.0012 yr−1 (0.34% yr−1) for the harvest index and -0.45 cm yr−1 (−0.47% yr−1) for plant height (Table 3 and Figure 3).

3.2. Grain Protein Content and Heading Date

Grain protein content and heading date did not show a significant linear regression trend with the cultivar’s release year (Table 3 and Figure 3). However, grain protein content decreased 7% from the old to modern cultivars and heading date decreased 5.5% (5 days) between the old and intermediate ones (Table 3).

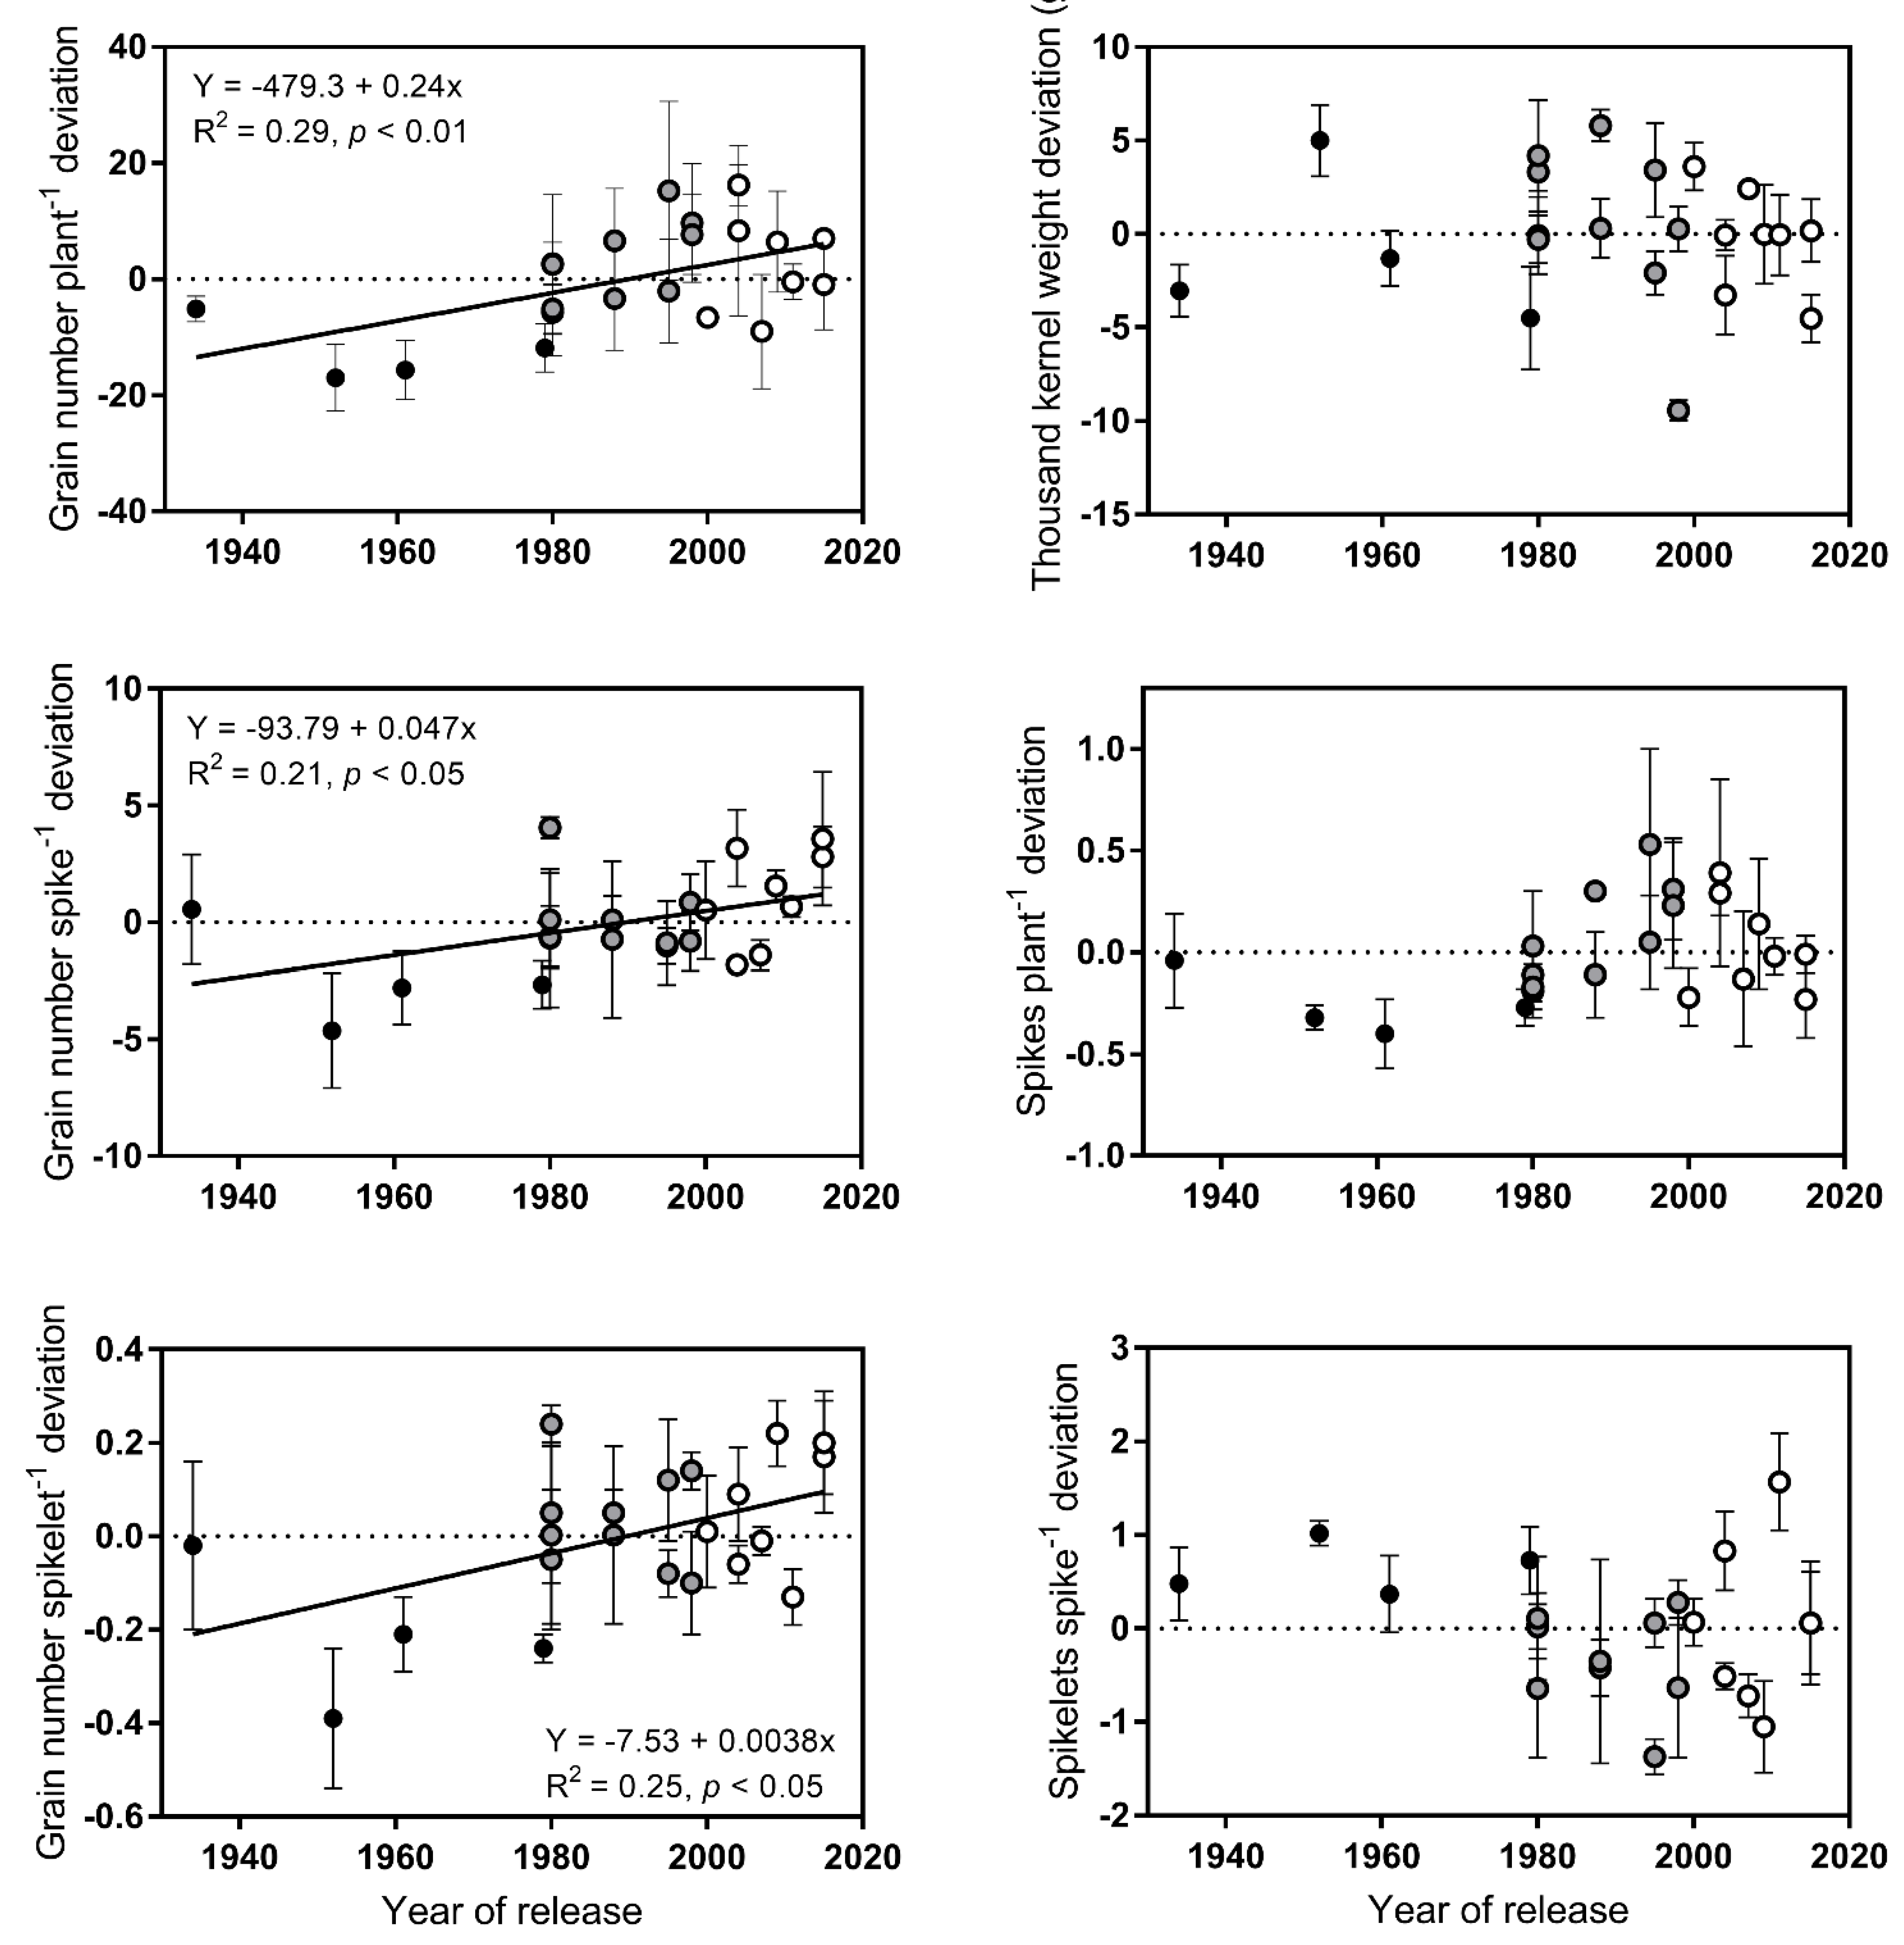
3.3. Yield Components

Of the two main yield components, the grain number per plant showed differences between genotypes over time, while thousand kernel weight did not show any differences (Table 3 and Figure 4). The increase in grain number per plant was mainly attributed to an increase in grain number per spike, and not to changes in the number of spikes per plant (Figure 4). An in-depth analysis of the components of the number of grains per spike showed that the number of grains per spikelet explained most of the variation, while the number of spikelets per spike did not change with the cultivar’s release year (Figure 4).
Grain number per plant, per spike and per spikelet increased 28%, 12% and 17% from the old to modern cultivars, respectively (Table 3). Significant linear regressions of grain number over time were observed, with rates of increase of 0.24 yr−1 (0.36% yr−1; R2 = 0.29; p < 0.01) for grain number per plant, 0.05 yr−1 (0.16% yr−1; R2 = 0.21; p < 0.05) for grain number per spike, and 0.004 yr−1 (0.21% yr−1; R2 = 0.25; p < 0.05) for grain number per spikelet (Table 3 and Figure 4).

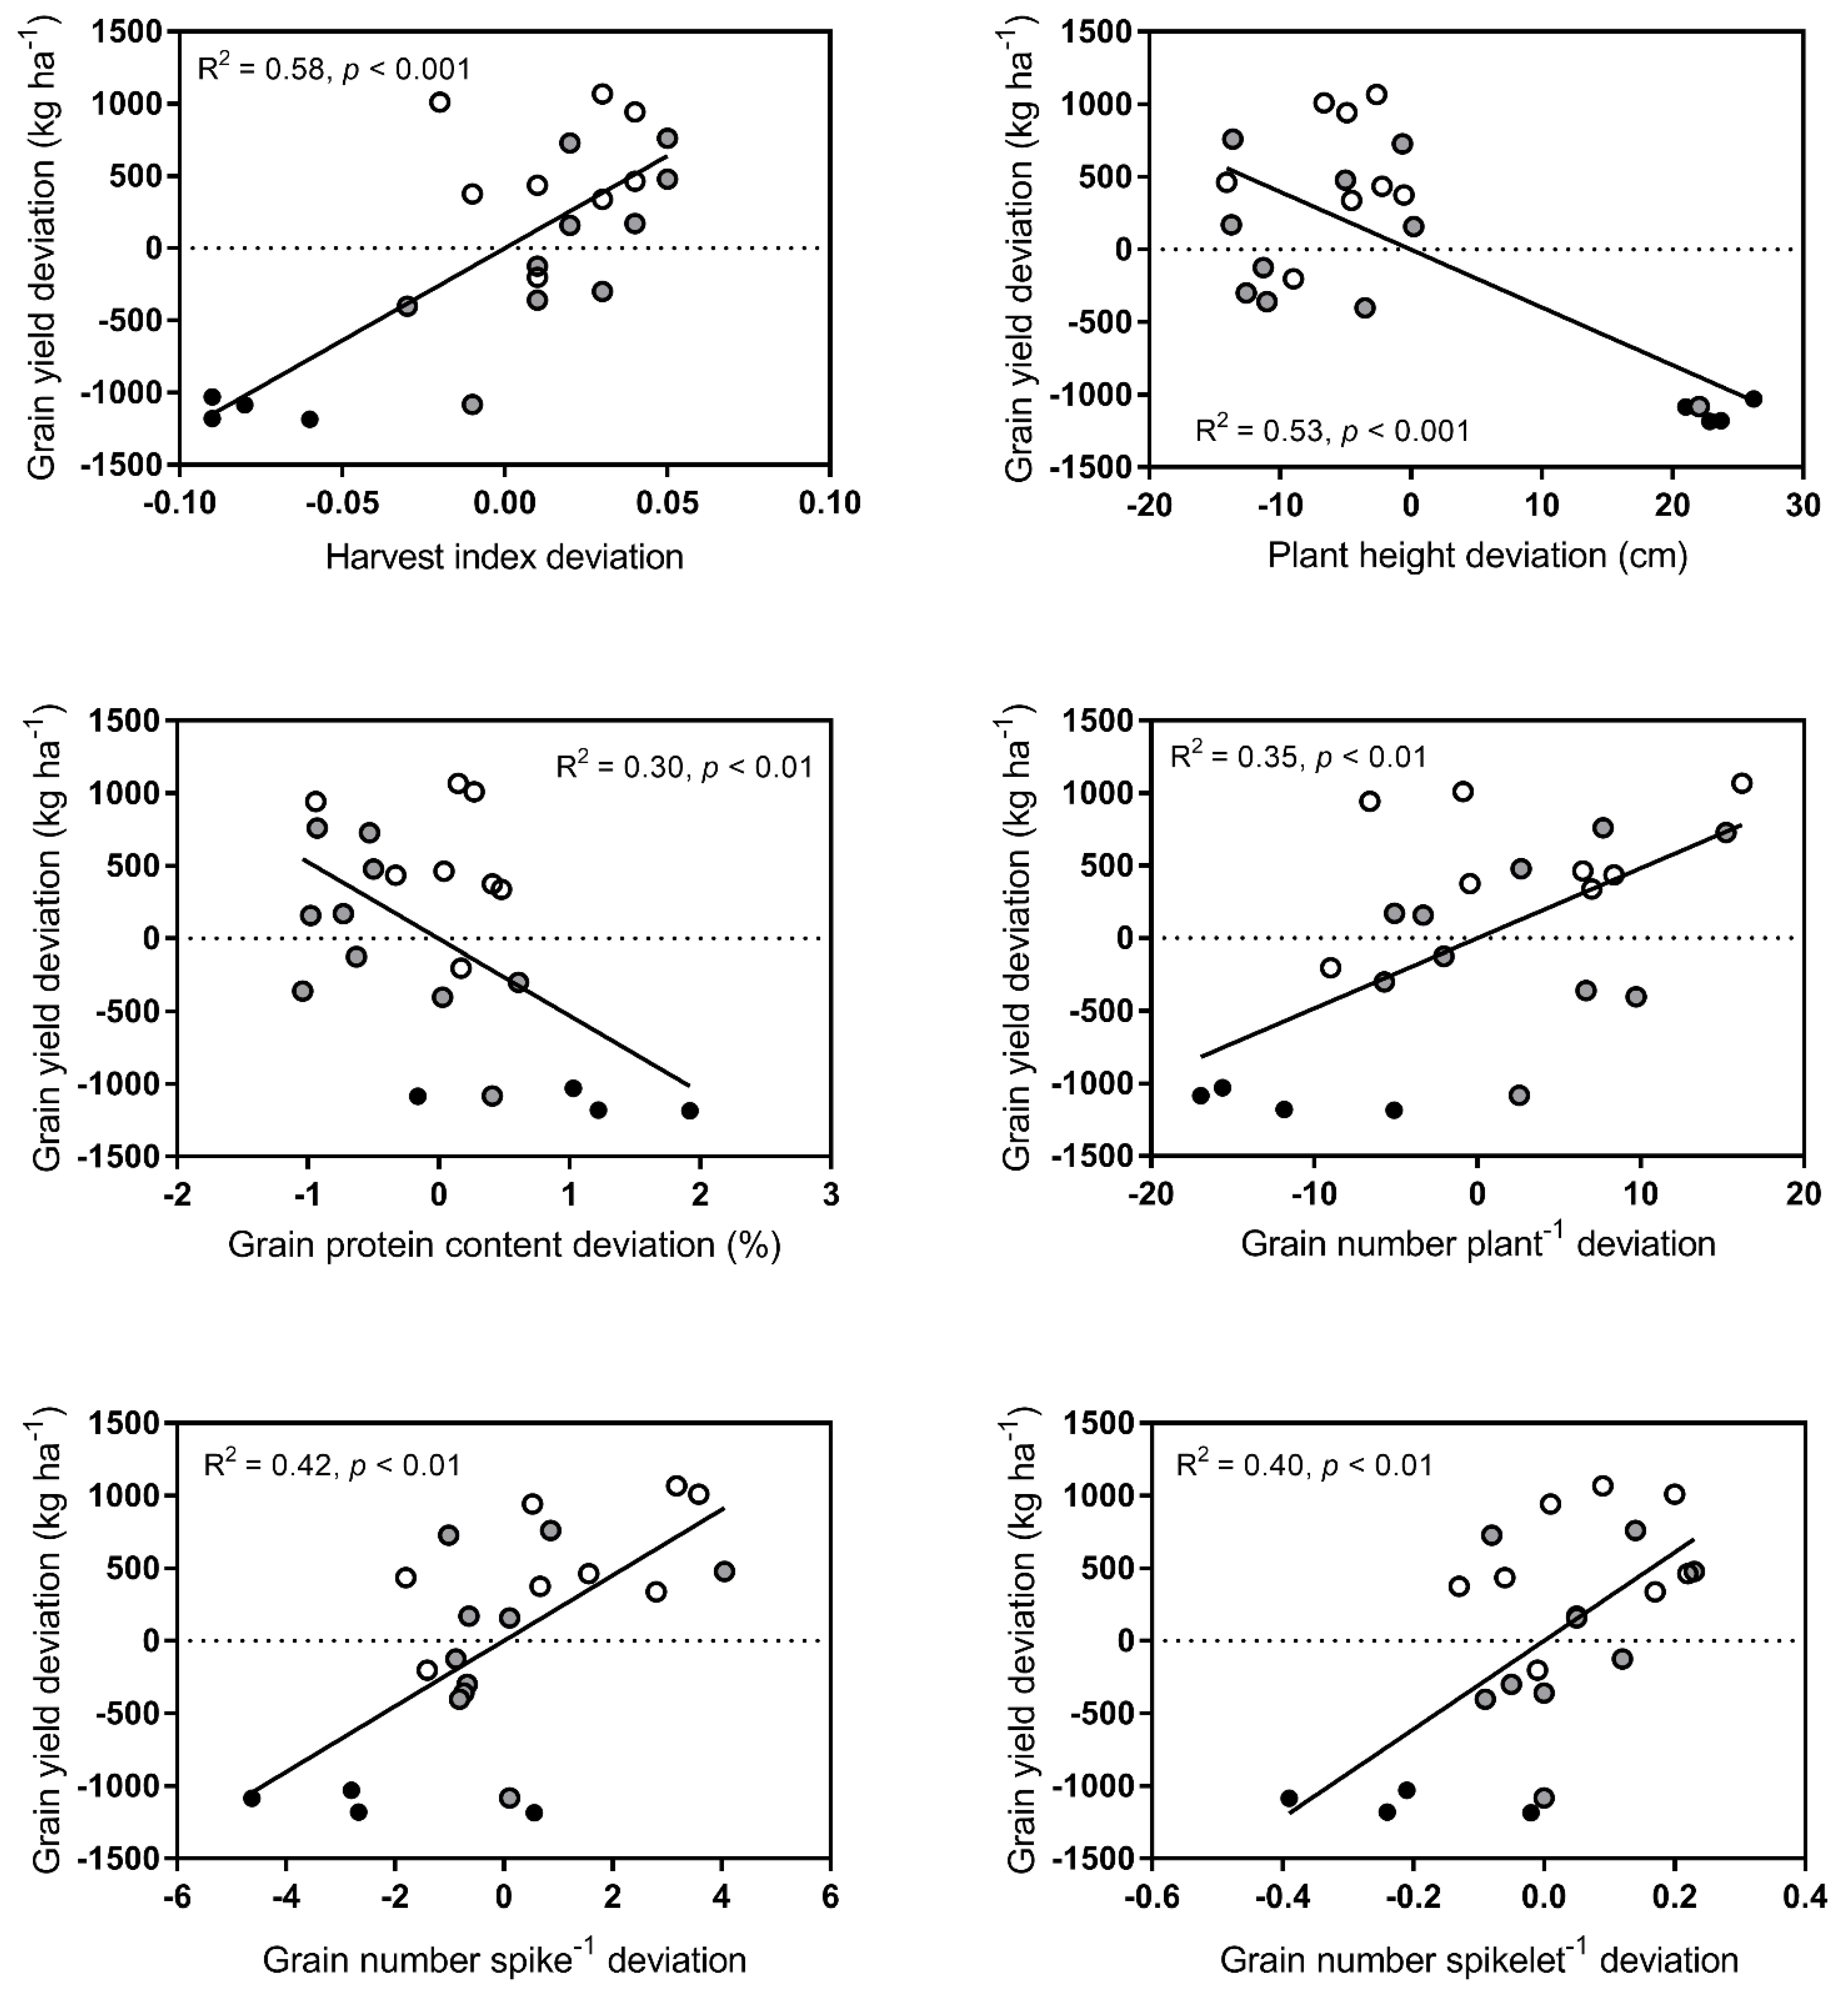
3.4. Relationships between Grain Yield and Other Traits

The harvest index was the variable that best explained the changes in grain yield (R2 = 0.58; p < 0.001) (Figure 5). Plant height (R2 = 0.53; p < 0.001), grain protein content (R2 = 30; p < 0.01) and grain number also showed significant trends in the linear regressions with grain yield (Figure 5), while the rest of the traits did not. Harvest index and grain number were positively associated with grain yield, while plant height and grain protein content showed negative associations with grain yield (Figure 5). Of the yield numerical components, grain number per spike explained most of the changes in grain yield (R2 = 0.42; p < 0.01), followed by grain number per spikelet (R2 = 0.40; p < 0.01) and grain number per plant (R2 = 0.35; p < 0.01) (Figure 5).

4. Discussion

In this study, we explored the yield-related traits associated with changes in grain yield using a set of cultivars released over a long time. To this end, three field trials located in representative sites of the main durum wheat production area in Argentina were used.
In recent decades, grain yield gains of wheat have decreased or even stopped. Although an increase in world food production will be necessary due to the exponential population growth, large increases in wheat genetic yield gains have not been reported or have even stopped in recent years. Our study showed that between 1934 and 2015, the Argentinian durum wheat grain yield increased by 26.94 kg ha−1 year−1, and after 1980, the increment was 23.62 kg ha−1 year−1. However, when only considering the post-Green Revolution cultivars (semi-dwarf) no significant linear regression trend between grain yield and the cultivar’s release year was observed. These results agree well with recent studies on durum wheat in Spain, which reported similar increases of 24 kg ha−1 year−1 between 1980 and 2003, and unclear increments of grain yield after 2003 [12]. Studies on bread wheat in Spain also reported low or null yield gains in recent years, observing increases in grain yield with the cultivar’s release year from 1940 to the 1970s in high yielding environments, with unclear increments after that [32]. In the case of bread wheat in Brazil, the increase in grain yield was 29 kg ha−1 year−1 between 1940 and 2009, and was without any yield increases if only the 1999 to 2009 period was considered [2]. Bread wheat in Argentina showed a tri-linear regression trend between grain yield and the cultivar’s release year, with increases of 0.8 kg ha−1 year−1 until the 1940s, 51 kg ha−1 year−1 between 1940 and 1999, and a lower increase of only 14 kg ha−1 year−1 between 1999 and 2011 [28]. Therefore, the grain yield of durum wheat in Argentina has followed a trend similar to that of other countries. Compared to Argentinian bread wheat, the grain yield of durum wheat increased following a linear trend without any clear year as inflection point, reaching a lower mean increase value in a similar period (bread wheat increased 32.5 kg ha−1 year−1 on average between 1940–2011). This could be attributed to less attention being paid to durum wheat compared to bread wheat in local breeding programs. Currently, there are 20 durum wheat cultivars developed in Argentina and registered in the National Register of Cultivars [29] for their commercialization in the country in 2015 or earlier, while more than 250 cultivars of bread wheat were registered in the same period.
Harvest index and plant height showed a significant trend with the cultivar’s release year, while aerial biomass remained unchanged. In addition, the harvest index and plant height were the traits that best explained the changes in grain yield (R2 = 0.58 for harvest index and R2 = 0.53 for plant height). The introduction of semi-dwarfism in Argentinian durum wheat since 1980, from crosses with CIMMYT’s germplasm, drastically reduced the plant height [24]. This agrees well with the observed reduction in plant height and the increase in harvest index observed between the first (<1980) and the two subsequent periods, together with the presence of the semi-dwarf allele of Rht-B1 in all modern and intermediate cultivars, except the tall cultivar Taganrog Buck Balcarce. Thus, yield increases were mostly achieved by a reduction in plant height (−0.45 cm year−1; R2 = 0.46; p < 0.001) that resulted in increases in the harvest index (0.0012 year−1; R2 = 0.33; p < 0.01) owing to a greater biomass partition to the grains, as was reported in many studies of durum [10,33] and bread wheat [18,21,34].
In modern Argentinian durum wheat cultivars, the harvest index was 0.37, similar or slightly lower than that reported for bread wheat cultivars in Argentina [28], China [6] and Australia [5]. However, this value is far from the values (0.50 and 0.53) reached in high-yielding environments [35,36] and from the maximum theoretical limit of 0.60 proposed by Austin et al. [37], suggesting that this trait still could be improved in modern wheat cultivars.
The grain protein content did not show any changes with the cultivar’s release year; however, it showed a significant association with grain yield (R2 = 0.30; p < 0.01) and a decrease of 7% between the old and modern cultivars. Similar reductions in protein content (approximately 10%) were reported by Subira et al. [38] in Italian and Spanish durum wheat cultivars during the 20th century. Reductions in the protein content have been largely associated with increases in grain yield due to the dilution effect of nitrogen in the grains [10,14,33,35,38].
The number of days between emergence and heading of the cultivars did not show any relationship with the cultivar’s release year during the analyzed period. Similar results were obtained by Chairi et al. [12] in Spanish durum wheat cultivars released between 1980 and 2010. However, when comparing the old cultivars (<1980) with the intermediate ones (1980–1999), we observed that the period from emergence to heading was shortened, although the modern (2000+) cultivars did not show any differences with either the old or the intermediate ones. An earlier heading date was the trend observed in the modern cultivars compared to the old ones in several studies of durum wheat breeding progress, as reported by Bassi and Nachit et al. [39] in ICARDA’s germplasm, and by De Vita et al. [10] in Italian cultivars.
Of the yield components, only the grain number was associated with yield improvements, increasing significantly with the cultivar’s release year and also showing a significant linear regression trend with grain yield. The grain number per square meter was the main trait largely associated with wheat yield improvements in previous studies [15,16]. According to reports on bread wheat in Argentina, increases in the number of grains per square meter were attributed to increases in the grain number per spike and not to changes in the number of spikes per square meter [28]. In our study, the grain number per spike showed increases at a rate of 0.05 year−1 (R2 = 0.21; p < 0.05), being similar to the rates reported by Del Pozo et al. [35] and De Vita et al. [10] for durum wheat in Chile and Italy, respectively. Of the components of grain number per spike, the grain number per spikelet explained most of the variation, while the number of spikelets per spike remained unchanged, as reported for Italian and Spanish durum wheat varieties [20,23]. The increments in grain number per spikelet could be attributed to the increased number of fertile florets in the spikelet, due to greater assimilate partitioning to the growing spike in the modern cultivars compared to the old ones [40].
Grain weight was unchanged among the Argentinian durum wheat cultivars released from 1934 to 2015. Some studies on the genetic progress of grain weight in durum wheat reported similar results but decreases, and also increases, in grain weight with the cultivar’s release year have also been reported. McCaig and Clarke [19] and Chairi et al. [12] observed a similar grain weight among old and modern cultivars in Canada and Spain, respectively. Royo et al. [20] reported decreases of 2 to 5% in the thousand kernel weight in the modern cultivars compared to the old ones in Italy and Spain, but in Chile, increases of grain weight with genetic improvements were reported [35]. Thus, changes in grain weight responded to whether it had been considered in the selection process by breeding and the trade-off with the number of grains [41].

5. Conclusions

Genetic gains in grain yield in Argentinian durum wheat were observed between the 1930s and 2010s. These gains were mostly associated with the incorporation of semi-dwarfism into the germplasm in the 1980s, with low or null genetic gains after that. The key traits that explained this improvement in grain yield were the harvest index and the number of grains. However, thousand kernel weight, the number of spikes per plant and the number of spikelets per spike could not be associated with grain yield and did not change over time. Our results agree well with other studies of breeding progress in different countries for grain yield and agronomic traits. Major breeding efforts are expected to increase grain yield in a climate change scenario without loss of quality and with a wide adaptation of the crop.

Author Contributions

Conceptualization, A.L.A., P.F.R. and V.E.; methodology, A.L.A., P.F.R. and V.E.; software, A.L.A. and P.F.R.; validation, A.L.A. and P.F.R.; formal analysis, A.L.A. and P.F.R.; investigation, A.L.A., P.F.R. and V.E.; resources, P.F.R. and V.E.; data curation, A.L.A. and P.F.R.; writing—original draft preparation, A.L.A., P.F.R. and V.E.; writing—review and editing, A.L.A., P.F.R. and V.E.; visualization, A.L.A., P.F.R. and V.E.; supervision, V.E.; project administration, V.E.; funding acquisition, V.E. All authors have read and agreed to the published version of the manuscript.

Funding

This research was funded by the Agencia Nacional de Promoción Científica y Tecnológica (ANPCYT-PICT 2015-N°1401), Universidad Nacional del Sur (UNS) and Consejo Nacional de Investigaciones Científicas y Técnicas (CONICET).

Data Availability Statement

Data available on request from the corresponding author.

Acknowledgments

We would like to thank Buck Semillas S.A., Asociación de Cooperativas Argentinas and INTA Barrow durum wheat breeding programs for providing the genotypes and conducting the experimental trials used in this study.

Conflicts of Interest

The authors declare no conflict of interest.

References

  1. Royo, C.; Soriano, J.M.; Alvaro, F. Wheat: A Crop in the Bottom of the Mediterranean Diet Pyramid. In Mediterranean Identities-Environment, Society, Culture; IntechOpen: London, UK, 2017. [Google Scholar] [CrossRef]
  2. Beche, E.; Benin, G.; da Silva, C.L.; Munaro, L.B.; Marchese, J.A. Genetic gain in yield and changes associated with physiological traits in Brazilian wheat during the 20th century. Eur. J. Agron. 2014, 61, 49–59. [Google Scholar] [CrossRef]
  3. Cox, T.S.; Shroyer, J.P.; Ben-hui, L.; Sears, R.G.; Martin, T.J. Winter Wheat Cultivars from 1919 to 1987. Crop Sci. 1988, 760, 756–760. [Google Scholar] [CrossRef]
  4. Nehe, A.; Akin, B.; Sanal, T.; Evlice, A.K.; Ünsal, R.; Dinçer, N.; Demir, L.; Geren, H.; Sevim, I.; Orhan, Ş.; et al. Genotype x environment interaction and genetic gain for grain yield and grain quality traits in Turkish spring wheat released between 1964 and 2010. PLoS ONE 2019, 14, e0219432. [Google Scholar] [CrossRef] [PubMed]
  5. Sadras, V.O.; Lawson, C. Genetic gain in yield and associated changes in phenotype, trait plasticity and competitive ability of South Australian wheat varieties released between 1958 and 2007. Crop Pasture Sci. 2011, 62, 533–549. [Google Scholar] [CrossRef]
  6. Yao, Y.; Lv, L.; Zhang, L.; Yao, H.; Dong, Z.; Zhang, J.; Ji, J.; Jia, X.; Wang, H. Genetic gains in grain yield and physiological traits of winter wheat in Hebei Province of China, from 1964 to 2007. Field Crop. Res. 2019, 239, 114–123. [Google Scholar] [CrossRef]
  7. Sissons, M. Role of durum wheat on quality of pasta and bread. Food 2008, 2, 75–90. [Google Scholar]
  8. Sabella, E.; Aprile, A.; Negro, C.; Nicolì, F.; Nutricati, E.; Vergine, M.; Luvisi, A.; De Bellis, L. Impact of climate change on durum wheat yield. Agronomy 2020, 10, 793. [Google Scholar] [CrossRef]
  9. Xynias, I.N.; Mylonas, I.; Korpetis, E.; Ninou, E.; Tsaballa, A.; Avdikos, I.; Mavromatis, A. Durum Wheat Breeding in the Mediterranean Region: Current Status and Future Prospects. Agronomy 2020, 10, 432. [Google Scholar] [CrossRef]
  10. De Vita, P.; Nicosia, O.L.D.; Nigro, F.; Platani, C.; Riefolo, C.; Di Fonzo, N.; Cattivelli, L. Breeding progress in morpho-physiological, agronomical and qualitative traits of durum wheat cultivars released in Italy during the 20th century. Eur. J. Agron. 2007, 26, 39–53. [Google Scholar] [CrossRef]
  11. Pecetti, L.; Annicchiarico, P. Agronomic value and plant type of Italian durum wheat cultivars from different eras of breeding. Euphytica 1998, 99, 9–15. [Google Scholar] [CrossRef]
  12. Chairi, F.; Vergara-Diaz, O.; Vatter, T.; Aparicio, N.; Nieto-Taladriz, M.T.; Kefauver, S.C.; Bort, J.; Serret, M.D.; Araus, J.L. Post-green revolution genetic advance in durum wheat: The case of Spain. Field Crop. Res. 2018, 228, 158–169. [Google Scholar] [CrossRef]
  13. Foulkes, M.J.; Reynolds, M.; Sylvester-Bradley, R. Genetic improvement of grain crops: Yield potential. In Crop Physiology: Applications for Genetic Improvement and Agronomy; Sadras, V., Calderini, D., Eds.; Elsevier Inc.: Amsterdam, The Neatherlands, 2009. [Google Scholar]
  14. McClung, A.M.; Cantrell, R.G.; Quick, J.S.; Gregory, R.S. Influence of the Rht1 semidwarf gene on yield, yield components and grain protein in durum wheat. Crop Sci. 1986, 26, 1095–1098. [Google Scholar] [CrossRef]
  15. Slafer, G.A.; Andrade, F.H.; Satorre, E.H. Genetic-improvement effects on pre-anthesis physiological attributes related to wheat grain-yield. Field Crop. Res. 1990, 23, 255–263. [Google Scholar] [CrossRef]
  16. Slafer, G.A.; Miralles, D.J. Fruiting Efficiency in Three Bread Wheat (Triticum aestivum) Cultivars Released at Different Eras. Number of Grains per Spike and Grain Weight. J. Agron. Crop Sci. 1993, 170, 251–260. [Google Scholar] [CrossRef]
  17. Miralles, D.J.; Slafer, G.A. Yield, biomass and yield components in dwarf, semi-dwarf and tall isogenic lines of spring wheat under recommended and late sowing dates. Plant Breed. 1995, 114, 392–396. [Google Scholar] [CrossRef]
  18. Reynolds, M.P.; Rajaram, S.; Sayre, K.D. Physiological and genetic changes of irrigated wheat in the post-green revolution period and approaches for meeting projected global demand. Crop Sci. 1999, 39, 1611–1621. [Google Scholar] [CrossRef]
  19. McCaig, T.N.; Clarke, J.M. Breeding durum wheat in western Canada: Historical trends in yield and related variables. Can. J. Plant Sci. 1995, 75, 55–60. [Google Scholar] [CrossRef]
  20. Royo, C.; Álvaro, F.; Martos, V.; Ramdani, A.; Isidro, J.; Villegas, D.; García Del Moral, L.F. Genetic changes in durum wheat yield components and associated traits in Italian and Spanish varieties during the 20th century. Euphytica 2007, 155, 259–270. [Google Scholar] [CrossRef]
  21. Austin, R.B.; Ford, M.A.; Morgan, C.L. Genetic improvement in the yield of winter wheat: A further evaluation. J. Agric. Sci. 1989, 112, 295–301. [Google Scholar] [CrossRef]
  22. Slafer, G.A.; Andrade, F.H. Genetic Improvement in Bread Wheat (Triticum aestivum) Yield in Argentina. Field Crop. Res. 1989, 21, 289–296. [Google Scholar] [CrossRef]
  23. Álvaro, F.; Isidro, J.; Villegas, D.; García del Moral, L.F.; Royo, C. Old and modern durum wheat varieties from Italy and Spain differ in main spike components. Field Crop. Res. 2008, 106, 86–93. [Google Scholar] [CrossRef]
  24. Rajaram, S.; Saari, E.E.; Hettel, G.P. Durum Wheats: Challenges and Opportunities. In Wheat Special Report No.9; CIMMYT: Mexico City, Mexico, 1992; ISBN 968-6127-77-1. [Google Scholar]
  25. Roncallo, P.F.; Larsen, A.O.; Achilli, A.L.; Pierre, C.S.; Gallo, C.A.; Dreisigacker, S.; Echenique, V. Linkage disequilibrium patterns, population structure and diversity analysis in a worldwide durum wheat collection including Argentinian genotypes. BMC Genom. 2021, 22, 233. [Google Scholar] [CrossRef] [PubMed]
  26. Achilli, A.L.; Roncallo, P.F.; Larsen, A.O.; Dreisigacker, S.; Echenique, V. Population structure, allelic variation at Rht-B1 and Ppd-A1 loci and its effects on agronomic traits in Argentinian durum wheat. Sci. Rep. 2022, 12, 9629. [Google Scholar] [CrossRef] [PubMed]
  27. Calderini, D.F.; Dreccer, M.F.; Slafer, G.A. Genetic improvement in wheat yield and associated traits. A re-examination of previous results and the latest trends. Plant Breed. 1995, 114, 108–112. [Google Scholar] [CrossRef]
  28. Lo Valvo, P.J.; Miralles, D.J.; Serrago, R.A. Genetic progress in Argentine bread wheat varieties released between 1918 and 2011: Changes in physiological and numerical yield components. Field Crop. Res. 2018, 221, 314–321. [Google Scholar] [CrossRef]
  29. RNC, Catálogo Nacional de Cultivares. 2021. Available online: https://gestion.inase.gob.ar/consultaGestion/gestiones (accessed on 4 March 2021).
  30. Ellis, M.H.; Spielmeyer, W.; Gale, K.R.; Rebetzke, G.J.; Richards, R.A. “Perfect” markers for the Rht-B1b and Rht-D1b dwarfing genes in wheat. Theor. Appl. Genet. 2002, 105, 1038–1042. [Google Scholar] [CrossRef]
  31. Zadoks, J.C.; Chang, T.T.; Konzak, C.F. A decimal code for the growth stages of cereals. Weed Res. 1974, 14, 415–421. [Google Scholar] [CrossRef]
  32. Acreche, M.M.; Briceño-Félix, G.; Sánchez, J.A.M.; Slafer, G.A. Physiological bases of genetic gains in mediterranean bread wheat yield in Spain. Eur. J. Agron. 2008, 28, 162–170. [Google Scholar] [CrossRef]
  33. Motzo, R.; Fois, S.; Giunta, F. Relationship between grain yield and quality of durum wheats from different eras of breeding. Euphytica 2004, 140, 147–154. [Google Scholar] [CrossRef]
  34. Calderini, D.F.; Slafer, G.A. Has yield stability changed with genetic improvement of wheat yield? Euphytica 1999, 107, 51–59. [Google Scholar] [CrossRef]
  35. Del Pozo, A.; Matus, I.; Ruf, K.; Castillo, D.; Méndez-Espinoza, A.M.; Serret, M.D. Genetic advance of durum wheat under high yielding conditions: The case of Chile. Agronomy 2019, 9, 454. [Google Scholar] [CrossRef]
  36. Foulkes, M.J.; Snape, J.W.; Shearman, V.J.; Reynolds, M.P.; Gaju, O.; Sylvester-Bradley, R. Genetic progress in yield potential in wheat: Recent advances and future prospects. J. Agric. Sci. 2007, 145, 17–29. [Google Scholar] [CrossRef]
  37. Austin, R.B. Physiological limitations to cereals yields and ways of reducing them by breeding. In Opportunities for Increasing Crop Yields; Hurd, R.G., Biscoe, P.V., Dennis, C., Eds.; Association of Applied Biology: Boston, MA, USA, 1980; pp. 3–19. [Google Scholar]
  38. Subira, J.; Peña, R.J.; Álvaro, F.; Ammar, K.; Ramdani, A.; Royo, C. Breeding progress in the pasta-making quality of durum wheat cultivars released in Italy and Spain during the 20th Century. Crop Pasture Sci. 2014, 65, 16–26. [Google Scholar] [CrossRef]
  39. Bassi, F.M.; Nachit, M.M. Genetic Gain for Yield and Allelic Diversity over 35 Years of Durum Wheat Breeding at ICARDA. Crop Breed. Genet. Genom. 2019, 1, e190004. [Google Scholar] [CrossRef]
  40. Miralles, D.J.; Rharrabti, Y.; Royo, C.; Villegas, D.; García del Moral, L.F. Grain setting strategies of Mediterranean durum wheat cultivars released in different periods (1900–2000). In Genotype-Phenotype: Narrowing the Gaps; The Royal Agricultural College: Cirencester, UK, 2002. [Google Scholar]
  41. Sadras, V.O. Evolutionary aspects of the trade-off between seed size and number in crops. Field Crop. Res. 2007, 100, 125–138. [Google Scholar] [CrossRef]
Figure 1. Monthly precipitation, maximum, minimum and mean temperatures and mean global solar radiation values during each growing season ((a) Cabildo 2014, (b) Barrow 2017 and (c) Pieres 2014). SD: sowing date; HD: heading date; Temp: temperature; Rad: radiation.
Agronomy 12 02151 g001
Figure 2. Linear regression analyses between grain yield deviation and (A) cultivars released between 1934 and 2015, and (B) cultivars released between 1980 and 2015. Each point represents the average of grain yield deviation for each cultivar with respect to the mean yield value in each experiment (Cabildo and Pieres in 2014 and Barrow in 2017). Black, grey and white points correspond to cultivars released in the periods 1934–1979, 1980–1999 and 2000–2015, respectively. Horizontal dotted lines represent the mean value of grain yield of each experiment, and the vertical lines for each point represent the standard error of the mean.
Agronomy 12 02151 g002
Figure 3. Regression analyses between harvest index, plant height, aerial biomass, grain protein content and heading date deviations and the cultivar’s release year. Each point represents the average of trait deviation for each cultivar with respect to the mean value in each experiment (Cabildo and Pieres in 2014 and Barrow in 2017). Black, grey and white points correspond to the cultivars released in the periods 1934–1979, 1980–1999 and 2000–2015, respectively. Horizontal dotted lines represent the mean value of the trait for each experiment, and the vertical lines for each point represent the standard error of the mean.
Agronomy 12 02151 g003
Figure 4. Regression analyses between grain number per plant, thousand kernel weight, grain number per spike, spikes per plant, grain number per spikelet and spikelets per spike deviations and the cultivar’s release year. Each point represents the average of trait deviation for each cultivar with respect to the mean value in each experiment (Cabildo and Pieres in 2014 and Barrow in 2017). Black, grey and white points correspond to the cultivars released in the periods 1934–1979, 1980–1999 and 2000–2015, respectively. Horizontal dotted lines represent the mean value of the trait for each experiment, and the vertical lines for each point represent the standard error of the mean.
Agronomy 12 02151 g004
Figure 5. Regression analyses between the grain yield deviation and harvest index, plant height, grain protein content and grain number deviations. Each point represents the average of trait deviation for each cultivar with respect to the mean values in each experiment (Cabildo and Pieres in 2014 and Barrow in 2017). Black, grey and white points correspond to the cultivars released in the periods 1934–1979, 1980–1999 and 2000–2015, respectively. Horizontal dotted lines represent the mean value of grain yield for each experiment.
Agronomy 12 02151 g005
Table 1. Durum wheat cultivars released in Argentina during the 1934–2015 period.
PeriodCultivarYear of ReleaseRht-B1 Allele a
OldTaganrog1934Rht-B1a
Candeal Durumbuck1952Rht-B1a
Taganrog Vilela Fideos1961Rht-B1a
Taganrog Selección Buck1979Rht-B1a
IntermediateTaganrog Buck Balcarce1980Rht-B1a
Balcarceño INTA1980Rht-B1b
Bonaerense Valverde1980Rht-B1b
Buck Mechongue1980Rht-B1b
Bonaerense Quilaco1988Rht-B1b
Buck Cristal1988Rht-B1b
BonINTA Cumenay1995Rht-B1b
Buck Ambar1995Rht-B1b
BonINTA Facon1998Rht-B1b
Buck Topacio1998Rht-B1b
ModernBuck Esmeralda 2000Rht-B1b
BonINTA Carilo2004Rht-B1b
Buck Platino2004Rht-B1b
ACA 1801 F2007Rht-B1b
ACA 1901 F2009Rht-B1b
Buck Granate2011Rht-B1b
BonINTA Quillen2015Rht-B1b
Buck Zafiro2015Rht-B1b
aRht: reduced height; Rht-B1a: tall cultivars; Rht-B1b: semi-dwarf cultivars. Nomenclature described in Ellis et al. [30].
Table 2. Soil tests in three locations of Argentina where the field experiments were conducted (in the top 20 cm of the soil). OM: organic matter; P: phosphate; NO3: nitrate; SO42−: sulphate; CA14: Cabildo 2014; BW17: Barrow 2017; PS14: Pieres 2014.
EnvironmentCA14BW17PS14
pH66.35.8
OM (%)2.13.84
P (ppm)37.530.743.4
NO3 (ppm)34.611027.2
SO42− (ppm)- a- a6.7
a Data on SO42− for CA14 and BW17 experiments are not available.
Table 3. LSMeans by periods and absolute and relative genetic changes in grain yield and agronomic traits of Argentinian durum wheat cultivars between 1934 and 2015.
TraitOld
(<1980)
Intermediate (1980–1999)Modern (2000+)R2Absolute ChangeRelative Change (% yr−1)
N4108
Grain yield (kg ha−1)2215.95 c3338.2 b3888.93 a0.55 ***26.94 kg yr−10.81
Harvest index0.27 b0.37 a0.37 a0.33 **0.0012 yr−10.34
Aerial biomass (g)7.86 a7.30 a7.11 a0.12
Grain protein content (%)13.62 a12.19 b12.65 b0.15
Plant height (cm)119.63 a91.27 b90.61 b0.46 ***−0.45 cm yr−1−0.47
Heading date (days)82.63 a78.07 b78.54 ab0.12
Thousand kernel weight (g)40.12 a41.63 a40.87 a0.01
Grain number plant−1 53.49 b68.71 a68.51 a0.29 **0.24 yr−10.36
Spikes plant−11.95 a2.29 a2.23 a0.14
Grain number spike−128.54 b30.96 ab32.05 a0.21 *0.05 yr−10.16
Grain number spikelet−11.69 b1.94 a1.97 a0.25 *0.004 yr−10.21
Spikelets spike−116.94 a15.98 a16.31 a0.07
Different letters within each row indicate significant differences at p < 0.05 according to Tukey’s test. *, ** and *** indicate significant differences at 0.05, 0.01 and 0.001, respectively.
Publisher’s Note: MDPI stays neutral with regard to jurisdictional claims in published maps and institutional affiliations.

