Article

Variable Selection on Reflectance NIR Spectra for the Prediction of TSS in Intact Berries of Thompson Seedless Grapes

by
Chrysanthi Chariskou
1,
Eleni Vrochidou
1,
Andries J. Daniels
2,3 and
Vassilis G. Kaburlasos
1,*
1
HUMAIN-Lab, Department of Computer Science, School of Sciences, International Hellenic University (IHU), 65404 Kavala, Greece
2
Department of Viticulture and Oenology, Faculty of AgriSciences, Stellenbosch University, Matieland, Stellenbosch 7602, South Africa
3
ARC Infruitec-Nietvoorbij, Private bag X5026, Stellenbosch 7599, South Africa
*
Author to whom correspondence should be addressed.
Agronomy 2022, 12(9), 2113; https://doi.org/10.3390/agronomy12092113
Submission received: 12 May 2022 / Revised: 31 August 2022 / Accepted: 1 September 2022 / Published: 5 September 2022

Abstract

:
Fourier-transform near infrared (FT-NIR) reflection spectra of intact berries of the grape variety Thompson seedless were used to predict total soluble solids (TSS) content. From an initial dataset, 12 subsets were considered by applying variable selection to extract the reflectance values at wavenumbers most correlated to the chemometrically measured TSS content. The datasets were processed by both multiple linear regression (MLR) and partial least squares (PLS) methods towards predicting the TSS content from the reflection values of each spectrum. Prediction accuracy was measured in terms of both the coefficient of determination R2 and the root mean squared error (RMSE). It was found that variable selection improved the prediction accuracy with both processing methods; values of R2 of up to 0.972 and 0.926 and RMSE of up to 0.306 and 0.472 were reported with MLR and PLS, respectively. The combination of variable selection and MLR displayed (a) higher accuracy when the spectra dataset variation was limited, (b) lower accuracy with datasets of large variation such as those with spectra from a variety of maturity stages, and (c) failed with more complex spectra sets such as those from different harvest years. The combination of variable selection and PLS has demonstrated reliable prediction results with various degrees of dataset complexity.

1. Introduction

Grapes are non-climacteric fruits; they do not ripen any further if harvested [1]. Therefore, desired maturity must be reached before any harvesting operation. However, traditional manual maturity assessment presupposes exhaustive sampling as well as chemical analyses, which are labor intensive, costly, and time-consuming; moreover, destructive techniques to determine grape compounds are involved. Intact grape ripeness prediction can overcome these difficulties and move toward sustainable resources management. Moreover, since the trend in modern agriculture is the use of robotic automations at various stages of the production and processing, including harvesting [2], it is essential for a robot to be able to determine the maturity level of grapes for appropriate decision making. Toward this end, intact preharvest automated solutions for in-field ripeness determination were developed, including portable sensors, such as cameras, NIR-spectrometers, and refractometers [3,4], that could be mounted on ground robots.
Among other intact methods, NIR spectroscopy has reported promising results for harvest maturity estimation of many fruits [5], including grapes [1,6]. The absorption or reflectance of infrared light by fruits, vegetables, and other crops is widely used to quantify a variety of their constituents [7,8]. A search in Scopus for articles on the use of NIR spectra for the estimation of the concentrations of various plant compounds produced over 3500 documents, with a significant annual increase since 1994. Over one-third of these articles were published in the last five years. Half of them discuss non-destructive methodologies for estimation of concentrations of plant components. NIR-based methods rely on the absorption of part of the spectrum of the incident infrared light by the compound in the intact tissue, whereas the remaining part of the spectrum is reflected. The intensity of the reflected light is measured by the receiver of an NIR spectrometer. Analysis of the reflection spectra of NIR radiation has been established as a widely-used convenient, cost-effective, quick, and intact method [1,9,10,11,12,13,14,15,16].
NIR-based methods of data analysis and prediction are discussed in several review articles [17,18,19,20,21,22]. The NIR spectra are characterized by significantly overlapping basic, overtone, and combination peaks. Hidden peaks are often revealed in the second derivative spectra [23]. Partial least squares (PLS) [24] and simple or multiple linear regression models are used for the prediction of maturity-related parameters [25].
Of particular importance is the estimation of sugars and organic acids in fruits since the ratio of their concentrations is related to the maturity stage of the fruit [9,26]. Sugars are usually estimated in degrees Brix (oBrix), which are based on the refraction of light as it passes thought a solution of sugars. One degree Brix corresponds to the diffraction caused by a 1% w/w solution of sucrose. However, other solutes also diffract light so that the correspondence of sugar concentration to refraction is relative and approximate. Therefore, the total soluble solid (TSS) content is the measure of sugar content most widely used. The accuracy of prediction of the sugar concentration from the NIR reflection spectra is measured by both the square of Pearson’s correlation coefficient R2 and the root mean squared error (RMSE) of prediction. High R2 and low RMSE indicate a good accuracy of prediction.
In this work, an effort is undertaken to improve the analysis procedures of Daniels et al. [1] by applying variable selection on the wavenumbers of the NIR spectra. The aim of this work is to formulate a procedure suitable for the estimation of sugars in grapes, focusing on the Thompson Seedless cultivar. Variable selection was used to predict the concentrations of a variety of compounds in several plant and animal tissues or in extracts from them [10,11,12,13,14,15,16,27]. However, a literature search in Scopus did not return any articles on the application of variable selection for the prediction of sugar or TSS content in intact grape berries. Moreover, MLR and PLS methods were employed towards TSS prediction. MLR is an analytical method that applies a suitable coefficient to the reflection values of each wavenumber to fit the measured TSS value as close as possible to the linear combination of the modified reflectance values of the whole series of wavenumbers. In PLS, these linear combinations, named PLS components, are used as prediction variables in place of the reflectance values. A comparison of both analytical procedures is provided in this work and applied to the entire dataset of spectra and to a selection of wavenumbers most correlated to the TSS.

2. Materials and Methods

A dataset of diffuse reflectance FT-NIR for the Thompson seedless variety of grapes was available from the related work of Daniels et al. [1]. The grape berry bunches were harvested at their optimal maturity stage of three weeks (harvest 1) and also at a later, more mature stage (harvest 2) in 2016 and 2017. A MATRIX-F FT-NIR spectrometer connected via a fiber optic cable (1 m) to a NIR emission head (Bruker Optics, Ettlingen, Germany) was used for spectra recording. Each bunch was placed on the sample platform directly below four air-cooled tungsten NIR light sources (12 V, 5 W each) housed in the emission head (230 mm diameter, 185 mm height) and scanned individually. The spectra were recorded in the range from 3995.93 to 11,987.8 cm−1, at 7.7–7.8 cm−1 intervals, including total reflection intensities at 1037 different wavenumbers. Each spectrum was derived from one grape sample and was the average of thirty-two scans of the same grape sample. The standard error of laboratory (SEL) for, respectively, TSS (±0.03), TA (±0.05), and pH (±0.20) were those reported by Daniels et al. [1]. Certified standards for each parameter were tested daily in triplicate. SEL was calculated as the average of the difference between the true value of the certified standard and the measured result (triplicate measurements). Grape samples were analyzed once. TSS values are reported in milligrams of solids per liter of water (mg/L).
The initial dataset was divided in four subsets: dataset 1 was comprised from spectra taken from grapes of harvest 1 of 2016 from the location Wellington, dataset 2 contained spectra from harvest 2 of 2016 also from Wellington, dataset 3 was made up by combining dataset 1 and 2, and dataset 4 made up of spectra from both harvests from Wellington in 2016 and 2017. A series of datasets of increasing complexity was thus created. One of the goals of this work is to examine the performance of the two regression methods, the MLR and PLS regression, with datasets of increasing levels of complexity. The development of the python algorithm for data processing and prediction analysis was implemented in the Anaconda environment. The datasets were saved in .xlsx format. The TSS content column was converted into a separate one-dimensional array along with the top wavenumber-containing line of the dataset. Multiplicative scatter correction (MSC) was applied to normalize the reflectance spectra. Variable selection was applied to all four spectra subsets, by adaptation of a function communicated by Pelliccia D (https://nirpyresearch.com/variable-selection-method-pls-python/, accessed on 13 July 2022). The variable selection function uses a double PLS regression loop. The external loop runs the regression with a specified maximum number of components and sorts the spectra according the ascending absolute value of the PLS coefficient. The internal loop filters out one wavenumber at a time from the sorted spectra, runs the regression, calculates the MSE by cross validation, and stores all MSE values in a 2D array. Finally, the function finds the lowest MSE in the array and the corresponding wavenumbers. The algorithm creates a set of reflectance values at wavenumbers most correlated to the TSS content. This set of selected optimal wavenumbers for each spectra subset is referred to as opt_Xc, and it was used in the PLS procedure that further improved it by multiplying the reflectances at each wavenumber by their correlation coefficient to the TSS. From the aforementioned multiplication, a new dataset was formed for each spectra subset and referred to as absxcoefs. In the absxcoefs subsets, the wavenumbers most correlated to the TSS content are emphasized by giving a higher “weight” to the reflectance values they contain. MRL and PLS were applied to the entire set of the original spectra, as well as to the opt_Xc and absxcoefs subsets for comparison reasons. In total, 12 subsets were considered. All formed datasets are summarized in Table 1.
For the PLS regression, 90% of the reflectance values were used for training, while 10% was used for cross validation in 10 rounds of cross-validation of the prediction ability of the model. For the MLR regressor, a linear regression model was produced, fitting the TSS values to the reflectance values in order to predict the TSS content from a test set of TSS values; 80% of the values were used for training and 20% for model validation. Selected statistical indicators to evaluate the prediction performance of the two models are the squared Pearson correlation coefficient or coefficient of determination R2 and the RMSE between the real and predicted TSS value.

3. Results and Discussion

Table 2 shows the statistical analysis of all four original datasets. They were both also both training and testing sets for the PLS regression models, where the k-fold cross-validation method was used. For MLR, the data were split into training and testing sets. The statistical analysis of the training sets is given in Table 2.
The unprocessed spectra are shown in Figure 1a. MSC removes differences in the spectra due to different light scattering and path lengths during spectra recording. MSC uses the average spectrum as reference and builds a linear model between it and the rest of the spectra by applying linear least squares. The model coefficients are used to compute the corrected MSC spectra. The improvement on the spectra is illustrated in Figure 1b.
Middle infrared (MIR) spectra record the fundamental vibrations of covalent bonds at frequencies better absorbed by matter. Near infrared spectra are composed of overtone and combination absorptions, mainly of O-H bonds of hydroxyls and C-H bonds, at frequencies less absorbed by matter. Therefore, NIR spectra are better suited to be used with fruits although their correlation to the organics requires more vigorous analysis [28]. The –OH of water absorbs at 5848–6452 cm−1, significantly overlapping with the absorptions due to other components, such as sugars [29,30]. TSS are 90% sugars, mainly glucose and fructose. Golic et al. [31] determined that the O-H bond second overtone stretching frequencies at 984 nm (10,162.60 cm−1) are positively correlated with sugar content, whereas those at 960 nm (10,416.67 cm–1) are negatively correlated. Similarly, the O-H bond third overtone stretching frequencies at 770 nm (12,987.01 cm−1) are positively correlated with the sugar content, whereas those at 740 nm (13,513.51 cm–1) are negatively correlated. However, the last two wavenumbers were outside the range of the spectra used in this work. The third overtone band of C-H stretching at 910 nm (10,989 cm−1) was also positively correlated with sugar concentration, whereas the third overtone bands of C-H at 1012–1022 nm (9881.42–9784.74 cm−1) were negatively correlated. The positively correlated bands were proposed here to represent hydrogen-bonded groups and the negatively correlated bands to represent free groups. In conclusion, a multitude of positively and negatively correlated wavenumbers should be examined. Therefore, in this work, functions were constructed selecting wavelengths according to the absolute value of their correlation coefficient instead of selecting only the positively correlated ones. There were 110 wavenumbers selected by the variable selection function, as more correlated to the TSS concentration. Of these, twelve were close to the basic O-H vibration range of 5848–6452 cm−1, six were close to the second overtone vibrations of O-H at 10,162.6 and 10,416.67 cm−1, and eight were close to the third overtone of C-H at 10,989 and 9881.42–9784.74 cm−1, making a total of twenty-six wavenumbers. The wavenumber values are given on Tables S1–S8 in the Supplementary Materials.
MLR was first applied to the entire reflection spectra datasets (dataset 1 to 4) and then to the subsets opt_Xc and absxcoefs. Results are shown in Table 3 and Table 4. The prediction accuracy depends on the way the spectra dataset is divided into model training and testing groups. For dataset 1, the predicted TSS values resulted in an R2 score of 0.722 and RMSE of 0.965 with MLR, which are in the same range as the results reported by Daniels et al. [1]. Using the same dataset with the PLS regression model produced an R2 score for cross-validation (CV) of 0.751 and a corresponding RMSE of 0.869. It could be therefore assumed that PLS outperforms the ΜLR model for dataset 1; however, there is space for improvements for both. The selection of particular variables (reflections at selected wavenumbers) is further investigated toward improving accuracies.
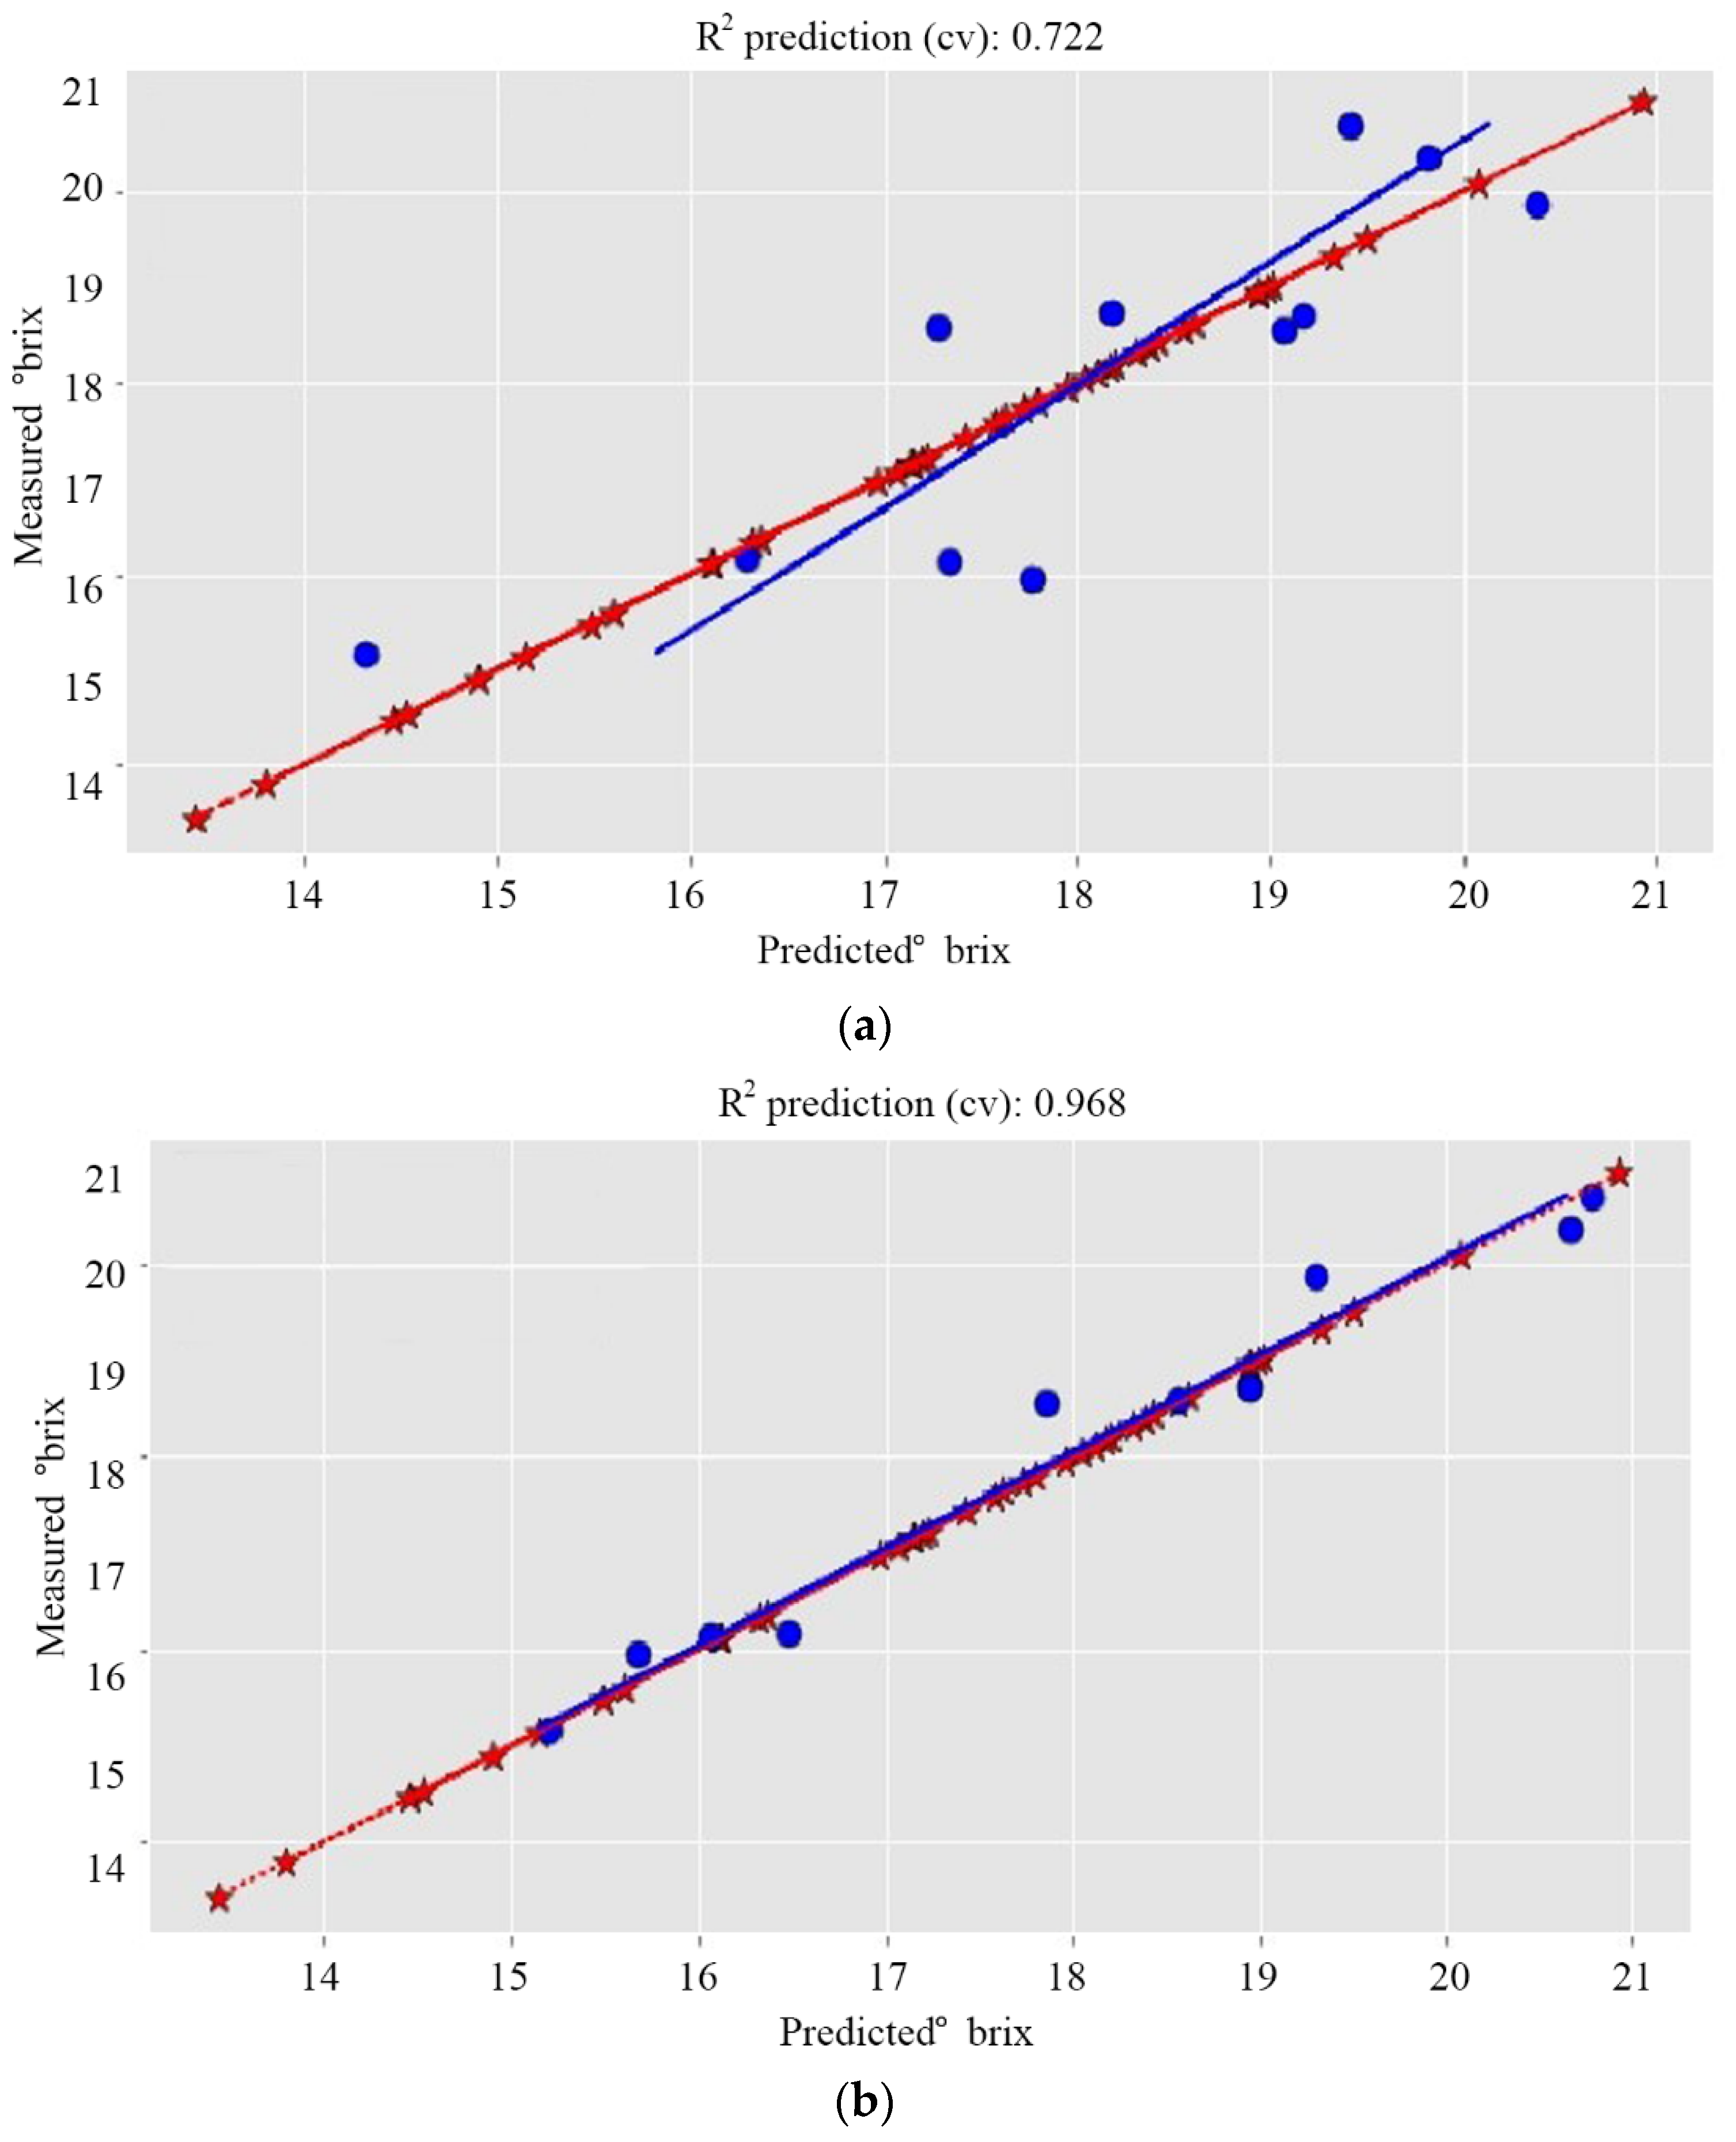
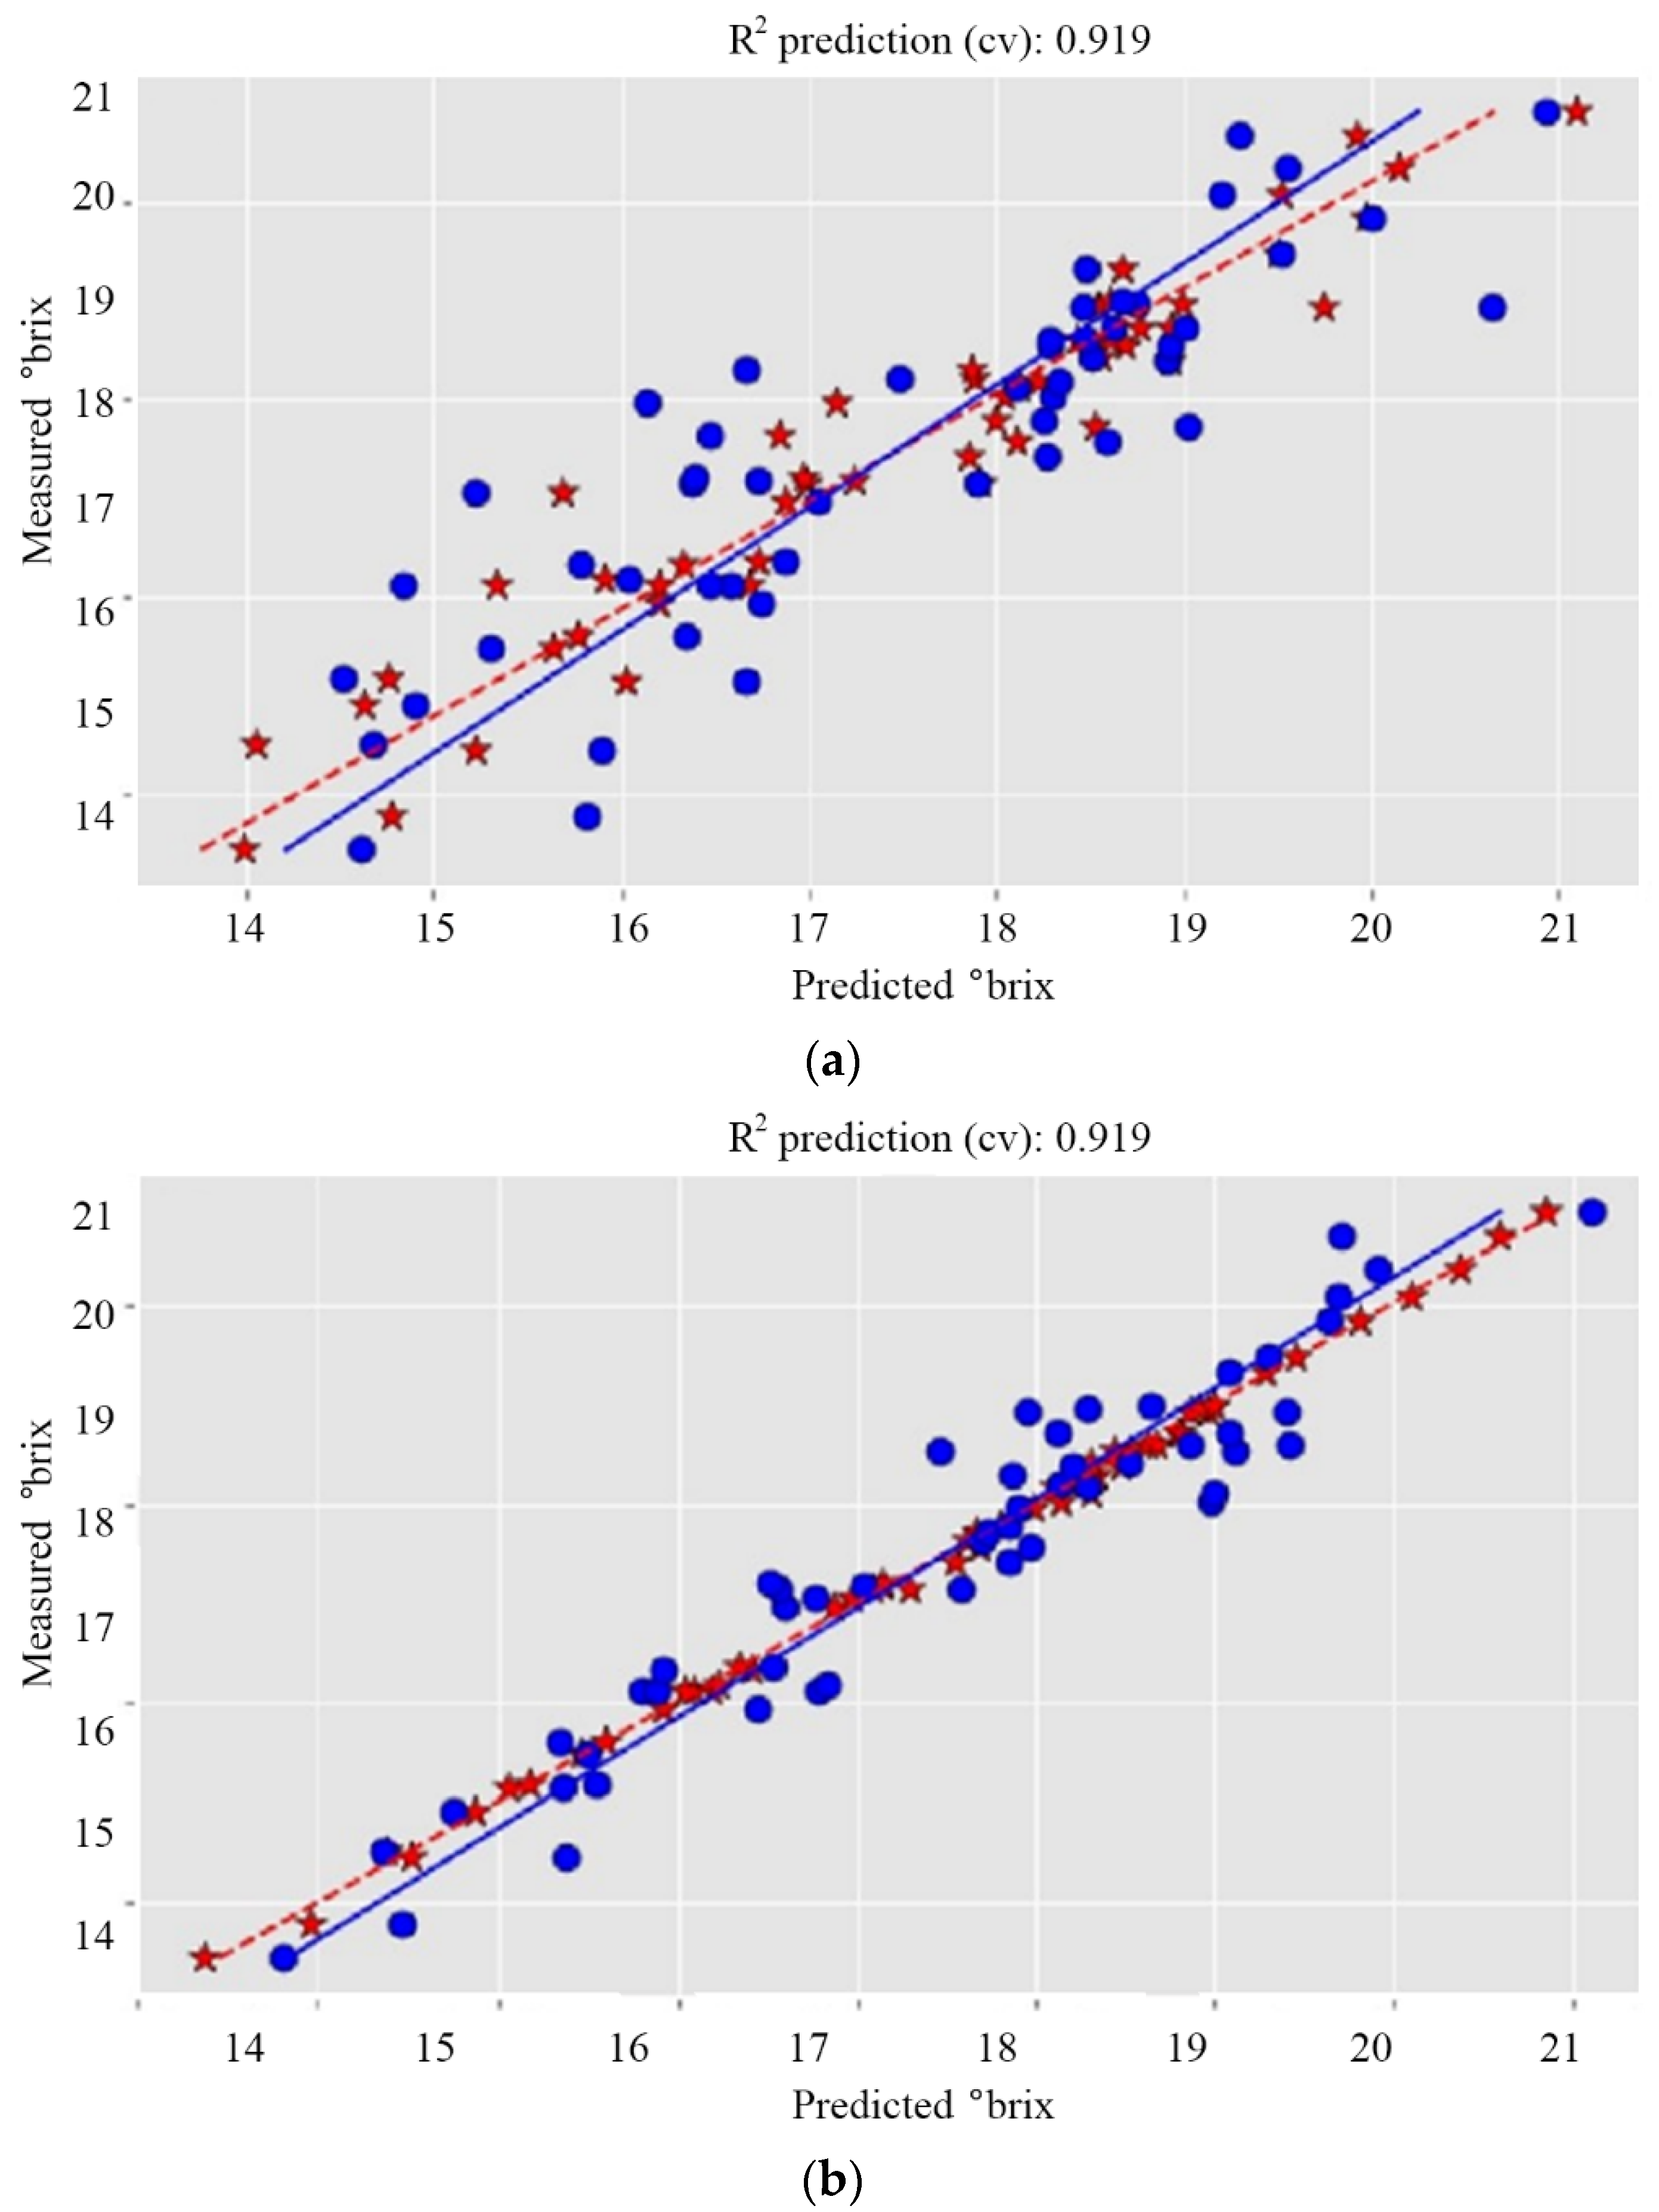
Applying selection for the wavenumbers most correlated to ΤSS content produced the dataset opt_Xc, containing reflectance values at 103 picked wavenumbers for dataset 1. Then, opt_Xc was fed into a PLS regression function operating under two different ratios of training-to-testing spectra sets. The best results regarding dataset 1 were an improved R2 score of 0.926 and RMSE 0.472. Using the absxcoefs subset, results did not improve any further. With MLR, the use of opt_Xc improved the R2 to 0.911 and the RMSE to 0.544. The best performance, among all datasets, was recorded for dataset 1 when its absxcoefs dataset created by variable selection was applied to MLR; prediction with a R2 score of 0.972 and RMSE of 0.306 was achieved. A comparison on the improvement of the prediction results obtained with the initial entire dataset 1 of spectra compared to the absxcoefs subset, with MLR, is shown in Figure 2a,b, respectively. In Figure 3, results regarding dataset 1 are illustrated with PLS with the entire dataset 1 and its subset absxcoefs.
MLR and PLS regression were also employed to dataset 2 for harvest 2 of 2016 and to more complex datasets, such as the set comprised of the spectra for both harvests of 2016 (dataset 3) and a set for both harvests of 2016 and 2017 (dataset 4). Variable selection was applied to all datasets.
As it can be observed in Table 3 and Table 4, when the variation in the sample increases (moving from dataset 1 to dataset 4), as in the case of using a mixed sample from two different harvests of the same season (dataset 3) or by using a sum of spectra from two different growing seasons (dataset 4), PLS is more reliable than ΜLR. Yet, variable selection still improves the performances in most of the cases. In general, PLS smooths the fluctuations resulting from unforeseen variations in the spectra. The same can be achieved with variable selection. A linear regression model of MLR is unfit as a prediction model for the entire dataset 2 of the second harvest spectra, producing negative R2, which is translated worse than taking the average value of TSS in the set. However, the latter was improved by employing variable selection. With MLR, the dataset for two different harvests (dataset 3) gave less accurate prediction results than the PLS, even with variable selection. In the case of a more complex dataset such as dataset 4, including spectra from two successive years, the variable selection became detrimental to the MLR procedure.
There are significant differences between the calibration and validation set errors (Tables S5–S7 in Supplementary Materials), which is an indication of overfitting. An effort was undertaken to correct it by regularizing the loss function of the MLR by use of the sklearn LassoCV regularization function. A comparison of the performance scores R2 and RMSE with and without regularization is included in Table 5. The score values for calibration and validation are closer after regularization. The prediction R2 scores, however, are lower after regularization, and the prediction RMSE are higher in most cases. Since PLS regression is a regularization process by itself, these changes were smaller in PLR regression. Furthermore, the overfitting problem is smaller for the opt_Xc and absxcoefs sets that resulted from variable selection. Regularization resulted even in improvements in the prediction scores for dataset 2 when opt_Xc or absxcoefs were used.
Related research IS reported in [32], where the authors developed a method to predict sugar content in grape berries of three grape cultivars. Prediction results in terms of R2 between 0.690 and 0.971 and root mean squared error (RMSE) between 5.36 g/L and 15.61 g/L were reported. In [33], a new self-learning artificial intelligence method was presented based on covariance models. The method was tested on six different grape cultivars in order to predict their concentrations in glucose, fructose, malic, and tartaric acids. Four state-of-the-art methods were used: PLS, local PLS, artificial neural networks (ANN), and least squares support vector machines. Pearson correlation between 0.93 and 0.99 and mean absolute standard error percentage (MASEP) between 3.70% and 7.33% were reported. NIR spectroscopy for the estimation of grape amino acid content on intact berries was investigated in [34]. PLS was used as the prediction model. Results demonstrated performances of up to 0.60 for R2 for asparagine, tyrosine, proline, and lysine in two different wavelength ranges. For TSS prediction, in both spectral ranges, the model resulted in R2 of 0.90. The use of pre-processing approaches to improve prediction accuracy of multivariate models based on NIR spectra was investigated in [23]. Results on grape datasets of transmission measurements demonstrated that the proposed pre-processing method was optimal toward an improvement of R2 by 1% with a decrease of RMSE prediction by 4%. In [1], Daniels et al. used PLS to predict key fruit attributes such as TSS, titratable acidity (TA), TSS/TA, pH, and BrimA (TSS-k × TA). For TSS, the authors achieved a prediction R2 score of 0.71 and RMSE prediction of 1.52.
As an overall conclusion, note that variable selection is able to improve the prediction score for datasets of relatively homogenous NIR spectra when MLR is used, whereas it is always beneficial with the PLS procedure with any degree of dataset variability. Only selecting the reflectance values that are most correlated to the TSS resulted in significant prediction improvement; the R2 score was increased, while the RMSE was decreased for both MLR and PLS. Compared to similar experimental results reported in the literature of applying non-destructive procedures with PLS to predict TSS in grapes from their NIR spectra, the highest reported precisions were that of Barnaba et al. [35] with 0.93 R2 and prediction error 0.73 and that of Baiano et al. [36] with R2 values of up to 0.94 and MSE 0.74. The proposed method with PLS reported similar results, namely R2 up to 0.92 and MSE of 0.22 with variable selection. However, by employing variable selection with MLR, higher prediction results were reported, namely 0.97 for R2 and 0.09 for MSE. Yet, it should be noted that the results of both methods were obtained for different datasets, which does not make their direct comparison objective.

4. Conclusions

Results indicated that variable selection improves the prediction accuracy with both MLR and PLS methods; values of R2 of up to 0.972 and 0.926 and RMSE of up to 0.306 and 0.472 were reported with MLR and PLS, respectively. Therefore, the results show that higher accuracy of prediction of TSS content can be achieved by applying PLS regression on selected wavenumbers of reflection NIR spectra. MLR, although it can perform better than PLS regression with some spectra datasets, shows no consistency of performance. The ratio of training to testing sets of spectra for constructing and validating the prediction model is most important in determining the accuracy of the prediction. The results show that about one-quarter of the selected wavenumbers are in regions close to the vibrations of sugar O-H and C-H and bonds and at a distance less than 200 cm−1, verifying the efficiency of selection to pick variable wavenumbers related to sugars. By applying regularization to MLR to avoid overfitting, the calibration and model validation errors got closer, thus resulting in a more robust prediction model. In general, the prediction accuracy depends significantly on the variability in the spectra dataset.
Predicting grape maturation by the use of non-destructive methods greatly facilitates the decision making for harvesting. Reflection of NIR light is a cheap and rapid method since NIR radiation is not well-absorbed by living tissues, and a large percentage of it is reflected back. It is already applied to predict grape maturity, and variable selection adds to its accuracy. It is also used for determining the concentration of several molecular species in other foods. The method of analysis we used, employing variable selection, can be further fine-tuned by algorithm modification to calculate the optimal training set of selected wavenumbers for highest accuracy. A future point to be addressed is the improvement of the algorithm to self-set its analytical parameters so as to produce reliable results with a variety of types of spectra datasets, without a need for the user to decide on that. Such a software package could be utilized by a variety of robotic devices.

Supplementary Materials

The following supporting information can be downloaded at: https://www.mdpi.com/article/10.3390/agronomy12092113/s1, Table S1: Statistical analysis of training sets of the MLR for the grape TSS content when the entire datasets were used. The analyses when the datasets from variable selection were used are given in the Supplementary Materials; Table S2: Performance of Partial Least Squares (PLS) models for TSS prediction from the entire dataset of spectra; Table S3: Performance of Partial Least Squares (PLS) models for TSS prediction from the dataset opt_Xc; Table S4: Performance of Partial Least Squares (PLS) models for TSS prediction from the dataset absxcoefs; Table S5: Performance of MLR models for TSS prediction from the entire dataset of spectra; Table S6: Performance of MLR models for TSS prediction from the opt_Xc dataset of spectra; Table S7: Performance of MLR models for TSS prediction from the absxcoefs dataset of spectra; Table S8: Selected wavenumbers (cm−1) most correlated to the TSS content and in agreement with published literature on the vibration wavenumbers of sugar O-H and C-H bonds.

Author Contributions

Conceptualization, C.C. and V.G.K.; methodology, C.C.; software, C.C.; validation, C.C. and V.G.K.; investigation, C.C. and E.V.; resources, C.C. and E.V.; data curation and chemical explanations, A.J.D.; writing—original draft preparation, C.C.; writing—review and editing, E.V.; visualization, C.C. and V.G.K.; supervision, V.G.K.; project administration, V.G.K.; funding acquisition, V.G.K. All authors have read and agreed to the published version of the manuscript.

Funding

This research has been co-financed by the European Regional Development Fund of the European Union and Greek national funds through the Operational Program Competitiveness, Entrepreneurship and Innovation, under the call RESEARCH—CREATE—INNOVATE (project code: T1EDK-00300).

Institutional Review Board Statement

Not applicable.

Informed Consent Statement

Not applicable.

Data Availability Statement

Data supporting reported results were collected by Daniels et al. [1] and were provided to the authors upon request.

Acknowledgments

This work was supported by the MPhil program “Advanced Technologies in Informatics and Computers”, hosted by the Department of Computer Science, International Hellenic University, Greece.

Conflicts of Interest

The authors declare no conflict of interest. The funders had no role in the design of the study; in the collection, analyses, or interpretation of data; in the writing of the manuscript, or in the decision to publish the results.

References

  1. Daniels, A.J.; Poblete-Echeverría, C.; Opara, U.L.; Nieuwoudt, H.H. Measuring Internal Maturity Parameters Contactless on Intact Table Grape Bunches Using NIR Spectroscopy. Front. Plant Sci. 2019, 10, 1517. [Google Scholar] [CrossRef]
  2. Vrochidou, E.; Tziridis, K.; Nikolaou, A.; Kalampokas, T.; Papakostas, G.A.; Pachidis, T.P.; Mamalis, S.; Koundouras, S.; Kaburlasos, V.G. An Autonomous Grape-Harvester Robot: Integrated System Architecture. Electronics 2021, 10, 1056. [Google Scholar] [CrossRef]
  3. Power, A.; Truong, V.K.; Chapman, J.; Cozzolino, D. From the Laboratory to The Vineyard—Evolution of The Measurement of Grape Composition using NIR Spectroscopy towards High-Throughput Analysis. High-Throughput 2019, 8, 21. [Google Scholar] [CrossRef]
  4. Das, A.J.; Wahi, A.; Kothari, I.; Raskar, R. Ultra-portable, wireless smartphone spectrometer for rapid, non-destructive testing of fruit ripeness. Sci. Rep. 2016, 6, 32504. [Google Scholar] [CrossRef] [PubMed]
  5. Shah, S.S.; Zeb, A.; Qureshi, W.S.; Arslan, M.; Malik, A.U.; Alasmary, W.; Alanazi, E. Towards fruit maturity estimation using NIR spectroscopy. Infrared Phys. Technol. 2020, 111, 103479. [Google Scholar] [CrossRef]
  6. Hernández-Hierro, J.M.; Nogales-Bueno, J.; Rodríguez-Pulido, F.J.; Heredia, F.J. Feasibility Study on the Use of Near-Infrared Hyperspectral Imaging for the Screening of Anthocyanins in Intact Grapes during Ripening. J. Agric. Food Chem. 2013, 61, 9804–9809. [Google Scholar] [CrossRef] [PubMed]
  7. Chandrasekaran, I.; Panigrahi, S.S.; Ravikanth, L.; Singh, C.B. Potential of Near-Infrared (NIR) Spectroscopy and Hyperspectral Imaging for Quality and Safety Assessment of Fruits: An Overview. Food Anal. Methods 2019, 12, 2438–2458. [Google Scholar] [CrossRef]
  8. Lu, R.; van Beers, R.; Saeys, W.; Li, C.; Cen, H. Measurement of optical properties of fruits and vegetables: A review. Postharvest Biol. Technol. 2020, 159, 111003. [Google Scholar] [CrossRef]
  9. Zhang, J.; Nie, J.Y.; Jing, L.I.; Zhang, H.; Ye, L.I.; Farooq, S.; Bacha, S.A.; Jie, W.A. Evaluation of sugar and organic acid composition and their levels in highbush blueberries from two regions of China. J. Integr. Agric. 2020, 19, 2352–2361. [Google Scholar] [CrossRef]
  10. Chen, Q.; Ding, J.; Cai, J.; Zhao, J. Rapid measurement of total acid content (TAC) in vinegar using near infrared spectroscopy based on efficient variables selection algorithm and nonlinear regression tools. Food Chem. 2012, 135, 590–595. [Google Scholar] [CrossRef]
  11. Costa, R.C.; Uchida, V.H.; Miguel, T.B.V.; Duarte, M.M.L.; Lima, K.M.G. Quantification of quality parameters in castanhola fruits by NIRS for the development of prediction models using PLS and variable selection algorithms on a laboratory scale. Anal. Methods 2017, 9, 352–357. [Google Scholar] [CrossRef]
  12. Friedel, M.; Patz, C.-D.; Dietrich, H. Comparison of different measurement techniques and variable selection methods for FT-MIR in wine analysis. Food Chem. 2013, 141, 4200–4207. [Google Scholar] [CrossRef] [PubMed]
  13. Foca, G.; Ferrari, C.; Ulrici, A.; Ielo, M.C.; Minelli, G.; Fiego, D.P.L. Iodine Value and Fatty Acids Determination on Pig Fat Samples by FT-NIR Spectroscopy: Benefits of Variable Selection in the Perspective of Industrial Applications. Food Anal. Methods 2016, 9, 2791–2806. [Google Scholar] [CrossRef]
  14. Liu, F.; He, Y. Application of successive projections algorithm for variable selection to determine organic acids of plum vinegar. Food Chem. 2009, 115, 1430–1436. [Google Scholar] [CrossRef]
  15. Sun, X.; Dong, X. Improved partial least squares regression for rapid determination of reducing sugar of potato flours by near infrared spectroscopy and variable selection method. J. Food Meas. Charact. 2015, 9, 95–103. [Google Scholar] [CrossRef]
  16. Wu, D.; Chen, X.; Cao, F.; Sun, D.-W.; He, Y.; Jiang, Y. Comparison of Infrared Spectroscopy and Nuclear Magnetic Resonance Techniques in Tandem with Multivariable Selection for Rapid Determination of ω-3 Polyunsaturated Fatty Acids in Fish Oil. Food Bioprocess Technol. 2014, 7, 1555–1569. [Google Scholar] [CrossRef]
  17. Arendse, E.; Fawole, O.A.; Magwaza, L.S.; Opara, U.L. Non-destructive prediction of internal and external quality attributes of fruit with thick rind: A review. J. Food Eng. 2018, 217, 11–23. [Google Scholar] [CrossRef]
  18. Cozzolino, D. Infrared Spectroscopy as a Versatile Analytical Tool for the Quantitative Determination of Antioxidants in Agricultural Products, Foods and Plants. Antioxidants 2015, 4, 482–497. [Google Scholar] [CrossRef]
  19. Cubero, S.; Aleixos, N.; Moltó, E.; Gómez-Sanchis, J.; Blasco, J. Advances in Machine Vision Applications for Automatic Inspection and Quality Evaluation of Fruits and Vegetables. Food Bioprocess Technol. 2011, 4, 487–504. [Google Scholar] [CrossRef]
  20. Ignat, I.; Volf, I.; Popa, V.I. A critical review of methods for characterisation of polyphenolic compounds in fruits and vegetables. Food Chem. 2011, 126, 1821–1835. [Google Scholar] [CrossRef]
  21. Nicolai, B.M.; Beullens, K.; Bobelyn, E.; Peirs, A.; Saeys, W.; Theron, K.I.; Lammertyn, J. Nondestructive measurement of fruit and vegetable quality by means of NIR spectroscopy: A review. Postharvest Biol. Technol. 2007, 46, 99–118. [Google Scholar] [CrossRef]
  22. Vrochidou, E.; Bazinas, C.; Manios, M.; Papakostas, G.A.; Pachidis, T.P.; Kaburlasos, V.G. Machine Vision for Ripeness Estimation in Viticulture Automation. Horticulturae 2021, 7, 282. [Google Scholar] [CrossRef]
  23. Mishra, P.; Roger, J.M.; Rutledge, D.N.; Woltering, E. SPORT pre-processing can improve near-infrared quality prediction models for fresh fruits and agro-materials. Postharvest Biol. Technol. 2020, 168, 111271. [Google Scholar] [CrossRef]
  24. Cao, D.-S.; Xu, Q.-S.; Liang, Y.-Z.; Chen, X.; Li, H.-D. Prediction of aqueous solubility of druglike organic compounds using partial least squares, back-propagation network and support vector machine. J. Chemom. 2010, 24, 584–595. [Google Scholar] [CrossRef]
  25. Shezi, S.; Magwaza, L.S.; Tesfay, S.Z.; Mditshwa, A. Simple and Multiple Linear Regression Models for Predicting Maturity of ‘Mendez#1′ and ‘Hass’ Avocado Fruit Harvested from inside and outside Tree Canopy Positions. Int. J. Fruit Sci. 2020, 20, S1969–S1983. [Google Scholar] [CrossRef]
  26. Ayaz, F.A.; Kadioglu, A.; Bertoft, E.; Acar, C.; Turna, I. Effect of fruit maturation on sugar and organic acid composition in two blueberries (Vaccinium arctostaphylos and V. myrtillus) native to Turkey. N. Z. J. Crop Hortic. Sci. 2001, 29, 137–141. [Google Scholar] [CrossRef]
  27. Zhao, F.; Du, G.; Huang, Y. Exploring the use of Near-infrared spectroscopy as a tool to predict quality attributes in prickly pear (Rosa roxburghii Tratt) with chemometrics variable strategy. J. Food Compos. Anal. 2022, 105, 104225. [Google Scholar] [CrossRef]
  28. Williams, P.; Norris, K. Near-Infrared Technology in the Agricultural and Food Industries; American Association of ceral chemist: St. Paul, MN, USA, 2001. [Google Scholar]
  29. Nieuwoudt, H.H.; Prior, B.A.; Pretorius, I.S.; Manley, M.; Bauer, F.F. Principal Component Analysis Applied to Fourier Transform Infrared Spectroscopy for the Design of Calibration Sets for Glycerol Prediction Models in Wine and for the Detection and Classification of Outlier Samples. J. Agric. Food Chem. 2004, 52, 3726–3735. [Google Scholar] [CrossRef]
  30. Walsh, K.B.; Blasco, J.; Zude-Sasse, M.; Sun, X. Visible-NIR ‘point’ spectroscopy in postharvest fruit and vegetable assessment: The science behind three decades of commercial use. Postharvest Biol. Technol. 2020, 168, 111246. [Google Scholar] [CrossRef]
  31. Golic, M.; Walsh, K.; Lawson, P. Short-Wavelength Near-Infrared Spectra of Sucrose, Glucose, and Fructose with Respect to Sugar Concentration and Temperature. Appl. Spectrosc. 2003, 57, 139–145. [Google Scholar] [CrossRef]
  32. Courand, A.; Metz, M.; Héran, D.; Feilhes, C.; Prezman, F.; Serrano, E.; Bendoula, R.; Ryckewaert, M. Evaluation of a robust regression method (RoBoost-PLSR) to predict biochemical variables for agronomic applications: Case study of grape berry maturity monitoring. Chemom. Intell. Lab. Syst. 2022, 221, 104485. [Google Scholar] [CrossRef]
  33. Martins, R.C.; Barroso, T.G.; Jorge, P.; Cunha, M.; Santos, F. Unscrambling spectral interference and matrix effects in Vitis vinifera Vis-NIR spectroscopy: Towards analytical grade ‘in vivo’ sugars and acids quantification. Comput. Electron. Agric. 2022, 194, 106710. [Google Scholar] [CrossRef]
  34. Fernández-Novales, J.; Garde-Cerdán, T.; Tardáguila, J.; Gutiérrez-Gamboa, G.; Pérez-Álvarez, E.P.; Diago, M.P. Assessment of amino acids and total soluble solids in intact grape berries using contactless Vis and NIR spectroscopy during ripening. Talanta 2019, 199, 244–253. [Google Scholar] [CrossRef]
  35. Barnaba, F.E.; Bellincontro, A.; Mencarelli, F. Portable NIR-AOTF spectroscopy combined with winery FTIR spectroscopy for an easy, rapid, in-field monitoring of Sangiovese grape quality. J. Sci. Food Agric. 2014, 94, 1071–1077. [Google Scholar] [CrossRef]
  36. Baiano, A.; Terracone, C.; Peri, G.; Romaniello, R. Application of hyperspectral imaging for prediction of physico-chemical and sensory characteristics of table grapes. Comput. Electron. Agric. 2012, 87, 142–151. [Google Scholar] [CrossRef]
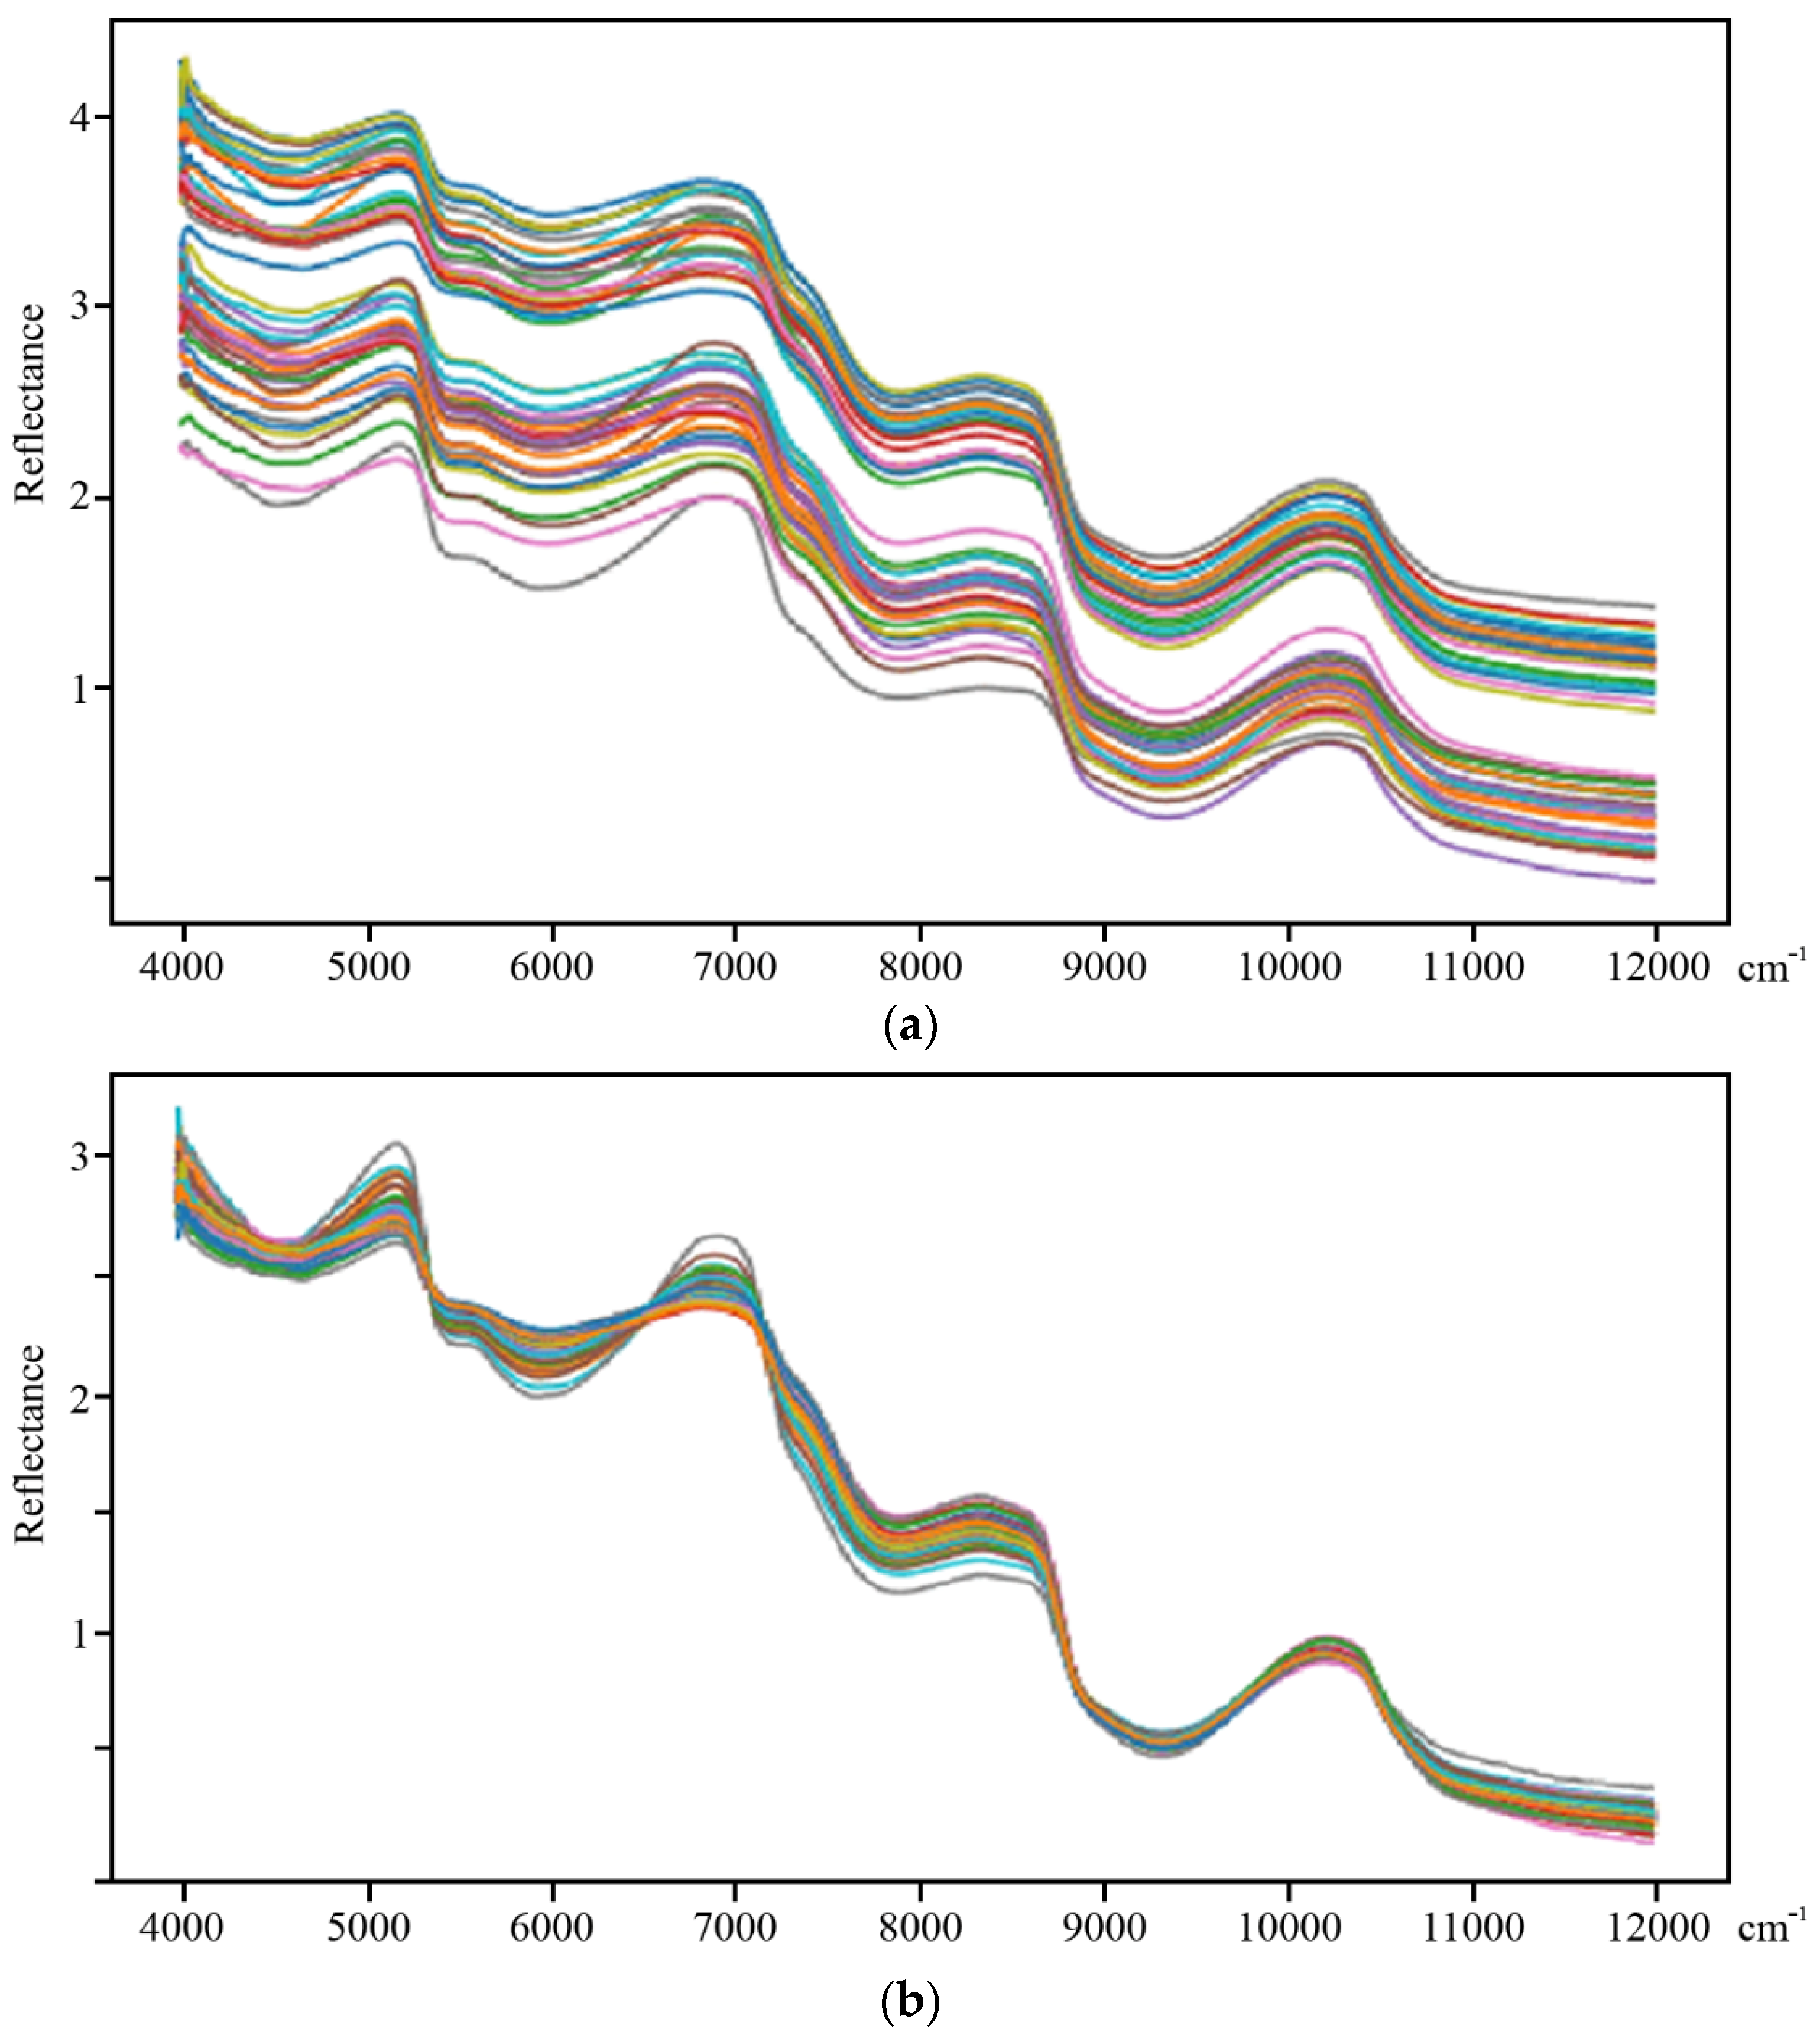
Figure 1. (a) Unprocessed and (b) MSC-corrected reflection FT-NIR spectra of intact grape berries.
Agronomy 12 02113 g001
Figure 2. MLR results. (a) Plots of calculated and predicted TSS, derived from the entire dataset 1 (harvest 1) of reflection FT-NIR spectra, against the chemometrically measured (actual) values. The line fitting the asterisk scatter plot represents a plot of the calculated by the regression model against the actual TSS values. The line fitting the scatter plot of the circles represents a plot of the predicted by the regression model against the actual values. (b) Same plot using the selected wavenumber dataset (absxcoefs) of the same harvest 1. The two lines, that of prediction and that of calculation from the model, almost coincide against the actual sugars.
Agronomy 12 02113 g002
Figure 3. PLS regression results. (a) Plots of calculated and predicted TSS, derived from the entire dataset 1 (harvest 1) of reflection FT-NIR spectra, against the chemometrically measured (actual) values. The line fitting the asterisk scatter plot represents a plot of the calculated by the regression model against the actual TSS values. The line fitting the scatter plot of the circles represents a plot of the predicted by the model against the actual values. The R2 of prediction is 0.750. (b) Same plot using the selected wavenumber dataset (absxcoefs) of the same harvest 1. The two lines, that of prediction and that of calculation from the model, almost coincide against the actual sugars.
Agronomy 12 02113 g003
Table 1. Formulation of the datasets.
Dataset 1
Harvest 1-2016
Dataset 2
Harvest 2-2016
Dataset 3
2016
Dataset 4
2016 and 2017
52 spectra
1037 wavenumbers
41 spectra
1037 wavenumbers
93 spectra
1037 wavenumbers
165 spectra
1037 wavenumbers
opt_Xc and absxcoefsopt_Xc and absxcoefsopt_Xc and absxcoefsopt_Xc and absxcoefs
52 spectra
103 wavenumbers
41 spectra
181 wavenumbers
93 spectra
334 wavenumbers
165 spectra
134 wavenumbers
Table 2. Statistical analysis of sample sets for the grape TSS content.
ParameterDataset 1
Harvest 1
2016
Dataset 2
Harvest 2
2016
Dataset 3
both Harvests
2016
Dataset 4
both Harvests
2016 and 2017
N524193165
Mean17.5118.6918.0317.54
Median17.7618.8618.1717.66
Min13.4414.0713.4410.18
Max20.9322.4222.4222.42
Range7.498.358.8912.24
Standard deviation1.741.891.902.20
Coefficient of variation0.100.100.100.12
Table 3. Prediction scores for the TSS content of intact berries of Thompson seedless grapes, using a 90% of the spectra for PLS regression model training.
DatasetMLRPLS
Entire Datasetopt_XcabsxcoefsEntire Datasetopt_Xcabsxcoefs
R2RMSER2RMSER2RMSER2RMSER2RMSER2RMSE
Dataset 10.7220.9650.8800.8660.9720.3060.7510.8690.9260.4720.9260.472
Dataset 2−3.315102.470.7890.5860.9690.2750.3441.5360.8930.6210.8930.621
Dataset 30.7291.0800.7700.8810.6961.1430.7771.0270.8920.7150.8910.626
Dataset 40.7471.146−4.660.859−6.296.1490.7381.1300.8870.7410.8870.741
Table 4. Prediction scores for the TSS content of intact berries of Thompson seedless grapes, using 75% of the spectra for PLS regression model training.
DatasetMLRPLS
Entire Datasetopt_XcabsxcoefsEntire Datasetopt_Xcabsxcoefs
R2RMSER2RMSER2RMSER2RMSER2RMSER2RMSE
Dataset 10.7220.9650.9110.5440.9680.3240.7510.8690.9190.4950.9190.495
Dataset 2−3.315102.470.5031.0990.5691.0230.1891.7100.8710.6830.8710.683
Dataset 30.5431.0920.5701.1580.6870.9880.7400.9720.8990.6050.8990.605
Dataset 40.7471.070−5.6935.893−5.6935.8930.7271.1540.8840.7510.8840.751
Table 5. Comparison of the performance of MLR models for TSS prediction with and without regularization of the spectra by the LassoCV function.
Dataset 1
Harvest 1
2016
Dataset 2
Harvest 2
2016
Dataset 3
both Harvests
2016
Dataset 4
both Harvests
2016 and 2017
wrrwrrwrrwrr
Entire datasetcR21.0000.9421.0000.5921.0000.9581.0000.724
RMSE0.0000.4030.0001.1180.0001.1660.0001.067
pR20.7220.737−3.3140.2400.5430.1540.7460.705
RMSE0.9690.939102.461.1661.0920.6201.0701.111
opt_XccR21.0000.9831.0000.3631.0000.9800.9990.418
RMSE0.0000.2120.0001.2560.0000.5130.0311.655
pR20.9110.9270.5030.4350.5700.759−5.6930.418
RMSE0.5440.9641.0991.1721.1580.8675.8931.737
absxcoefscR21.0000.9911.0000.2521.0000.9740.9990.563
RMSE0.0000.3240.0001.3070.0000.8610.0311.434
pR20.9680.9690.5690.4930.6870.762−5.6930.560
RMSE0.3240.3201.0231.1680.9880.9285.8931.511
c, calculated values; p, predicted value; r, regularization using LassoCV; wr, without regularization.
Publisher’s Note: MDPI stays neutral with regard to jurisdictional claims in published maps and institutional affiliations.