Article

Using Visible and Thermal Images by an Unmanned Aerial Vehicle to Monitor the Plant Water Status, Canopy Growth and Yield of Olive Trees (cvs. Frantoio and Leccino) under Different Irrigation Regimes

Department of Agriculture, Food and Environment, University of Pisa, Via del Borghetto, 80, 56124 Pisa, Italy
*
Author to whom correspondence should be addressed.
Agronomy 2022, 12(8), 1904; https://doi.org/10.3390/agronomy12081904
Submission received: 28 July 2022 / Revised: 10 August 2022 / Accepted: 12 August 2022 / Published: 14 August 2022

Abstract

:
An efficient management of water relies on the correct estimation of tree water requirements and the accurate monitoring of tree water status and canopy growth. This study aims to test the suitability of visible and thermal images acquired by an unmanned aerial vehicle (UAV) for monitoring tree water status and canopy growth in an irrigation experiment. We used mature olive trees of two cultivars subjected to full irrigation, deficit irrigation (41–44% of full irrigation), or rainfed conditions. Deficit irrigation had limited or no effect on fruit and oil yield. There was a significant relationship between the remotely sensed crop water stress index derived from thermal images and the stem water potential (R2 = 0.83). The RGB images by UAV allowed to estimate tree canopy volume and were able to detect differences in canopy growth across irrigation regimes. A significant relationship between canopy volume and LAI was found for both cultivars (R2 of 0.84 and 0.88 for Frantoio and Leccino, respectively). Our results confirm the positive effects of deficit irrigation strategies to save relevant volumes of water and show that aerial images from UAV can be used to monitor both tree water stress and its effects on canopy growth and yield.

1. Introduction

There is an increasing interest in irrigation management under water-scarcity scenarios to improve water productivity and optimize the yield and product quality of orchards and vineyards [1]. Irrigation plays a key role in modern, high-density orchards due to its multiple effects on yield and oil quality [2,3,4]. The positive effects of restricting irrigation on tree growth, yield parameters and oil quality have been extensively investigated over a wide range of olive cultivars and planting systems [3,4,5,6,7,8].
Yield reductions induced by deficit irrigation (DI) are usually limited and thus compatible with commercial goals thanks to the high drought tolerance of Olea europaea L. Deficit irrigation allows substantial water savings compared with full irrigation [2,4,9]. In addition to saving water, DI strategies are useful to control vegetative growth in very high-density olive orchards, where excessive tree vigor and canopy size can be a major problem [2,10,11]. Large canopies may lead to the mutual shading of adjacent trees and less light interception, which, in turn, can lead to decreases in yield components and modifications in oil quality [6,12,13,14].
Efficient applications of DI strategies rely on the accurate calculation of tree water needs and monitoring of tree water status and canopy growth. Crop water requirements are usually determined using the FAO 56 method [15], whereby the actual crop evapotranspiration (ETc) is calculated as the product of a crop coefficient (Kc) by the grass reference evapotranspiration (ET0). The concomitant assessment of tree water status and growth is essential to adjust irrigation volumes and to finely regulate the desired level of water stress. Tree water status is usually monitored using the Scholander pressure chamber by measuring either pre-dawn leaf water potential, midday leaf water potential, or stem water potential (SWP). A recent survey of trials in different olive growing areas established the SWP non-stressed baseline [16]. In particular, SWP between −2 and −3 MPa corresponded to mild water stress from fruit set through pit hardening, between −3 and −4 MPa during pit hardening, and between −2 and −3 MPa during the period of rapid oil accumulation [16]. Measuring water status by the pressure chamber is time consuming and its use has been mainly limited to experimental use rather than commercial practice. Measuring tree growth is also time consuming if assessed manually by periodical determinations of canopy volume or trunk cross sectional area (TCSA) during the growing season. The most widely adopted method calculates canopy volume from measurements of canopy diameters and height assuming an ellipsoidal shape of the olive tree [17,18]. However, manual measurements often lead also to an approximation of the real canopy volume due to the irregular shape of the crown. Aerial measurements of canopy temperature and canopy volume can be a valid alternative to estimate growth and water status.
Aerial images can be acquired from unmanned aerial vehicles (UAVs), airborne or satellites. Among these platforms UAVs allow to acquire images at the most appropriate time of the day and to discriminate between tree canopies and the ground due to the flexibility in flight scheduling and the high resolution of images, respectively. Thermal infrared images from UAV are becoming common tools for water stress detection in orchards and vineyards [19,20,21,22] as canopy temperature is related to transpiration rate because stomata close under water stress conditions with a consequent rise of leaf and canopy temperature. However, variations in canopy temperature are also due to meteorological and morphological factors [23]. The crop water stress index (CWSI) allows to overcome most problems related to environmental variability [24,25] and can be determined by different methods [23], including empirical ones that are becoming popular among scientists and professionals due to the fewer data required than analytical and direct methodologies [23,26,27].
Previous studies showed that high-resolution images from aerial monitoring could be used to infer geometrical canopy characteristics, such as tree height, canopy diameters, and canopy volume [28,29,30,31]. UAV imagery proved useful either in phenotyping experiments [32,33,34,35] or to evaluate the impact of cultural practices such as irrigation or pruning on canopy size [29,36]. An experiment carried out on mature olive trees in Spain reported a coefficient of determination between estimated and measured canopy volumes of 0.65 using images taken at an altitude of 50 m [37]. In a later study, Caruso et al. [29] measured a correlation coefficient of 0.85 on cultivar Frantoio.
The objective of the current work is to test the suitability of visible and thermal images acquired by a UAV as an alternative method to determine SWP, canopy growth, and leaf area index (LAI) to be used for the irrigation scheduling of olive trees. In particular, we tested for the first time in olives the method for the CWSI proposed by Bian et al. [27]. Specific relationships between the integrated CWSI, canopy growth, and yield were also assessed. For this reason, we used two widely grown olive cultivars (Frantoio and Leccino) subjected to different irrigation regimes over two consecutive years in a high density, fully productive orchard.

2. Materials and Methods

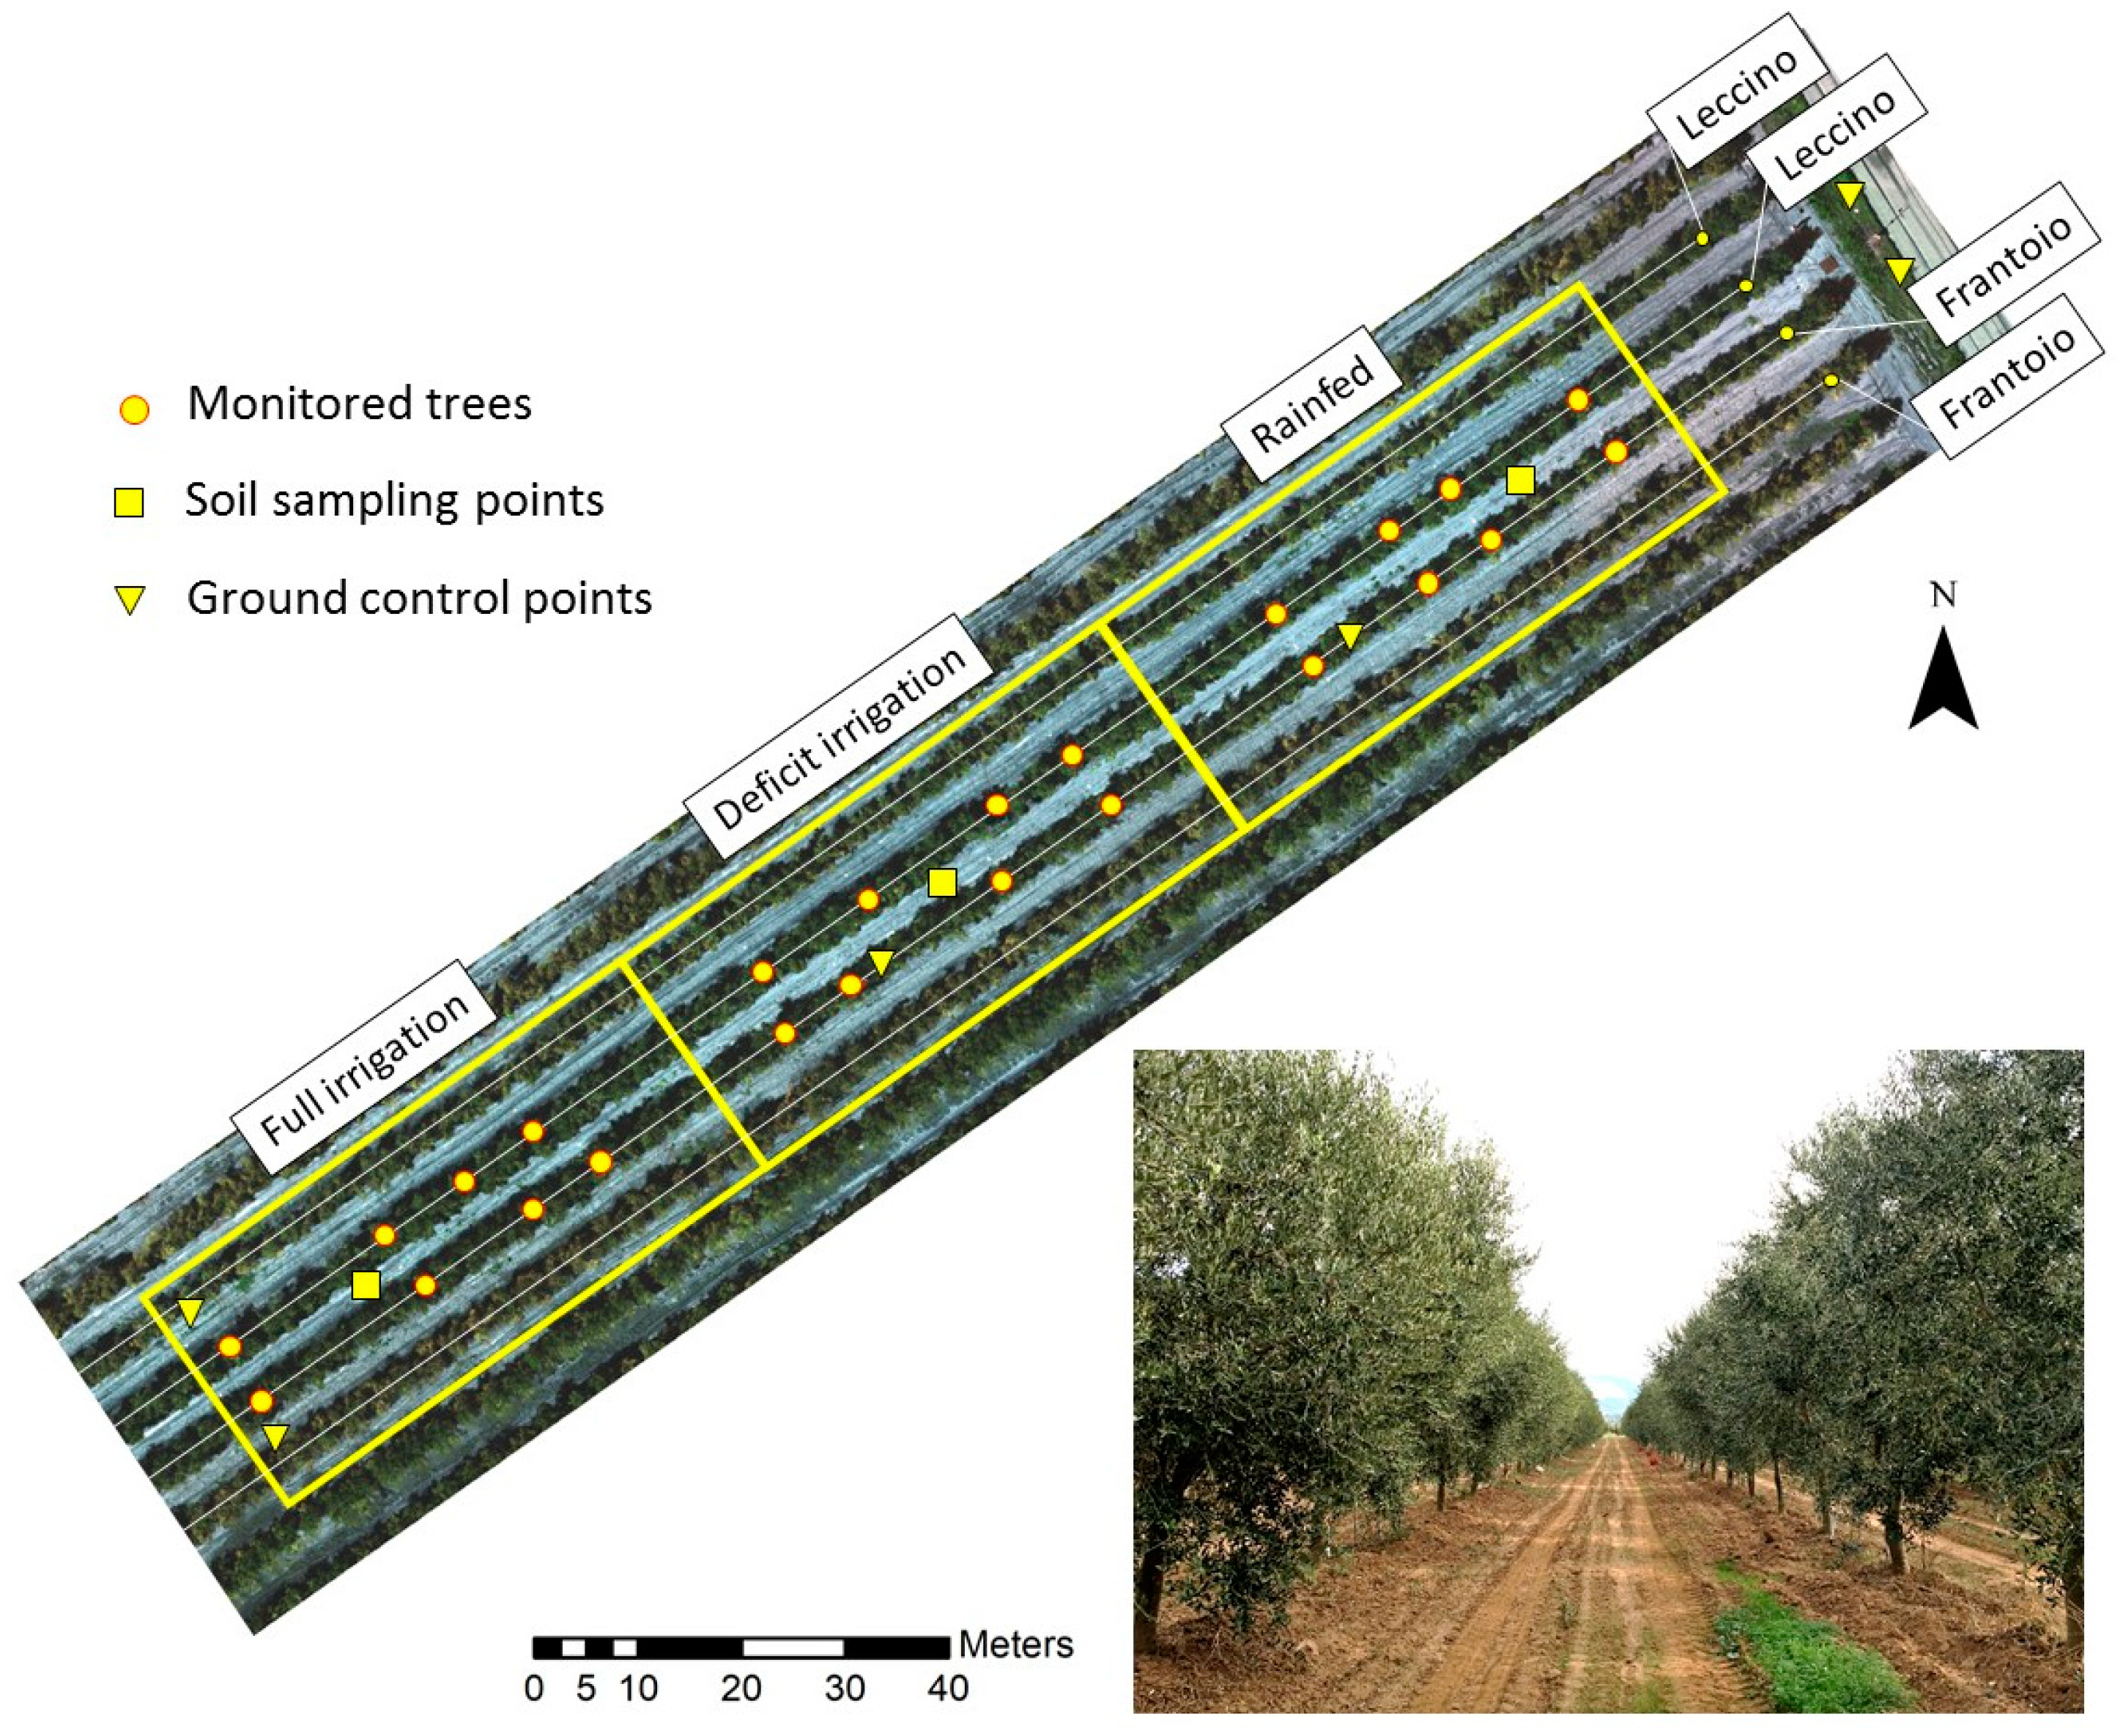
2.1. Plant Material and Site

The experiment was conducted in a commercial, irrigated olive orchard located at S. Vincenzo, in western Tuscany about 10 km from the coastline (43.0551° N, 10.5490° E, 9 m a.s.l.) in 2019 and 2020 (Figure 1). Trees of cultivars Frantoio and Leccino were planted at a spacing of 6 × 3 m (556 trees ha−1) in 2012. The trees had a single-trunk and were trained to form a hedgerow, suitable for mechanical harvest by a side-by-side machine (Athena, Andreoli Engineering, Maranello, Italy). The maximum canopy height was kept to about 4 m by topping. The area where the irrigation experiment was carried out was 0.8 ha within an orchard of approximately 7.5 ha.
Soil characteristics were determined in 2019 by sampling at two depths (0–0.3 and 0.3–0.6 m) (Table S1). The soil was a deep (1.5 m), sandy-loam consisting of 70% sand, 17% clay, and 13% silt (average of 0–0.3 m and 0.3–0.6 m soil depths). The pH was 8.5, average organic matter 0.91%, and ion exchange capacity 10.8 meq/100 g. The soil was tilled at a depth of 0.15 m 3–4 times a year to keep it free from weeds.
The climatic conditions over the two experimental years were monitored using a weather station (Meteosens, Netsens srl, Florence, Italy) installed on site (Supplemental Figure S1). Annual precipitation and potential evapotranspiration (ET0) were 1172 and 996 mm in 2019, respectively, and 842 and 987 mm in 2020. During the irrigation period, the effective rainfall, calculated as the 75% of the daily rainfall, and ET0 were 96 and 358 mm, in 2019, and 28 and 421 mm in 2020. The average mean air temperature over the same period was 24.3 and 24.2 °C in 2019 and 2020, respectively.

2.2. Irrigation, Tree Water Status, and Vegetative Growth

All trees had been similarly irrigated in the year before the experiment started; then, during the 2019 growing season, they were subjected to either full irrigation (FI), deficit irrigation (DI) or rainfed (RF) conditions (Figure 1). Irrigation lasted from day of the year (DOY) 178 (28 June) to DOY 264 (21 September) in 2019 and from DOY 175 (24 June) to DOY 263 (20 September) in 2020. In 2019, irrigation was suspended for three and four weeks in July (FI and DI trees, respectively), due to the abundant precipitations that occurred in that month. Similarly, because of rainfall at the beginning of September 2020, trees were not irrigated for one (FI) and three weeks (DI), respectively. Water was supplied using subsurface drip lines (1.6 L h−1 pressure-compensated drippers spaced at 0.5 m) placed at a depth of about 0.40 m and 1 m distance from the tree row. To determine the amount of water to be supplied to the fully irrigated trees, ET0 was estimated using the Penman–Monteith equation, and then effective evapotranspiration (ETc) calculated according to the methodology proposed by Allen et al. [15], using a crop coefficient of 0.55, 0.60, and 0.60 in July, August, and September, respectively. Since the canopies shaded more than 50% of the soil surface at the beginning of the growing season, we did not use a coefficient of ground cover to adjust ETc [38]. Fully irrigated trees received water 5–6 days a week for a total of 1560 and 2180 m3 ha−1 in 2019 and 2020, respectively. Trees subjected to deficit irrigation received about 41–44% of the volume distributed to fully irrigated trees in 2019 (647 m3 ha−1) and 2020 (959 m3 ha−1), whereas RF trees were not irrigated.
The SWP was determined on three trees per cultivar-irrigation combination by using a custom-built Scholander-type pressure chamber (Tecnogas, Pisa, Italy). The SWP was measured on one fully expanded leaf per plant inserted near the main scaffolds of the tree and covered with aluminum foil for at least 1 h before measurements to block leaf transpiration.
Vegetative growth was assessed as TCSA, LAI, and canopy volume. The TCSA was calculated from the circumference of the trunk measured at 0.40 m from the ground on DOY 8 and 326 in 2019 and DOY 337 in 2020. The LAI was measured non-destructively on DOY 232 in 2019 and DOY 158, 212, 253 in 2020 using a canopy analysis system (SunScan SS1-R3-BF3; Delta-T Devices, Cambridge, UK) based on photosynthetically active radiation (PAR) measurements beneath the canopy using a line quantum sensor array. A schematic representation of the procedure used for LAI measurements is reported in Supplemental Figure S2. Canopy size measurements by imaging are described in Section 2.4 and Section 2.5.

2.3. Fruit and Oil Yields

Harvest occurred on DOY 287 in both years (13 October 2019 and 14 October 2020). Four trees per cultivar-irrigation combination (total of 24 trees) were harvested individually by hand and final crop yield was expressed on the basis of TCSA to account for differences in tree size and vegetative growth at the end of the growing season. Immediately before harvest, 100 fruits were randomly sampled from around the canopy of each tree to determine the maturation index according to the standard methodology [39]. The oil content of the fruit mesocarp of 20 fruits per tree was measured at harvest by nuclear magnetic resonance Oxford MQC-23 analyzer (Oxford Analytical Instruments Ltd., Oxford, UK). The oil yield of individual trees was calculated as previously reported [9,40].

2.4. Visible and Thermal Imagery Acquisition

The acquisition campaign was performed using an S1000 UAV octocopter (DJI, Shenzhen, China) able to fly autonomously over a predetermined waypoint course. The UAV was equipped with a 2-axis stabilized gimbal equipped with a FLIR Duo Pro R system (Teledyne FLIR LLC, Wilsonville, OR, USA), including a visible camera and a thermal longwave infrared sensor. The visible sensor had a 4000 × 3000 pixel array with a 4 mm f/2.8 fixed focus lens. The field of view of the visible sensor was 56° × 45° (horizontal x vertical). The thermal sensor had a spectral range of 7.5–13.5 μm with a resolution of 640 × 512 pixels, a focal length of 13 mm, and a field of view of 45 × 37°.
Visible (VIS) images were acquired on five dates (DOY 178, 200, 221, 232, and 248 in 2019 and 170, 175, 210, 232, and 253 in 2020), whereas thermal (TIR) images were acquired only in 2020 (DOY 175, 210, 225, 232, and 253). VIS-TIR images were acquired at noon under clear sky conditions. Before the UAV flights, a set of six ground control points (GCPs) were placed in the orchard (Figure 1) and georeferenced using a Leica GS09 real-time kinematic GPS (Leica Geosystems A.G., Heerbrugg, Switzerland). The flight altitude was 50 m above ground level (AGL), the speed 2 m s−1. The image forward and side overlap (80% and 70%, respectively) guaranteed optimal photogrammetric processing. At the time of each flight, surface temperature measurements of ground targets (white, grey, and black) were measured with a hand-held infrared thermometer model FLUKE 568 (Everett, WA, USA) and used for indirect calibration of the thermal imagery.

2.5. Image Processing

The visible (red, green, blue, RGB) and thermal images collected at each date of flight were processed using Agisoft Metashape Professional Edition (Agisoft LLC, St. Petersburg, Russia). The three-dimensional canopy volume and the projected canopy area (PCA) of each tree were calculated using RGB images following the procedure reported by Caruso et al. [29]. Briefly, RGB images were processed using the above mentioned software for the generation of the 3D point clouds. The digital surface model (DSM) was obtained from the 3D point cloud and then processed in ArcGIS (ArcGIS software®, ESRI, Redlands, CA, USA) to obtain a digital terrain model (DTM). The normalized DSM, obtained by subtracting the DTM from the DSM, allowed to retrieve the height of each three-dimensional axes of the canopy point above the ground. The net tree canopy volume was calculated by subtracting the volume comprised between the ground level and 0.7 m (the height of the insertion of the first couple of branches) to the total volume of each tree [29]. The very high resolution of the images and the absence of grass cover facilitated the separation of tree crowns from the background. The PCA was obtained using a height value threshold (0.7 m), which separated the soil from tree components. The obtained PCA raster file was used as filter mask to extract the pure canopy pixels from thermal images for each tree. They were then used to calculate the mean canopy temperature, which, in turn, was used to calculate the crop water stress index (CWSI) using the following Equation (1):
CWSI = T c a n o p y T w e t T d r y T w e t
where Tcanopy, Twet, and Tdry, are the canopy temperature, the canopy temperature without water stress, and the canopy temperature at maximum water stress, respectively. Twet and Tdry were determined based on the frequency of distribution of pure canopy temperatures pixels histogram, according to the analytical approach proposed by Bian et al. [27]. Thus, Twet corresponded to the average temperature of the 0.5% values on the left side of the histogram, whereas Tdry to the average temperature of the 0.5% values on the right side. In order to consider the fluctuations in CWSI during the irrigation period, the daily integrated CWSI (DICWSI) was calculated as the ratio between the cumulated CWSI over the entire period and the number of days between the first date of measurement.

2.6. Experimental Design and Statistical Analysis
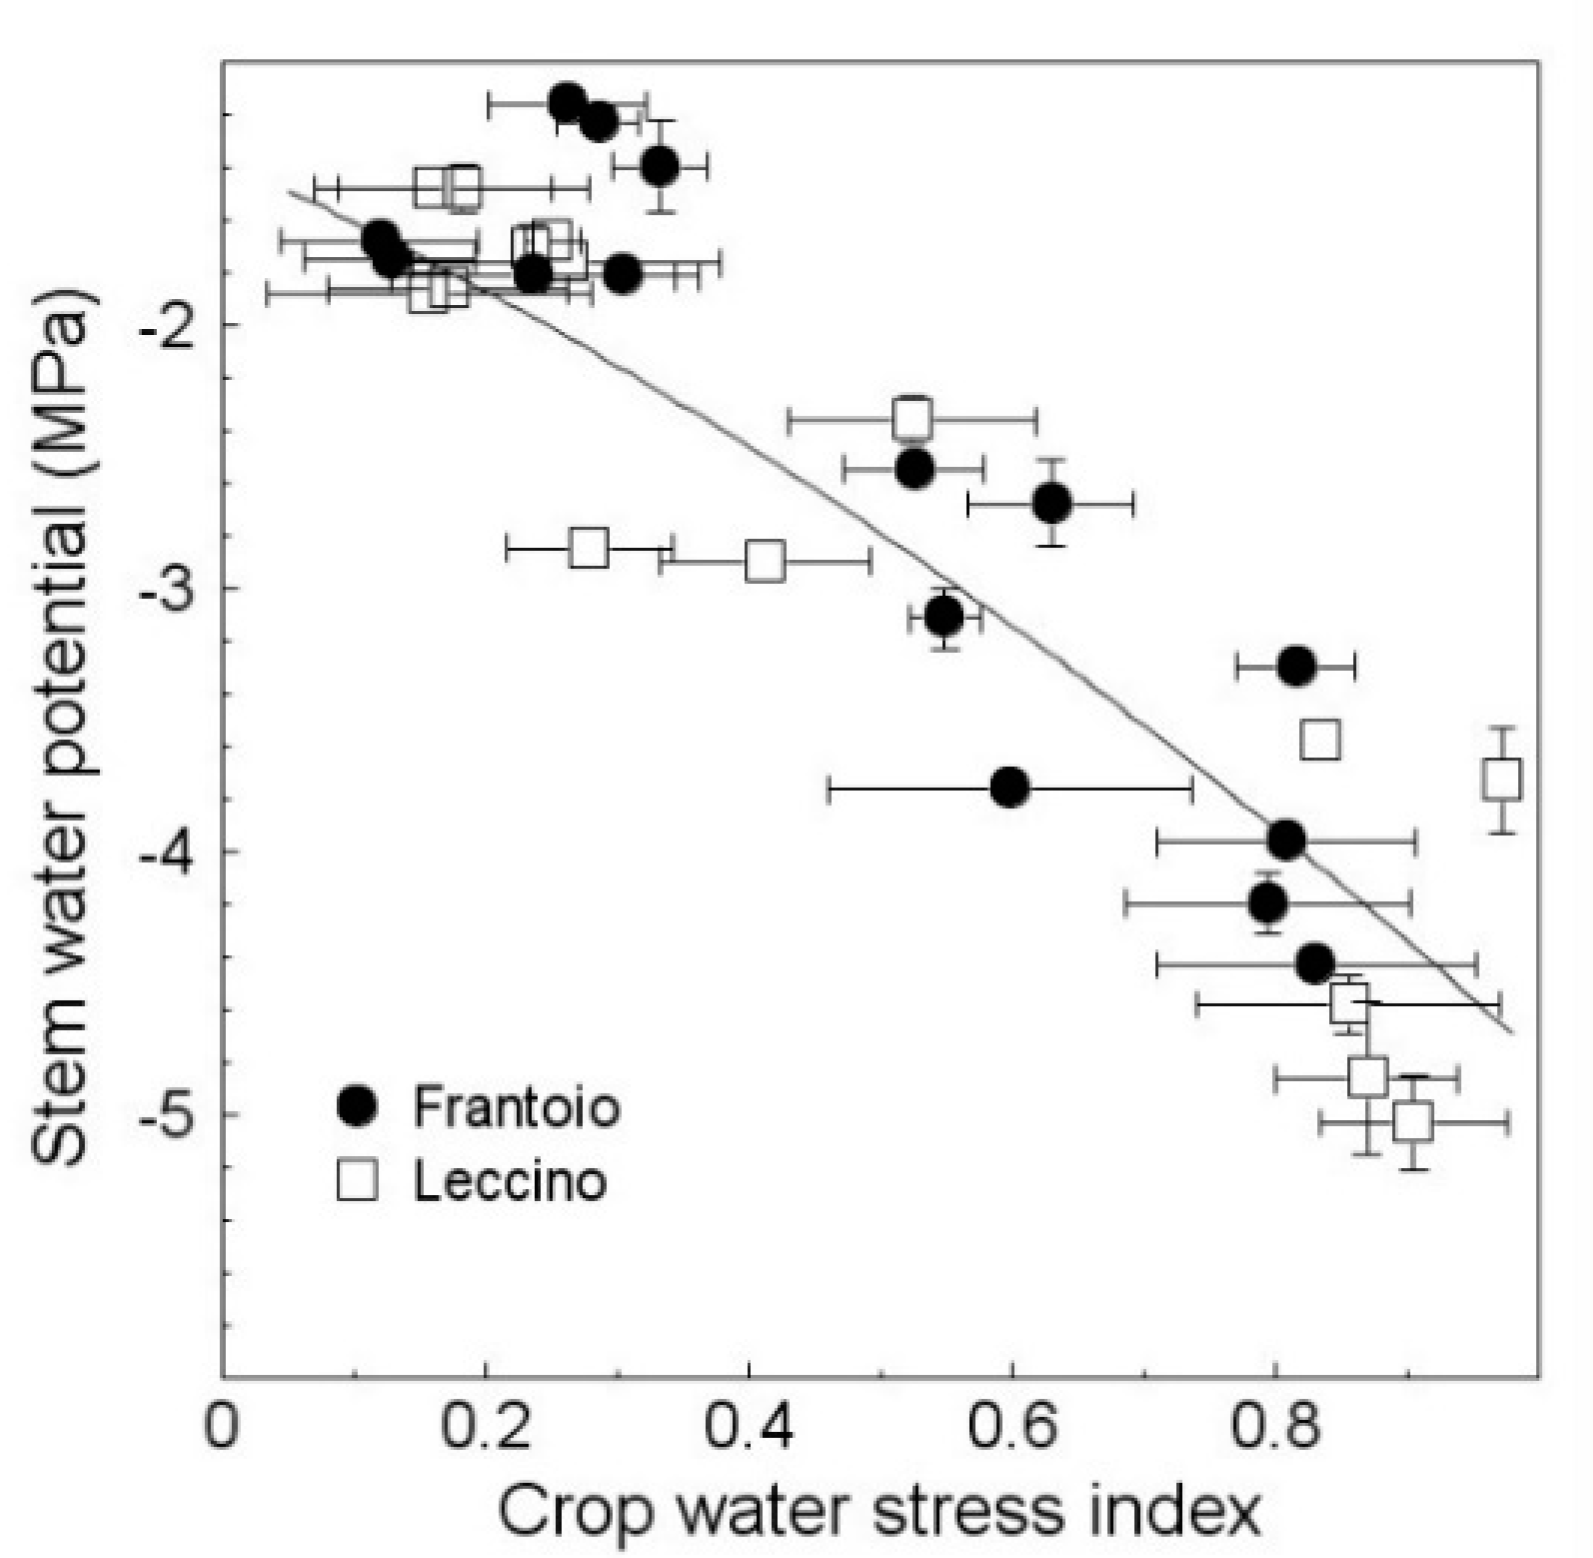
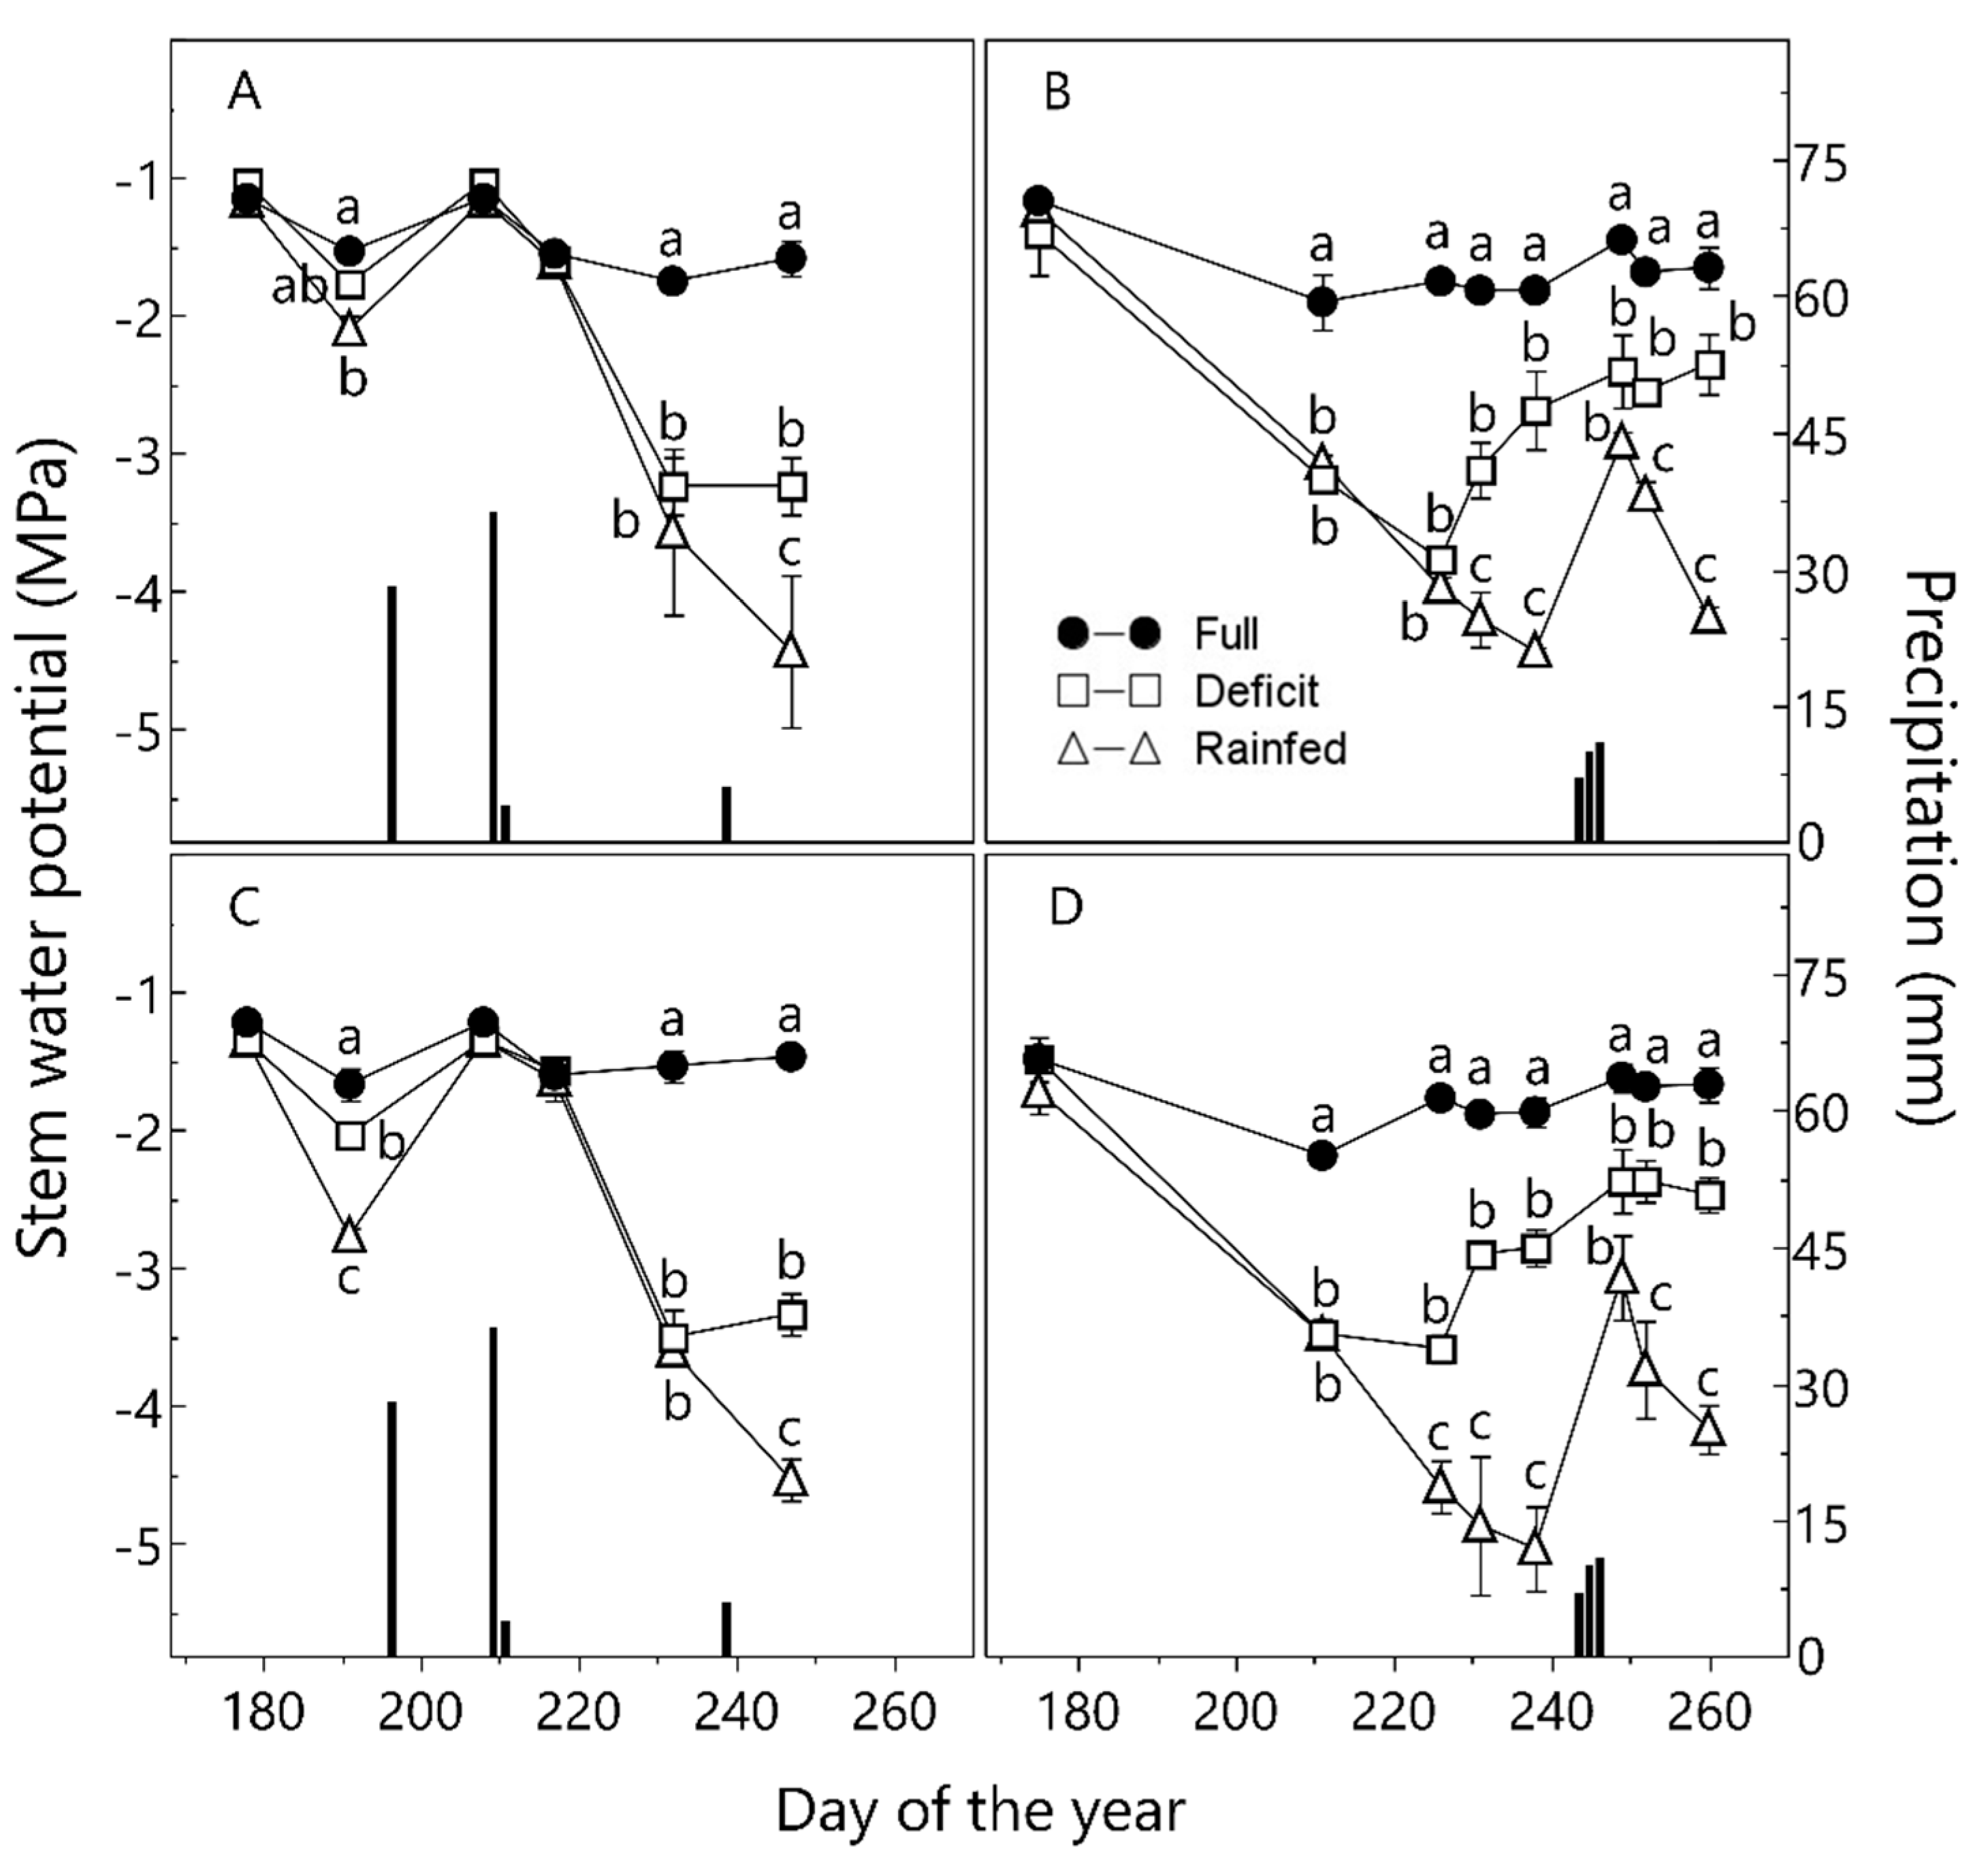
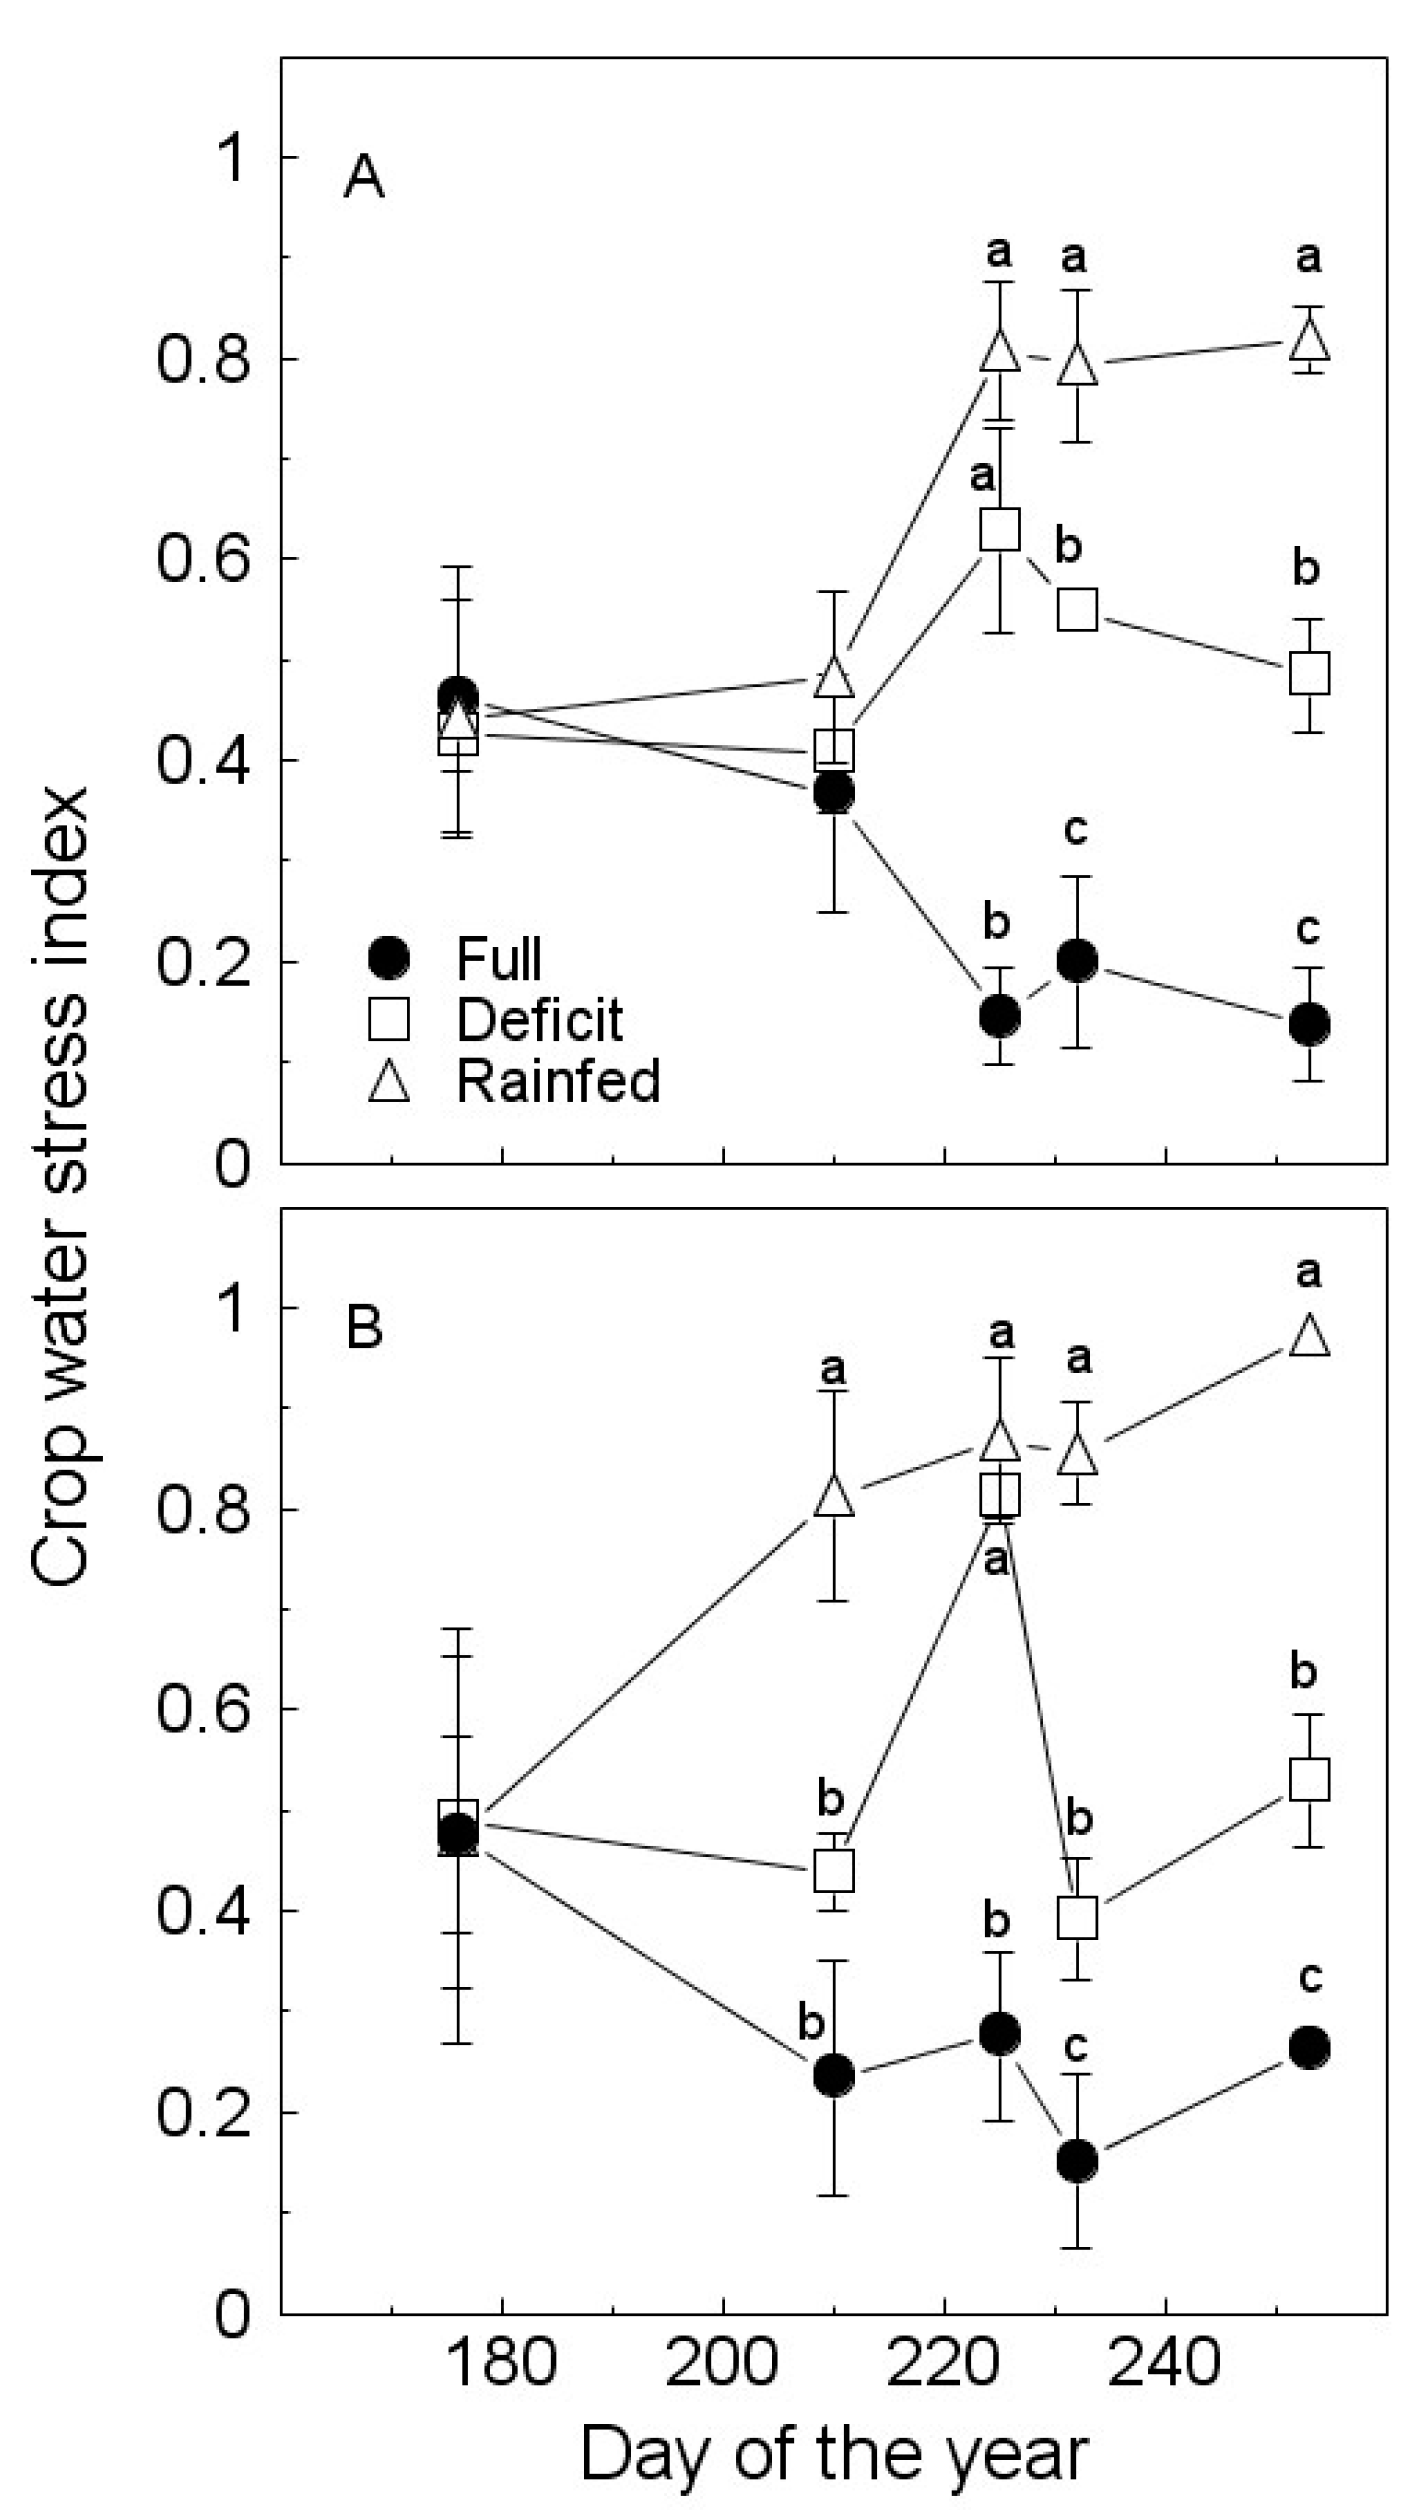
The trees used for the experiments were arranged along four rows (two adjacent rows for each cultivar) and three irrigation blocks each consisting of 80 trees. To avoid border effects, only the two inner rows were used and all measurements excluded the three outermost trees within each irrigation block. The SWP was measured on three trees per each irrigation regime and cultivar, whereas yield and remotely sensed data (CWSI and canopy volume) were measured on four trees. The same trees were used throughout the two years of the experiment. Means of irrigation treatments were separated by least significant differences (LSD) at p < 0.05 after a one-way analysis of variance (ANOVA). Where applicable, regression analysis was conducted using JMP (JMP SAS, Drive Cary, NC, USA).

3. Results

The SWP of fully irrigated trees was similar in both cultivars with average values during the entire irrigation period of −1.45 and −1.65 MPa (Frantoio in 2019 and 2020, respectively) and −1.45 and −1.77 MPa (Leccino in 2019 and 2020, respectively) (Figure 2).
Deficit irrigated trees reached the minimum values on DOY 232 in 2019 (−3.23 MPa and −3.50 MPa in Frantoio and Leccino, respectively) and DOY 226 in 2020 (−3.77 MPa and −3.58 MPa in Frantoio and Leccino, respectively). The lowest SWP values were measured in RF trees in both years and cultivars (Figure 2). The higher degree of water stress experienced by DI and RF trees at the end of the 2020 season (WSI of −2.80 and −3.28 MPa, DI and RF trees, respectively) than in 2019 (WSI of −2.11 and −2.43 MPa, DI and RF trees, respectively) was due to the different distribution of rainfall. In 2019 precipitations events that occurred in July restored SWP to the levels of well irrigated trees between DOY 196 and 208 (Figure 2); in 2020, the water stress of DI and RF trees increased progressively until DOY 238, and then rainfalls between DOY 243 and 245 reduced the differences in SWP across treatments. Nevertheless, differences remained significant.
There was a parabolic relationship between CWSI derived by aerial thermal images and the corresponding SWP values (Figure 3). Such relationship was not affected by the cultivar. In general, although CWSI appeared more variable than SWP, CWSI described well the seasonal course of tree water status and of the three irrigation regimes in 2020 (Figure 4). Differences in CWSI between irrigation treatments were significant on three (DOY 225, 232 and 253) and four (DOY 196, 225, 232 and 253) out of the five dates of measurement in Frantoio and Leccino, respectively.
There was a tight, linear correlation between the canopy volume calculated by UAV imagery and LAI of olive trees of both cultivars (Figure 5).
The R2 coefficient between LAI ground measurements taken with a ceptometer and the tree canopy volume estimated by UAV was 0.84 and 0.88 in Frantoio and Leccino, respectively. The increase in canopy size estimated by UAV was affected by water deficit consistently with the level of stress imposed (Figure 6). Canopy volume increased progressively in FI trees during the entire irrigation period in both years. Canopy growth stopped in DI and RF trees after DOY 232 in 2019 (both cultivars). In 2020, canopy size was stable after DOY 220 and 232 in Frantoio DI and RF, respectively, whilst in Leccino, DI and RF treatments a volume increase was measured between DOY 232 and 252 (Figure 6). Differences in canopy volume increment between FI and RF trees were significant starting from DOY 200 (2019) and 212 (2020) in Leccino, whereas in Frantoio, only the last two dates of measurement showed significant differences between these two treatments in 2020.
The fruit yield per tree ranged between 33.9 kg (Leccino FI in 2020) and 11.5 kg (Leccino RF in 2019) (Table 1). Tree water availability significantly affected fruit yield, which was the highest in FI trees and the lowest in rainfed ones, regardless of the year and cultivar. The yields of DI trees were intermediate between those measured for FI and RF trees and, in Leccino, they differed significantly from RF in both years. Oil yield per tree in RF trees was always significantly lower than that of FI ones (−22% and −30% in Frantoio and Leccino, respectively, average between years). The FI and DI trees of Frantoio cultivar had similar oil yields in 2019 and 2020.
When we expressed the different vegetative and productive parameters in terms of CWSI in 2020, the canopy volume increment was inversely related with the daily integrated CWSI in both cultivars with a steeper slope of the regression line for Frantoio than Leccino (Figure 7A). A similar inverse relationship was evident for cv. Leccino (not for Frantoio) when fruit yield was plotted against the integrated daily CWSI in 2020 (Figure 7B). The oil yield per tree remained stable until CWSI of about 0.5 and then decreased beyond that value (Figure 7C).

4. Discussion

The results of this two-year experiment allow us to confirm some previously reported results, but also to offer some new and valuable insights about: (i) the effect of soil water availability on tree growth and yield parameters; (ii) the suitability of VIS-TIR images acquired from UAV for monitoring tree water status and canopy growth; (iii) the ability of tree water status indices derived from aerial thermal images to infer canopy growth, fruit yield, and oil yield.
Irrigation affected tree vegetative growth in accordance with what previously reported by other authors [10,11]. Differences in canopy volume increment between irrigation regimes were evident in both years and for both cultivars. A reduction in canopy volume induced by water stress has been observed in previous studies carried out in Spain and Argentina [18,41]. The detrimental effect of a moderate water stress was more evident on fruit than oil yields. The fruit yields of DI trees were 93% (Frantoio) and 83% (Leccino) than those of FI ones (average of two years), whereas the oil yields of the same trees were 101% and 96% than those of the control trees. Previous studies found that oil yield was less sensitive than fruit yield under water deficit conditions. Martínez-Gimeno et al. [42] reported that the oil yield of RDI1 trees (about 50% of control) was similar to that of fully irrigated trees, and that further water restrictions (RDI2 and RDI3) led to a reduction in oil yield of 9% and 27%, respectively. Other authors measured a reduction in the oil yields of deficit-irrigated trees comprising between 14 and 21% compared to fully irrigated trees [18,43,44]. In agreement with these results, Caruso et al. [9] reported significantly higher values of mesocarp oil content in mesocarps from deficit irrigated trees than in fully irrigated ones in three of the four experimental years. In a recent three-year experiment carried out on cultivar Arbequina, the oil content in fruits from trees subjected to sustained deficit irrigation (about 26–38% of full irrigation) was always higher, even if not significantly, than that measured for FI trees [45].
Our results confirm CWSI to be a reliable alternative to SWP for estimating tree water status of mature trees. The simplified approach for CWSI calculation proposed by Bian et al. [27] was here tested for the first time in a high-density olive orchard using UAV thermal images and yielded valuable results. This approach is based on an intrinsic analysis of thermal images avoiding the need for additional field measurements or analytical data, making this method feasible for thermal imaging applications in commercial orchards. We found, indeed, a significant and stable relationship between the remotely sensed CWSI and the SWP measured on two cultivars at different phenological stages, expanding previously reported results for olive trees whereby the CWSI was calculated following analytical approaches [46,47]. The courses of CWSI and SWP also showed similar patterns during the irrigation period of both years, similarly to what reported by Egea et al. [47].
Previous works showed the fitness of UAV imagery for the estimation of geometrical canopy characteristics in olive orchards [28,29,30,31]. Using different olive cultivars, significant relationships between NDVI and LAI were measured by Caruso et al. [29] and Berni et al. [19] (R2 of 0.78 and 0.88, respectively). In this study, we measured the relationship between canopy volume and LAI for the first time in olive and obtained a significant and similar correlation for both cultivars. The “geometrical” nature of canopy volume and LAI could potentially overcome some bias in the LAI estimation through NDVI values. In fact, differently from NDVI, canopy volume is not affected by differences in the canopy spectral response caused by different olive genotypes or by biotic and abiotic stresses.
High-resolution UAV imagery of olive canopies have also been used in phenotyping experiments [32,33,34,35] or agronomic trials [29,36]. In the current study, using RGB images by an UAV, it was possible to measure and monitoring the canopy growth for individual trees according to the level of stress experienced. This information, coupled with yield parameters, could be potentially used as a rapid, non-destructive method to assess the tree vegetative-to-reproductive balance, which is important for tree performance. In viticulture, the Ravaz index, which is the ratio between yield and winter pruning weight, is used to assess grapevine balance. In olive growing, the pruning technique is more variable and less standardized than in viticulture, and there are no quick methods to determine the relationship between vegetative growth (e.g., leaf area and canopy size) and yield. In this regard, the canopy volume increment could be used as an alternative to the pruning weight as an indicator of the vegetative biomass produced by individual trees or the whole orchard.
The remote sensed indices by UAV have been previously tested in olive as a yield predictor [35,48,49,50,51]. The relationship between water status indicators, such as stem water potential, and tree performance has also been already assessed [45,52]. We showed that a UAV-derived water status indicator, such as the CWSI, can be used to establish correlations between the daily integrated CWSI and the canopy volume increment, fruit yield, and oil yield.

5. Conclusions

Deficit irrigation strategies are becoming crucial in olive orchards due to the increasing scarcity of water resources and the frequency of prolonged drought periods. In this experiment, deficit irrigation allowed to save about 56–59% of water compared to full irrigation with limited or no effect on fruit and oil yields, respectively. The above-mentioned beneficial effect can be achieved only by an accurate monitoring of both physiological and agronomic tree responses to the water stress imposed by DI strategies. Our results propose the use of the VIS-TIR images from UAVs as a reliable method to monitor both the tree water stress and its effect on canopy growth and yield at the field level, for a more efficient application of DI strategies in olive orchards.

Supplementary Materials

The following supporting information can be downloaded at: https://www.mdpi.com/article/10.3390/agronomy12081904/s1, Figure S1: Climatic conditions at the experimental site; Figure S2: Schematic representation of the procedure followed for the LAI measurements; Table S1: Physical and chemical characteristics of the soil.

Author Contributions

Conceptualization, G.C.; methodology, G.C. and R.G.; software, G.C. and G.P; validation, G.C. and G.P; formal analysis, G.C. and G.P; investigation, G.C., G.P. and L.T.; resources, G.C. and R.G.; data curation, G.C. and G.P; writing—original draft preparation, G.C. and R.G.; writing—review and editing, G.C., G.P, L.T. and R.G.; visualization, G.C., G.P. and L.T.; supervision, G.C. and R.G.; All authors have read and agreed to the published version of the manuscript.

Funding

This research received no external funding.

Institutional Review Board Statement

Not applicable.

Informed Consent Statement

Not applicable.

Data Availability Statement

Not applicable.

Acknowledgments

We are grateful to the Roncareggi farm for hosting the trials.

Conflicts of Interest

The authors declare no conflict of interest.

References

  1. Spinoni, J.; Naumann, G.; Vogt, J.; Barbosa, P. Meteorological Droughts in Europe: Events and Impacts: Past Trends and Future Projections; EUR 27748; Publications Office of the European Union: Luxembourg, 2016. [Google Scholar]
  2. Gómez del Campo, M.; García, J.M. Summer deficit-irrigation strategies in a hedgerow olive cv. Arbequina orchard: Effect on oil quality. J. Agric. Food Chem. 2013, 61, 8899–8905. [Google Scholar] [CrossRef] [PubMed]
  3. Caruso, G.; Gucci, R.; Urbani, S.; Esposto, S.; Taticchi, A.; Di Maio, I.; Selvaggini, R.; Servili, M. Effect of different irrigation volumes during fruit development on quality of virgin olive oil of cv. Frantoio. Agric. Water Manag. 2014, 134, 94–103. [Google Scholar] [CrossRef]
  4. Ben-Gal, A.; Ron, Y.; Yermiyahu, U.; Zipori, I.; Naoum, S.; Dag, A. Evaluation of regulated deficit irrigation strategies for oil olives: A case study for two modern Israeli cultivars. Agric. Water Manag. 2021, 245, 106577. [Google Scholar] [CrossRef]
  5. Servili, M.; Esposto, S.; Lodolini, E.; Selvaggini, R.; Taticchi, A.; Urbani, S.; Montedoro, G.; Serravalle, M.; Gucci, R. Irrigation effects on quality, phenolic composition, and selected volatiles of virgin olive oils cv. Leccino. J. Agric. Food Chem. 2007, 55, 6609–6618. [Google Scholar] [CrossRef] [PubMed]
  6. Caruso, G.; Gucci, R.; Sifola, M.I.; Selvaggini, R.; Urbani, S.; Esposto, S.; Agnese, T.; Servili, M. Irrigation and fruit canopy position modify oil quality of olive trees (cv Frantoio). J. Sci. Food Agric. 2017, 97, 3530–3539. [Google Scholar] [CrossRef]
  7. Gucci, R.; Caruso, G.; Gennai, C.; Esposto, S.; Urbani, S.; Servili, M. Fruit growth, yield and oil quality changes induced by deficit irrigation at different stages of olive fruit development. Agric. Water Manag. 2019, 212, 88–98. [Google Scholar] [CrossRef]
  8. Serman, F.V.; Orgaz, F.; Starobinsky, G.; Capraro, F.; Fereres, E. Water productivity and net profit of high-density olive orchards in San Juan, Argentina. Agric. Water Manag. 2021, 252, 106878. [Google Scholar] [CrossRef]
  9. Caruso, G.; Rapoport, H.F.; Gucci, R. Long-term evaluation of yield components of young olive trees during the onset of fruit production under different irrigation regimes. Irr. Sci. 2013, 31, 37–47. [Google Scholar] [CrossRef]
  10. Hernandez-Santana, V.; Fernàndez, J.E.; Cuevas, M.V.; Perez-Martin, A.; Diaz-Espejo, A. Photosynthetic limitations by water deficit: Effect on fruit and olive oil yield, leaf area and trunk diameter and its potential use to control vegetative growth of super-high density olive orchards. Agric. Water Manag. 2017, 184, 9–18. [Google Scholar] [CrossRef]
  11. Hueso, A.; Camacho, G.; Gòmez del Campo, M. Spring deficit irrigation promotes significant reduction on vegetative growth, flowering, fruit growth and production in hedgerow olive orchards (cv Arbequina). Agric. Water Manag. 2021, 248, 106695. [Google Scholar] [CrossRef]
  12. Cherbiy-Hoffmann, S.U.; Hall, A.J.; Rousseaux, M.C. Fruit yield and vegetative growth responses to photosynthetically active radiation during oil synthesis in olive trees. Sci. Hortic. 2013, 150, 110–116. [Google Scholar] [CrossRef]
  13. Benelli, G.; Caruso, G.; Giunti, G.; Cuzzola, A.; Saba, A.; Raffaelli, A.; Gucci, R. Changes in olive oil volatile organic compounds induced by water status and light environment in canopies of Olea europaea L. trees: Changes in olive oil VOCs induced by abiotic stresses. J. Sci. Food Agric. 2015, 95, 2473–2481. [Google Scholar] [CrossRef] [PubMed]
  14. Connor, D.J.; Gómez-del-Campo, M.; Trentacoste, E.R. Relationships between olive yield components and simulated irradiance within hedgerows of various row orientations and spacings. Sci. Hortic. 2016, 198, 12–20. [Google Scholar] [CrossRef]
  15. Allen, R.G.; Pereira, L.S.; Raes, D.; Smith, M. Crop Evapotranspiration. Guideline for Computing Crop Water Requirements. Irrigation and Drainage Paper No. 56; Food and Agriculture Organization (FAO): Rome, Italy, 1998. [Google Scholar]
  16. Shackel, K.; Moriana, A.; Marino, G.; Corell, M.; Pérez-López, D.; Martin-Palomo, M.J.; Caruso, T.; Marra, F.P.; Agüero Alcaras, L.M.; Milliron, L.; et al. Establishing a reference baseline for midday stem water potential in olive and its use for plant-based irrigation management. Front. Plant Sci. 2021, 12, 791711. [Google Scholar] [CrossRef]
  17. Villalobos, F.J.; Orgaz, F.; Mateos, L. Non-destructive measurement of leaf area in olive (Olea europaea L.) trees using a gap inversion method. Agric. Forest Meteorol. 1995, 73, 29–42. [Google Scholar] [CrossRef]
  18. Iniesta, F.; Testi, L.; Orgaz, F.; Villalobos, F.J. The effects of regulated and continuous deficit irrigation on the water use, growth and yield of olive trees. Europ. J. Agron. 2009, 30, 258–265. [Google Scholar] [CrossRef]
  19. Berni, J.A.J.; Zarco-Tejada, P.J.; Sepulcre-Cantó, G.; Fereres, E.; Villalobos, F. Mapping canopy conductance and CWSI in olive orchards using high resolution thermal remote sensing imagery. Remote Sens. Environ. 2009, 113, 2380–2388. [Google Scholar] [CrossRef]
  20. Bellvert, J.; Marsal, J.; Girona, J.; Zarco-Tejada, P.J. Seasonal evolution of crop water stress index in grapevine varieties determined with high-resolution remote sensing thermal imagery. Irr. Sci. 2015, 33, 81–93. [Google Scholar] [CrossRef]
  21. Bellvert, J.; Zarco-Tejada, P.J.; Marsal, J.; Girona, J.; González-Dugo, V.; Fereres, E. Vineyard irrigation scheduling based on airborne thermal imagery and water potential thresholds. Aus. J. Grape Wine Res. 2016, 22, 307–315. [Google Scholar] [CrossRef]
  22. Sepúlveda-Reyes, D.; Ingram, B.; Bardeen, M.; Zúñiga, M.; Ortega-Farías, S.; Poblete-Echeverría, C. Selecting canopy zones and thresholding approaches to assess grapevine water status by using aerial and ground-based thermal imaging. Remote Sens. 2016, 8, 822. [Google Scholar] [CrossRef]
  23. Maes, W.; Steppe, K. Estimating evapotranspiration and drought stress with ground-based thermal remote sensing in agriculture: A review. J. Exp. Bot. 2012, 63, 4671–4712. [Google Scholar] [CrossRef] [PubMed]
  24. Idso, S.B.; Jackson, R.D.; Pinter, P.J., Jr.; Reginato, R.J.; Hatfield, J.L. Normalizing the stress-degree-day parameter for environmental variability. Agric. Meteorol. 1981, 24, 45–55. [Google Scholar] [CrossRef]
  25. Jackson, R.D.; Idso, S.B.; Reginato, R.J.; Pinter, P.J., Jr. Canopy temperature as a crop water stress indicator. Water Resour. Res. 1981, 17, 1133–1138. [Google Scholar] [CrossRef]
  26. Agam, N.; Cohen, Y.; Berni, J.A.J.; Alchanatis, V.; Kool, D.; Dag, A.; Yermiyahu, U.; Ben-Gal, A. An insight to the performance of crop water stress index for olive trees. Agric. Water Manag. 2013, 118, 79–86. [Google Scholar] [CrossRef]
  27. Bian, J.; Zhang, Z.; Chen, J.; Chen, H.; Cui, C.; Li, X.; Chen, S.; Fu, Q. Simplified evaluation of cotton water stress using high resolution unmanned aerial vehicle thermal imagery. Remote Sens. 2019, 11, 267. [Google Scholar] [CrossRef]
  28. Zarco-Tejada, P.J.; Diaz-Varela, R.; Angileri, V.; Loudjani, P. Tree height quantification using very high resolution imagery acquired from an unmanned aerial vehicle (UAV) and automatic 3D photo-reconstruction methods. Europ. J. Agron. 2014, 55, 89–99. [Google Scholar] [CrossRef]
  29. Caruso, G.; Zarco-Tejada, P.J.; Gonzalez-Dugo, V.; Moriondo, M.; Tozzini, L.; Palai, G.; Rallo, G.; Hornero, A.; Primicerio, J.; Gucci, R. High-resolution imagery acquired from an unmanned platform to estimate biophysical and geometrical parameters of olive trees under different irrigation regimes. PLoS ONE 2019, 14, e0210804. [Google Scholar] [CrossRef]
  30. De Castro, A.I.; Rallo, P.; Suárez, M.P.; Torres-Sanchez, J.; Casanova, L.; Jimenez-Brenes, F.M.; Morles-Sillero, A.; Rocio Jimenez, M.; Lopez-Granados, F. High-throughput system for the early quantification of major architectural traits in olive breeding trials using UAV images and OBIA techniques. Front. Plant Sci. 2019, 10, 1472. [Google Scholar] [CrossRef]
  31. Jurado, J.M.; Ortega, L.; Cubillas, J.J.; Feito, F.R. Multispectral mapping on 3D models and multi-temporal monitoring for individual characterization of olive trees. Remote Sens. 2020, 12, 1106. [Google Scholar] [CrossRef]
  32. Díaz-Varela, R.A.; De la Rosa, R.; León, L.; Zarco-Tejada, P.J. High-Resolution airborne UAV imagery to assess olive tree crown parameters using 3D photo reconstruction: Application in breeding trials. Remote Sens. 2015, 7, 4213–4232. [Google Scholar] [CrossRef]
  33. Avola, G.; Di Gennaro, S.F.; Cantini, C.; Riggi, E.; Muratore, F.; Tornambè, C.; Matese, A. Remotely sensed vegetation indices to discriminate field-grown olive cultivars. Remote Sens. 2019, 11, 1242. [Google Scholar] [CrossRef]
  34. Rallo, P.; De Castro, A.I.; López-Granados, F.; Morales-Sillero, A.; Torres-Sanchez, J.; Jimenez, M.R.; Jimenez-Brenes, F.M.; Casanova, L.; Suarez, M.P. Exploring UAV-imagery to support genotype selection in olive breeding programs. Sci. Hortic. 2020, 273, 109615. [Google Scholar] [CrossRef]
  35. Caruso, G.; Palai, G.; Marra, F.P.; Caruso, T. High-resolution UAV imagery for field olive (Olea europaea L.) phenotyping. Horticulturae 2021, 7, 258. [Google Scholar] [CrossRef]
  36. Jimenez-Brenes, F.M.; Lopez-Granados, F.; De Castro, A.I.; Torres-Sanchez, J.; Serrano, N.; Peña, J.M. Quantifying pruning impacts on olive tree architecture and annual canopy growth by using UAV-based 3D modelling. Plant Methods 2017, 13, 55. [Google Scholar] [CrossRef] [PubMed]
  37. Torres-Sánchez, J.; López-Granados, F.; Serrano, N.; Arquero, O.; Peña, J.M. High-throughput 3-D monitoring of agricultural-tree plantations with unmanned aerial vehicle (UAV) technology. PLoS ONE 2015, 10, e0130479. [Google Scholar] [CrossRef] [PubMed]
  38. Castel, J.R.; Fereres, E. Responses of young almond trees to two drought periods in the field. J. Hortic. Sci. 1982, 57, 175–187. [Google Scholar] [CrossRef]
  39. Beltran, G.; Uceda, M.; Hermoso, M.; Frias, L. Maduracion. In El Cultivo del Olivo; Barranco, D., Fernandez-Escobar, R., Rallo, L., Eds.; Mundi-Prensa: Madrid, Spain, 2004; pp. 159–183. [Google Scholar]
  40. Gucci, R.; Lodolini, E.M.; Rapoport, H.F. Productivity of olive trees with different water status and crop load. J. Hortic. Sci. Biotech. 2007, 82, 648–656. [Google Scholar] [CrossRef]
  41. Fernandes-Silva, A.A.; Ferreira, T.C.; Correia, C.M.; Malheiro, A.C.; Villalobos, F.J. Influence of different irrigation regimes on crop yield and water use efficiency of olive. Plant Soil 2010, 333, 35–47. [Google Scholar] [CrossRef]
  42. Martínez-Gimeno, M.A.; Zahaf, A.; Badal, E.; Paz, Z.; Bonet, L.; Pèrez-Pèrez, J.G. Effect of progressive irrigation water reductions on super-high-density olive orchards according to different scarcity scenarios. Agric. Water Manag. 2022, 262, 107399. [Google Scholar] [CrossRef]
  43. Moriana, A.; Orgaz, F.; Pastor, M.; Fereres, E. Yield responses of a mature olive orchard to water deficits. J. Am. Soc. Hort. Sci. 2003, 128, 425–431. [Google Scholar] [CrossRef]
  44. Lavee, S. Biennial bearing in olive (Olea europaea). Ann. Ser. Hist. Nat. 2007, 17, 101–112. [Google Scholar]
  45. Corell, M.; Perez-Lopez, D.; Andreu, L.; Recena, R.; Centeno, A.; Galindo, A.; Moriana, A.; Martín-Palomo, M.J. Yield response of a mature hedgerow oil olive orchard to different levels of water stress during pit hardening. Agric. Water Manag. 2022, 261, 107374. [Google Scholar] [CrossRef]
  46. Ben-Gal, A.; Agam, N.; Alchanatis, V.; Cohen, Y.; Yermiyahu, U.; Zipori, I.; Presnov, E.; Sprintsin, M.; Dag, A. Evaluating water stress in irrigated olives: Correlation of soil water status, tree water status, and thermal imagery. Irr. Sci. 2009, 27, 367–376. [Google Scholar] [CrossRef]
  47. Egea, G.; Padilla-Díaz, C.M.; Martinez-Guanter, J.; Fernandez, J.E.; Perez-Ruiz, M. Assessing a crop water stress index derived from aerial thermal imaging and infrared thermometry in super-high density olive orchards. Agric. Water Manag. 2017, 187, 210–221. [Google Scholar] [CrossRef]
  48. Sola-Guirado, R.; Castillo-Ruiz, F.; Jiménez-Jiménez, F.; Blanco-Roldan, G.L.; Castro-Garcia, S.; Gil-Ribes, J.A. Olive actual “on year” yield forecast tool based on the tree canopy geometry using UAS imagery. Sensors 2017, 17, 1743. [Google Scholar] [CrossRef] [PubMed]
  49. Stateras, D.; Kalivas, D. Assessment of olive tree canopy characteristics and yield forecast model using high resolution UAV imagery. Agriculture 2020, 10, 385. [Google Scholar] [CrossRef]
  50. Ortenzi, L.; Violino, S.; Pallottino, F.; Figorilli, S.; Vasta, S.; Tocci, F.; Antonucci, F.; Imperi, G.; Costa, C. Early estimation of olive production from light drone orthophoto, through canopy radius. Drones 2021, 5, 118. [Google Scholar] [CrossRef]
  51. Caruso, G.; Palai, G.; Gucci, R.; Priori, S. Remote and proximal sensing techniques for site-specific irrigation management in the olive orchard. Appl. Sci. 2022, 12, 1309. [Google Scholar] [CrossRef]
  52. Moriana, A.; Pérez-López, D.; Prieto, M.H.; Ramírez-Santa-Pau, M.; Pérez-Rodriguez, J.M. Midday stem water potential as a useful tool for estimating irrigation requirements in olive trees. Agric. Water Manag. 2012, 112, 43–54. [Google Scholar] [CrossRef]
Figure 1. The olive orchard used for the experiment located at San Vincenzo (Livorno, 43.0551° N; 10.5490° E). The three yellow rectangles indicate the three irrigation treatments. Yellow dots, squares, and triangles indicate the monitored plants, soil sampling points, and ground control points, respectively.
Agronomy 12 01904 g001
Figure 2. Seasonal course of stem water potential of olive trees of cultivar Frantoio (A,B) and Leccino (C,D) subjected to full irrigation, deficit irrigation, or rainfed conditions in 2019 (A,C) and 2020 (B,D). Histograms represent precipitations. Symbols are means ± standard deviations of three trees. Different letters indicate significant differences between irrigation treatments after an analysis of variance (ANOVA, p < 0.05) within each date of measurement.
Agronomy 12 01904 g002
Figure 3. The relationship between crop water stress index (CWSI), calculated by UAV infra-red thermal imagery, and stem water potential (SWP) measured in the same days on olive trees (cvs. Frantoio and Leccino) subjected to full irrigation, deficit irrigation, or rainfed conditions in 2020. Measurements were taken at DOY 175, 210, 225, 232, and 253. Each symbol represents the mean of three trees. Vertical and horizontal bars are standard error for SWP and CWSI, respectively. Regression equation: SWP = 1.16, CWSI2 −2.26, CWSI −1.38; R2 = 0.83 (Frantoio and Leccino).
Agronomy 12 01904 g003
Figure 4. Seasonal course of crop water stress index (CWSI), calculated by UAV thermal imagery, of olive trees of cv. Frantoio (A) and Leccino (B) subjected to full irrigation, deficit irrigation, or rainfed conditions in 2020. Symbols are means ± standard error of 4 trees. Different letters indicate differences between irrigation treatments after ANOVA (p < 0.05) within each date of measurement.
Agronomy 12 01904 g004
Figure 5. The relationship between canopy volume (CV) calculated by UAV-VIS imagery and Leaf Area Index (LAI) of olive trees (cvs. Frantoio and Leccino) subjected to full irrigation, deficit irrigation, or rainfed conditions in 2019 and 2020. LAI measurements were taken on DOY 232 in 2019 and DOY 170, 212, and 253 in 2020. Symbols are means of four trees ± standard errors. Regression equations: LAI = 0.04 CV + 0.71, R2 = 0.84 (Frantoio); LAI = 0.05 CV + 0.46, R2 = 0.88 (Leccino).
Agronomy 12 01904 g005
Figure 6. Seasonal increment of cumulative daily canopy growth estimated by the UAV-VIS imagery of olive trees cultivar Frantoio (A,B) and Leccino (C,D) subjected to full irrigation, deficit irrigation, or rainfed conditions in 2019 (A,C) and 2020 (B,D). Symbols are means of four trees ± standard errors. Different letters indicate differences between irrigation treatments after an ANOVA (p < 0.05) within each date of measurement. Canopy volume increments were normalized against values at the beginning of the experiment (canopy volume = 0).
Agronomy 12 01904 g006
Figure 7. The relationship between daily integrated CWSI (DICWSI) calculated by UAV thermal imagery and canopy volume increment (CV), fruit yield (FY) and oil yield (OY) of olive trees (cvs. Frantoio and Leccino) subjected to full irrigation, deficit irrigation, and rainfed conditions in 2020. Each symbol represents one tree. Regression equations: (A) CV = −4.58 DICWSI + 4.65 (R2 = 0.68) (Frantoio); CV = −2.49 DICWSI + 4.34 (R2 = 0.47) (Leccino); (B) FY = −37.566 DICWSI2 + 22.873 DICWSI + 26.021, R2 = 0.45 (Frantoio); FY = −0.993 DICWSI + 39.902 (R2 = 0.72) (Leccino); (C) OY = −4.696 DICWSI2 + 2.874 DICWSI + 3.363, R2 = 0.44 (Frantoio); OY = −2.798 DICWSI2 + 0.833 DICWSI + 3.251, R2 = 0.85 (Leccino).
Agronomy 12 01904 g007
Table 1. Fruit yield, oil yield, maturation index, and oil in mesocarp measured at harvest in olive trees (cvs. Frantoio and Leccino) subjected to full irrigation, deficit irrigation, or rainfed conditions in 2019 and 2020. Fruit and oil yield are also expressed on trunk cross sectional area (TCSA) basis. Values are means ± standard errors of four trees (n = 4). Different letters indicate significant differences between irrigation treatments after an ANOVA within each year and cultivar. LSD, least significant difference (p ≤ 0.05).
YearCultivarIrrigationFruit Yield
(kg Tree−1)
Fruit Yield
/TCSA
(kg dm−2)
Oil Yield
(kg Tree−1)
Oil Yield/TCSA
(kg dm−2)
Maturation Index
(0–7 Scale)
Oil in
Mesocarp
(% DW)
2019FrantoioFull20.148 ± 2.68 a17.307 ± 2.393.459 ± 0.36 a2.970 ± 0.311.31 ± 0.33 b63.1 ± 1.41 a
Deficit18.879 ± 3.12 ab19.977 ± 4.713.431 ± 0.48 a3.630 ± 0.771.41 ± 0.51 b62.4 ± 1.54 a
Rainfed15.919 ± 1.98 b18.864 ± 4.022.747 ± 0.26 b3.275 ± 0.803.39 ± 0.47 a58.1 ± 4.16 b
LSD4.2166.1310.6001.0600.7114.30
LeccinoFull22.266 ± 3.05 a22.346 ± 6.032.373 ± 0.38 a2.374 ± 0.652.83 ± 0.31 b50.7 ± 2.06 b
Deficit19.263 ± 2.18 a21.371 ± 6.072.545 ± 0.33 a2.746 ± 0.153.82 ± 0.15 a55.5 ± 1.47 a
Rainfed11.456 ± 2.63 b20.004 ± 2.121.723 ± 0.47 b3.003 ± 0.603.99 ± 0.01 a53.0 ± 3.72 ab
LSD4.2328.1430.6390.8240.3224.15
2020FrantoioFull29.703 ± 1.4918.362 ± 2.753.699 ± 0.22 a2.305 ± 0.471.18 ± 0.0657.2 ± 1.97 ab
Deficit26.913 ± 6.3918.327 ± 1.073.787 ± 0.66 a2.602 ± 0.131.07 ± 0.1259.1 ± 1.84 a
Rainfed23.159 ± 3.6818.856 ± 1.372.841 ± 0.20 b2.345 ± 0.331.21 ± 0.1754.9 ± 2.29 b
LSD6.9423.0070.6720.5420.2023.27
LeccinoFull33.877 ± 4.72 a18.523 ± 4.743.276 ± 0.17 a1.790 ± 0.392.22 ± 0.07 ab49.3 ± 2.57
Deficit26.820 ± 2.14 b18.234 ± 1.812.770 ± 0.33 b1.883 ± 0.241.98 ± 0.16 b48.9 ± 2.63
Rainfed21.250 ± 2.17 c19.153 ± 2.802.193 ± 0.18 c1.993 ± 0.392.51 ± 0.51 a48.6 ± 1.92
LSD5.1925.3490.3750.5570.4973.83
Publisher’s Note: MDPI stays neutral with regard to jurisdictional claims in published maps and institutional affiliations.

