Article

Study of the Potential for Agricultural Reuse of Urban Wastewater with Membrane Bioreactor Technology in the Circular Economy Framework

by
Laura Antiñolo Bermúdez
1,
Juan Carlos Leyva Díaz
1,*,
Jaime Martín Pascual
1,
María del Mar Muñío Martínez
2 and
José Manuel Poyatos Capilla
1
1
Department of Civil Engineering and Institute of Water Research, University of Granada, 18071 Granada, Spain
2
Department of Chemical Engineering and Institute of Water Research, University of Granada, 18071 Granada, Spain
*
Author to whom correspondence should be addressed.
Agronomy 2022, 12(8), 1877; https://doi.org/10.3390/agronomy12081877
Submission received: 21 June 2022 / Revised: 25 July 2022 / Accepted: 8 August 2022 / Published: 10 August 2022
(This article belongs to the Special Issue Circular Economy and Sustainable Development in Agriculture)

Abstract

:
The growing demand for water by the population and industry, as well as water scarcity due to climate change, has created a need to reuse treated water for agricultural purposes. In this context, the European Union, through its Regulation (EU) 2020/741, establishes minimum requirements for wastewater reuse, specifying that reuse for agricultural purposes can help to promote the circular economy and reduce the need for fertiliser use by setting high-quality standards. The aim of this article is to study whether the treated water from a pilot plant with membrane bioreactor technology operating with real urban wastewater from the city of Granada (Spain) satisfies the quality standards required for its reuse for agricultural purposes, as well as assessing the use of other resources produced during wastewater treatment, such as biogas and biostabilised sludge. This plant works in four cycles of operation at two different hydraulic retention times (6 and 12 h) and different concentrations of mixed liquor (2429–6696 mg/L). The pilot plant consists of a membrane bioreactor where there are four ultrafiltration membranes working in continuous operation and a sludge treatment line working in discontinuous mode. Subsequently, a tertiary treatment of advanced oxidation process was applied to the treated water for a time of 30 min, with different concentrations of oxidant. The results showed that the effluent has sufficient quality to be used in agriculture, complying with the characteristics established in the European legislation. Furthermore, the biostabilised sludge and biogas can be potentially reusable.

1. Introduction

Societies around the world are currently facing the challenge of managing their resources, with a special focus on water. Regarding the negative effects of society’s unsustainable use of natural resources, it is essential to reduce consumption and dependence on non-renewable resources [1]. The circular economy emerges as a solution based on the idea of reducing waste and extending the useful life of resources, focusing on efficiency and reducing the consumption of raw materials and environmental contamination [2]. According to the United Nations, a global shortage of potable water resources of around 40.0% is expected by 2030 [3], which makes essential an efficient and sustainable use of water resources in agriculture [4]. In the case of the European Union, the Water Framework Directive 2000/60/EC obliges member states to conserve and protect aquatic ecosystems through their sustainable use. However, for southern countries in the European Union, such as Spain, this objective is more complicated due to their climatic characteristics of prolonged periods of drought. Therefore, legislation is necessary to establish adequate quality standards for the reuse of wastewater, once it has been treated, as set out in Directive 91/271/EEC, so that it can be reused when appropriate. Furthermore, the European Union has implemented Regulation (EU) 2020/741, on minimum requirements for water reuse, legislation that is complementary to the existing legislation in the different member states. In the case of Spain, Royal Decree 1620/2007 establishes the legal regime for the reuse of treated water and its Annex I.A establishes the quality criteria for the reuse of water, dividing them into five qualities that include from the most restrictive to the least restrictive parameters. Quality 1 is exclusively for situations that are in direct contact with humans, such as irrigation of private gardens and green areas, discharge of sanitary appliances, etc. Quality 2 and its different subsections is where this article is focused, as it refers to agricultural reuse. The parameters established for this section are shown in Annex I of the legislation.
At the European level, the minimum quality requirements to be met by reclaimed water for agricultural irrigation, as laid down in Directive 91/271/EEC and Regulation (EU) 2020/741 on minimum requirements for water reuse, are set out in Annex I of the legislation. This legislation considers reclaimed water when the requirements set out in Annex I of the legislation are met and the indicated values for E. coli, Legionella spp. and intestinal nematodes are met in 90.0% or more of the samples; none of the values in the samples exceed the maximum deviation limit of 1 log unit from the indicated value for E. coli and Legionella spp. and 100% of the indicated value for intestinal nematodes and the indicated values for BOD5, TSS and turbidity in Class A are met in 90.0% or more of the samples; none of the values in the samples exceed the maximum deviation limit of 100% of the indicated value.
Several studies have observed toxin-producing pathogens in treated wastewater [5]. If wastewater is not suitably treated and used for irrigation in agriculture, it can signify a health risk by producing contaminated foodstuffs containing pathogens and other pollutants [6]. The technology of membrane bioreactors (MBR) is being studied and presented in an effective way for the correct treatment of wastewater, obtaining high-quality effluents [7,8]. Membrane bioreactor (MBR) technology combines biological treatment with membrane filtration to produce a clarified and largely disinfected effluent, which is being implemented in more and more countries [9]. Despite the problems of membrane fouling and high energy costs, it is presented as a technology with pollutant removal efficiencies around 100% in some cases due to the higher solids retention time (SRT) that facilitates microbial degradation and the physical retention of the molecules that are higher than the membrane pores [10]. An advanced oxidation process has been used as tertiary treatment. In recent years, various pharmaceuticals have been detected in groundwater and surface water that have been associated with wastewater discharges because the pharmaceuticals are not completely removed by current wastewater treatment technology [11]. Advanced oxidation processes (AOP) are presented as an efficient tertiary treatment for the elimination of this type of compound [12]. In this research, an AOP based on hydrogen peroxide and ultraviolet radiation (H2O2/UV) was applied to improve the quality of the treated water.
In addition, during the various stages of wastewater treatment, other resources are also produced, with the possibility of using them for energy production, such as biogas and biostabilised sludge. Biogas, which is bioenergy produced from biomass, has several advantages over other forms of renewable energy, hence, the need to adopt and move to biogas technology [13]. It is important to note other aspects, such as the quality of the biogas and its origin but, in general, biogas is used in internal combustion engines in the field of electric and thermal energy generation [14]. Once the biogas has been purified to biomethane, it can be considered as a reference model for the circular bioeconomy since better sustainable practices could be followed [15,16].
In the case of biostabilised sludge, it also depends on the location of the plant where it is generated and this confers specific characteristics, depending on several factors, such as seasonal variability or the treatment technology of the WWTP [17,18]. Based on its characteristics, biostabilised sludge can be reused in agriculture as soil fertiliser or soil conditioner, thus, increasing the yield of the target crops [19]. It can be also used as an energy source/resource that would replace raw materials that have to be produced from non-renewable sources, with considerable associated environmental impacts [20,21].
In this context, different circular economy indicators have been established to monitor the quality of treated wastewater for further use in agriculture, as well as the related resources of biogas and biostabilised sludge [22]. These indicators will assess the environmental sustainability of the technology under study and can be useful for initial assessments [23].
The aim of this research was to evaluate, under the operation conditions of the pilot plant (cycle 1: 6 h of HRT and 4919 ± 1124 mg/L of mixed liquor suspended solids (MLSS); cycle 2: 6 h of HRT and 6696 ± 2472 mg/L of MLSS; cycle 3: 12 h of HRT and 4771 ± 1436 mg/L of MLSS; cycle 4: 12 h of HRT and 2429 ± 768 mg/L of MLSS), working with real urban wastewater, if the treated wastewater can be used for agriculture. For this purpose, an assessment of the effluent quality was carried out using circular economy indicators, as well as for other usable resources, such as the biogas produced and biostabilised sludge.

2. Materials and Methods

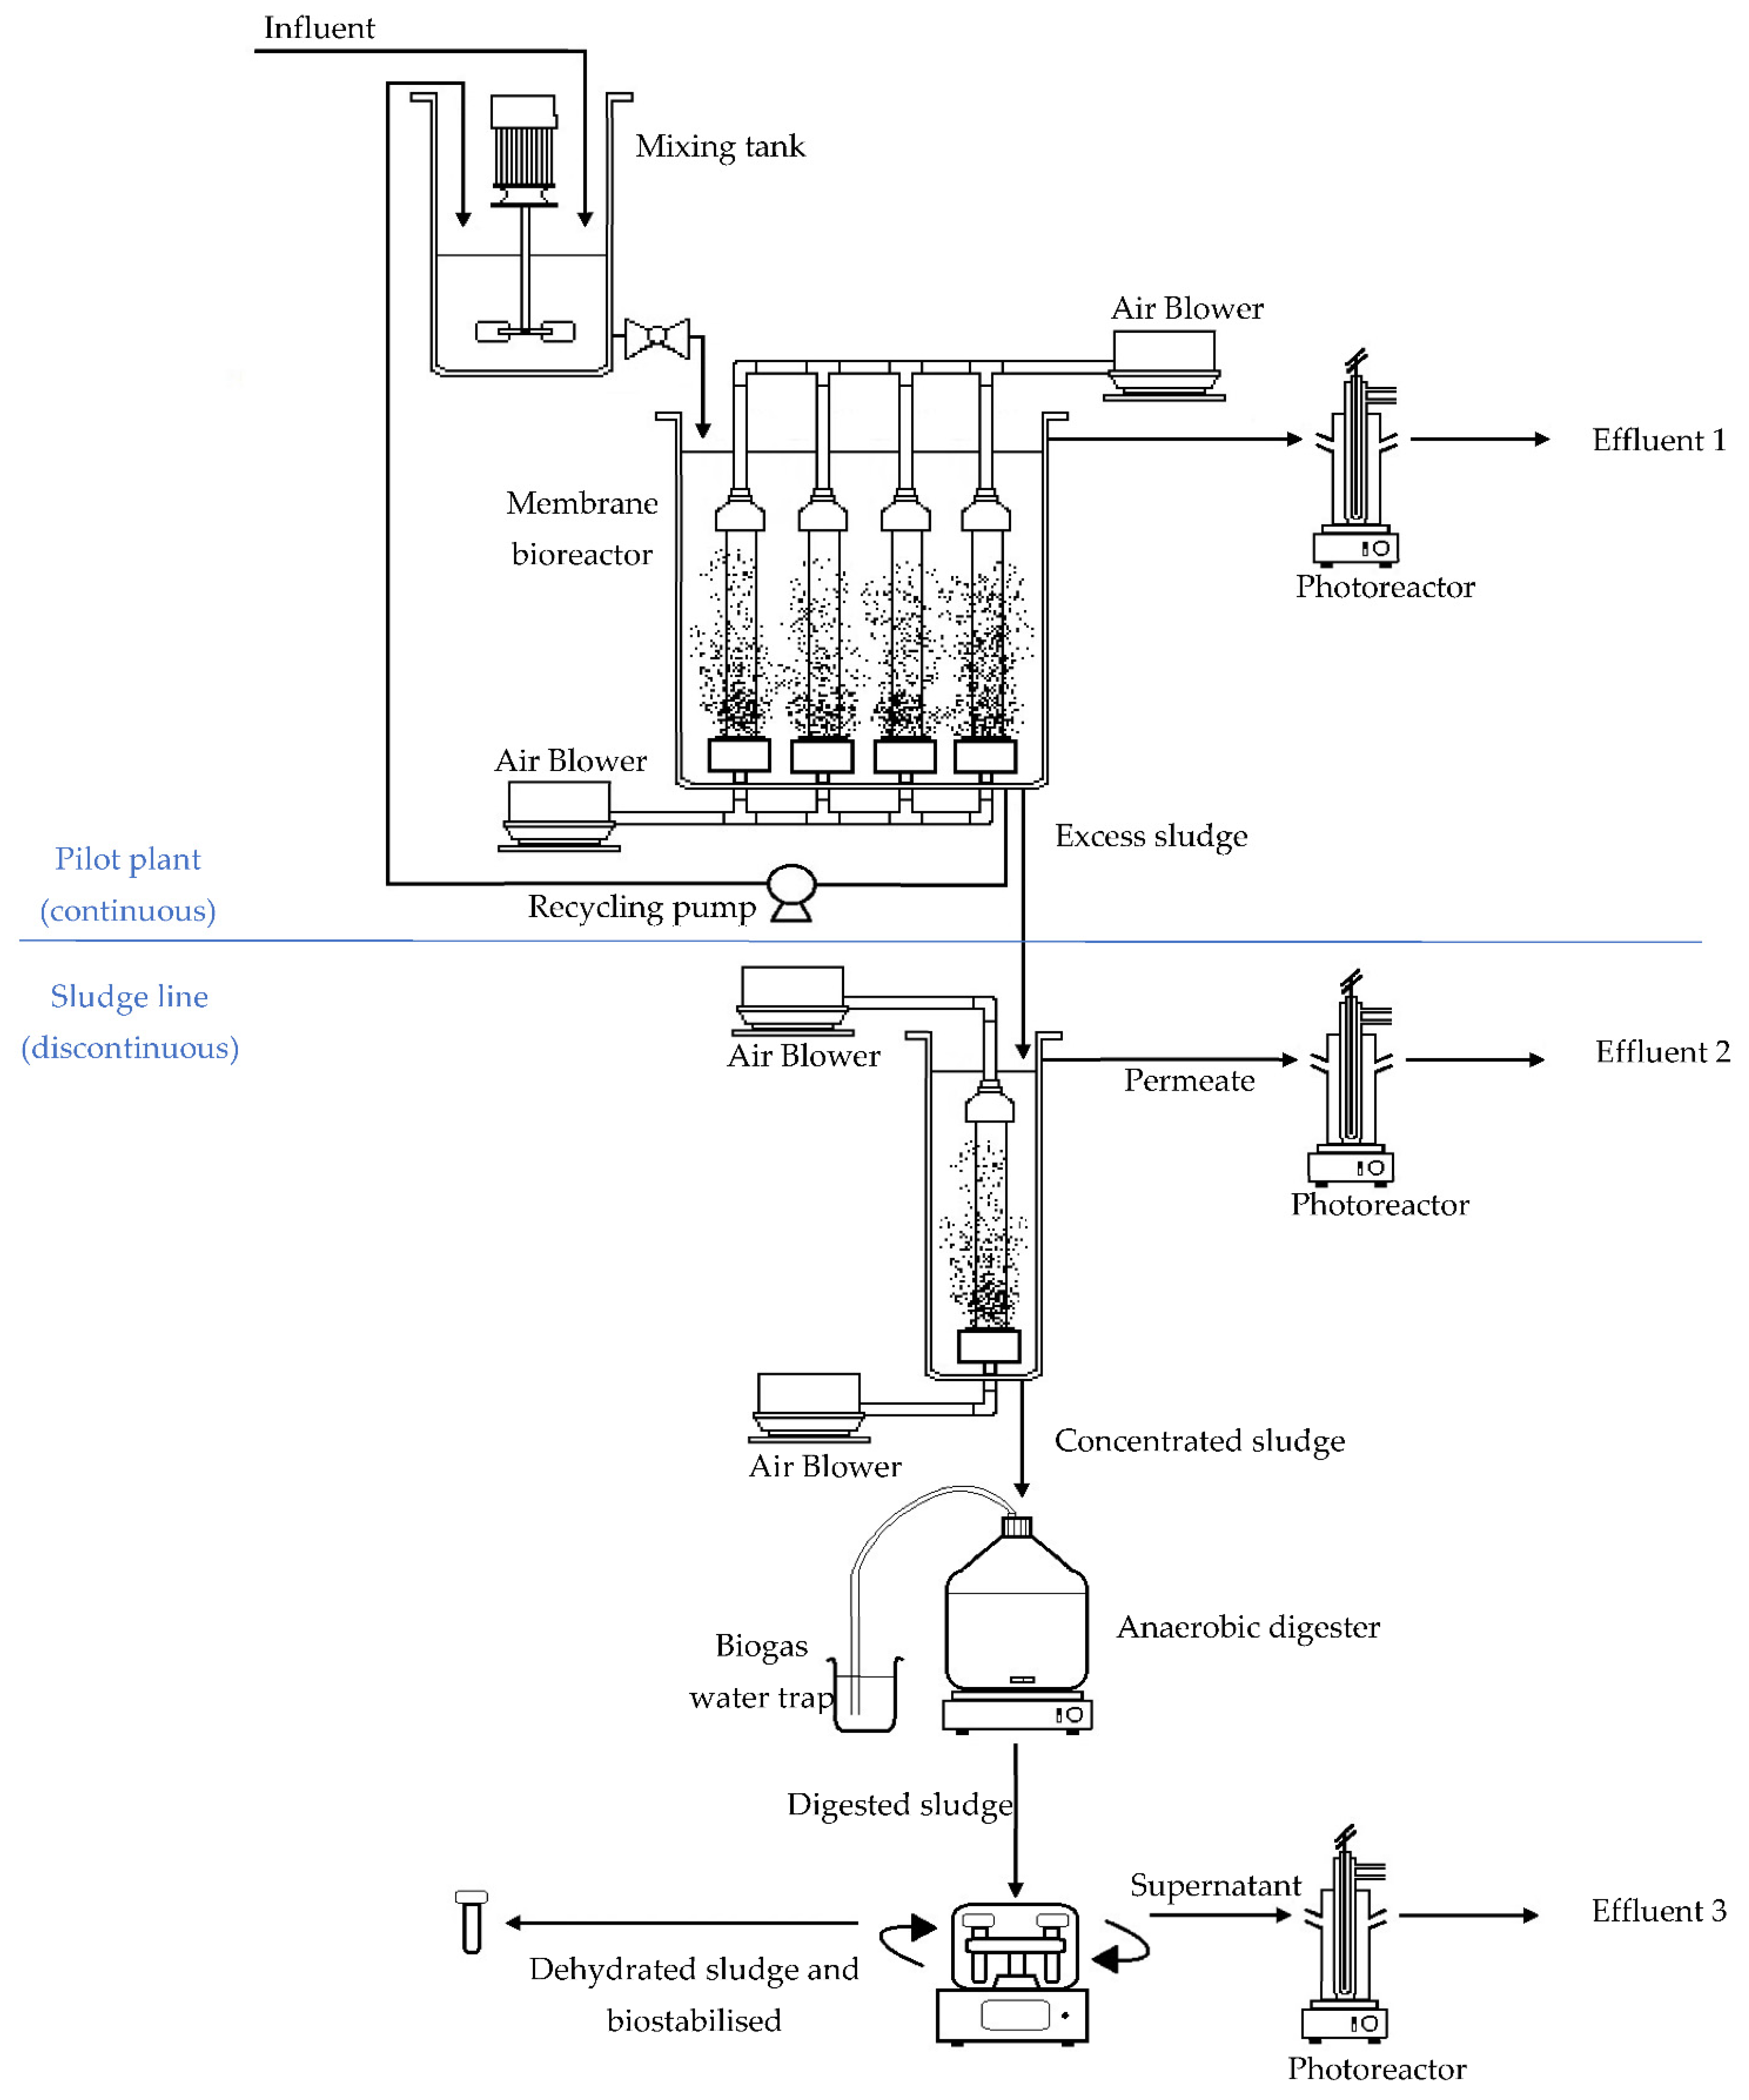
2.1. Description of the Pilot Plant

The pilot-scale urban wastewater treatment plant used in this study uses MBR technology. It is located at the Los Vados WWTP (Granada, Spain) and is fed with real urban wastewater from the primary settling of the Los Vados WWTP. The plant consists of a cylindrical mixing tank with mechanical agitation, which is connected to a rectangular bioreactor (85 L) where ultrafiltration membranes of 3.72 m2 in filtration surface area (each membrane module has 0.93 m2 surface area), with a pore size of 0.04 µm (ZW-10, Zenon), are submerged. The membranes are made of polyvinylidene fluoride (PVDF) of outside/in hollow fibre configuration, with a weight per module (drained) of 1.9 kg and 2.1 kg (wet), with permeate (fibre size) hold-up volume of 0.13 litres. The typical operating transmembrane pressure (TMP) was 10–50 kPa, with a maximum TMP of 62 kPa. The operation flow rate was 4.25 L m−2 h−1 for cycles 1 and 2 and 2.12 L m−2 h−1 for cycles 3 and 4. Filtration in these modules was carried out by a peristaltic pump working in combined cycles of 9 min and 35 s of filtration and a backwashing of 25 s. The filtration is carried out from the outside of the membrane to the inside by suction. Figure 1 shows a diagram of the pilot plant and the sludge line.
The membrane tank was constantly aerated to physically clean the surface of the membranes and to ensure the aerobic condition and the homogenisation of the mixed liquor. The flow rate of oxygen was 226.52 L/min (56.63 L/min for each membrane module) where a set point of 1.5 mg/L of dissolved oxygen was maintained, with aeration stopping once the set point was reached and starting again when the set point dropped below half of the set point. The plant had a recirculation stream from the membrane tank to the mixing tank to guarantee a constant MLSS concentration.
The pilot plant, which constitutes the water line of the study, was operated continuously in four operating cycles with the modified operation variables being the hydraulic retention time (HRT) and the MLSS concentration. Once the plant reached steady state, a purge flow rate was set to remove waste sludge from the system. Table 1 shows the conditions for each working cycle.
The sludge line operated in batch mode with the daily sludge purged. The sludge was concentrated in a membrane thickener which concentrated it to 20.0% (v/v). The total suspended solids (TSS) from sludge digestion after thickening were 9900 mg/L (cycle 1), 14,650 mg/L (cycle 2), 12,970 mg/L (cycle 3) and 6040 mg/L (cycle 4). This thickening was carried out in a vertically oriented aerated circular tank with a total volume of 6.7 L (4.32 L of effective volume) in which a hollow fibre microfiltration membrane with a total area of 0.10 m2 was submerged. The membrane operated in suction and backwashing cycles programmed according to the optimum TMP. The hollow fibres in the membrane were made of PVDF with a polyester braided interior support. Once the sludge was thickened, it was introduced into a laboratory-scale digester located in a thermostatic fridge for digestion. This digester was agitated under anaerobic conditions and had a water trap for bubbling the gas produced. A constant temperature of 32.5 °C was maintained throughout the experiment by means of a controller located in the thermostatic fridge. It was kept in digestion for 28 days to ensure that the sludge had been completely digested. Once the digestion process had been completed, the sludge was centrifuged to separate its liquid and solid phase from the digestate.

2.2. Analytical Methods

During the operation of the plant, samples of influent, effluent, bioreactor and mixing tank were taken daily in all operating cycles in order to characterise the wastewater and the operation (MLSS, chemical oxygen demand (COD), biochemical oxygen demand on the fifth day (BOD5), pH, conductivity and temperature). Control analyses for BOD5, COD and TSS were performed according to the standard methods [24]. Turbidity measurements were performed according to UNE-EN ISO 7027-1:2016 and colour measurements according to method B of UNE-EN ISO 7887:2012. Conductivity and temperature measurements were carried out with a Crison CM 35® meter (Barcelona, Spain). The pH measurement was carried out with a Crison pH 25® meter (Barcelona, Spain). Absorbance measurements at different wavelengths were measured on a Thermo Helios Gamma 9423 UVG 1002E spectrophotometer. Tests for COD, TSS, pH, conductivity, temperature, alkalinity and volatile fatty acids were carried out during the digestion process. For the determination of volatile fatty acids and alkalinity, the method described in APHA was used [25]. Colour tests were carried out on samples of effluent, permeate from thickening the sludge prior to anaerobic digestion and once the sludge had been digested and centrifuged, the measurement was also carried out on the reject water from the final centrifugation. In addition, these samples were subjected to advanced H2O2/UV oxidation processes, lasting 30 min at three increasing H2O2 concentrations of 25 mg/L, 50 mg/L and 100 mg/L. During the tests, samples were collected from the test evolution at 0 min, 10 min, 20 min and 30 min. Colour measurement was also performed on these samples. Colour was measured by the absorbance of the samples at three wavelengths (436 nm, 525 nm and 620 nm). Spot assays for Escherichia coli were performed following the membrane filtration method described in the DifcoTM Manual, which consists of 0.45 µm membrane filtration of the sample and subsequent incubation at 44 °C on plates with Endo Agar as culture medium. In addition, nitrogen and phosphorus detection was carried out. The samples were analysed on a Metrohom ECO IC autosampler ion chromatograph plus 919 IC and on a Metrohom Compact IC 761 ion chromatograph. The analytical method used was high-performance liquid chromatography with triple-quadrupole mass spectrometry detector [26].

2.3. Advanced Oxidation Processes

A UV-Consulting Peschl® photochemical reactor (Mainz, Germany) was used to carry out the advanced oxidation process. It is a batch reactor with a capacity of 0.8 L. The lamp used as a source of photoirradiation is a medium pressure mercury vapor lamp with an emission spectrum in a UV range above 190 nm and a power of 150 W. The reactor is stirred to ensure perfect mixing and is insulated by a cylindrical quartz tube surrounded by a cooling jacket. The cooling was carried out by means of a cold-water bath that maintained an operating temperature of 20 °C in the photoreactor.
An aspect to highlight about the use of AOP is its high economic cost. To minimise this problem, biological and physicochemical processes are combined to make the process selective for certain pollutants [11]. In addition, techniques have been developed that combine biological treatment processes and AOP to make the processes more energy efficient [27].

2.4. Biological Dephosphatation Potential Indicator (IBDP)

To analyse the expected phosphorus removal in the wastewater treatment process, an initial assessment can be made based on the COD of the input water and the total phosphorus (TP) present in the water [28]. Depending on the results obtained, it can be decided if only a biological process should be used or whether it is necessary to incorporate a physicochemical process. For the removal of TP, biological treatment is intended to be applied, as it is efficient and does not produce residues of unwanted compounds in the sludge, as is the case with chemical treatments [29]:
The IBDP indicator is calculated from the following equation:
I BDP = COD TP
where:
  • COD: chemical oxygen demand concentration in the influent (mg/L)
  • TP: total phosphorous concentration in the influent (mg/L)
This indicator shows that a physical or chemical treatment must be applied in addition to the biological treatment when the result is lower than 50. However, when the result is higher than 50, several authors [28,30,31] state that dephosphatation by biological treatment is adequate, resulting in a final content with a TP concentration lower than 2 mg/L. It is an indicator of the applicability of a biological-based phosphorus removal stage.

2.5. Indicators of Circular Economy

In order to comprehensively cover the wastewater purification process, indicators will be set for the whole process, which will be divided into 3 parts: indicators for water quality, indicators for sludge quality and indicators for biogas. Once the results obtained from the circular economy indicators have been calculated and analysed, it will be determined whether the water leaving the plant in its different phases is suitable for reusing in agricultural irrigation in terms of resource recovery.

2.5.1. Indicators of Circular Economy for Water

Recovery of Water in the Treatment Process Indicator (IW,R)

In order to analyse the percentage of treated water in the whole process, the following indicator was proposed. It is calculated from the following equation:
I W , R   ( % ) = Q eff + Q P + Q S Q W · 100
where:
  • Qw: wastewater flow rate (L/day)
  • Qeff: effluent flow rate (L/day)
  • Qp: permeate from the sludge thickener flow rate (L/day)
  • Qs: supernatant from digester sludge centrifugation flow rate (L/day)

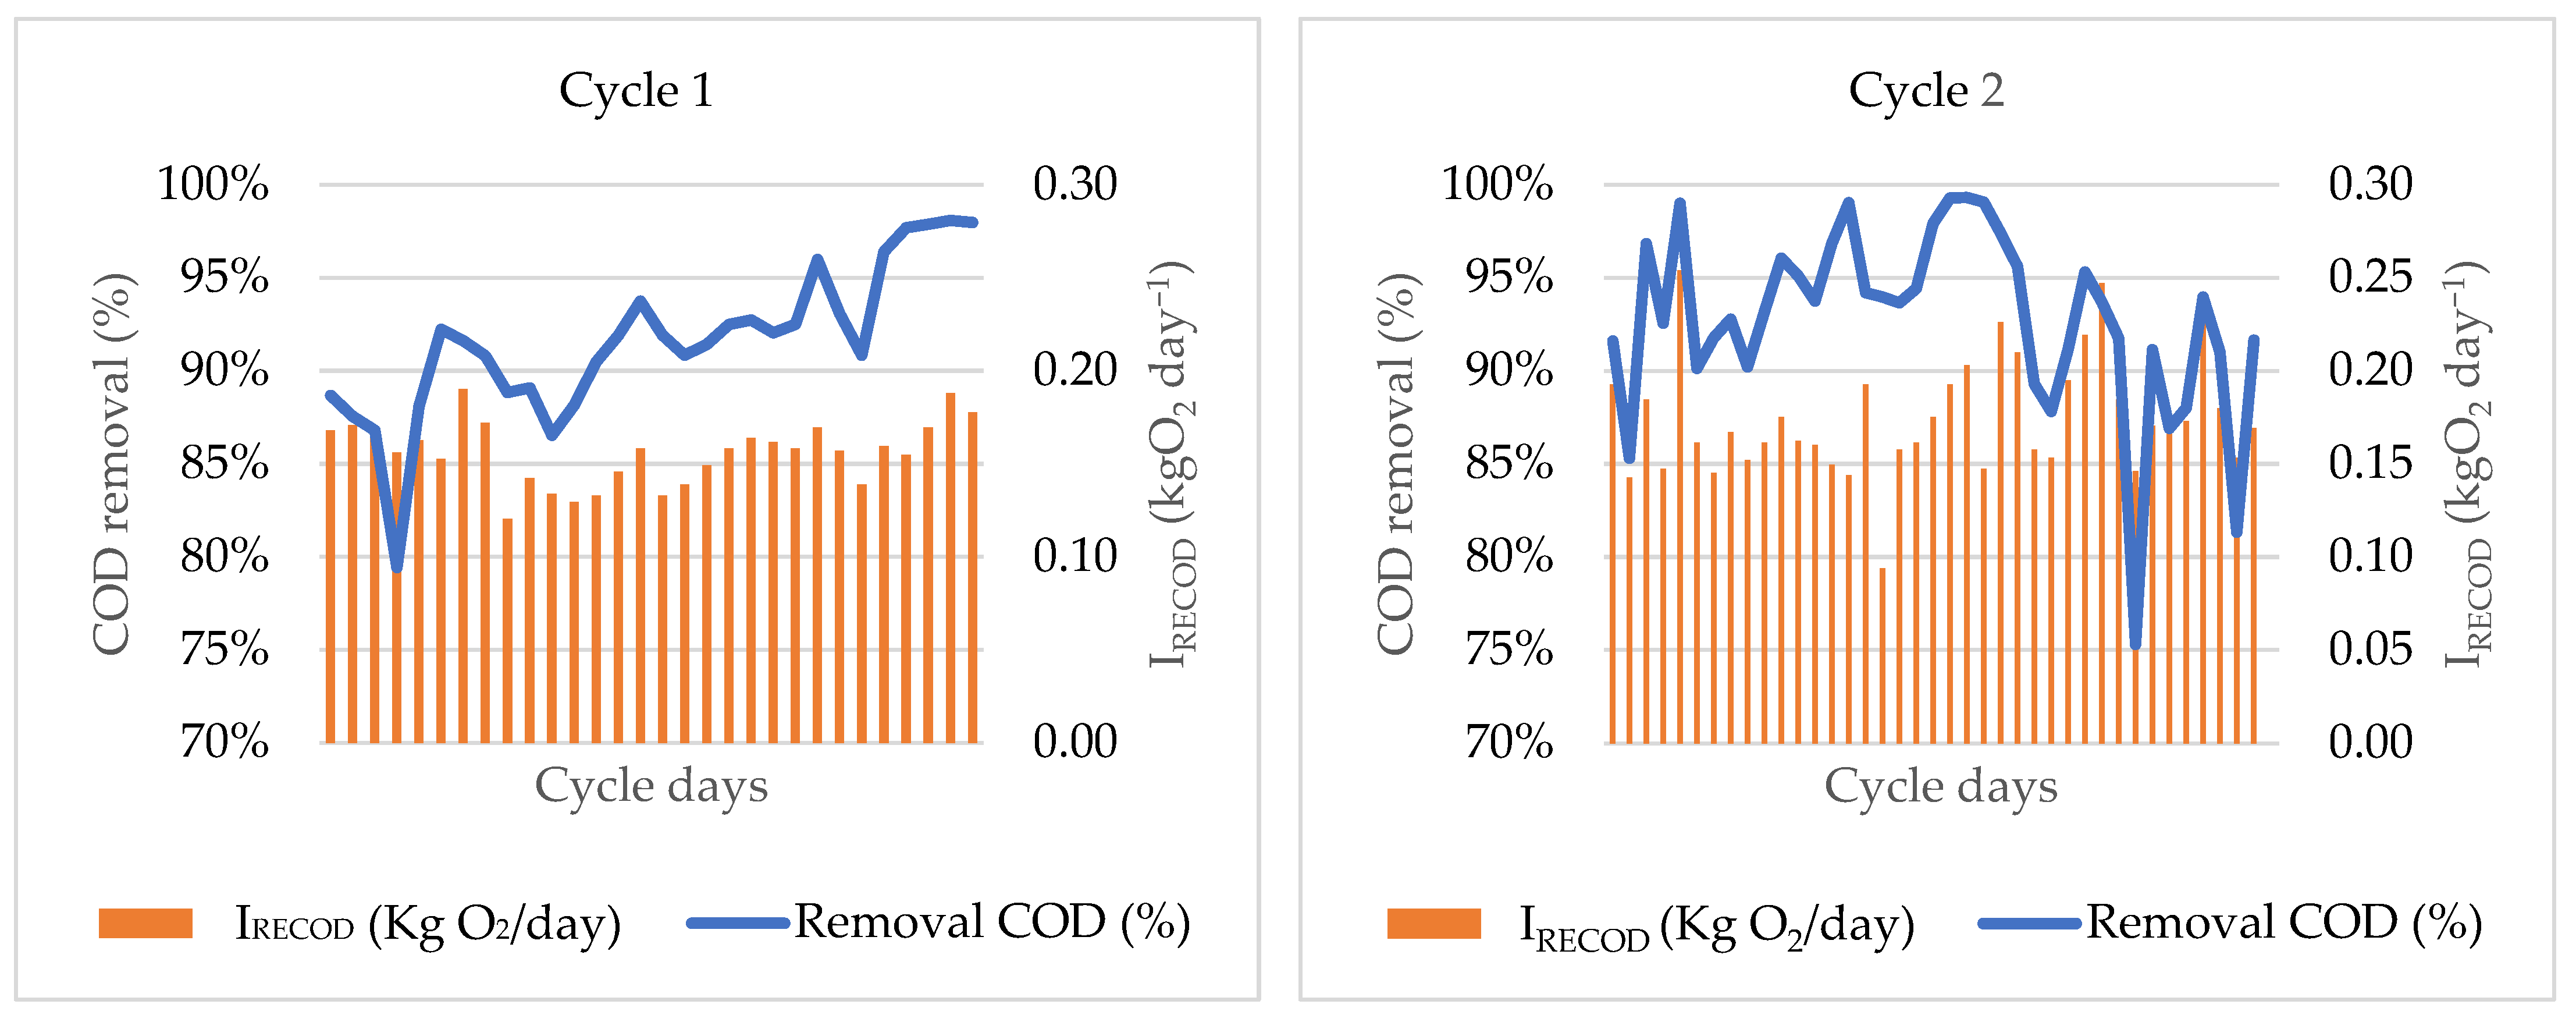
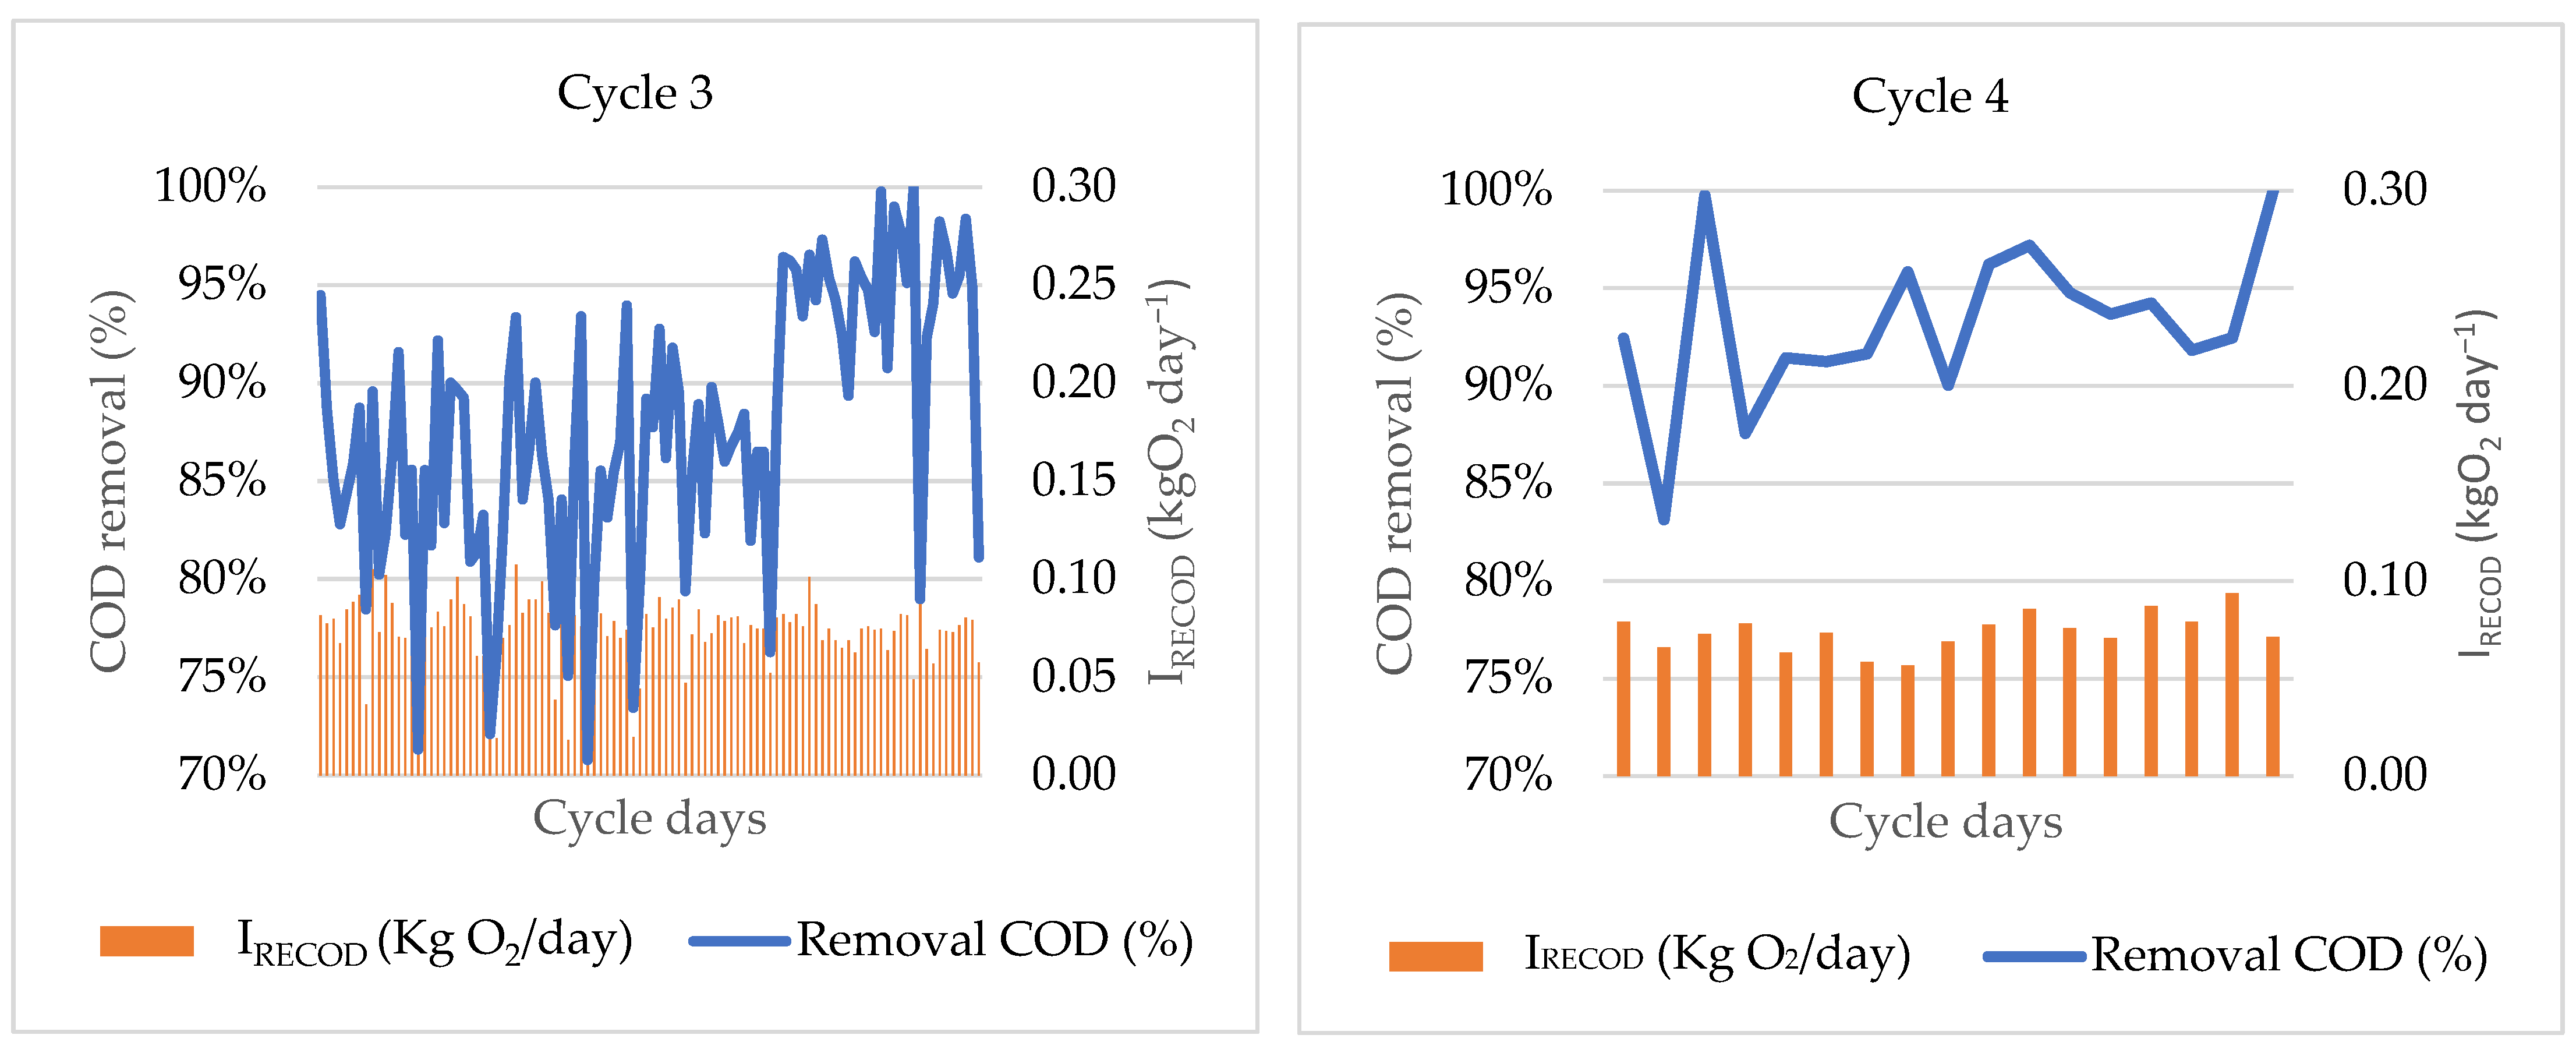
Organic Matter Removal Efficiency Indicator (IRECOD)

In addition to the removal of nutrients, the removal of organic matter is an important indicator for the performance of the WWTP. Although it cannot be considered as an indicator of circularity, it is considered as an indicator of the overall wastewater treatment efficiency of the plant and has, therefore, been included in this section. It is calculated from the following equation [32]:
I RECOD   ( kgO 2 day ) = Q W · ( COD in COD eff ) 10 6
where:
  • Qw: wastewater flow rate (L/day)
  • CODin: chemical oxygen demand concentration in the influent (mg/L)
  • CODeff: chemical oxygen demand concentration in the effluent (mg/L)
This indicator represents the total mass of organic matter removed. The higher this indicator, the more organic matter is removed per day.

Effluent Inorganic Content Indicator (IEIC)

Nutrients such as N and P entering the environment can lead to excessive algal blooms, a phenomenon known as eutrophication, and have a negative impact on water quality, food sources and habitats, as well as reducing the availability of oxygen for aquatic life [33,34]. These nutrients are present in wastewater effluents from WWTPs and are discharged into the environment, thus, altering the natural balance in water ecosystems [35,36], so it is important to control the content of these compounds. As these are nutrients with a high environmental impact, their concentration in water treatment plants is covered by legislation. However, these compounds, as a result of possible water reuse, can be very useful in agriculture.
These indicators show the total load of N (IEIC(N)) and P (IEIC(P)) in the daily effluent of the wastewater treatment plants and are calculated from the following equations [37,38,39]:
I EIC N = N i · Q d
I EIC P = P i · Q d
where:
  • Ni: inorganic nitrogen concentration in the effluent, (mg/L)
  • Pi: inorganic phosphorus concentration in the effluent, (mg/L)
  • Qd: daily average effluent flow, (L/day)

2.5.2. Indicators of Circular Economy for Sludge

Indicator of Technological Nutrient Performance for Recovered Sludge (ISG,R)

This indicator is defined to obtain information on the amount of sludge recovered during the wastewater treatment process as a function of the treated water flow rate from the membrane bioreactor sludge purge [40]. It can be estimated from the following equation:
I SG , R = m SG , R Q eff
where:
  • mSG,R: sludge flow rate recovered during the water treatment process (kg/day)
  • Qeff: effluent flow (L/day)

Indicator of the Amount of Sludge Recovered as a Function of Sludge Produced (ISG,%R)

This indicator is defined to estimate the percentage of final biostabilised sludge recovered in relation to the total amount of sludge generated during the purification process [40]. It is calculated from the following equation:
I SG , % R   ( % ) = m SG , R m SG , T · 100
where:
  • mSG,R: sludge flow rate recovered during the water treatment process (kg/day)
  • mSG,T: sludge flow rate produced during the water treatment process (kg/day)

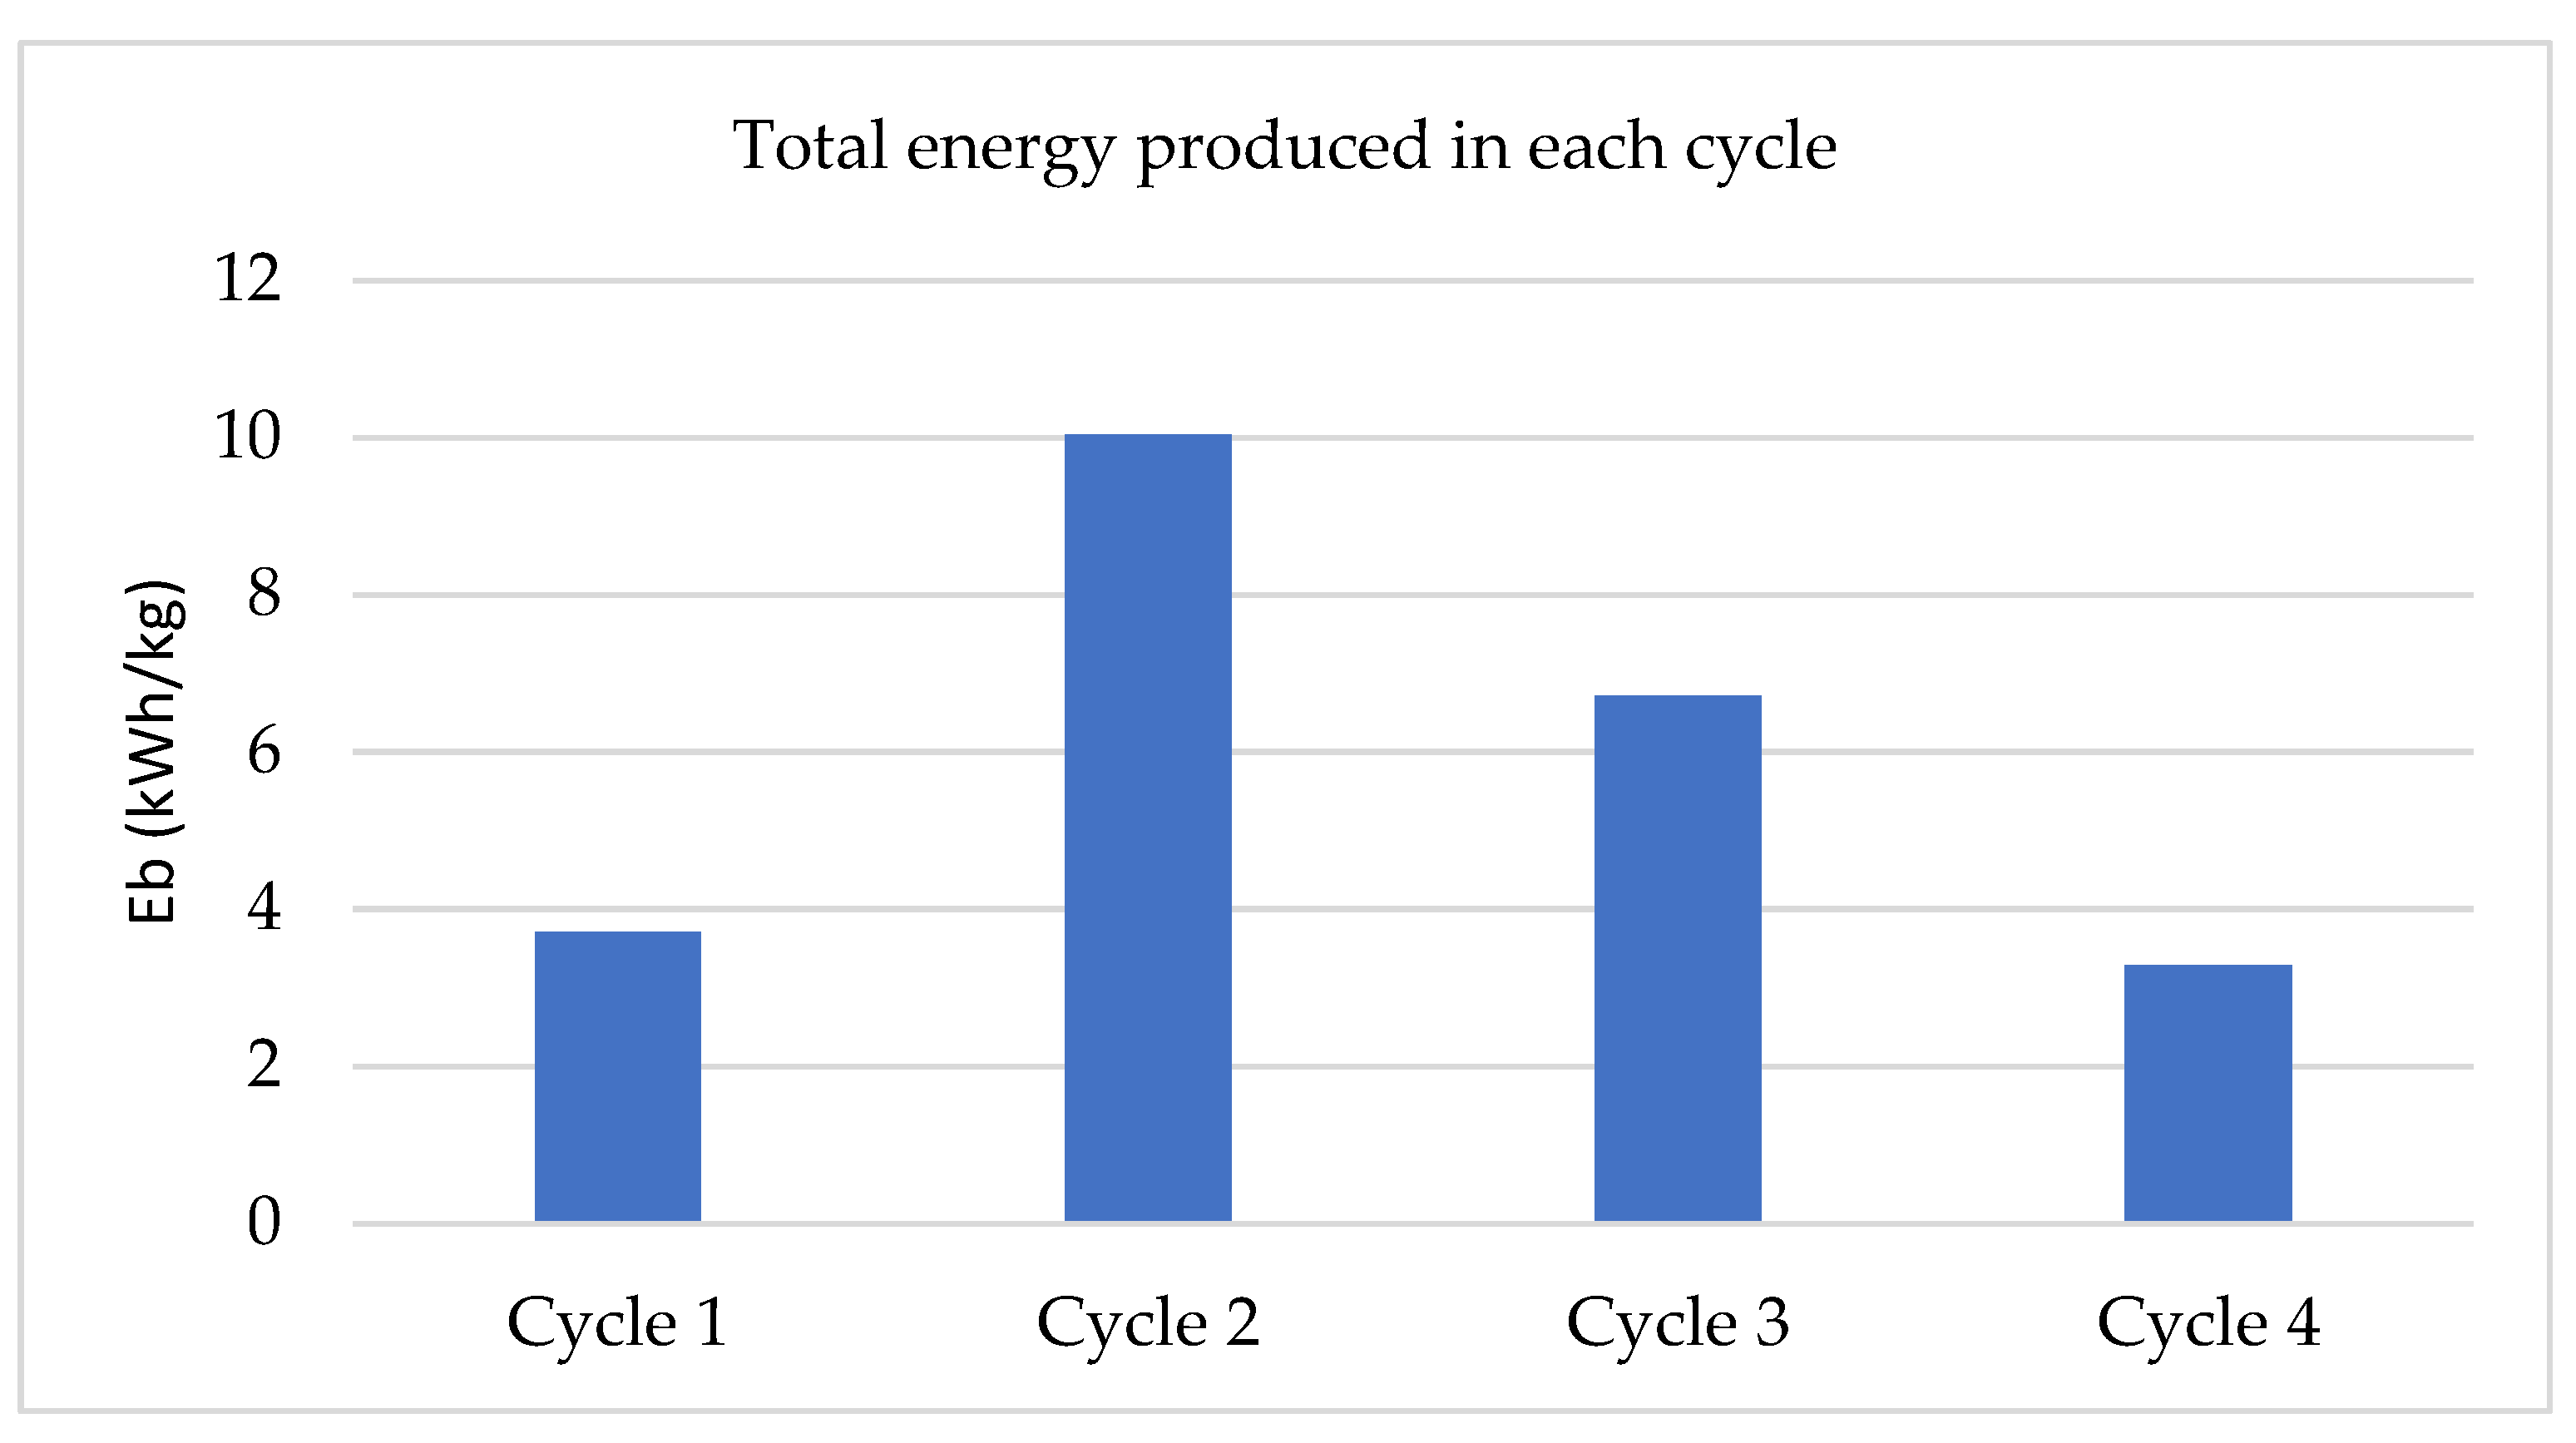
2.5.3. Indicator of Circular Economy for Biogas Produced

Indicator of Efficiency of Biogas Transformation into Electric Energy

Biogas can be used to produce electricity, which is then used in internal combustion engines. Each m3 of biogas produces approximately 6.5 kWh of energy and the efficiency of transformation of biogas into electricity is estimated at 35.0% [41]. From the indicator proposed by these authors, adapting it to the conditions of the plant, it is possible to estimate the energy obtained from the biogas produced:
E b ( kWh day ) = 6.5 · Q b · 0.35
where:
  • Eb: energy obtained from biogas
  • Qb: volumetric flow of biogas obtained by the anaerobic digestion

3. Results and Discussion

In order to establish whether the water treated in this study is suitable for agricultural use and the different uses included in normative, current European legislation establishes the parameters that must be met, as well as the specific legislation in Spain, where the pilot plant is located. Samples of influent, effluent, biological reactor and purged sludge were collected and analysed in the pilot plant. The permeate from the thickening process of the purged sludge was also analysed. During the digestion process, samples were also collected periodically for analysis, as well as samples of supernatant from the thickening sludge centrifugation.

3.1. Characterisation of the Operating Cycles

For all operating cycles, the measured parameters for influent, effluent and bioreactor of the water line of the system are listed in Table 2.
Table 2 shows the sludge line, which operates in discontinuous operation and is also shown in Table 3.

3.2. Water Pollution Removal

The BOD5 and COD removal performance of the pilot plant in the different operating cycles is shown in Table 4.
From the point of view of the reuse of treated water, the values of total suspended solids comply even with the most restrictive legislation, which limits the quantity to 10 mg/L for the best quality of reclaimed water that can be used, the results obtained being much lower than this parameter (Directive 91/271/EEC, Regulation (EU) 2020/741 on minimum requirements for water reuse). In another option, limits are also established for total suspended solids of ≤35 mg/L O2 and a removal rate of 90.0%, which are amply met by the treated water in this study.
In addition, the minimum discharge concentrations and removal rates to be met for BOD5 (70.0–90.0% and ≤25 mg/L O2) and COD (75.0% and ≤125 mg/L O2) are also limited. These plant performance requirements are amply met by the pilot plant, with removal rates of more than 95.0% in the case of BOD5 and more than 85.0% in the case of COD. Other studies show similar removal rates, thus, presenting MBR as a promising technology for wastewater treatment [26,42,43,44].
Moreover, samples of influent and effluent from the pilot plant were analysed to check the amount of total nitrogen and phosphorus and to analyse whether these nutrients are removed in the different operating cycles. The plant does not eliminate these nutrients because there is no anoxic zone and anaerobic zone. This is due to the fact that the plant technology used in this research is designed so that there is no elimination of nitrogen or phosphorus and that the treated water contains these nutrients, thus, making a positive contribution to the receiving environment in agriculture.
Although colour analysis is not included in legislation as a determining parameter in the use of treated water for agricultural use, it can be considered a quality parameter and was, therefore, monitored. The results of the colour measurements at different wavelengths for the samples after the AOP test indicate improvements for effluents always higher than 77% of the initial colour, reaching 100% in some cases. In the case of the permeate coming from the thickening of the sludge, the improvement in colour was possible in approximately 45% of the initial colour in the most favourable case, as well as in the supernatant coming from the centrifugation where the elimination of colour was only possible, approximately, in 40% in the most remarkable case. The results obtained for the indicator of biological dephosphatation potential (IBDP) were 34.8 (cycle 1), 27.8 (cycle 2), 125.6 (cycle 3) and 30.8 (cycle 4). According to these results, in the case of cycle 3, it would be appropriate to apply a physical–chemical treatment, in addition to the biological treatment in the purification process.

3.3. Biogas Production during Anaerobic Digestion

The production of biogas is carried out during the anaerobic digestion step from the digestion of the organic matter. The microorganisms metabolise carbon in an oxygen-deprived environment, i.e., in an anaerobic form [41,45]. An indirect calculation was made to estimate the volumetric flow rate of biogas produced from stoichiometric calculations and COD removal during the digestion process. Table 5 shows the maximum daily value of biogas produced per litre of activated sludge during the digestion cycles, as well as the total amount of biogas produced during the total digestion process (28 days).
The maximum daily CH4 production occurs in cycle 2, being of the order of 677.8% higher than the maximum daily production recorded in cycle 3. This is due to the fact that in cycle 2, the SRT is much lower than in cycle 3, which means that in cycle 2, the microorganisms have more biodegradable matter available and their consumption rate is much higher than that of sludge with a longer cell retention time, which is more stabilized (Table 1). Furthermore, there is more substrate for anaerobic digestion in cycle 2 (Table 1), which means a higher methane production.
As for cycles 3 and 4, which have the lowest daily production rates and work at the same HRT, the maximum daily production rate occurs in cycle 3, as well as a higher total methane production, although cycle 3 has the highest SRT. This higher production is favoured by a higher concentration of MLSS compared to cycle 4. Comparing cycle 3 and 4 with cycle 1, the biocommunity structure is mainly affected by the SRT value and the daily maximum occurs in cycle 1. However, the total methane production is lower than in cycle 3 as a more adapted aerobic biocommunity does not imply that the sludge from which it originates has a higher biogas potential under anaerobic conditions. This may be due to the higher HRT of cycle 3, which indicates that the microorganisms are more adapted to the environment, thus, favouring digestion and, consequently, a higher final total methane production.
These results are similar to another study conducted at lower temperature, indicating that the rate of methane production was low for what was expected during digestion [46]. For another study carried out on a larger pilot scale and with a 24-day cycle at 35 °C digestion temperature, the elimination results were also lower than expected [47]. This low methane production may be due to the scale up of the anaerobic digester, which may have significantly influenced the biological digestion process by inhibiting the process to a minimum.

3.4. Turbidity and E.coli Measurements

The results of the influent and effluent turbidity test and the effluent E. coli tests are shown in Table 6.
In all cycles, the results for the detection of intestinal nematodes were negative; no intestinal nematodes were detected according to Directive 91/271/EEC, Regulation (EU) 2020/741 on minimum requirements for water reuse.
According to Royal Decree 1620/2007, the effluent complies with the quality criteria for the reuse of water for services (irrigation of green areas, fire-fighting system, …). In the case of cycles 1, 2 and 3, the water is suitable for crop irrigation (Annex I.A, quality 2.1, quality 2.2 and quality 2.3), allowing direct contact of the reclaimed water with edible parts for human consumption. In the case of cycle 4, the turbidity value is very close to the established limit of 10 NTU, but does not meet the required quality value; however, it is suitable for agricultural use (Annex I.A, quality 2.2 and quality 2.3) without direct contact of the reclaimed water with the edible parts of the irrigated food, aquaculture, as well as for irrigation of pastures for the consumption of milk or meat-producing animals. However, for the case of European legislation (Directive 91/271/EEC, Regulation (EU) 2020/741 on minimum requirements for water reuse), this reclaimed water would comply with quality value A (Annex I, Table 1 and Table 2), the most restrictive one that allows direct food irrigation, in cycle 1, resulting in the rest of the cycles with a quality B because their turbidity values are higher than 5 NTU, which establishes that it can be used for irrigation without the food being in direct contact with the water. The membranes used in the present study were 5 years old, which explains the turbidity values above the expected levels as the integrity of the membranes could be affected by use. These membranes were used in a previous study with lower turbidity results (<1 NTU) [48].

3.5. Indicators of Circular Economy

3.5.1. Indicators of Circular Economy for Water

Table 7 shows the values of three of the circular economy indicators assessed for water in the four operating cycles.
The percentage of water recovered during the treatment process indicated by the IW,R indicator is very good. Practically all the influent is recovered and suitable for reuse. This percentage is much higher than that of other authors where they recover 47.0% [45] and around 85% obtained for industrial waters [40]. With regard to the indicators, the inorganic content of the effluent is an added value for water reuse in agriculture due to its nutrient load.
Figure 2 shows the temporal evolution of the circular economy indicator IRECOD (organic matter removal efficiency indicator).
This circular economy indicator is linked to legislation, as it indirectly represents the COD evolution parameter. As can be seen in Figure 2, the disposal percentages, although they vary, are always within the percentages accepted by legislation. The elimination of organic matter in kg O2 per day represented in the columns shows the temporal evolution during the operation of the cycle. For cycles 3 and 4 it is less than 0.10, while for cycles 1 and 2 it is above 0.10. This difference in relation to the organic matter removal efficiency is mainly due to the higher HRT used in cycles 3 and 4. A higher HRT results in lower volumetric feed rate, therefore less organic matter is removed, i.e., the performance is higher but the removal rate of kg BOD5/day is lower. The efficiencies are similar in all cycles and this indicator allows to discern the behaviour of the system in the different operating cycles.

3.5.2. Indicators of Circular Economy for Sludge

The amount of recovered sludge concentrate has been estimated as a function of the sludge produced in the pilot plant. For the four operating cycles, the value of the ISG,%R indicator was 0.68%. Table 8 shows the amount of sludge produced and the amount recovered.
The sludge recovery percentage, regardless of the quantity produced in the different cycles, was similar. This is due to the fact that the sludge line operates discontinuously, so that the amount of sludge recovered per litre of sludge produced is always similar.
Table 9 shows the amount of sludge per day that is recovered as a function of the influent that is treated in the plant.
Due to the fact that this is a pilot plant, the amount of sludge recovered per day as a function of the treated water flow is a small amount. However, on an industrial scale, this could result in a significant flow of biostabilised sludge, which is potentially reusable in agriculture. Other authors obtain better results in this indicator, obtaining results of production of biostabilised sludge in percentages higher than 4%, although they recover a lower percentage of treated water [40,45].

3.5.3. Indicator of Circular Economy for Biogas

Figure 3 below, shows the total energy production from the biogas produced per kg of sludge in the digestion process:
During the 28-day digestion process, the cycle with the highest potential energy production per litre of digested sludge is cycle 2. This corresponds to the cycle with the highest biogas production (Section 3.3) and is due to the fact that cycle 2 has the highest concentration of MLSS and the lowest HRT. During the digestion cycle, the maximum daily kWh/kg produced in the different cycles was 0.58 kWh/kg (cycle 1), 1.80 kWh/kg (cycle 2), 0.45 kWh/kg (cycle 3) and 0.27 kWh/kg (cycle 4). This value is obtained from the maximum methane produced in one day of the 28 days of sludge digestion.

4. Conclusions

The membrane bioreactor technology used in this pilot-scale study, operating under real environmental conditions and with real urban wastewater, seems to be promising for this purpose. The pilot plant with its high percentages of contamination removal in the water in the four operating cycles studied (BOD5 higher than 96%, COD higher than 87% and TSS higher than 96%), as well as turbidity parameters (lower than 8.12 in cycle 1,2 and 3 and lower than 10.6 in cycle 4) in the effluent and E. coli measurements (lower than 7.13 CFU/100 mL), lower than those established in the regulations, make the plant effluent suitable for use in agriculture, complying with the quality standards specified in the European regulations.
Different circular economy indicators were estimated for the different stages of wastewater treatment, such as water quality indicators, biogas production indicators and circular economy indicators for sludge. The results show promising data on the reuse of treated wastewater, energy production and sludge reuse. This waste, such as the effluent and the water treated in the sludge line, can be reused in agriculture in more than 99.9% of the quantity treated, which means the total integration of this waste as a resource, thus, fulfilling the objective of circular economy. In addition, the biostabilised sludge can be reused and electricity can be obtained from the biogas produced. This is a pilot-scale study, but it can serve as a basis for future full-scale studies to use the entire effluent from wastewater treatment plants for agricultural irrigation.

Author Contributions

Conceptualization, J.M.P.C., M.d.M.M.M. and J.M.P.; methodology, J.M.P.C. and J.M.P.; validation, J.C.L.D., J.M.P. and M.d.M.M.M.; formal analysis, J.M.P., J.M.P.C., J.C.L.D., M.d.M.M.M. and L.A.B.; investigation, J.M.P., J.M.P.C., J.C.L.D., M.d.M.M.M. and L.A.B.; data curation, L.A.B.; writing—original draft preparation, L.A.B.; writing—review and editing, J.M.P., J.M.P.C., J.C.L.D., M.d.M.M.M. and L.A.B.; visualization, L.A.B.; supervision, J.M.P., J.M.P.C., J.C.L.D. and M.d.M.M.M.; project administration, J.M.P.C. All authors have read and agreed to the published version of the manuscript.

Funding

This study was financed by the Spanish Ministry of Science, Innovation and University Project RTI2018-101270-B-I00.

Institutional Review Board Statement

Not applicable.

Informed Consent Statement

Not applicable.

Data Availability Statement

Not applicable.

Conflicts of Interest

The authors declare no conflict of interest. The funders had no role in the design of the study; in the collection, analyses, or interpretation of data; in the writing of the manuscript, or in the decision to publish the results.

References

  1. Duque-Acevedo, M.; Belmonte-Ureña, L.J.; Yakovleva, N.; Camacho-Ferre, F. Analysis of the circular economic production models and their approach in agriculture and agricultural waste biomass management. Int. J. Environ. Res. Public Health 2020, 17, 9549. [Google Scholar] [CrossRef] [PubMed]
  2. Lehmann, C.; Cruz-Jesus, F.; Oliveira, T.; Damásio, B. Leveraging the circular economy: Investment and innovation as drivers. J. Clean. Prod. 2022, 360, 132146. [Google Scholar] [CrossRef]
  3. Connor, R. The United Nations World Water Development Report 2015: Water for a Sustainable World; UNESCO Publishing: Paris, France, 2015; Volume 1. [Google Scholar]
  4. Aznar-Sánchez, J.A.; Belmonte-Ureña, L.J.; Velasco-Muñoz, J.F.; Valera, D.L. Farmers’ profiles and behaviours toward desalinated seawater for irrigation: Insights from South-east Spain. J. Clean. Prod. 2021, 296, 126568. [Google Scholar] [CrossRef]
  5. Bonetta, S.; Pignata, C.; Lorenzi, E.; De Ceglia, M.; Meucci, L.; Bonetta, S.; Gilli, G.; Carraro, E. Detection of pathogenic Campylobacter, E. coli O157:H7 and Salmonella spp. in wastewater by PCR assay. Environ. Sci. Pollut. Res. 2016, 23, 15302–15309. [Google Scholar] [CrossRef]
  6. Farhadkhani, M.; Nikaeen, M.; Hadi, M.; Gholipour, S.; Yadegarfar, G. Campylobacter risk for the consumers of wastewater-irrigated vegetables based on field experiments. Chemosphere 2020, 251, 126408. [Google Scholar] [CrossRef]
  7. Hai, F.I.; Riley, T.; Shawkat, S.; Magram, S.F.; Yamamoto, K. Removal of Pathogens by Membrane Bioreactors: A Review of the Mechanisms, Influencing Factors and Reduction in Chemical Disinfectant Dosing. Water 2014, 6, 3603–3630. [Google Scholar] [CrossRef]
  8. Bonetta, S.; Pignata, C.; Gasparro, E.; Richiardi, L.; Bonetta, S.; Carraro, E. Impact of wastewater treatment plants on microbiological contamination for evaluating the risks of wastewater reuse n.d. Environ. Sci. Eur. 2022, 34, 20. [Google Scholar] [CrossRef]
  9. Judd, S.J. The status of industrial and municipal effluent treatment with membrane bioreactor technology. Chem. Eng. J. 2016, 305, 37–45. [Google Scholar] [CrossRef] [Green Version]
  10. Kundan, S.; Rupam, B.; Dash, R.R. Biological Treatment of Contaminants of Emerging Concern in Wastewater: A Review. J. Hazard. Toxic Radioact. Waste 2022, 26, 4022002. [Google Scholar] [CrossRef]
  11. Antiñolo Bermúdez, L.; Pascual, J.M.; del Mar Muñio Martínez, M.; Manuel, J.; Capilla, P. Effectiveness of Advanced Oxidation Processes in Wastewater Treatment: State of the Art. Water 2021, 13, 2094. [Google Scholar] [CrossRef]
  12. Shahid, M.K.; Kashif, A.; Fuwad, A.; Choi, Y. Current advances in treatment technologies for removal of emerging contaminants from water–A critical review. Coord. Chem. Rev. 2021, 442, 213993. [Google Scholar] [CrossRef]
  13. Asai, M.; Hayashi, T.; Yamamoto, M. Mental Model Analysis of Biogas Energy Perceptions and Policy Reveals Potential Constraints in a Japanese Farm Community. Sustainability 2019, 11, 225. [Google Scholar] [CrossRef] [Green Version]
  14. Martínez Patiño, J.; Hernández Figueroa, M.A.; Picón Núñez, M.; Ireta Moreno, F.; Merced Lozano García, J. Assessing the power quality of internal combustion engines operating with different fuels. Electr. Eng. 2017, 99, 899–905. [Google Scholar] [CrossRef]
  15. Kardung, M.; Cingiz, K.; Costenoble, O.; Delahaye, R.; Heijman, W.; Lovrić, M.; van Leeuwen, M.; M’barek, R.; van Meijl, H.; Piotrowski, S.; et al. Development of the Circular Bioeconomy: Drivers and Indicators. Sustainability 2021, 13, 413. [Google Scholar] [CrossRef]
  16. Qyyum, A.; D’adamo, I.; Sassanelli, C. Biomethane Community: A Research Agenda towards Sustainability. Sustainability 2022, 14, 4735. [Google Scholar] [CrossRef]
  17. Ahmad, T.; Ahmad, K.; Alam, M. Sludge quantification at water treatment plant and its management scenario. Environ. Monit. Assess. 2017, 189, 453. [Google Scholar] [CrossRef]
  18. Kacprzak, M.; Neczaj, E.; Fijałkowski, K.; Grobelak, A.; Grosser, A.; Worwag, M.; Rorat, A.; Brattebo, H.; Almås, Å.; Singh, B.R. Sewage sludge disposal strategies for sustainable development. Environ. Res. 2017, 156, 39–46. [Google Scholar] [CrossRef]
  19. Nguyen, M.D.; Thomas, M.; Surapaneni, A.; Moon, E.M.; Milne, N.A. Beneficial reuse of water treatment sludge in the context of circular economy. Environ. Technol. Innov. 2022, 28, 102651. [Google Scholar] [CrossRef]
  20. Fijalkowski, K.; Rorat, A.; Grobelak, A.; Kacprzak, M.J. The presence of contaminations in sewage sludge–The current situation. J. Environ. Manag. 2017, 203, 1126–1136. [Google Scholar] [CrossRef]
  21. Gherghel, A.; Teodosiu, C.; de Gisi, S. A review on wastewater sludge valorisation and its challenges in the context of circular economy. J. Clean. Prod. 2019, 228, 244–263. [Google Scholar] [CrossRef]
  22. Preisner, M.; Smol, M.; Horttanainen, M.; Deviatkin, I.; Havukainen, J.; Klavins, M.; Ozola-Davidane, R.; Kruopienė, J.; Szatkowska, B.; Appels, L.; et al. Indicators for resource recovery monitoring within the circular economy model implementation in the wastewater sector. J. Environ. Manag. 2022, 304, 114261. [Google Scholar] [CrossRef] [PubMed]
  23. Andrade, E.P.; Bonmati, A.; Esteller, L.J.; Brunn, S.; Jensen, L.S.; Meers, E.; Anton, A. Selection and application of agri-environmental indicators to assess potential technologies for nutrient recovery in agriculture. Ecol. Indic. 2022, 134, 108471. [Google Scholar] [CrossRef]
  24. Metcalf, L.; Eddy, H.P.; Tchobanoglous, G. Wastewater Energy: Treatment and Reuse; McGraw-Hill: New York, NY, USA, 2004; pp. 42–48. [Google Scholar]
  25. American Public Health Association; American Water Works Association; Water Environment Federation. Standar Methods for Examination of Water and Wastewater, 22nd ed.; American Public Health Association: Washington, DC, USA; American Water Works Association: Denver, CO, USA; Water Environment Federation: Wythe, VA, USA, 2022. [Google Scholar]
  26. Monteoliva-García, A.; Martín-Pascual, J.; Muñío, M.; Poyatos, J. Removal of carbamazepine, ciprofloxacin and ibuprofen in real urban wastewater by using light-driven advanced oxidation processes. Int. J. Environ. Sci. Technol. 2019, 16, 6005–6018. [Google Scholar] [CrossRef]
  27. Ibáñez, M.; Gracia-Lor, E.; Bijlsma, L.; Morales, E.; Pastor, L.; Hernández, F. Removal of emerging contaminants in sewage water subjected to advanced oxidation with ozone. J. Hazard. Mater. 2013, 260, 389–398. [Google Scholar] [CrossRef] [PubMed]
  28. Lu, Q.; de Toledo, R.A.; Shim, H. Effect of COD/TP ratio on biological nutrient removal in A2O and SBR processes coupled with microfiltration and effluent reuse potential. Environ. Technol. 2016, 37, 1461–1466. [Google Scholar] [CrossRef]
  29. Meena, R.A.A.; Kannah, R.Y.; Sindhu, J.; Ragavi, J.; Kumar, G.; Gunasekaran, M.; Banu, J.R. Trends and resource recovery in biological wastewater treatment system. Bioresour. Technol. Rep. 2019, 7, 100235. [Google Scholar] [CrossRef]
  30. Aboulhassan, M.A.; Souabi, S.; Yaacoubi, A.; Baudu, M. Removal of surfactant from industrial wastewaters by coagulation flocculation process. Int. J. Environ. Sci. Technol. 2006, 3, 327–332. [Google Scholar] [CrossRef] [Green Version]
  31. Sikosana, M.K.L.N.; Randall, D.G.; von Blottnitz, H. A technological and economic exploration of phosphate recovery from centralised sewage treatment in a transitioning economy context. Water SA 2017, 43, 343–353. [Google Scholar] [CrossRef] [Green Version]
  32. Yan, P.; Qin, R.C.; Guo, J.S.; Yu, Q.; Li, Z.; Chen, Y.P.; Shen, Y.; Fang, F. Net-zero-energy model for sustainable wastewater treatment. Environ. Sci. Technol. 2017, 51, 1017–1023. [Google Scholar] [CrossRef]
  33. Fenech, C.; Rock, L.; Nolan, K.; Tobin, J.; Morrissey, A. The potential for a suite of isotope and chemical markers to differentiate sources of nitrate contamination: A review. Water Res. 2012, 46, 2023–2041. [Google Scholar] [CrossRef]
  34. Cao, M.; Hu, A.; Gad, M.; Adyari, B.; Qin, D.; Zhang, L.; Sun, Q.; Yu, C.P. Domestic wastewater causes nitrate pollution in an agricultural watershed, China. Sci. Total Environ. 2022, 823, 153680. [Google Scholar] [CrossRef] [PubMed]
  35. Zaragüeta, M.; Acebes, P. Controlling Eutrophication in A Mediterranean Shallow Reservoir by Phosphorus Loading Reduction: The Need for an Integrated Management Approach. Environ. Manag. 2017, 59, 635–651. [Google Scholar] [CrossRef] [PubMed]
  36. Zhang, Y.; Song, C.; Ji, L.; Liu, Y.; Xiao, J.; Cao, X.; Zhou, Y. Cause and effect of N/P ratio decline with eutrophication aggravation in shallow lakes. Sci. Total Environ. 2018, 627, 1294–1302. [Google Scholar] [CrossRef] [PubMed]
  37. Preisner, M.; Neverova-Dziopak, E.; Kowalewski, Z. Analysis of eutrophication potential of municipal wastewater. Water Sci. Technol. 2020, 81, 1994–2003. [Google Scholar] [CrossRef]
  38. Li, B.; Brett, M.T. The relationship between operational and bioavailable phosphorus fractions in effluents from advanced nutrient removal systems. Int. J. Environ. Sci. Technol. 2015, 12, 3317–3328. [Google Scholar] [CrossRef] [Green Version]
  39. Li, B.; Brett, M.T. The impact of alum based advanced nutrient removal processes on phosphorus bioavailability. Water Res. 2012, 46, 837–844. [Google Scholar] [CrossRef]
  40. Molina-Sánchez, E.; Leyva-Díaz, J.C.; Cortés-García, F.J.; Molina-Moreno, V. Proposal of Sustainability Indicators for the Waste Management from the Paper Industry within the Circular Economy Model. Water 2018, 10, 1014. [Google Scholar] [CrossRef] [Green Version]
  41. Salguero-Puerta, L.; Leyva-Díaz, J.C.; Cortés-García, F.J.; Molina-Moreno, V. Sustainability Indicators Concerning Waste Management for Implementation of the Circular Economy Model on the University of Lome (Togo) Campus. Int. J. Environ. Res. Public Health 2019, 16, 2234. [Google Scholar] [CrossRef] [Green Version]
  42. Do, K.U.; Chu, X.Q. Performances of membrane bioreactor technology for treating domestic wastewater operated at different sludge retention time. In Development in Wastewater Treatment Research and Processes: Removal of Emerging Contaminants from Wastewater through Bio-Nanotechnology; Elsevier: Amsterdam, The Netherlands, 2022; pp. 107–122. [Google Scholar] [CrossRef]
  43. Monteoliva-García, A.; Martín-Pascual, J.J.; Muñío, M.M.; Poyatos, J.M. Removal of a Pharmaceutical Mix from Urban Wastewater Coupling Membrane Bioreactor with Advanced Oxidation Processes. J. Environ. Eng. 2019, 145, 04019055. [Google Scholar] [CrossRef]
  44. Calero-Díaz, G.; Monteoliva-García, A.; Leyva-Díaz, J.C.; López-López, C.; Martín-Pascual, J.; Torres, J.C.; Poyatos, J.M. Impact of ciprofloxacin, carbamazepine and ibuprofen on a membrane bioreactor system: Kinetic study and biodegradation capacity. J. Chem. Technol. Biotechnol. 2017, 92, 2944–2951. [Google Scholar] [CrossRef]
  45. Molina-Moreno, V.; Leyva-Díaz, J.C.; Llorens-Montes, F.J.; Cortés-García, F.J. Design of Indicators of Circular Economy as Instruments for the Evaluation of Sustainability and Efficiency in Wastewater from Pig Farming Industry. Water 2017, 9, 653. [Google Scholar] [CrossRef]
  46. Zhang, L.; De Vrieze, J.; Hendrickx, T.L.; Wei, W.; Temmink, H.; Rijnaarts, H.; Zeeman, G. Anaerobic treatment of raw domestic wastewater in a UASB-digester at 10 °C and microbial community dynamics. Chem. Eng. J. 2018, 334, 2088–2097. [Google Scholar] [CrossRef]
  47. Maragkaki, A.E.; Fountoulakis, M.; Gypakis, A.; Kyriakou, A.; Lasaridi, K.; Manios, T. Pilot-scale anaerobic co-digestion of sewage sludge with agro-industrial by-products for increased biogas production of existing digesters at wastewater treatment plants. Waste Manag. 2017, 59, 362–370. [Google Scholar] [CrossRef] [PubMed]
  48. Monteoliva-García, A.; Martín-Pascual, J.; Muñío, M.M.; Poyatos, J.M. Effects of carrier addition on water quality and pharmaceutical removal capacity of a membrane bioreactor–Advanced oxidation process combined treatment. Sci. Total Environ. 2020, 708, 135104. [Google Scholar] [CrossRef] [PubMed]
Figure 1. Diagram of the pilot plant of MBR for municipal wastewater treatment.
Agronomy 12 01877 g001
Figure 2. Organic matter removal efficiency indicator (IRECOD) for operational cycles.
Agronomy 12 01877 g002aAgronomy 12 01877 g002b
Figure 3. Energy produced by a kg of sludge during digestion.
Agronomy 12 01877 g003
Table 1. Operation conditions of hydraulic retention time (HRT), mixed liquor suspended solids (MLSS), temperature and solids retention time (SRT) in each cycle for steady state.
CycleDuration (day)HRT (h)MLSS (mg L−1)Temperature (°C)SRT (day)
14064919 ± 112420.8 ± 1.622.3
22366696 ± 247220.2 ± 2.910.7
3164124771 ± 1436 12.6 ± 2.838.5
458122429 ± 76820.1 ± 1.436.5
Table 2. Physicochemical parameters for influent and effluent (TSS, conductivity, pH, BOD5 and COD) and bioreactor (TSS, conductivity and pH).
CycleTSS (mg/L)Conductivity (µS/cm)pHBOD5 (mgO2/L)COD (mgO2/L)
Influent
1106 ± 17 1157.2 ± 135.77.9 ± 0.2292 ± 45496 ± 52
2116 ± 401184.3 ± 219.67.8 ± 0.3277 ± 56541 ± 92
3108 ± 231106.2 ± 215.48.1 ± 0.1256 ± 63484 ± 110
4171 ± 851114.6 ± 153.27.6 ± 0.1271 ± 24462 ± 61
Effluent
13 ± 2871.4 ± 68.87.4 ± 0.49 ± 742 ± 22
23 ± 2862.8 ± 142.57.9 ± 0.35 ± 637 ± 27
33 ± 3834.0 ± 134.97.0 ± 0.97 ± 957 ± 31
43 ± 2787.9 ± 33.67.2 ± 0.37 ± 532 ± 20
Bioreactor
14919 ± 1124894.9 ± 95.27.4 ± 0.4--
26696 ± 2472859.5 ± 117.27.7 ± 0.3--
34771 ± 1436802.3 ± 144.87.0 ± 0.7--
42429 ± 768784.9 ± 27.56.6 ± 0.6--
Table 3. Anaerobic digester parameters (conductivity, pH, alkalinity and volatile fatty acids).
Anaerobic Digester
CycleConductivity (µS/cm)pHTotal Alkalinity (mg/L CaCO3)Volatile Fatty
Acids (mg/L CaCO3)
11784.2 ± 561.37.5 ± 0.1612.5 ± 213.535.4 ± 15.6
22278.3 ± 619.67.4 ± 0.1825.6 ± 256.839.5 ± 9.9
32406.2 ± 361.97.0 ± 0.2900.0 ± 228.9127.2 ± 37.2
4974.6 ± 132.87.3 ± 0.2490.6 ± 272.7104.5 ± 95.5
Table 4. Removal efficiencies in the different operating cycles.
CycleBOD5 Removal (%)COD Removal (%)TSS Removal (%)
196.9 ± 2.591.5 ± 4.097.8 ± 1.8
297.9 ± 3.392.8 ± 4.997.1 ± 2.3
397.0 ± 3.487.9 ± 6.896.8 ± 4.3
497.3 ± 1.893.1 ± 4.297.7 ± 2.8
Table 5. Biogas production during activated sludge digestion.
CycleMaximum CH4 Flow Rate
(L biogas Kg−1 sludge day−1)
Total CH4 Volume
(L)
10.2571.633
20.7934.410
30.1982.952
40.1171.447
Table 6. Turbidity and E. coli measurements.
CycleTurbidity (NTU)
Influent
Turbidity (NTU)
Effluent
Microbiological Count
(CFU/100 mL)
1193.36 ± 36.754.13 ± 0.336.91 ± 0.48
2205.34 ± 41.426.26 ± 0.677.13 ± 0.57
3226.87 ± 47.338.12 ± 0.517.06 ± 0.53
4174.37 ± 31.3310.62 ± 0.786.17 ± 0.39
Table 7. Indicator of recovery of water in the treatment process (IW,R) and effluent inorganic content (IEIC(N) and IEIC(P)).
CycleIW,R (%)IEIC(N) (mg/day) IEIC(P) (mg/day)
199.994284.013,640.5
299.982485.711,952.0
399.9912,948.9851.9
499.9916,276.17694.7
Table 8. Accumulated circular economy parameters mSG,R, msg,T and the indicator ISG,CE,r.
CyclemSG,R (kg/day)mSG,T (kg/day)ISG,%R (%)
10.0263.8000.682
20.0547.9800.682
30.0152.2100.682
40.0162.3300.682
Table 9. Indicator of technological nutrient performance for the recovered sludge.
CyclemSG,R (kg/day)Qeff (L/day)ISG,R
10.026343.807.55 × 10−5
20.054347.981.56 × 10−4
30.015172.218.75 × 10−5
40.016172.339.22 × 10−5
Publisher’s Note: MDPI stays neutral with regard to jurisdictional claims in published maps and institutional affiliations.

