Article

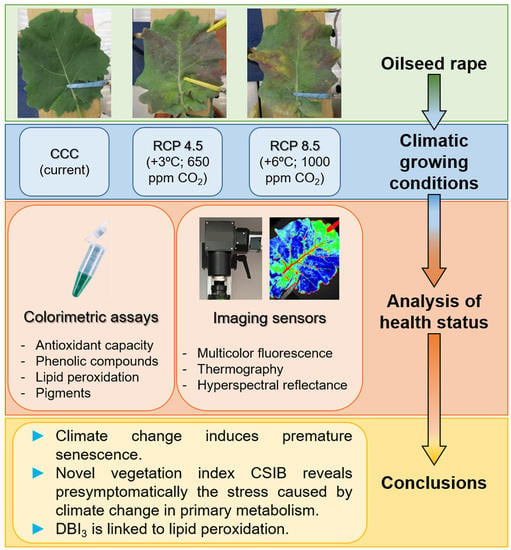
Health Status of Oilseed Rape Plants Grown under Potential Future Climatic Conditions Assessed by Invasive and Non-Invasive Techniques

Department of Biochemistry and Molecular and Cell Biology of Plants, Estación Experimental del Zaidín, Consejo Superior de Investigaciones Científicas (CSIC), 18008 Granada, Spain
*
Author to whom correspondence should be addressed.
Agronomy 2022, 12(8), 1845; https://doi.org/10.3390/agronomy12081845
Submission received: 7 July 2022 / Revised: 29 July 2022 / Accepted: 1 August 2022 / Published: 4 August 2022
(This article belongs to the Special Issue Advances in Plant Physiology of Abiotic Stresses)

Abstract

:
Environmental conditions affect many plant traits such as biochemistry, physiology, morphology, and even their distribution around the world. Human activities have increased greenhouse gas emissions, which will promote a global rise in temperatures. The impact of climate change on natural vegetation and crops is difficult to predict, making it necessary to conduct experiments that mimic potential future climate conditions. Here, oilseed rape has been grown under environmental conditions that reproduce severe and intermediate climate change, setting the current climatic conditions as a control, with the main objective of evaluating the impact of climate change on the health status of this plant of agronomic interest. For such a purpose, two approaches (invasive and non-invasive) have been applied. Invasive quantitative measurements are based on the absorbance of biochemical compounds. Non-invasive methods such as thermal, multicolor fluorescence, and hyperspectral reflectance imaging sensors rely on the spectral properties of the plants. The results revealed that climate change induced lipid peroxidation, as well as alterations in pigment composition, transpiration, photosynthesis, and secondary plant metabolism. Those changes were more drastic the more severe the climatic condition imposed. Novel vegetation indices obtained from hyperspectral reflectance and specifically tailored to detect stress in brassicas correlated with physiological traits such as lipid peroxidation and secondary plant metabolism.

Graphical Abstract

1. Introduction

Oilseed rape (Brassica napus L.) is the main oilseed crop in Europe. It is used as a source of feed for livestock and as oil for human consumption, as well as a source for bio-products such as biodiesel [1]. In addition, recent research points to the possible use of rapeseed in the food industry to produce preparations classified as healthy food, rich in minerals, proteins, fiber, and compounds with anti-neoplastic properties [2]. In the European Union (EU), with 5.17 million hectares of oilseed rape planted in 2020, the most productive countries are Germany and France, with half of the European production, followed by Poland (according to data from DG AGRI EU for the Spanish Ministry of Agriculture, Fishing and Food; www.mapa.gob.es, accessed on 23 June 2022). In Spain, oilseed rape production has increased exponentially in recent years, and it is expected to continue rising in the future. Almost 60% of Spanish oilseed rape is intended for animal feed, whereas there is little tradition to destine the oil for human consumption, in contrast to central Europe. The largest oilseed rape producer in Spain is Castilla y León, with a third of the total harvest. In 2021, 40,568 hectares were planted, yielding 108,428 tons (Consejería de Agricultura, Ganadería y Desarrollo Rural, Junta de Castilla y León; https://gobierno.jcyl.es/web/es/consejerias/consejeria-agricultura-ganaderia-desarrollo-rural.html, accessed on 23 June 2022).
Greenhouse gases responsible for global warming are leading to changes in climate worldwide that would have a major impact on both the ecology of wildlife and agriculture. The direct effects of climate change (increasing CO2 levels; changes in temperature, ultraviolet-B radiation, rainfall, and humidity; extreme events), as well as the indirect ones (shifts in crop suitability, changes in plant nutrition, degradation of resources, and an increase in the incidence of pests), could compromise the yield and quality of food production with serious consequences on our society [3]. The negative effects of climate change were analyzed exhaustively by the Intergovernmental Panel on Climate Change (IPCC) in the Assessment Report (AR5) [4]. This assessment evaluated several potential scenarios for greenhouse gases and air pollutants emissions and their atmospheric concentrations, as well as for land use by 2100. Based on those estimates, future climate conditions were projected on representative concentration pathways (RCPs). According to AR5, a stringent mitigation scenario that keeps global warming below 2 °C is unlikely to occur. In an extreme scenario, RCP 8.5 would represent the effects of not restricting greenhouse gas emissions. However, the climate change scenario most probable to occur under the current governments’ climate change policies is the intermediate scenario RCP 4.5.
Based on the modeling for the RCP 4.5 and RCP 8.5 climate change scenarios, northern Europe would offer the most favorable conditions for oilseed rape growth in the future [5]. Nonetheless, several studies have highlighted the negative effects of abiotic stress factors brought about by climate change on rapeseed crops. Elevated atmospheric CO2 concentrations, high temperatures, drought, and high ultraviolet-B radiations damage photosynthetic structures, thus reducing photosynthesis and affecting crop production and quality of yields [6,7,8]. The combination of elevated CO2, O3, and temperature in oilseed rape simulating several climate change scenarios by 2075 in southern Scandinavia (including RCP 8.5), caused a decrease in plant growth, as well as reductions in oil production and quality, and negative effects on the saturated to unsaturated fatty acids ratio [9,10]. High temperatures of different climate change projections (RCP 4.5 and RCP 8.5 among them) for Poland also caused reductions in linolenic acid contents, one of the fatty acids playing a significant role in the quality of oilseed rape oil [11]. However, more research is required to find out the consequences of future climate conditions on oilseed rape plants grown in southern Europe.
To analyze plant physiology, traditional techniques can be used that provide quantitative data on a parameter of interest and imaging techniques that perform robust estimates of these parameters. Traditional sampling to measure physiological traits based on the absorbance of biochemical compounds, although a powerful and reliable method, is invasive and laborious [12]. That means that it requires a large amount of plant material and time to process. On the other hand, stress causes alterations in tissue color, leaf structure, the transpiration rate, as well as in the way in which plants interact with solar radiation. Thus, stress alters the optical properties of the leaves within different regions of the electromagnetic spectrum, which can be measured by imaging techniques [13,14]. As the relative intensities of optical signals are highly sensitive to intrinsic plant properties, numerous pieces of evidence exist that unequivocally link image measurements with different physiological traits. Blue (F440) and green fluorescence (F520) induced by ultraviolet light and measured by multicolor fluorescence imaging (MCFI) are emitted by phenolic compounds covalently bound to cell walls and involved in plant defense and structure; whereas red fluorescence (F680) and far red fluorescence (F740) are emitted by chlorophylls (Chl). The ratio F680/F740 is inversely correlated to Chl content [15,16]. Thermal imaging visualizes leaf temperature, which is inversely correlated to leaf transpiration [17,18]. The availability of reflectance spectra recorded by hyperspectral cameras allows the calculation of numerous vegetation indexes (VIs) that provide information about many traits of the leaf, such as photosynthesis performance [19], pigment composition [20,21], and fitness [22,23]. Moreover, the acquisition of whole reflectance spectra let researchers design novel VIs to sense the effects of stress in plants [24].
Imaging sensors provide information on plant metabolism in a rapid, non-destructive way, which means that the same leaf or plant could be imaged using different sensors in subsequent days along an experiment [12,25]. Moreover, one of the main advantages of imaging techniques is that they have the ability to scan large populations, enabling high-throughput screening [13,26]. In addition, sensors often provide a presymptomatic diagnosis of stress, i.e., they can detect alterations in plant physiology before symptoms are visible [14]. Nonetheless, invasive and non-invasive methods are not mutually exclusive options, and their combined use often improves the results obtained in studies on plant physiology under stress. Indeed, the body of knowledge obtained through different approaches such as “-omics”, microscopy, biochemistry, metabolic engineering, or computer vision is being successfully incorporated into machine learning algorithms coming from Artificial Intelligence to predict plant growth and development under specific environmental constraints [27,28,29].
The main aim of this work was to assess the consequences of global climate change on the health status of oilseed rape plants cultivated in southern Europe. For this purpose, three climatic conditions were selected: (i) current climate conditions (CCC), (ii) an intermediate climate change scenario (RCP 4.5), and (iii) a projection of extreme climate change (RCP 8.5). The ambient temperatures and the atmospheric CO2 concentrations were selected according to regionalized data for Castilla y León (Spain) by the AEMet (Spanish State Meteorology Agency) for the years 2081–2100. The health status of oilseed rape plants grown under these three climatic conditions was evaluated using invasive colorimetric assays and non-invasive methods (MCFI, thermography, and hyperspectral reflectance imaging). All of these techniques provided information on antioxidant activity, lipid peroxidation, phenolic compounds and pigment contents, leaf temperature, photosynthesis performance, and vigor. In addition, a novel VI specifically designed to detect the stress caused by climate change in oilseed rape plants was developed. Finally, bivariate correlation analyses were performed to elucidate the physiological traits underlying several VIs.

2. Materials and Methods
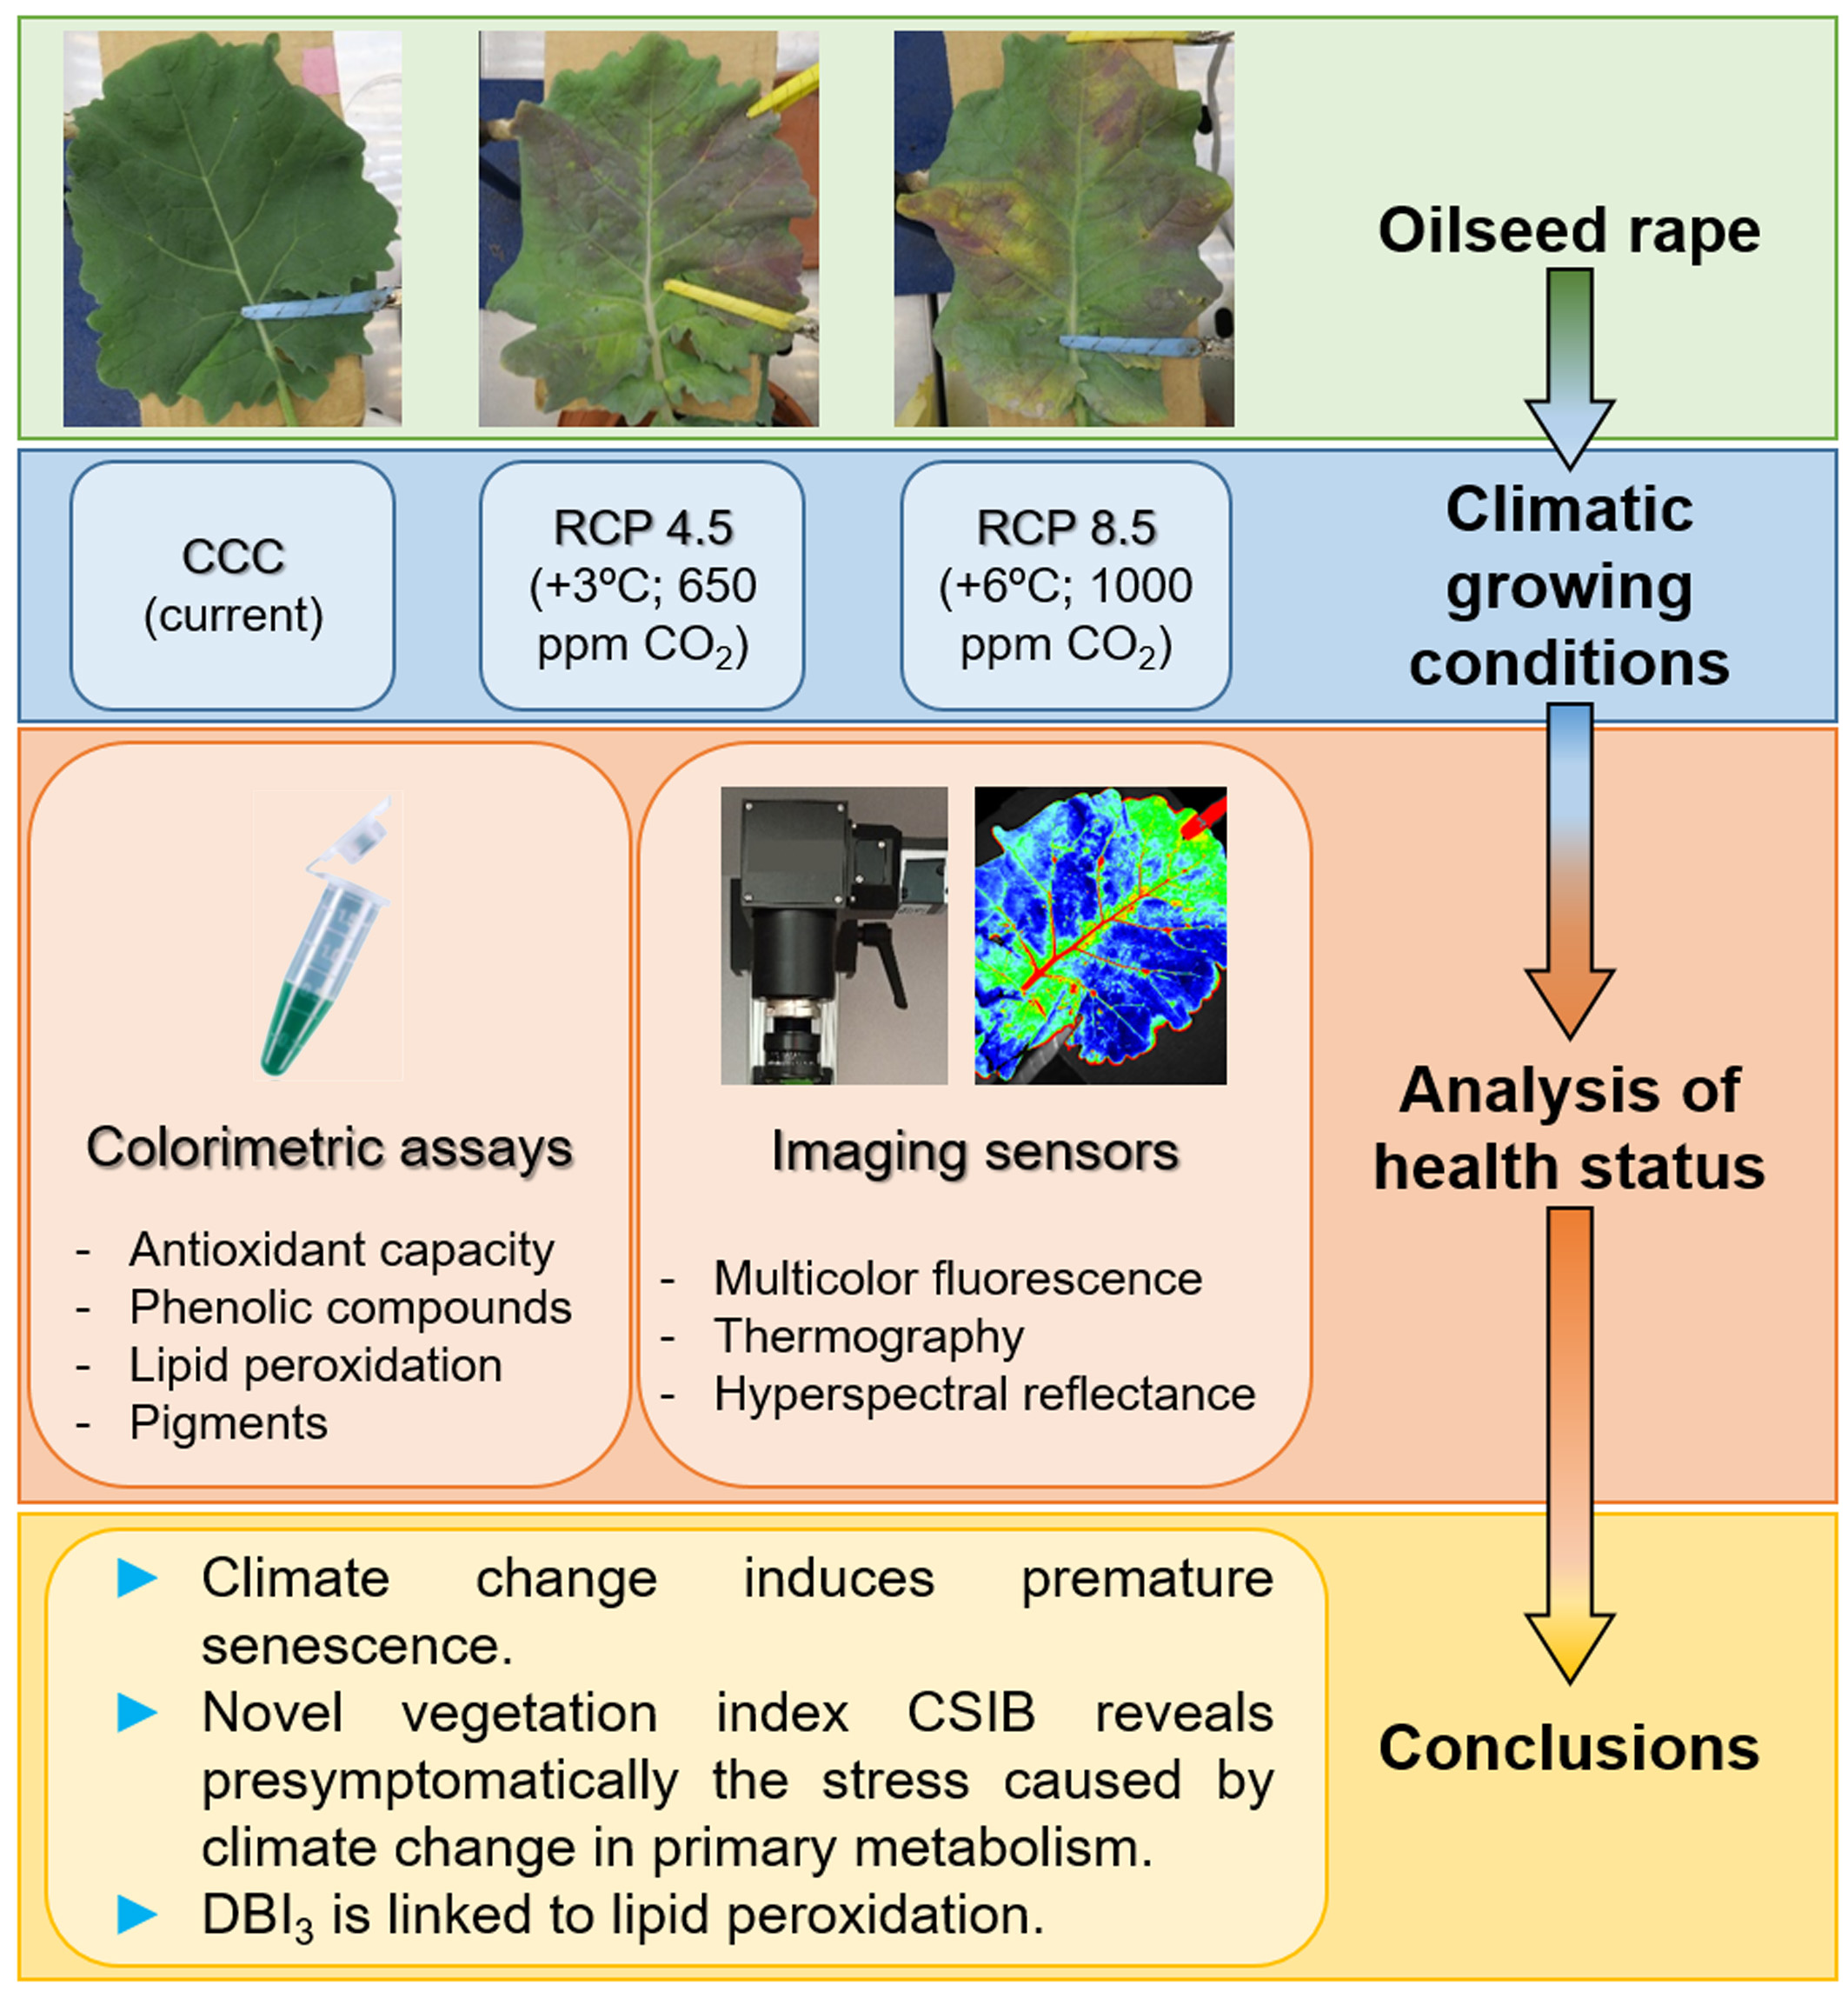
2.1. Plant Growth

Oilseed rape plants (Brassica napus L. var. napobrassica; Franchi Sementi, Grassobbio, Italy) were grown in pots located in a growth chamber in a 16/8 h day/night regime with 60% relative humidity and 200 µmol photon m−2 s−1 of PAR light. Three climatic conditions were selected as treatments (Table 1): CCC, RCP 4.5, and RCP 8.5. CCC was considered the control treatment. For each experiment, the plants were maintained from the moment of sowing in the corresponding treatment. The ambient temperature and CO2 concentration shown in Table 1 were selected according to the data regionalized for Castilla y León by the AEMet for CCC and those matching to RCP 4.5 and RCP 8.5 in years 2081–2100. Day and night temperatures correspond to the average values during the sowing and first stages of the growth season (September). The plants were watered every day and they took water ad libitum.

2.2. Invasive Methods for Determining Plant Health Status

The sampling for conventional techniques based on colorimetric reactions was conducted using 4.15 cm2 leaf disks practiced on leaf number 4 of oilseed rape plants at 28 and 32 days after sowing (das). Six different leaves were sampled for every measurement, das, and treatment. Once collected, the samples were immediately frozen in liquid nitrogen and kept at −80 °C until the moment they were processed. All of the spectrophotometric measurements were carried out using the Shimadzu UV1800 spectrophotometer (Shimadzu Corporation, Tokyo, Japan). All of the chemicals products used were reagent grade.
The method for measuring the total antioxidant activity (TAA) is based on that published by Miller et al. [30] with some modifications. The concentration of the antioxidant substances present in a leaf sample is estimated as the capacity to scavenge the radical cation of 2,2′-azinobis(3-ethylbenzothiazoline-6-sulfonate) (ABTS+) in the aqueous phase, as compared to standard amounts of the antioxidant ascorbic acid. Leaf disks were homogenized in liquid nitrogen, and the antioxidants were extracted in 0.45 mL of 50 mM potassium phosphate pH 7.8 (Merck, Darmstadt, Germany). The ABTS+ radicals were obtained in the spectrophotometer cuvette using 0.995 mL 50 mM glycine (Panreac Quimica, Barcelona, Spain)-hydrochloric acid (VWR International, Radnor, PA, USA) buffer, 10 µL of 10 µM horseradish peroxidase (Sigma-Aldrich, Saint Louis, MO, USA), 10 µL of 2 mM hydrogen peroxide (Sigma-Aldrich) and 25 µL of 10 mM ABTS (Sigma-Aldrich). Once the absorbance at 730 nm reached stable valor (20 s), the samples (or standard ascorbic acid, Sigma-Aldrich) were added to the cuvette, and the reaction of ABTS+ scavenging was followed during 120 s at 730 nm. The results are expressed as TAA by ascorbic acid (Sigma-Aldrich) equivalent and referred to the sampled area (nmol·cm−2).
The determination of the total soluble phenolic compounds by the Folin–Ciocalteu method was performed on the leaf extracts prepared by the homogenization of leaf disks in liquid nitrogen and extraction in 0.5 mL of chloroform (Scharlau, Barcelona, Spain), 0.5 mL of methanol (Panreac), and 0.25 mL of 1% (w/v) sodium chloride (Merck). The extracts were added to a combination of 2% (w/v) sodium carbonate (Merck) in 0.1 N sodium hydroxide (Panreac) and 50% (v/v) Folin–Ciocalteu reagent (Merck). The absorbance was measured at 735 nm using a caffeic acid (Sigma-Aldrich) standard curve. The results are expressed as the content of total phenolics by caffeic acid equivalent and referred to the sampled area (µg·cm−2) [31,32].
Lipid peroxidation was estimated by analyzing malondialdehyde (MDA) content obtained using the thiobarbituric acid reaction according to the method described by Rodríguez-Serrano et al. [33]. Leaf disks were homogenized in liquid nitrogen and extracted in 0.65 mL of 50 mM Tris (Scharlau)-HCl (VWR) pH 7 with 0.2% (v/v) Triton X-100 (Boehringer Mannheim, Mannheim, Germany) and 0.1 mM EDTA (Panreac) buffer. Then, 0.5 mL of the leaf extract were combined with 0.1 mL of a solution of 15% (w/v) trichloroacetic acid (Panreac), 0.375% (w/v) thiobarbituric acid (Sigma-Aldrich), 0.1% (w/v) butylated hydroxytoluene (Sigma-Aldrich), and 0.2 M hydrochloric acid (VWR) and heated at 95 °C for 15 min. The supernatant of the subsequent centrifugation was measured at 535 nm. The MDA concentration was determined using a standard curve with commercial MDA (Sigma-Aldrich), and the results are referred to the sampled area (nmol MDA·cm−2).
The measurements of Chl, carotenoids (Car), and xanthophylls (Xanth) were conducted according to Lichtenthaler and Buschmann [34]. Briefly, the pigments were extracted in 1 mL of 80% (v/v) acetone (Panreac) by homogenization in liquid nitrogen. Absorbance was measured at 470 nm, 647 nm, and 663 nm. Then, the equations provided by the authors were applied to the measured absorbance to calculate the total amount of pigments and referred to the sampled area (µg·cm−2). On the other hand, anthocyanins (Anth) quantification was conducted using the protocol described by Solfanelli et al. [35]. Leaf disks were homogenized in liquid nitrogen, and anthocyanins were extracted in 0.6 mL of methanol (Panreac) in 1% (v/v) hydrochloric acid (VWR) and 0.4 mL of distilled water. Then, the samples were purified in the same volume of chloroform (Scharlau). The aqueous phase was measured at 535 nm.

2.3. Non-Invasive Imaging Techniques for Stress Detection

All of the measurements using non-destructive imaging sensors were acquired over leaf number 4 of oilseed rape plants at 25, 28, and 32 das. The leaf remained attached to the plant until the end of the experiments at 32 das. Twelve leaves per treatment were sequentially imaged using three different sensors.
MCFI was recorded using a customized Open FluorCam FC 800-O (Photon Systems Instruments, Brno, Czechia) vertically positioned 50 cm above the leaves. Autofluorescence leaf emission was excited using a 355 nm ultraviolet lamp. Then, F440, F520, F680, and F740 were each acquired during 30 s and using the appropriate cutoff filters, as described before [31,36]. The entire measurement lasted 2 min. Nine images per fluorescence region were averaged to extract fluorescence values for whole leaves using the FluorCam v. 7.1.0.3 software (Arlington, VA, USA), as well as the fluorescence ratio F680/F740. For a better understanding of the pictures, the software also allows the application of a false color scale to the images captured in black and white. The images presented in the figures correspond to the most representative data.
An FLIR A305sc camera (FLIR Systems, Wilsonville, OR, USA) was used to capture thermal images of the whole leaves as described before [37,38]. The camera was vertically positioned 50 cm above the leaves in the plant growth chamber. For each measurement, 10 thermal images were collected at a rate of one image per second. Then, all of the images were averaged to extract the temperature values for entire leaves using the FLIR ResearchIR v. 3.4 software (Arlington, VA, USA). The parameter TL−TA (leaf temperature corrected by ambient temperature) was calculated for a better comparison between the treatments. To interpret the images captured in black and white, the software also allows the application of a false color scale. The images presented in the figures correspond to the most representative data.
The hyperspectral reflectance of attached leaves was recorded using a Pika L hyperspectral imaging camera (Resonon, Bozeman, MT, USA) in the visible (400–700 nm) to near-infrared spectral range (700–1000 nm), according to Pineda et al. [24]. Prior to the leaf measurements, dark and light corrections were carried out. The dark correction was performed in darkness; then, the light correction was performed by illuminating a white homogenous calibration tile provided by Resonon with four calibrated xenon lamps with a homogeneous light intensity between 400 and 1000 nm. Finally, the leaves were placed on a translation stage while they were homogeneously illuminated, and the camera took the images vertically positioned 50 cm over the sample. Spectronon v. 2.134 (Resonon) software was used for dark and light corrections, build-up of 281 images-datacubes, and measurement analysis. The reflectance spectra averaged for whole leaves were obtained and used to calculate VIs summarized in Table 2, as well as to design novel VIs specific for abiotic stress detection.

2.4. Statistics

Microsoft Office Excel 2016 (Microsoft Corporation, Redmond, WA, USA) was used to create the databases and plot the figure graphs (averages ± standard errors). Boxplots were performed to discard outliers in the sample distributions. Later, SigmaPlot v. 14.5 (Systat Software Inc., San José, CA, USA) was chosen for statistical analysis. The sample distributions passed both the Shapiro–Wilk normality test and Brown–Forsythe equal variance test. Then, a two-tailed Student t-test could be used to compare treatments at every das assayed. Differences were considered significant at p < 0.05 and were indicated by different lowercase letters in the bar graphs. When comparing reflectance spectra, differences were considered significant at p < 0.001. Bivariate correlations were developed using SPSS v. 28.0 software (IBM Corporation, Armonk, NY, USA); the Pearson correlation coefficient (R) was considered significant at p < 0.01.

3. Results

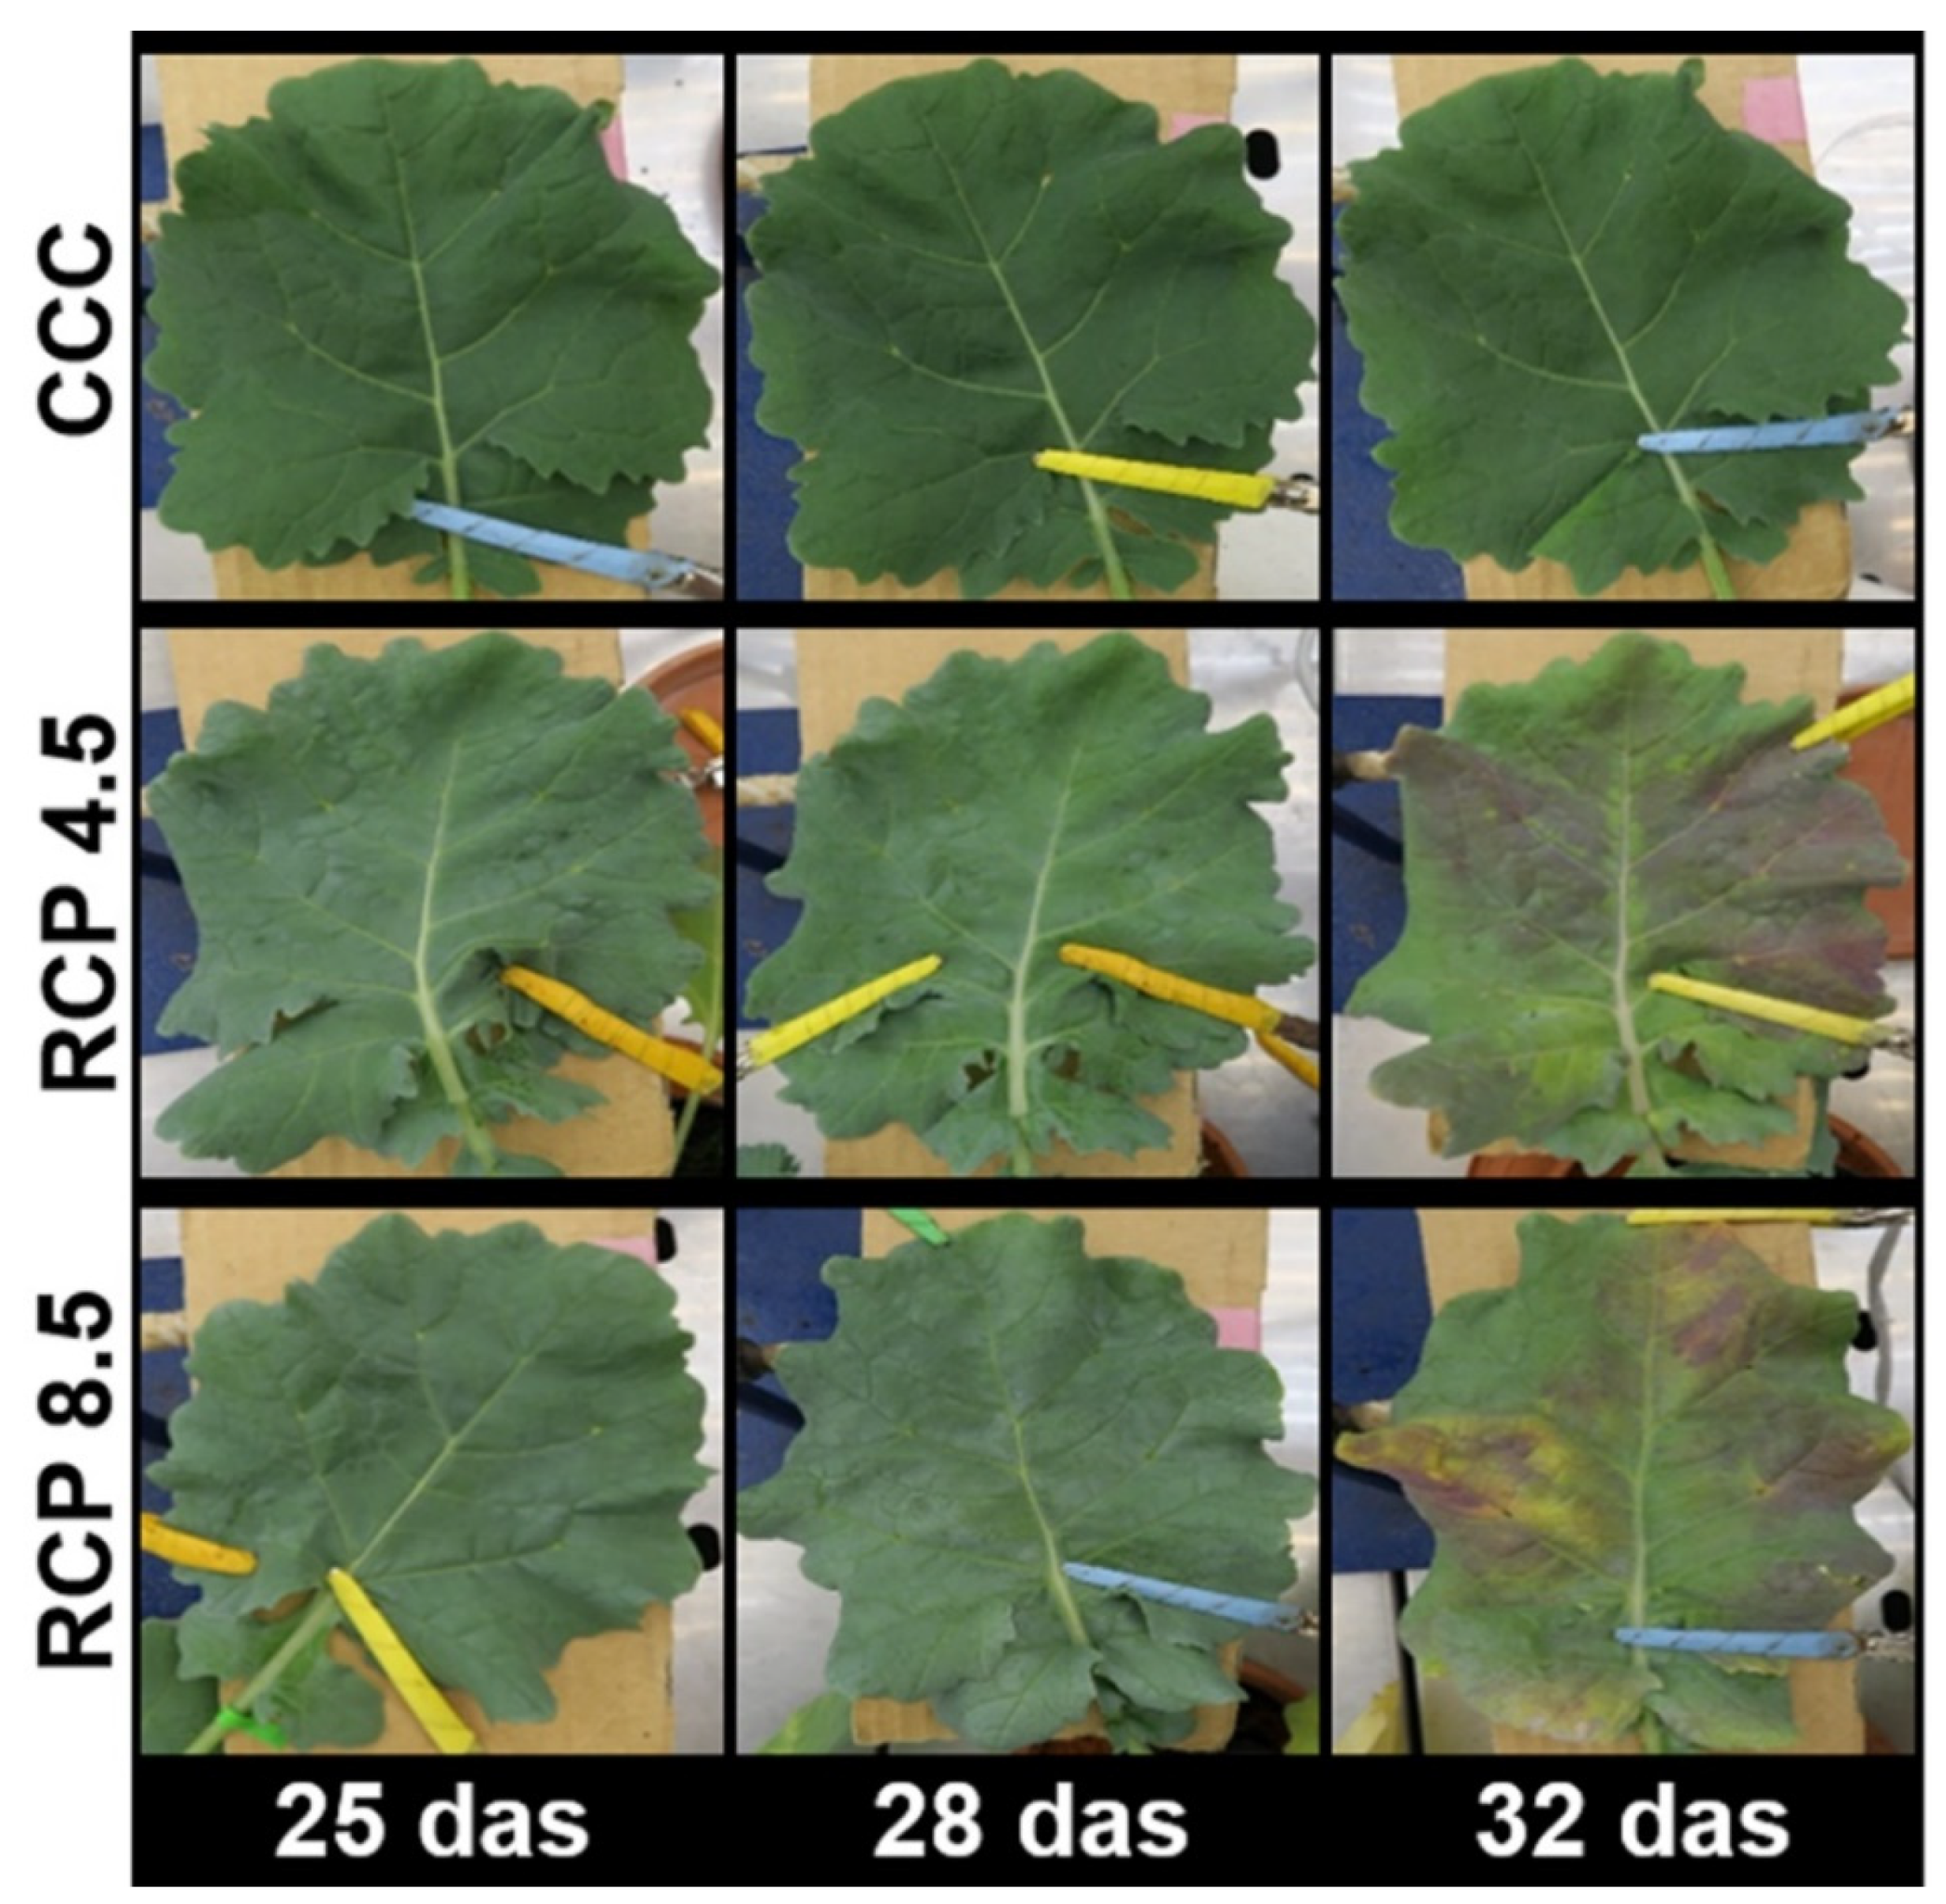
3.1. Visual Evolution of the Fourth Leaf under the Three Climatic Conditions Assayed

The fourth leaf of oilseed rape plants was selected for this study. The leaf was fully developed at 25 das and did not undergo any drastic visual changes throughout the experiment under CCC (Figure 1). However, the plants grown under the analyzed RCPs were visually different from the control treatment, with the most dramatic changes occurring the more intense the condition imposed. The leaves of plants grown under RCP 4.5 and RPC 8.5 appeared progressively less green from 28 das onwards, whereas yellow and purple colors were clearly evident at 32 das, suggesting considerable changes in leaf metabolism and leaf health status.

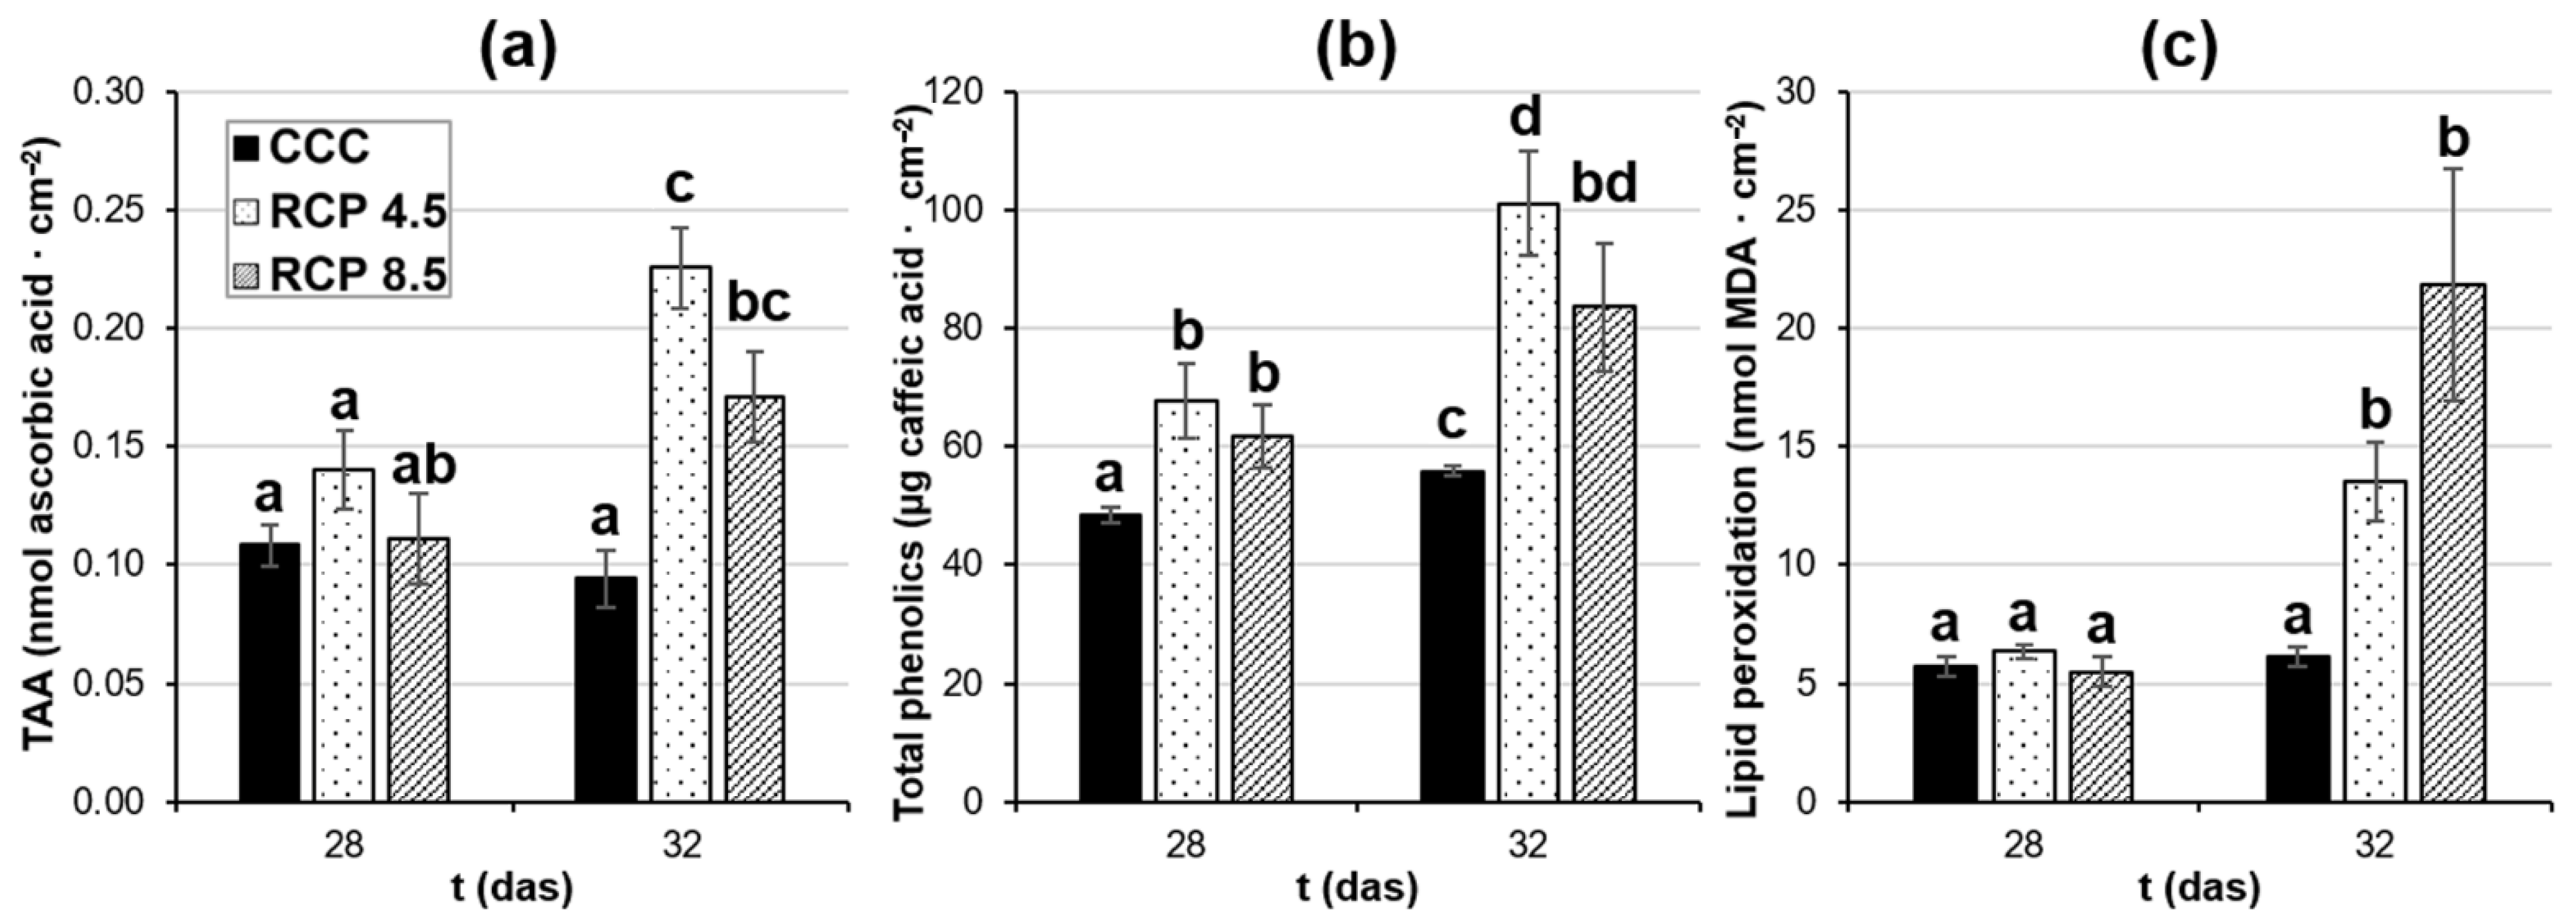
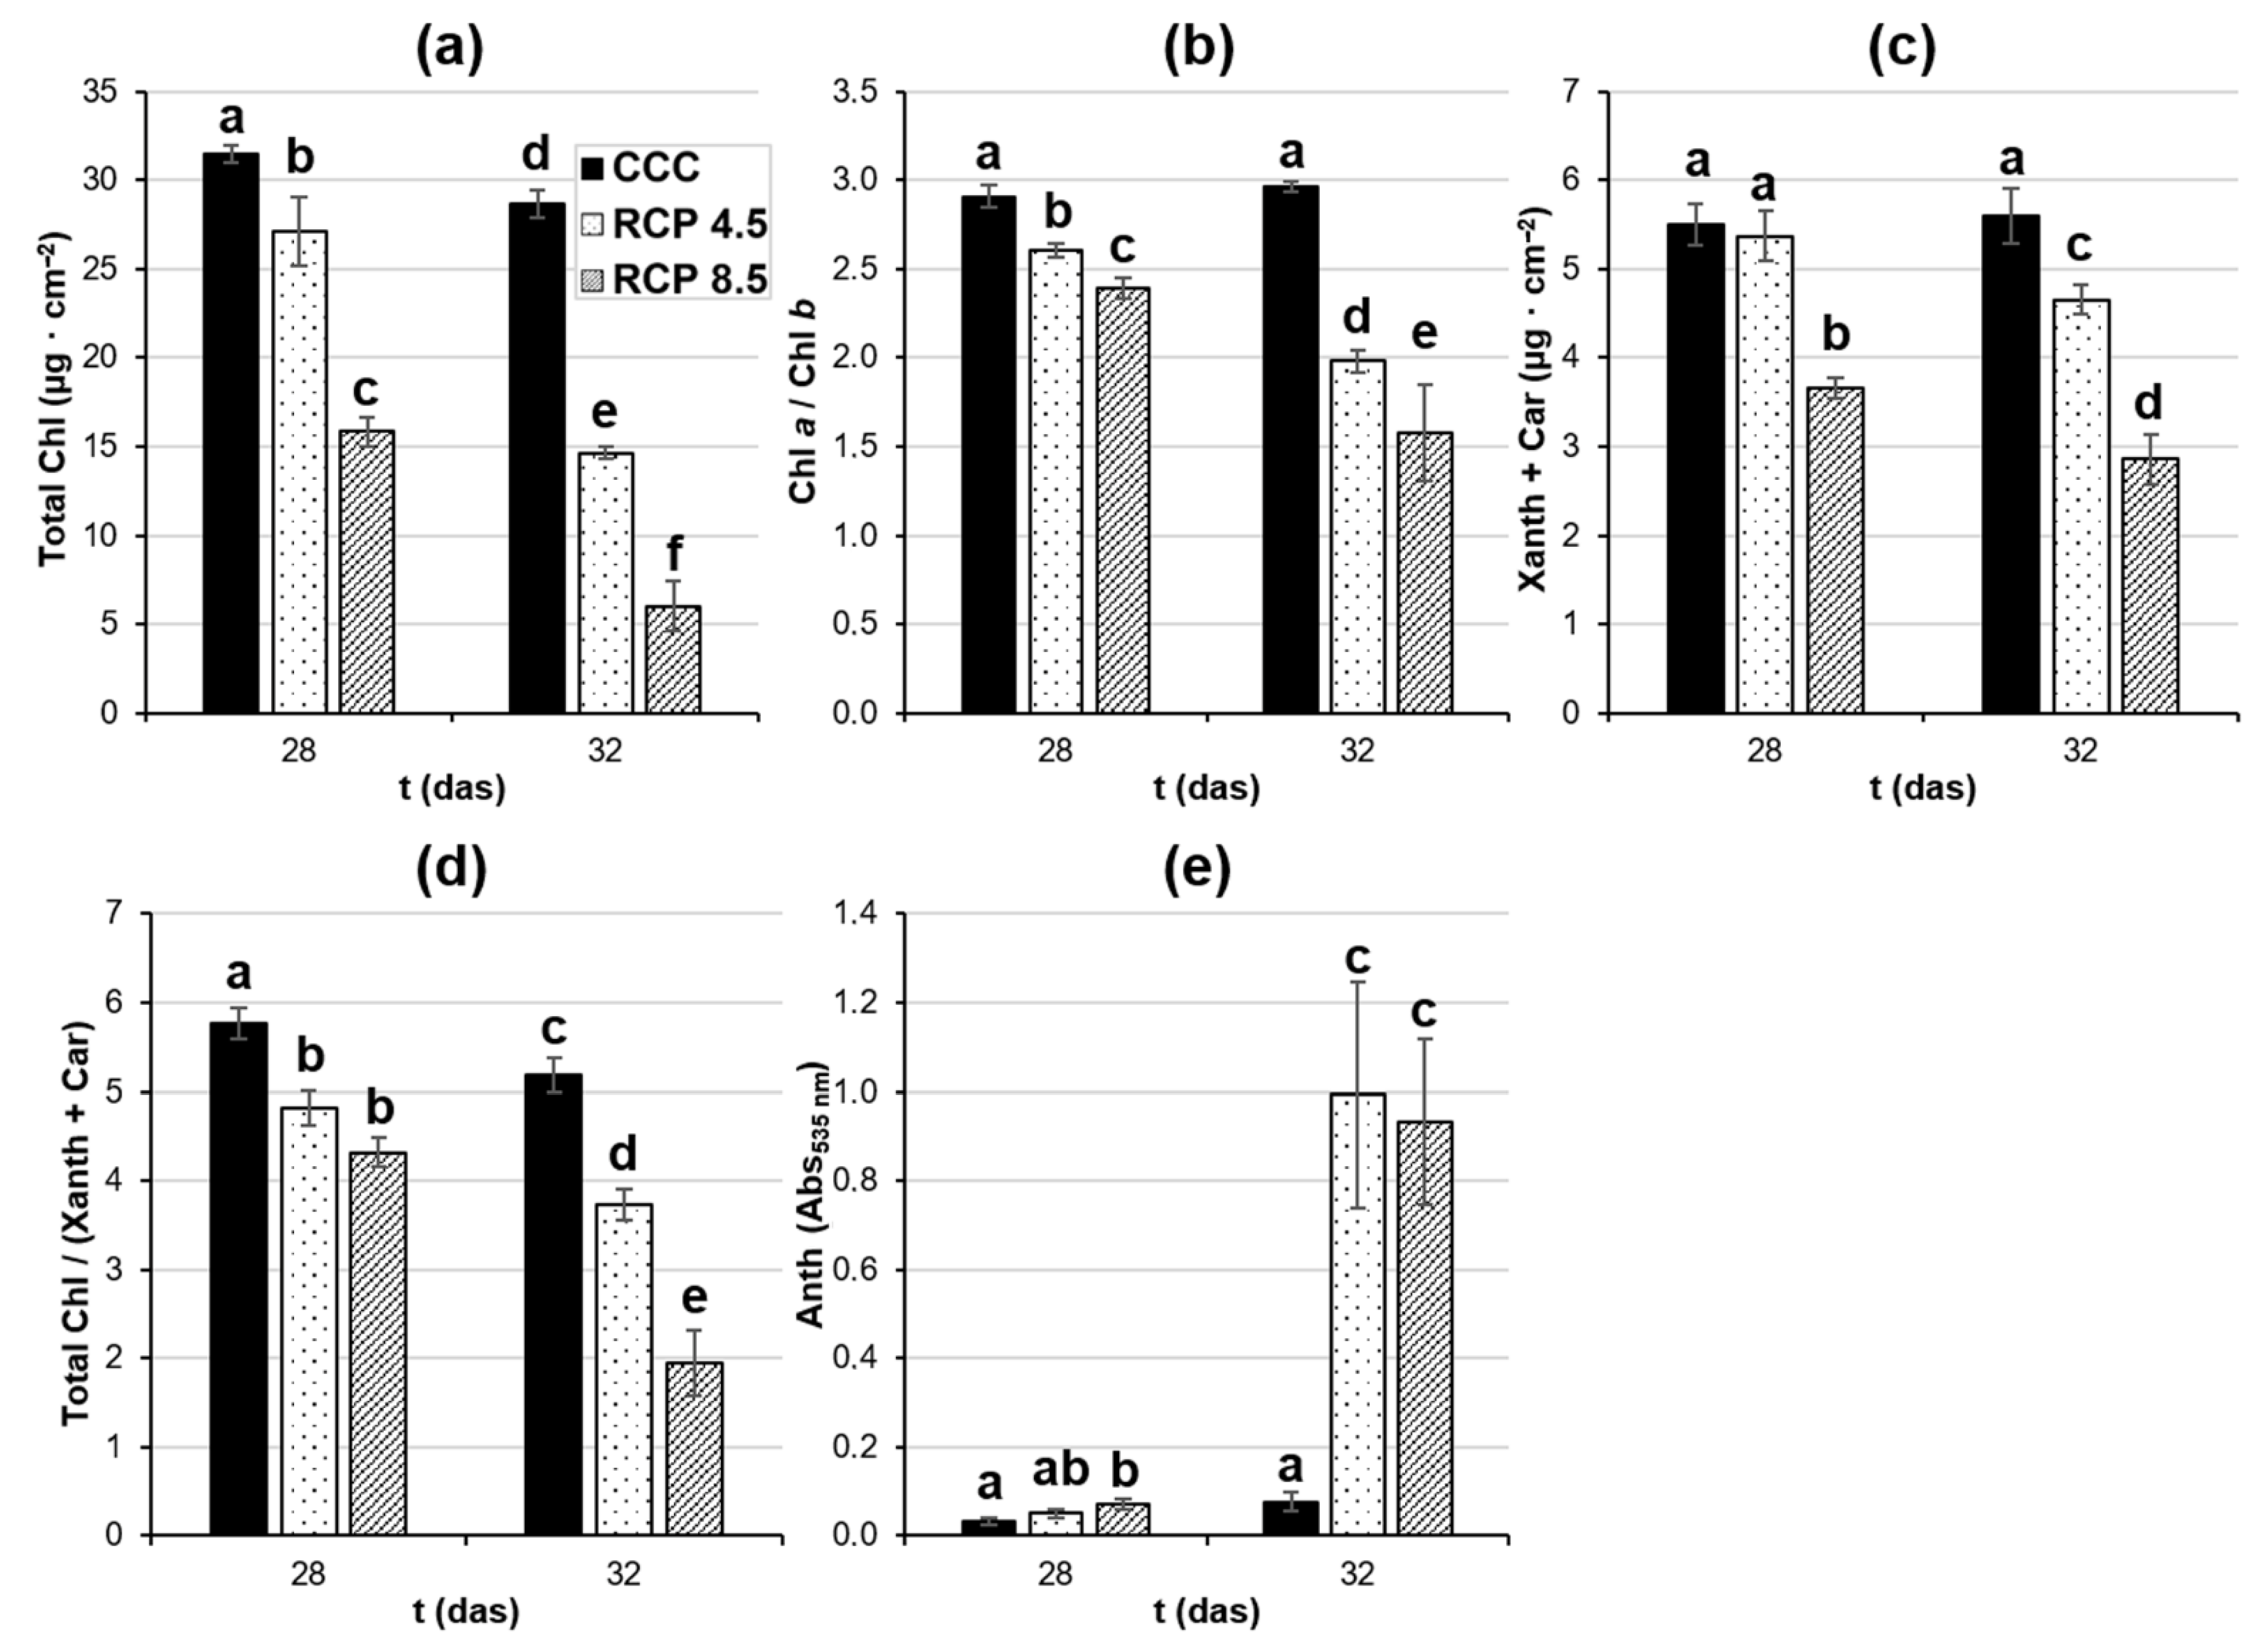
3.2. Climate Change Induces Alterations in Plant Health Status

To evaluate the alterations caused by climate change on the general health status of the fourth leaf of oilseed rape plants, the TAA, total phenolics content, and lipid peroxidation were quantified using invasive methods based on the absorbance of biochemical compounds (Figure 2).
TAA (Figure 2a) measures the capacity of the antioxidant substances present in the leaf samples to scavenge free oxidant radicals. Moreover, several phenolic compounds (Figure 2b) possess antioxidant activity, among other functions. Lastly, the level of lipid peroxidation (Figure 2c) is a widely used marker of oxidative damage. Neither TAA nor lipid peroxidation increased in the leaves of plants grown at CCC during the measured period; however, a slight increment of soluble phenolic content could be registered during the last das assayed. At 28 das, no differences in TAA or lipid peroxidation were detected in plants grown under RCP 4.5 and RCP 8.5 relative to the controls, whereas soluble phenolic compounds increased in both treatments. At 32 das, increments in TAA and phenolic compounds could be registered in plants cultured under RCP 4.5 and RCP 8.5. However, in spite of this increment of antioxidant substances, oxidative damage was registered as lipid peroxidation in the leaves of plants grown under the studied RCPs with respect to the controls.
Since the visual changes in the plants grown under the analyzed RCPs suggested an impairment of pigment composition respecting to those grown at CCC, the content of Chl, Car, Xanth, and Anth were measured using invasive techniques at 28 and 32 das (Figure 3).
The total Chl content of the controls plants slightly decreased from 28 to 32 das (Figure 3a). However, the Chl content in the leaves of plants grown under the analyzed RCPs was considerably lower with respect to the controls at both 28 and 32 das. The Chl a/Chl b ratio (Figure 3b) remained constant in the leaves of plants grown under CCC during the period measured, whereas the leaves of plants grown under the studied RCPs showed ratio decreases relative to the controls at both 28 and 32 das. The content of (Xanth + Car) remained constant in the leaves of the control plants from 28 to 32 das (Figure 3c). The plants grown at RCP 4.5 did not show any significant differences with respect to the controls at 28 das, whereas the content of (Xanth + Car) decreased at 32 das. However, plants grown under RCP 8.5 displayed significant differences relative to the control condition at both 28 and 32 das. Chl/(Xanth + Car) ratio decreased in leaves of plants grown under CCC from 28 to 32 das (Figure 3d). The plants grown under the analyzed RCPs showed lower ratio values than the controls at both 28 and 32 das. Finally, the plants grown at CCC did not significantly synthetize Anth from 28 to 32 das (Figure 3e). Only the leaves of the plants grown at RCP 8.5 displayed significant increments of Anth with respect to the controls at both 28 and 32 das, while the leaves of the plants grown at RCP 4.5 only showed increments at 32 das.
In general terms, the more drastic the climate condition imposed on the plants, the greater the change in pigment composition, except for Anth. In this case, there were no significant differences between the plants grown under RCP 4.5 and those grown under RCP 8.5.

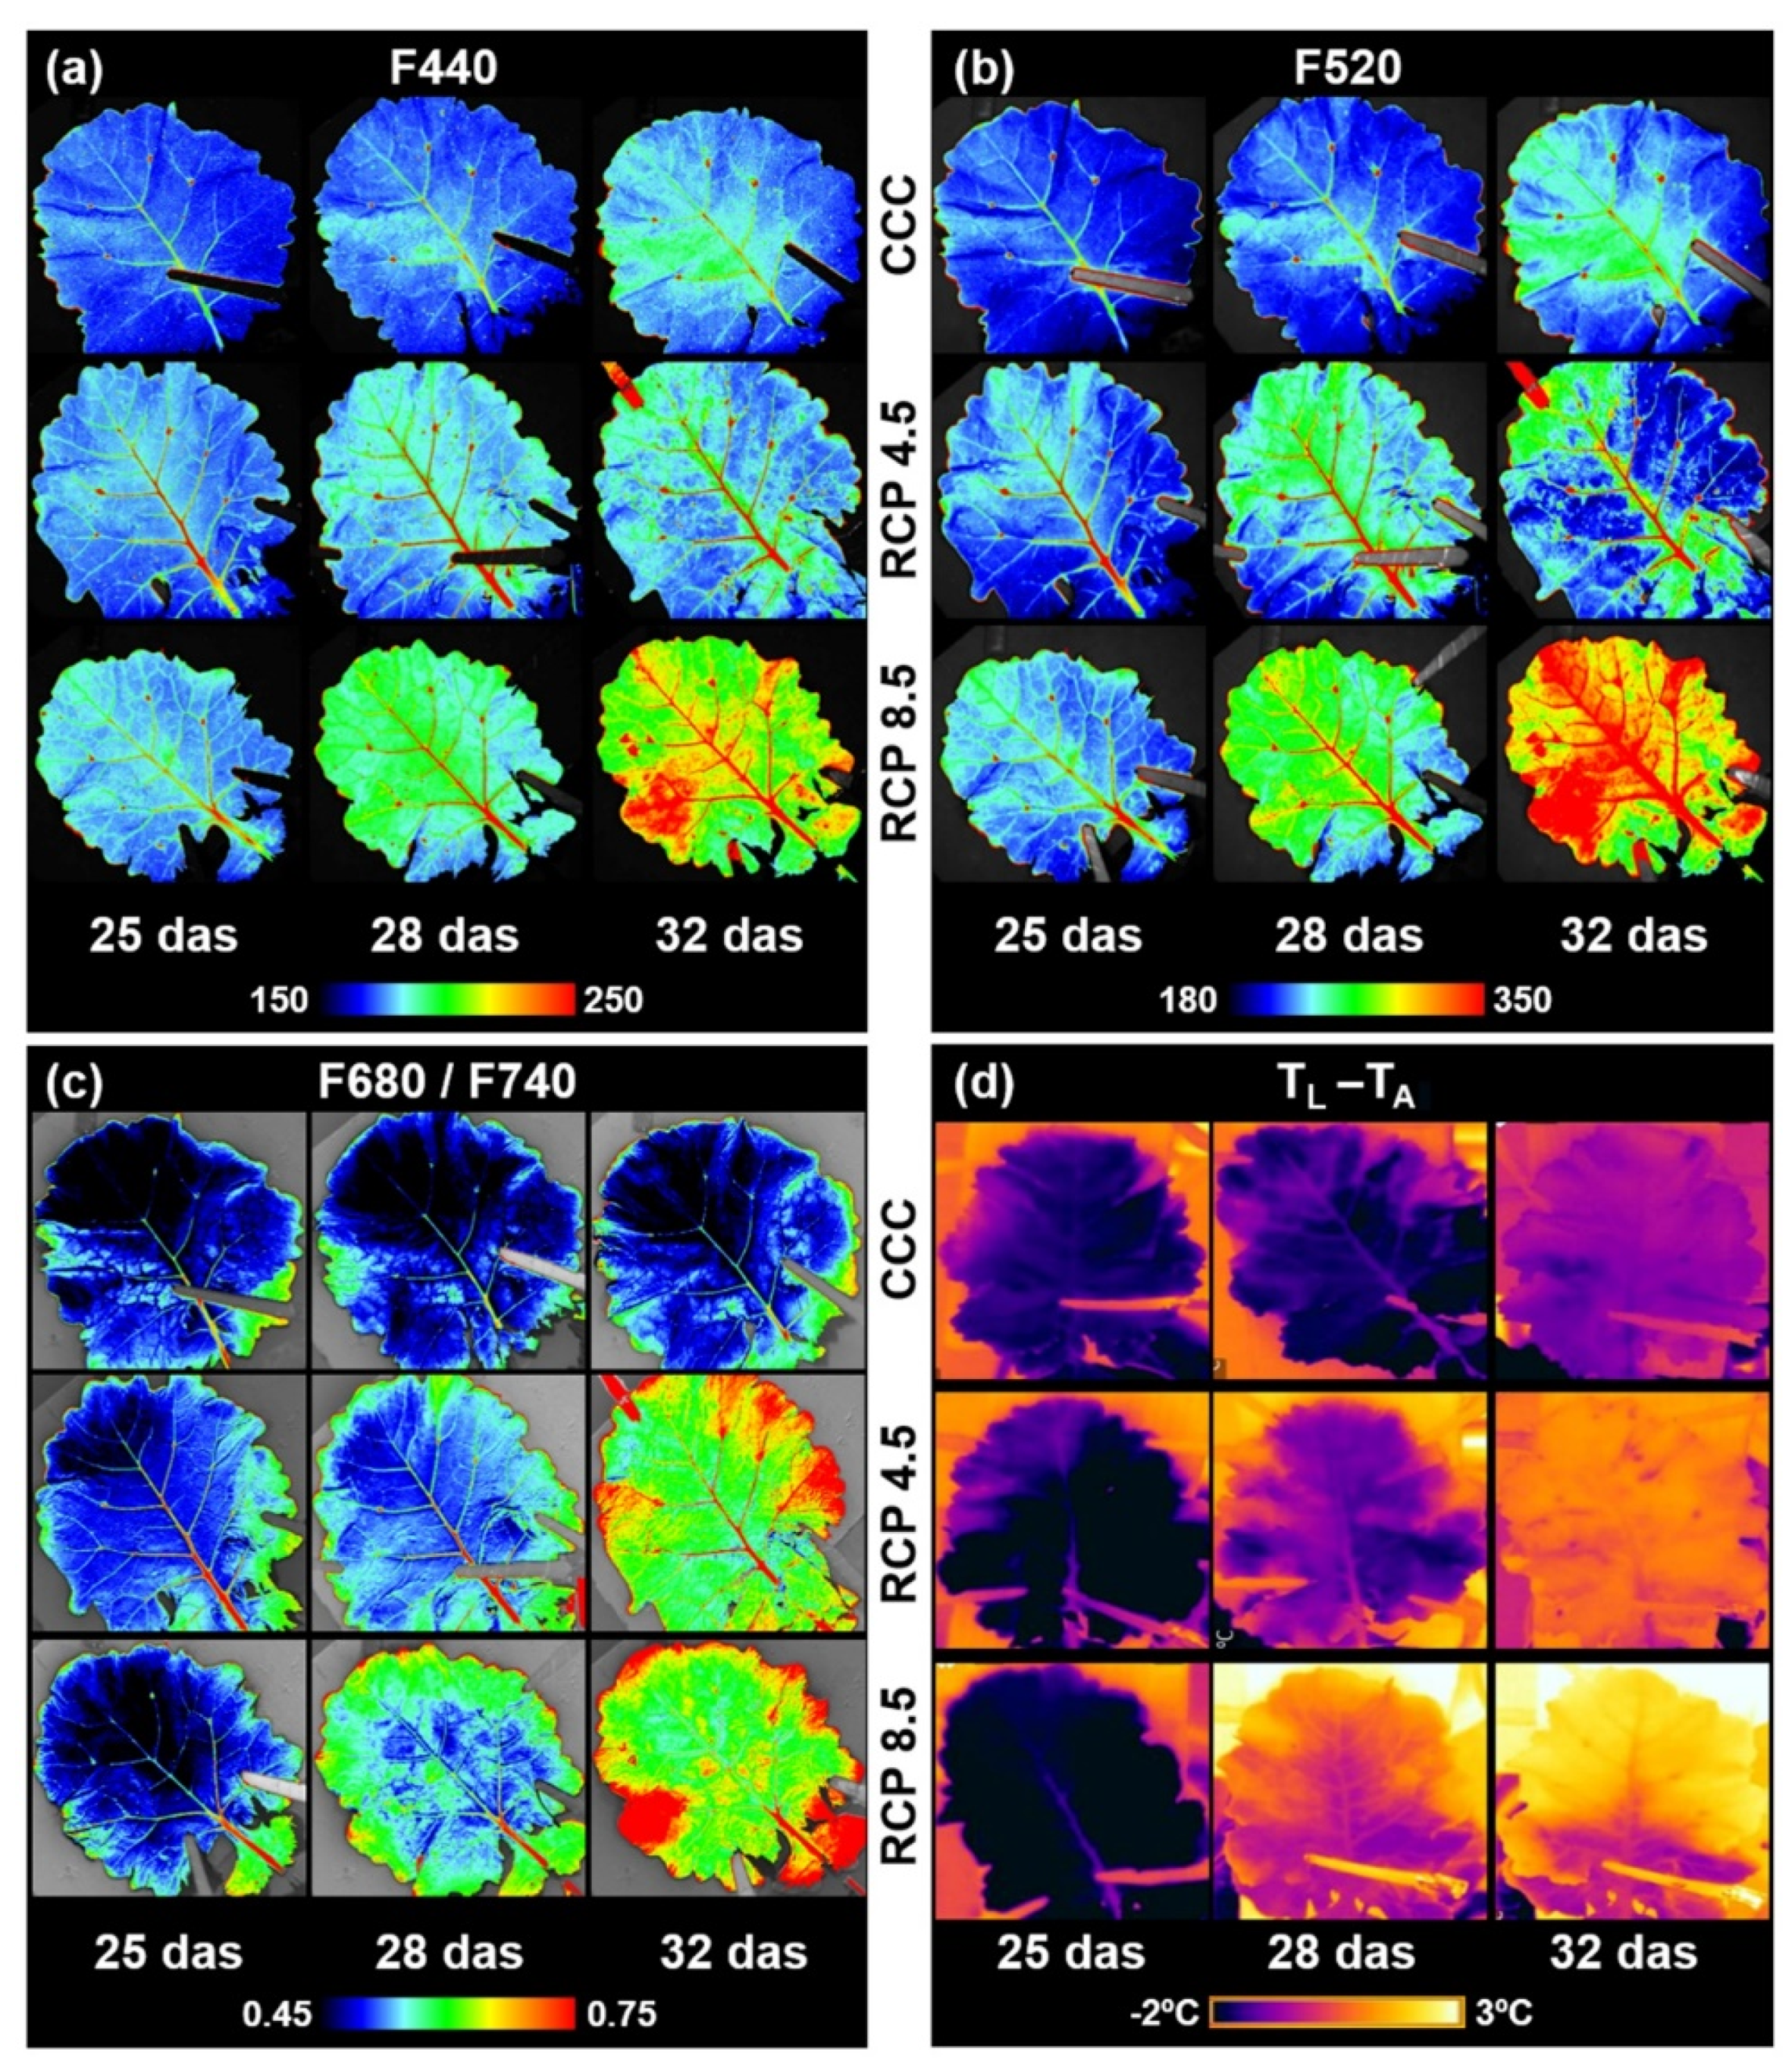
3.3. Non-Invasive Techniques to Assess Plant Health Status

The health status of the leaves of oilseed rape plants grown under CCC, RCP 4.5, and RCP 8.5 was also evaluated by several imaging techniques: MCFI, thermography, and hyperspectral reflectance imaging. The sensors provide results in short periods of time and do not consume plant material. Therefore, one additional das could be included in the study: 25, 28, and 32 das; i.e., before stress symptoms were apparent, with mild and clearly evident symptoms, respectively.
The F440 (Figure 4a and Figure 5a) and F520 (Figure 4b and Figure 5b) that were excited with ultraviolet light and measured by MCFI correlate with the insoluble phenolic content of the leaves. The leaves of the plants grown at CCC displayed slightly increasing F440 values from 25 to 32 das, whereas F520 increased only at 32 das. The F440 and F520 increases were mainly related to the primary and secondary veins. The F440 and F520 leaf values of the plants grown at the studied RCPs were higher than the control plants from 25 das onwards, except for those plants grown at RCP 4.5 at 32 das when no significant differences related to the controls could be detected in F520. The increments registered mostly affected the main veins (primary and secondary) at 25 das, but they also could be measured in interveinal tissues on successive days. As in the previous measurements, the greater changes with respect to the controls could be detected in the most dramatic climate change projection (RCP 8.5).
The F680/F740 ratio obtained from MCFI is inversely correlated with the Chl content of the leaves (Figure 4c and Figure 5c). No changes in this ratio could be measured in the leaves of the plants grown under the control conditions within the experiment. On the other hand, the leaves of those plants grown at RCP 4.5 and RCP 8.5 displayed significantly higher F680/F740 values with respect to the controls from 25 to 32 das. Those increments increased as the experiment progressed, especially in the case of the plants grown under RCP 4.5. However, no significant differences could be found between the plants grown under RCP 4.5 and RCP 8.5 until 32 das.
TL − TA is a parameter measured by thermography and is inversely correlated to the transpiration rates of the leaves (Figure 4d and Figure 5d). The leaves of the plants grown under CCC showed an increase in TL − TA and, thus, a decrease in leaf transpiration from 28 to 32 das. The leaves of the plants grown under the assessed RCPs displayed an increment in TL − TA relative to the controls from 28 das onwards; the more drastic the climate conditions imposed on the plants, the higher the temperature registered in the leaves.
Hyperspectral reflectance sensors allow for the calculation of many VIs related to different vegetation traits such as vigor, fitness, and pigment composition. CRI is a VI related to Car content (Table 2; Figure 5e). No differences in CRI could be detected in the plants grown under CCC within the experiment. However, the plants grown under the studied RCPs showed lower CRI values than the controls at every das assayed. However, no significant differences could be detected between the leaves of plants grown at RCP 4.5 and RCP 8.5 until 32 das. ARI is a VI related to the Anth content (Table 2; Figure 5f). There were no significant increases in the ARI values in the leaves of plants grown under the control conditions within the experiment. On the contrary, significant increments in the ARI values of the leaves of the plants grown under the analyzed RCPs could be measured at both 28 and 32 das. Significant differences between the ARI values of the leaves of the plants grown at RCP 4.5 and RCP 8.5 were only evident at 32 das.

3.4. Common and Novel Vegetation Indices to Evaluate Plant Fitness

There is a collection of VIs related to plant fitness that can be calculated from hyperspectral reflectance experiments (Figure 6). The most widely used are NDVI, related to plant vigor and greenness, and PRI, strongly correlated with plant photosynthesis (Table 2). The NDVI values of the leaves of the plants grown under the control conditions did not show changes during the experiment (Figure 6a). However, the leaves of the plants grown under the studied RCPs displayed lower NDVI values than the controls from 25 das onwards; the strongest decay of leaf vigor was registered at 32 das. No significant differences between the NDVI values of the leaves of the plants grown at RCP 4.5 and those grown at RCP 8.5 could be found. Regarding PRI (Figure 6b), the leaves of the plants grown at CCC registered a progressive decrease in photosynthesis from 25 das onwards. Moreover, the leaves of the plants grown at RCP 4.5 and RCP 8.5 showed lower PRI values with respect to those grown at CCC during the entire experiment. In the case of the plants grown at RCP 8.5, the extent of the PRI decline was greater than in the case of those grown at RCP 4.5 only at 25 das; there were no significant differences between these two treatments for the rest of the das analyzed.
The great advantage of having complete reflectance spectra is that it allows researchers to create novel VIs tailored to their specific needs. That was the case of the VIs DBI1–3, specifically designed to detect biotic stress challenged by Xanthomonas campestris pv. campestris on broccoli plants, another plant of the Brassica genus (Table 2). These three indices were applied to this piece of work to investigate their capacity to detect the abiotic stress caused by climate change on oilseed rape plants with a different extent of success. DBI1 was the only DBI displaying differences between the plants grown under RCP 4.5 and RCP 8.5 from 28 das onwards (Figure 6c). However, DBI1 was the least sensitive of them to presymptomatically detect significant changes between the controls and the plants growing under the analyzed RCPs: at 28 and 32 das for RCP 4.5 and RCP 8.5 treatments, respectively. Indeed, DBI2 and DBI3 showed those differences presymptomatically from 25 das onwards (Figure 6d,e, respectively). Nevertheless, the DBI2 values did not develop any changes during the experiment for any of the treatments assayed, while the DBI3 values showed increments compared to previous days in the case of the plants growing under the studied RCPs.
In this piece of work, two requirements have been established to be indispensable when considering VI as an optimal reporter of the abiotic stress caused by climate change in oilseed rape plants: (i) to provide information before the symptoms become visible; and (ii) to distinguish between the plants grown at RCP 4.5 and RCP 8.5 treatments. None of the analyzed VIs meet both criteria at the same time. Therefore, novel VIs have been designed for this particular interest, following the process described by Pineda et al. [24]. Briefly, the whole leaf reflectance spectra were averaged for each treatment and das assayed (Figure S1) and then compared by a two-tailed Student t-test. Then, two wavelength ranges were selected: the first one (510–630 nm) for showing the maximal differences between the three treatments at every das assayed (p < 0.001); and the second one (790–815 nm) for displaying little or no differences between them. The purpose of selecting the most stable range is for the “normalization” of the designed parameters. Finally, selected wavelengths were combined by different mathematical calculations (subtractions, additions, divisions, and combinations thereof) to construct novel VIs showing statistical differences (p < 0.001 according to a Student t-test) between the three climatic conditions along the entire experiment. Thus, one VI was found that met requirements (i) and (ii) and was therefore named the climatic stress index for brassicas (CSIB):
CSIB = R525/R800,
CSIB showed significant differences between the plants growing under the three climatic conditions as early as 25 das (Figure 6f) when the oilseed rape leaves were visually similar to each other. Moreover, these differences increased in the subsequent days and were greater for the more severe climatic conditions imposed. In regard to the control plants, there was a small increase in CSIB at 32 das with respect to previous days.

3.5. Assessing the Relationship between Novel VIs and Underlying Physiological Traits of Plants

The novel VIs DBI1–3 developed by Pineda et al. [24] and the mainly CSIB first proposed here have been shown to be indicative of the abiotic stress induced by climatic conditions in oilseed rape plants to different extents. However, the physiological processes underlying these VIs remains unknown. To try to establish a relationship between those indices and the physiological traits analyzed in this piece of work, bivariate correlations have been developed. The parameters available for 25, 28, and 32 das (i.e., those measured by imaging sensors: F440, F520, F680/F740, CRI, ARI, TL − TA, NDVI, and PRI) were selected for this analysis. Only those variables with a Pearson correlation coefficient of R ≥ 0.85 at p < 0.01 were considered to be true correlations (Figure 7). Thus, DBI1 and DBI2 did not correlate with any of the selected parameters representing the physiological traits. On the other hand, DBI3 correlated well with F680/F740 (Figure 7a), NDVI (Figure 7b), and PRI (Figure 7c), with R = 0.946, 0.914, and 0.958, respectively. F680/F740 is an MCFI parameter linked to chlorophyll content, as described above, whereas NDVI and PRI are measured by hyperspectral reflectance and are associated with the plant’s vitality and photosynthesis, respectively. Finally, CSIB only correlated with F520 (Figure 7d), although to a lesser extent (R = 0.870). F520 is linked to phenolic compounds synthetized by plant secondary metabolism.

4. Discussion

Climate change is one of the greatest challenges we face, especially in terms of its effects on global ecosystems, natural resources, and agriculture, on which humanity depends [29]. However, studies on the alterations that climate change causes in the metabolism of plants of agronomic interest (such as oilseed rape) grown under combined elevated temperatures and CO2 remain scarce, despite being clearly needed. Several potential scenarios should be tested to assay the magnitude of the alterations that climate change would cause in oilseed rape metabolism. In this piece of work, the intermediate projection RCP 4.5 has been selected as it would represent the most probable scenario of climate change by the year 2100; whereas the extreme projection RCP 8.5 would take place if governments do not take any action against climate change, according to IPCC [4]. A combination of both invasive and non-invasive methods was chosen to assess the plant health status of oilseed rape plants to gain a broad insight into the physiological processes affected by climate change.
Some plant traits related to oxidative stress, such as TAA and lipid peroxidation, are of particular interest for the assessment of the plant health status, as the exposure to extreme environmental factors leads to an imbalance in the production of reactive oxygen species, which in turn results in oxidative stress that could damage cellular components, including lipids [39]. The oilseed rape plants grown under CCC showed no changes in TAA or lipid peroxidation, suggesting that these leaves did not undergo oxidative stress during the period analyzed. On the contrary, TAA increased at 32 das in the plants grown under the studied RCPs with respect to 28 das and compared to the controls. This was in accordance with the previous results from the plants grown under extreme temperatures [40,41,42] and elevated CO2 concentrations [43]. Maintaining a high level of TAA might be a good strategy to scavenge the excessive reactive oxygen species produced by environmental stresses [44]. However, the increase in the antioxidant substances registered on the oilseed rape leaves grown under the analyzed RCPs was not sufficient to protect the plants from oxidative damage, as measured as lipid peroxidation. Heat stress also induces lipid peroxidation in plants such as lentils [45] or wheat [42]. Indeed, it is known that leaf senescence is related to the membrane deterioration induced by the increasing levels of lipid peroxidation [46,47]. Thus, climate change may be accelerating the oilseed rape leaf aging process.
Among plant secondary metabolites, phenolic compounds have the highest antioxidant activity both in vivo and in vitro [48,49,50], although they also have other important functions such as providing structural support [51] or protection from pathogens and pests [52]. In the case of the plants grown under CCC, a slight increment in the total soluble phenolic content and both F440 and F520 could be detected from the first das assayed, while TAA remained stable. This fluorescence increase was mainly associated with principal veins; thus, the progressive accumulation of compounds with structural function could be responsible for the increase in phenolics in the control plants [14]. On the other hand, the oilseed rape plants grown under the assessed RCPs presented a higher soluble phenolic content than those grown at CCC from 28 das as measured by colorimetric measurements. It has been previously described that other plants growin under climate change conditions also accumulated phenolic compounds with a high antioxidant capacity [40,41,53], as discussed above. Furthermore, MCFI registered higher F440 and, particularly, higher F520 from 25 das onwards across the whole leaves. The content of insoluble phenolics increased as a more drastic climatic condition was imposed. This could be due to the more pronounced decrease in Chl and Car contents measured in the leaves of the plants grown under RCP 8.5 since these pigments are responsible for the reabsorption of part of F440 and F520 emitted by phenolic compounds [54]. In any case, it is known that the antioxidant activity of plant phenolics benefits human health [48], but more research is needed to identify the nature of those compounds accumulated in oilseed rape leaves grown under the analyzed RCPs to elucidate how they will affect the quality of the products yielded from this plant in the future.
Lipid peroxidation causes ruptures in cell membranes, including the thylakoids where pigment–protein complexes are located, thus leading to leaf yellowing [47]. Yellowing is an indicator of leaf senescence, a programmed physiological process mainly associated with aging but which can also be induced by environmental stress [55,56]. Indeed, exposure to elevated temperatures or high atmospheric CO2 concentrations accelerates plant senescence [57,58,59]. During leaf senescence, Chl catabolism is the main process, while the degradation of Xanth and Car occurs to a lesser extent [60,61,62]. The ratio between Chl a and Chl b is fine-tuned in leaves; however, chlorophyll a is more easily degraded by oxidative stress than chlorophyll b, causing decreases in Chl a/Chl b ratio [63]. The leaves of the oilseed rape plants grown under CCC did not display any symptoms of leaf yellowing and thus of senescence, as the total Chl content and total Chl/(Xanth + Car) ratio only decreased slightly in the last das assayed. However, the content of (Xanth + Car) and the ratio Chl a/Chl b remained stable. On the other hand, the damage to membranes due to lipid peroxidation can account for the decrease in photosynthetic pigments registered on leaves of plants grown under the studied RCPs, as well as for the impairment of the Chl a/Chl b ratio. Therefore, the oilseed rape plants grown under climate change conditions showed a clear early onset of leaf senescence, with the earlier the response, the more dramatic the climate change projection imposed.
The red-purple pigments Anth are phenylpropanoids, thus products of secondary metabolism in contrast to Chl, Xanth, and Car. Anth accumulation is considered to be a stress response to reduce photo-oxidative damage [64,65]. In addition, Anth is synthetized during leaf senescence, and the degradation of Chl causes them to be even more noticeable [66]. Thus, the oilseed rape control plants maintained low levels of Anth throughout the experiment, whereas increasing amounts of this pigment were found in those plants grown under the studied RCPs. These results are in agreement with previous works showing alterations in the Anth composition of grape berries [67] and flowers [68] of plants growing under climate change conditions. Concerning green tissues, Anth accumulation under cold temperatures is well documented [69], but more research is needed to refer high temperatures, although some clues suggest that high CO2 concentrations would induce up-regulation of genes responsible for Anth biosynthesis to prolong leaf longevity [70]. Despite that, the parameters related to pigment content calculated from imaging techniques (F680/F740 ratio, CRI, and ARI) could not distinguish between RCP 4.5 and RCP 8.5 treatments or do so late at 32 das, the tendency of their measurements agreed with those obtained by invasive methods.
Carbon and water balances are two of the most important physiological traits for plant growth and development. Indeed, stomata are able to sense environmental changes to ensure adequate CO2 and water fluxes. As a consequence, the stomatal conductance and transpiration are parameters affected by environmental stress [71,72]. Cultivation under the studied RCPs caused stomatal closure in oilseed rape plants, measured by thermography as higher leaf temperatures with respect to the controls from 28 das. The plants grown under RCP 8.5 showed the largest increases in leaf temperature. This is in agreement with previous works that found that stomatal conductance generally increases with air temperature up to an optimum value and then decreases progressively with increasing ambient temperatures [73]; moreover, long exposures to elevated CO2 concentrations reduce stomatal conductance, particularly in plants grown in pots [7,59].
The photosynthesis rate correlates with stomatal conductance since the stomatal aperture regulates the CO2 available for photosynthesis [74]. That could be the case for the leaves of oilseed rape plants grown under warming conditions and high atmospheric CO2, as the PRI decreased throughout the experiment together with the decrease in leaf transpiration. Indeed, high night temperatures reduce the photosynthetic efficiency of C3 plants such as oilseed rape [6], as well as long exposures to high CO2 concentrations [7]. Moreover, lipid peroxidation may lead to disorganization of the thylakoid membrane, resulting in loss of photosynthetic pigments (as discussed above) and preventing the proper performance of photosynthesis. However, further microscopic research is required to prove this hypothesis. Together with PRI decreases, leaf vitality measured as NDVI also diminished in plants grown under climate change conditions. Several works have compared the relationship between climate change and NDVI in several locations worldwide, showing that this parameter is inversely proportional to environmental temperature [75,76,77]. In the case of control plants, photosynthesis only decayed slightly, possibly as a consequence of normal leaf aging, without affecting NDVI.
The ability of VIs DBI1–3 to estimate the health status of the oilseed rape plants grown under the studied RCPs was also assessed, as they were developed to sense stress in other brassica, such as broccoli [24]. However, among all of the VIs analyzed here, DBIs were the least adequate indices to distinguish between the two RCPs analyzed in a presymptomatic way. This apparent lack of sensitivity could be due to the fact that DBI1–3 were designed to detect the biotic stress caused by X. campestris pv. campestris [24]. For this reason, a novel VI sensitive to the abiotic stress induced by climate change was specifically designed in this piece of work and thus named the climatic stress index for brassicas (CSIB). CSIB was demonstrated to be very sensitive to abiotic stress since it could presymptomatically distinguish between the three treatments, being directly proportional to the degree of abiotic stress. Defining novel VIs is a good strategy to maximize differences between treatments when standard reflectance parameters are not sensitive enough. Thus, the copper stress vegetation index was developed to detect the stress caused by this heavy metal in several plants [78], whereas the mangrove forest index was good at revealing the damage triggered by periodical submersions caused by tidal floods [79].
One step further, an attempt was made to elucidate what physiological traits underlie DBI1–3 and CSIB by correlation analysis. Only DBI3 and CSIB were significantly correlated with other parameters assayed in this work. Whereas an increase in CSIB could be related to an enhancement of plant secondary metabolism, DBI3 was linked to the primary metabolism and may reflect the damages caused by lipid peroxidation to thylakoid membranes: loss of photosynthetic pigments, as well as a decrease in photosynthesis and plant vigor, as it correlated to F680/F740, PRI, and NDVI, respectively. Nonetheless, more research is required to establish a direct relationship between the DBI3 parameter and lipid peroxidation.
In conclusion, climate change would induce premature senescence in the leaves of oilseed rape plants, probably as a consequence of lipid peroxidation triggered by the production of reactive oxygen species that exceeds the antioxidant capacity of the plant. The extent of induced premature senescence is proportional to the climatic condition imposed. The use of invasive and non-invasive methods to determine the health status of plants proved to be complementary, although imaging techniques alone provide a reliable, sustainable, fast, and efficient estimate of it. Moreover, the novel parameter DBI3 could reflect the degree of lipid peroxidation of leaves, whereas CSIB revealed presymptomatically the stress caused by climate change in oilseed rape plants.

Supplementary Materials

The following supporting information can be downloaded at: https://www.mdpi.com/article/10.3390/agronomy12081845/s1, Figure S1: Spectral profiles of whole leaves of oilseed rape grown under three different treatments: current climate conditions (blue; CCC), RCP 4.5 (orange; Representative Concentration Pathway 4.5) and RCP 8.5 (green; Representative Concentration Pathway 8.5) at 25 (a), 28 (b) and 32 (c) days after sowing (das), respectively. RCP 4.5 and RCP 8.5 are intermediate and extreme conditions of climate change according to the Intergovernmental Panel on Climate Change [4] and regionalized for Castilla y León for years 2081–2100. Graphs represent average values (n = 9–12) for every treatment and das assayed.

Author Contributions

Conceptualization and writing, M.P. and M.B.; experimental design, data acquisition and analyzing, figures author, M.P., resources and funding acquisition, M.B. All authors have read and agreed to the published version of the manuscript.

Funding

This work was supported by grant number RTI2018-094652-B-I00 funded by Ministerio de Ciencia e Innovación and Agencia Estatal de Investigación: MCIN/AEI/10.13039/501100011033, and by “European Regional Development Fund, ERDF: A way of making Europe”. The free open access publication was partially funded by Consejo Superior de Investigaciones Científicas (CSIC) through the Unidad de Recursos de Información Científica para la Investigación (URICI).

Institutional Review Board Statement

Not applicable.

Informed Consent Statement

Not applicable.

Data Availability Statement

The original contributions presented in the study are included in the article/Supplementary Material. Further inquiries can be directed to the corresponding authors.

Acknowledgments

Authors would like to thank E. Cartea for guidelines for brassicas cultivation; T. Moreno-Martín for the care of the plants used in the experiments; as well as M.L. Pérez-Bueno for providing useful ideas for the experimental design and data management.

Conflicts of Interest

The authors declare no conflict of interest. The funders had no role in the design of the study; in the collection, analyses, or interpretation of data; in the writing of the manuscript, or in the decision to publish the results.

References

  1. Nesi, N.; Delourme, R.; Brégeon, M.; Falentin, C.; Renard, M. Genetic and molecular approaches to improve nutritional value of Brassica napus L. seed. C. R. Biol. 2008, 331, 763–771. [Google Scholar] [CrossRef] [PubMed]
  2. Kowalska, G.; Kowalski, R.; Hawlena, J.; Rowinski, R. Seeds of oilseed rape as an alternative source of protein and minerals. J. Elem. 2020, 25, 513–522. [Google Scholar] [CrossRef]
  3. Rial-Lovera, K.; Davies, W.P.; Cannon, N.D. Implications of climate change predictions for UK cropping and prospects for possible mitigation: A review of challenges and potential responses. J. Sci. Food Agric. 2017, 97, 17–32. [Google Scholar] [CrossRef] [PubMed]
  4. IPCC. Climate Change 2014: Synthesis Report. Contribution of Working Groups I, II and III to the Fifth Assessment Report of the Intergovernmental Panel on Climate Change; IPCC: Geneva, Switzerland, 2015. [Google Scholar]
  5. Pullens, J.W.M.; Sharif, B.; Trnka, M.; Balek, J.; Semenov, M.A.; Olesen, J.E. Risk factors for European winter oilseed rape production under climate change. Agric. For. Meteorol. 2019, 272, 30–39. [Google Scholar] [CrossRef]
  6. Alemu, S.T. Photosynthesis limiting stresses under climate change scenarios and role of chlorophyll fluorescence: A review article. Cogent Food Agric. 2020, 6, 1785136. [Google Scholar] [CrossRef]
  7. Dusenge, M.E.; Duarte, A.G.; Way, D.A. Plant carbon metabolism and climate change: Elevated CO2 and temperature impacts on photosynthesis, photorespiration and respiration. New Phytol. 2019, 221, 32–49. [Google Scholar] [CrossRef] [Green Version]
  8. Bakhshi, B. Heat and drought stress response and related management strategies in oilseed rape. Agrotech. Ind. Crops 2021, 1, 170–181. [Google Scholar] [CrossRef]
  9. Namazkar, S.; Stockmarr, A.; Frenck, G.; Egsgaard, H.; Terkelsen, T.; Mikkelsen, T.; Ingvordsen, C.H.; Jørgensen, R.B. Concurrent elevation of CO2, O3 and temperature severely affects oil quality and quantity in rapeseed. J. Exp. Bot. 2016, 67, 4117–4125. [Google Scholar] [CrossRef] [PubMed] [Green Version]
  10. Namazkar, S.; Egsgaard, H.; Frenck, G.; Terkelsen, T.; Jørgensen, R.B. Significant reductions in oil quality and lipid content of oilseed rape (Brassica napus L.) under climate change. Procedia Environ. Sci. 2015, 29, 121–122. [Google Scholar] [CrossRef] [Green Version]
  11. Wójtowicz, M.; Wójtowicz, A. The effect of climate change on linolenic fatty acid in oilseed rape. Agronomy 2020, 10, 2003. [Google Scholar] [CrossRef]
  12. Chaerle, L.; Van der Straeten, D. Seeing is believing: Imaging techniques to monitor plant health. Biochim. Biophys. Acta 2001, 1519, 153–166. [Google Scholar] [CrossRef]
  13. Mahlein, A.-K. Plant disease detection by imaging sensors—Parallels and specific demands for precision agriculture and plant phenotyping. Plant Dis. 2016, 100, 241–251. [Google Scholar] [CrossRef] [PubMed] [Green Version]
  14. Barón, M.; Pineda, M.; Pérez-Bueno, M.L. Picturing pathogen infection in plants. Z. Naturforsch. C 2016, 71, 355–368. [Google Scholar] [CrossRef]
  15. Buschmann, C.; Lichtenthaler, H.K. Principles and characteristics of multi-colour fluorescence imaging of plants. J. Plant Physiol. 1998, 152, 297–314. [Google Scholar] [CrossRef]
  16. Cerovic, Z.G.; Samson, G.; Morales, F.; Tremblay, N.; Moya, I. Ultraviolet-induced fluorescence for plant monitoring: Present state and prospects. Agronomie 1999, 19, 543–578. [Google Scholar] [CrossRef] [Green Version]
  17. Jones, H.G. Application of thermal imaging and infrared sensing in plant physiology and ecophysiology. Adv. Bot. Res. 2004, 41, 107–163. [Google Scholar]
  18. Pineda, M.; Barón, M.; Pérez-Bueno, M.-L. Thermal imaging for plant stress detection and phenotyping. Remote Sens. 2021, 13, 68. [Google Scholar] [CrossRef]
  19. Gamon, J.A.; Peñuelas, J.; Field, C.B. A narrow-waveband spectral index that tracks diurnal changes in photosynthetic efficiency. Remote Sens. Environ. 1992, 41, 35–44. [Google Scholar] [CrossRef]
  20. Gitelson, A.A.; Merzlyak, M.N.; Chivkunova, O.B. Optical properties and nondestructive estimation of anthocyanin content in plant leaves. Photochem. Photobiol. 2001, 74, 38–45. [Google Scholar] [CrossRef]
  21. Gitelson, A.A.; Zur, Y.; Chivkunova, O.B.; Merzlyak, M.N. Assessing carotenoid content in plant leaves with reflectance spectroscopy. Photochem. Photobiol. 2002, 75, 272–281. [Google Scholar] [CrossRef]
  22. Tucker, C.J. Red and photographic infrared linear combinations for monitoring vegetation. Remote Sens. Environ. 1979, 8, 127–150. [Google Scholar] [CrossRef] [Green Version]
  23. Pettorelli, N. The Normalized Difference Vegetation Index; Oxford University Press: Oxford, UK, 2013. [Google Scholar]
  24. Pineda, M.; Pérez-Bueno, M.L.; Barón, M. Novel vegetation indices to identify broccoli plants infected with Xanthomonas campestris pv. campestris. Front. Plant Sci. 2022, 13, 790268. [Google Scholar] [CrossRef] [PubMed]
  25. Chaerle, L.; Lenk, S.; Leinonen, I.; Jones, H.G.; Van Der Straeten, D.; Buschmann, C. Multi-sensor plant imaging: Towards the development of a stress-catalogue. Biotechnol. J. 2009, 4, 1152–1167. [Google Scholar] [CrossRef] [PubMed]
  26. Ninomiya, S. High-throughput field crop phenotyping: Current status and challenges. Breed. Sci. 2022, 72, 3–18. [Google Scholar] [CrossRef]
  27. Baslam, M.; Mitsui, T.; Hodges, M.; Priesack, E.; Herritt, M.T.; Aranjuelo, I.; Sanz-Sáez, Á. Photosynthesis in a changing global climate: Scaling up and scaling down in crops. Front. Plant Sci. 2020, 11, 882. [Google Scholar] [CrossRef]
  28. Arya, S.; Sandhu, K.S.; Singh, J.; Kumar, S. Deep learning: As the new frontier in high-throughput plant phenotyping. Euphytica 2022, 218, 47. [Google Scholar] [CrossRef]
  29. Rolnick, D.; Donti, P.L.; Kaack, L.H.; Kochanski, K.; Lacoste, A.; Sankaran, K.; Ross, A.S.; Milojevic-Dupont, N.; Jaques, N.; Waldman-Brown, A.; et al. Tackling climate change with machine learning. ACM Comput. Surv. 2022, 55, 42. [Google Scholar] [CrossRef]
  30. Miller, N.J.; Diplock, A.T.; Rice-Evans, C.A. Evaluation of the total antioxidant activity as a marker of the deterioration of apple juice on storage. J. Agric. Food Chem. 1995, 43, 1794–1801. [Google Scholar] [CrossRef]
  31. Pérez-Bueno, M.L.; Pineda, M.; Díaz-Casado, E.; Barón, M. Spatial and temporal dynamics of primary and secondary metabolism in Phaseolus vulgaris challenged by Pseudomonas syringae. Physiol. Plant. 2015, 153, 161–174. [Google Scholar] [CrossRef]
  32. Chun, O.K.; Kim, D.O. Consideration on equivalent chemicals in total phenolic assay of chlorogenic acid-rich plums. Food Res. Int. 2004, 37, 337–342. [Google Scholar] [CrossRef]
  33. Rodríguez-Serrano, M.; Romero-Puertas, M.C.; Sanz-Fernández, M.; Hu, J.; Sandalio, L.M. Peroxisomes extend peroxules in a fast response to stress via a reactive oxygen species-mediated induction of the peroxin PEX11a. Plant Physiol. 2016, 171, 1665–1674. [Google Scholar] [CrossRef] [PubMed] [Green Version]
  34. Lichtenthaler, H.K.; Buschmann, C. Chlorophylls and carotenoids: Measurement and characterization by UV-VIS spectroscopy. In Current Protocols in Food Analytical Chemistry; Wrolstad, R.E., Acree, T.E., An, H., Decker, E.A., Penner, M.H., Reid, D.S., Schwartz, S.J., Shoemaker, C.F., Sporns, P., Eds.; John Wiley and Sons: New York, NY, USA, 2001; pp. F4.3.1–F4.3.8. [Google Scholar]
  35. Solfanelli, C.; Poggi, A.; Loreti, E.; Alpi, A.; Perata, P. Sucrose-specific induction of the anthocyanin biosynthetic pathway in Arabidopsis. Plant Physiol. 2005, 140, 637–646. [Google Scholar] [CrossRef] [PubMed] [Green Version]
  36. Pérez-Bueno, M.L.; Granum, E.; Pineda, M.; Flors, V.; Rodríguez-Palenzuela, P.; López-Solanilla, E.; Barón, M. Temporal and spatial resolution of activated plant defense responses in leaves of Nicotiana benthamiana infected with Dickeya dadantii. Front. Plant Sci. 2016, 6, 1209. [Google Scholar] [CrossRef] [PubMed] [Green Version]
  37. Pineda, M.; Luisa Perez-Bueno, M.; Paredes, V.; Baron, M. Use of multicolour fluorescence imaging for diagnosis of bacterial and fungal infection on zucchini by implementing machine learning. Funct. Plant Biol. 2017, 44, 563–572. [Google Scholar] [CrossRef] [PubMed] [Green Version]
  38. Pérez-Bueno, M.L.; Pineda, M.; Cabeza, F.; Barón Ayala, M. Multicolor fluorescence imaging as a candidate for disease detection in plant phenotyping. Front. Plant Sci. 2016, 7, 1790. [Google Scholar] [CrossRef] [PubMed] [Green Version]
  39. Xie, X.; He, Z.; Chen, N.; Tang, Z.; Wang, Q.; Cai, Y. The roles of environmental factors in regulation of oxidative stress in plant. Biomed. Res. Int. 2019, 2019, 9732325. [Google Scholar] [CrossRef] [PubMed]
  40. Sárosi, S.; Bernáth, J.; Burchi, G.; Antonetti, M.; Bertoli, A.; Pistelli, L.; Benvenuti, S. Effect of different plant origins and climatic conditions on the total phenolic content and total antioxidant capacity of self-heal (Prunella vulgaris L.). Acta Hortic. 2011, 925, 49–55. [Google Scholar] [CrossRef]
  41. Ben Mansour-Gueddes, S.; Saidana-Naija, D.; Bchir, A.; Braham, M. Climate change effects on phytochemical compounds and antioxidant activity of Olea europaea L. Not. Bot. Horti Agrobot. Cluj-Napoca 2020, 48, 436–455. [Google Scholar] [CrossRef] [Green Version]
  42. Sairam, R.K.; Srivastava, G.C.; Saxena, D.C. Increased antioxidant activity under elevated temperatures: A mechanism of heat stress tolerance in wheat genotypes. Biol. Plant. 2000, 43, 245–251. [Google Scholar] [CrossRef]
  43. Naudts, K.; Van den Berge, J.; Farfan, E.; Rose, P.; AbdElgawad, H.; Ceulemans, R.; Janssens, I.A.; Asard, H.; Nijs, I. Future climate alleviates stress impact on grassland productivity through altered antioxidant capacity. Environ. Exp. Bot. 2014, 99, 150–158. [Google Scholar] [CrossRef] [Green Version]
  44. Sharma, P.; Dubey, R.S. Drought induces oxidative stress and enhances the activities of antioxidant enzymes in growing rice seedlings. Plant Growth Regul. 2005, 46, 209–221. [Google Scholar] [CrossRef]
  45. Chakraborty, U.; Pradhan, D. High temperature-induced oxidative stress in Lens culinaris, role of antioxidants and amelioration of stress by chemical pre-treatments. J. Plant Interact. 2011, 6, 43–52. [Google Scholar] [CrossRef]
  46. Strother, S. The role of free radicals in leaf senescence. Gerontology 1988, 34, 151–156. [Google Scholar] [CrossRef]
  47. Dhindsa, R.S.; Plumb-Dhindsa, P.; Thorpe, T.A. Leaf senescence: Correlated with increased levels of membrane permeability and lipid peroxidation, and decreased levels of superoxide dismutase and catalase. J. Exp. Bot. 1981, 32, 93–101. [Google Scholar] [CrossRef]
  48. Kasote, D.M.; Katyare, S.S.; Hegde, M.V.; Bae, H. Significance of antioxidant potential of plants and its relevance to therapeutic applications. Int. J. Biol. Sci. 2015, 11, 982–991. [Google Scholar] [CrossRef] [PubMed] [Green Version]
  49. Vuolo, M.M.; Lima, V.S.; Maróstica Junior, M.R. Chapter 2—Phenolic compounds: Structure, classification, and antioxidant power. In Bioactive Compounds; Campos, M.R.S., Ed.; Woodhead Publishing: Duxford, UK, 2019; pp. 33–50. [Google Scholar] [CrossRef]
  50. Sharma, A.; Shahzad, B.; Rehman, A.; Bhardwaj, R.; Landi, M.; Zheng, B. Response of phenylpropanoid pathway and the role of polyphenols in plants under abiotic stress. Molecules 2019, 24, 2452. [Google Scholar] [CrossRef] [PubMed] [Green Version]
  51. de la Rosa, L.A.; Moreno-Escamilla, J.O.; Rodrigo-García, J.; Alvarez-Parrilla, E. Chapter 12—Phenolic compounds. In Postharvest Physiology and Biochemistry of Fruits and Vegetables; Yahia, E.M., Ed.; Woodhead Publishing: Duxford, UK, 2019; pp. 253–271. [Google Scholar] [CrossRef]
  52. Dixon, R.A.; Achnine, L.; Kota, P.; Liu, C.J.; Srinivasa Reddy, M.S.; Wang, L. The phenylpropanoid pathway and plant defence —A genomics perspective. Mol. Plant Pathol. 2002, 3, 371–390. [Google Scholar] [CrossRef]
  53. Kumar, S.; Yadav, A.; Yadav, M.; Yadav, J.P. Effect of climate change on phytochemical diversity, total phenolic content and in vitro antioxidant activity of Aloe vera (L.) Burm.f. BMC Res. Notes 2017, 10, 60. [Google Scholar] [CrossRef] [Green Version]
  54. Buschmann, C.; Langsdorf, G.; Lichtenthaler, H.K. Imaging of the blue, green, and red fluorescence emission of plants: An overview. Photosynthetica 2000, 38, 483–491. [Google Scholar] [CrossRef]
  55. Mayta, M.L.; Hajirezaei, M.-R.; Carrillo, N.; Lodeyro, A.F. Leaf senescence: The chloroplast connection comes of age. Plants 2019, 8, 495. [Google Scholar] [CrossRef] [Green Version]
  56. Thakur, N.; Sharma, V.; Kishore, K. Leaf senescence: An overview. Indian J. Plant Physiol. 2016, 21, 225–238. [Google Scholar] [CrossRef]
  57. Rossi, S.; Burgess, P.; Jespersen, D.; Huang, B. Heat-induced leaf senescence associated with chlorophyll metabolism in bentgrass lines differing in heat tolerance. Crop Sci. 2017, 57, S-169. [Google Scholar] [CrossRef]
  58. Jochum, G.M.; Mudge, K.W.; Thomas, R.B. Elevated temperatures increase leaf senescence and root secondary metabolite concentrations in the understory herb Panax quinquefolius (Araliaceae). Am. J. Bot. 2007, 94, 819–826. [Google Scholar] [CrossRef] [PubMed] [Green Version]
  59. Agüera, E.; De la Haba, P. Leaf senescence in response to elevated atmospheric CO2 concentration and low nitrogen supply. Biol. Plant. 2018, 62, 401–408. [Google Scholar] [CrossRef]
  60. Kusaba, M.; Tanaka, A.; Tanaka, R. Stay-green plants: What do they tell us about the molecular mechanism of leaf senescence. Photosynth. Res. 2013, 117, 221–234. [Google Scholar] [CrossRef]
  61. Ougham, H.; Hörtensteiner, S.; Armstead, I.; Donnison, I.; King, I.; Thomas, H.; Mur, L. The control of chlorophyll catabolism and the status of yellowing as a biomarker of leaf senescence. Plant Biol. 2008, 10, 4–14. [Google Scholar] [CrossRef] [PubMed] [Green Version]
  62. Biswal, B. Carotenoid catabolism during leaf senescence and its control by light. J. Photochem. Photobiol. B 1995, 30, 3–13. [Google Scholar] [CrossRef]
  63. Kasajima, I. Difference in oxidative stress tolerance between rice cultivars estimated with chlorophyll fluorescence analysis. BMC Res. Notes 2017, 10, 168. [Google Scholar] [CrossRef] [PubMed]
  64. Diaz, C.; Saliba-Colombani, V.; Loudet, O.; Belluomo, P.; Moreau, L.; Daniel-Vedele, F.; Morot-Gaudry, J.-F.; Masclaux-Daubresse, C. Leaf yellowing and anthocyanin accumulation are two genetically independent strategies in response to nitrogen limitation in Arabidopsis thaliana. Plant Cell Physiol. 2006, 47, 74–83. [Google Scholar] [CrossRef] [Green Version]
  65. Steyn, W.J.; Wand, S.J.E.; Holcroft, D.M.; Jacobs, G. Anthocyanins in vegetative tissues: A proposed unified function in photoprotection. New Phytol. 2002, 155, 349–361. [Google Scholar] [CrossRef]
  66. Lee, D.W. Anthocyanins in autumn leaf senescence. Adv. Bot. Res. 2002, 37, 147–165. [Google Scholar] [CrossRef]
  67. de Rosas, I.; Deis, L.; Baldo, Y.; Cavagnaro, J.B.; Cavagnaro, P.F. High temperature alters anthocyanin concentration and composition in grape berries of malbec, merlot, and pinot noir in a cultivar-dependent manner. Plants 2022, 11, 926. [Google Scholar] [CrossRef]
  68. Sullivan, C.N.; Koski, M.H. The effects of climate change on floral anthocyanin polymorphisms. Proc. R. Soc. B Biol. Sci. 2021, 288, 20202693. [Google Scholar] [CrossRef]
  69. Chalker-Scott, L. Environmental significance of anthocyanins in plant stress responses. Photochem. Photobiol. 1999, 70, 1–9. [Google Scholar] [CrossRef]
  70. Tallis, M.J.; Lin, Y.; Rogers, A.; Zhang, J.; Street, N.R.; Miglietta, F.; Karnosky, D.F.; De Angelis, P.; Calfapietra, C.; Taylor, G. The transcriptome of Populus in elevated CO2 reveals increased anthocyanin biosynthesis during delayed autumnal senescence. New Phytol. 2010, 186, 415–428. [Google Scholar] [CrossRef] [PubMed] [Green Version]
  71. Jones, H. Plants and Microclimate: A Quantitative Approach to Environmental Plant Physiology, 3rd ed.; Cambridge University Press: Cambrigde, UK, 2014; Volume 56. [Google Scholar]
  72. Prashar, A.; Yildiz, J.; McNicol, J.W.; Bryan, G.J.; Jones, H.G. Infra-red thermography for high throughput field phenotyping in Solanum tuberosum. PLoS ONE 2013, 8, e65816. [Google Scholar] [CrossRef] [Green Version]
  73. Turner, N.C. Measurement and influence of environmental and plant factors on stomatal conductance in the field. Agric. For. Meteorol. 1991, 54, 137–154. [Google Scholar] [CrossRef]
  74. Lawson, T.; Blatt, M.R. Stomatal size, speed, and responsiveness impact on photosynthesis and water use efficiency. Plant Physiol. 2014, 164, 1556–1570. [Google Scholar] [CrossRef] [Green Version]
  75. Ghebrezgabher, M.G.; Yang, T.; Yang, X.; Eyassu Sereke, T. Assessment of NDVI variations in responses to climate change in the Horn of Africa. Egypt. J. Remote Sens. Space Sci. 2020, 23, 249–261. [Google Scholar] [CrossRef]
  76. Zhao, W.; Yu, X.; Jiao, C.; Xu, C.; Liu, Y.; Wu, G. Increased association between climate change and vegetation index variation promotes the coupling of dominant factors and vegetation growth. Sci. Total Environ. 2021, 767, 144669. [Google Scholar] [CrossRef]
  77. Bagherzadeh, A.; Hoseini, A.V.; Totmaj, L.H. The effects of climate change on normalized difference vegetation index (NDVI) in the Northeast of Iran. Model. Earth Syst. Environ. 2020, 6, 671–683. [Google Scholar] [CrossRef]
  78. Zhang, C.; Ren, H.; Qin, Q.; Ersoy, O.K. A new narrow band vegetation index for characterizing the degree of vegetation stress due to copper: The copper stress vegetation index (CSVI). Remote Sens. Lett. 2017, 8, 576–585. [Google Scholar] [CrossRef]
  79. Jia, M.; Wang, Z.; Wang, C.; Mao, D.; Zhang, Y. A new vegetation index to detect periodically submerged mangrove forest using single-tide Sentinel-2 imagery. Remote Sens. 2019, 11, 2043. [Google Scholar] [CrossRef] [Green Version]
Figure 1. Visual evolution of the fourth leaf of oilseed rape plants grown under current climate conditions (CCC) and under two representative concentration pathways (RCP): an intermediate and an extreme scenario of climate change (RCP 4.5 and RCP 8.5, respectively). das: days after sowing.
Agronomy 12 01845 g001
Figure 2. Measurements of (a) total antioxidant activity (TAA), (b) total phenolic content, and (c) lipid peroxidation in the fourth leaf of oilseed rape plants at 28 and 32 days after sowing (das). Graphs display averages ± standard errors of six leaf disks collected from six plants. Different lowercase letters indicate the significance of the measurements at p < 0.05. CCC: current climate conditions; RCP 4.5 and RCP 8.5: representative concentration pathways 4.5 and 8.5, respectively.
Agronomy 12 01845 g002
Figure 3. Pigment composition of the fourth leaf of oilseed rape plants at 28 and 32 days after sowing (das). (a) Total chlorophyll (Chl) content obtained as Chl a plus Chl b; (b) Chl a over Chl b ratio; (c) xanthophylls (Xanth) plus carotenoids (Car) content; (d) total Chl over (Xanth + Car) ratio; (e) anthocyanins (Anth). Graphs display averages ± standard errors of six leaf disks collected from six plants. Different lowercase letters indicate the significance of the measurements at p < 0.05. CCC: current climate conditions; RCP 4.5 and RCP 8.5: representative concentration pathways 4.5 and 8.5, respectively.
Agronomy 12 01845 g003
Figure 4. Images of the fourth leaf of oilseed rape plants captured with two different imaging sensors: a multicolor fluorescence camera (ac) and a thermal camera (d). (a,b) blue (F440) and green (F520) fluorescence, respectively; (c) red over far red fluorescence ratio (F680/F740); (d) leaf temperature corrected by ambient temperature (TL − TA), showing transpiration patterns of the leaves. Experiments were made using twelve leaves per day after sowing (das) and climate conditions. Images correspond to the most representative data. False color scale is provided by the software of the corresponding cameras for a better interpretation of the images. CCC: current climate conditions; RCP 4.5 and RCP 8.5: representative concentration pathways 4.5 and 8.5, respectively.
Agronomy 12 01845 g004
Figure 5. Numerical data obtained from images of whole leaves of oilseed rape plants. (a) Blue (F440) and (b) green fluorescence (F520), and (c) red over far-red fluorescence ratio (F680/F740). (ac) were recorded using multicolor fluorescence imaging. (d) Leaf temperature corrected by ambient temperature (TL − TA) was obtained by a thermal camera; (e) carotenoids reflectance index (CRI) and (f) anthocyanins reflectance index (ARI) were measured by hyperspectral reflectance imaging. Graphs display averages ± standard errors of twelve leaves. Different lowercase letters indicate the significance of the measurements at p < 0.05. das: days after sowing. CCC: current climate conditions; RCP 4.5 and RCP 8.5: representative concentration pathways 4.5 and 8.5, respectively.
Agronomy 12 01845 g005
Figure 6. Vegetation indices obtained from hyperspectral reflectance measurements of the fourth leaf of oilseed rape plants. (a) Normalized difference vegetation index (NDVI). (b) Photochemical reflectance index (PRI). (ce) Diseased broccoli index 1, 2, and 3 (DBI1–3). (f) Climatic stress index for brassicas (CSIB) was specifically developed to monitor the stress caused by the analyzed climate change conditions. Graphs display averages ± standard errors of twelve leaves. Different lowercase letters indicate the significance of the measurements at p < 0.05. das: days after sowing; CCC: current climate conditions; RCP 4.5 and RCP 8.5: representative concentration pathways 4.5 and 8.5, respectively.
Agronomy 12 01845 g006
Figure 7. Correlation of the diseased broccoli index 3 (DBI3) with F680/F740 (a), normalized difference vegetation index NDVI (b), and photochemical reflectance index PRI (c); as well as the correlation between climatic stress index for brassicas CSIB with green fluorescence F520 (d). Pearson correlation coefficient (p < 0.01) is shown for every couple of variables.
Agronomy 12 01845 g007
Table 1. Climatic conditions (treatments) used for oilseed rape growth: current climate conditions (CCC) and Representative Concentration Pathways 4.5 and 8.5 (RCP 4.5 and RCP 8.5, respectively) regionalized for September (season of sowing and first stages of oilseed rape growth) in Castilla y León for years 2081–2100.
TreatmentAverage Day Temperature (°C)Average Night Temperature (°C)CO2 Concentration (ppm)
CCC2612408
RCP 4.52915650
RCP 8.532181000
Table 2. Vegetation indices (VIs) obtained from hyperspectral reflectance imaging assays.
Vegetation IndexRelated toEquationReferences
Anthocyanins reflectance indexAnthocyanins content ARI = R 800 · ( 1 R 550 + 1 R 700 )   [20]
Carotenoids reflectance indexCarotenoids content CRI = 1 R 510 1 R 700 [21]
Diseased broccoli index 1Biotic stress DBI 1 = R 400 R 690 R 850 [24]
Diseased broccoli index 2Biotic stress DBI 2 = R 400 R 850 [24]
Diseased broccoli index 3Biotic stress DBI 3 = R 578 R 529 [24]
Normalized difference vegetation indexVigor NDVI = R 800 R 670 R 800 + R 670 [22]
Photochemical reflectance indexPhotosynthesis PRI = R 531 R 570 R 531 + R 570 [19]
Publisher’s Note: MDPI stays neutral with regard to jurisdictional claims in published maps and institutional affiliations.

