Article

Effect of Climatic Conditions Caused by Seasons on Maize Yield, Kernel Filling and Weight in Central China

1
College of Agronomy, Resources and Environment, Tianjin Agricultural University, Tianjin 300392, China
2
Key Laboratory of Crop Physiology and Ecology, Ministry of Agriculture and Rural Affairs, Institute of Crop Science, Chinese Academy of Agricultural Sciences, Beijing 100081, China
3
MOA Key Laboratory of Crop Physiology, Ecology and Cultivation (The Middle Reaches of Yangtze River), College of Plant Science and Technology, Huazhong Agricultural University, Wuhan 430070, China
4
College of Agronomy, Hunan Agricultural University, Changsha 410128, China
5
Maize Research Center, Beijing Academy of Agriculture & Forestry Sciences, Beijing 100097, China
*
Authors to whom correspondence should be addressed.
Agronomy 2022, 12(8), 1816; https://doi.org/10.3390/agronomy12081816
Submission received: 26 June 2022 / Revised: 26 July 2022 / Accepted: 29 July 2022 / Published: 30 July 2022
(This article belongs to the Special Issue Multiple Cropping Systems for Improving Crop Yield and Soil Quality)

Abstract

:
In order to evaluate the effects of climatic conditions on maize grain yield (GY), kernel weight (KW), and kernel filling and identify the optimal climatic factors for GY and KW, 2-year field experiments in three seasons, i.e., spring (SPM), summer (SUM), and autumn (AUM), on maize were conducted in Central China. The results showed that SUM had more growing degree days (GDDs) than SPM and AUM due to the higher mean temperature (MT), and also resulted in higher temperature stress (killing degree days (KDDs)) in maize growth duration. Meanwhile, after silking, SPM and SUM had more GDDs and KDDs than AUM because of the higher MT, and the accumulated solar radiation (Ra) for SUM was significantly higher than for SPM and AUM. The GY of SPM was significantly higher than that of SUM and AUM, while SUM’s GY was always the lowest, because the GDDGD, MTGD, and KDDGD played significantly negative roles on GY. The final KW for SUM was always the lowest, with GDD, MT, KDD, and Ra causing significantly negative effects, and M△T and precipitation having significant positive effects, resulting in a lower kernel filling rate during the linear kernel filling period (KFRlkf) and a lower GDD at the maximum kernel filling rate (GDDKFRmax). Maize KFRlkf has significant negative linear dependences on GDD, MT, and Ra. In summary, because of the higher MT, KDD, and GDD during maize growth and kernel filling duration negatively affecting the maize kernel filling rate, the GY and KW for SPM were the highest, and for SUM, they were the lowest; therefore, farmers should plant SPM first and then AUM in Central China.

1. Introduction

Maize (Zea mays L.) is one of the most important crops in China, accounting for 20.43% and 22.42% of the world’s area and food production in 2020, respectively [1]. Central China, despite having abundant climatic resources, is a suboptimal region for maize production due to significant environmental stresses (e.g., high temperature and rainfall, and low solar radiation (Ra)). In this region, maize has a long planting period, being planted from early March to mid-July, classified as spring maize (SPM), summer maize (SUM), and autumn maize (AUM) according to the planting system [2]. Therefore, it is important to understand the effects of the various climatic factors on maize yield in Central China.
The maize grain yield is closely determined by the number of kernels per unit area and final kernel weight (KW) at harvest [3,4,5], which is always reduced by 0.83 t ha1 and 0.67 t ha1 with a mean temperature (Tmean) and minimum temperature (Tmin) increased of 1 °C in different maize regions of China [6]. Under field conditions, the KW is strongly affected by episodes of abiotic stress (e.g., extreme T, water deficit or flooding, and nutrient deficiency) during the grain filling period, depending on the duration, probability, and intensity [7,8,9]. The KW depends strongly on the kernel filling rate (KFR) and linear kernel filling duration [8,10,11]. Many studies have suggested that the temperature and growing degree days (GDDs) are the main climatic factors influencing the maize phenological development duration and KW [4,6,12,13,14]. The optimum T for mid-summer maize growth and kernel filling were 21–27 °C and 27–32 °C, respectively [14,15]. The maize KW is decreased by low temperatures because of the lower leaf photosynthetic and net assimilation rate [16], with a 10 °C low temperature for 5 days being sufficient to prevent the KW from increasing [17]. However, high-temperature stress always decreased the chlorophyll index, reduced the net rate of photosynthesis [18,19], and shortened the maize kernel filling duration (KFD) [20], with a high temperature over 35 °C possibly causing kernel abortion due to the prevention of sugar–starch conversion [21,22,23]. Ra is an important climatic factor that strongly affects maize grain yield via biomass accumulation and KW [6,12,21,24,25,26]. Low light intensity results in reductions in leaf area index and photosynthesis [27], thus limiting the development of kernels and inhibiting starch formation during kernel filling, leading to lower KW [28,29]. Moreover, precipitation (Pr) is another important climatic factor affecting crop yield [25,30]. Drought stress accelerated leaf senescence, and decreased the photosynthetic electron transport of photosystem II and leaf photosynthetic capacity [20,31], as well as shortened the KFD, resulted in KW reduced [7,32]. However, waterlogging also played a negative effects on maize KW and GY [29,33]. Furthermore, it is difficult to account for the overall effect of these individual climatic factors on maize kernel filling, particularly the interaction between soil fertility, crop management, and the other factors.
In order to define the effects of climatic factors, many studies have used different planting dates, which generate different climatic conditions for maize kernel filling in fields [5,11,13,34,35]. The maize KWs were decreased by planting date delay due to the decreasing of Ra and temperature after silking [11,34], with the decreased KFR in arid regions [11,19]. However, the range of planting dates was considered to be too narrow in these studies [35,36]. Zhou et al. [35] reported that the maize KW increased initially and then declined according to the delay in planting across eight dates in the Huang-Huai-Hai Plain, China, and SUM obtained the greatest KW due to a higher KFR and longer KFD, which were affected by a suitable temperature and Ra. However, in another previous study [2], the KW decreased initially and then increased according to eight planting dates across three seasons in Central China, with the SUM KW being the lowest due to the higher temperature and a lower Ra and Pr, but particularly the high-temperature stress (killing degree days (KDDs)). A limitation of those studies was that the specific climatic factors affecting maize KW development were undefined. Moreover, the various climatic factors affecting the kernel filling process and KW, which determined the GY, remain unclear. In this study, six planting dates across three seasons, i.e., SPM, SUM, and AUM, from the middle of March to the end of July, were set to simulate a wide range of climatic conditions for maize kernel filling with the following goals: (1) to clarify the relationship between kernel filling characteristic parameters and climatic factors under different seasons, (2) to identify the effects of climatic conditions on maize KW and GY according to seasons, and (3) to optimize the suitable maize plant season for higher GY in Central China. The results provide theoretical guidance for applying suitable date planted high-yield maize for similar areas worldwide.

2. Materials and Methods

2.1. Experimental Sites

We conducted a 2-year field experiment, from March to November in 2012 and 2013, at an experimental farm of Huazhong Agricultural University in the town of Huaqiao, Hubei Province, China (30°06′ N, 115°45′ E, 30 m elevation). This is located at the middle reach of the Yangtze River and has a humid subtropical climate. The properties of the soil, determined from its 0–20 cm–deep layer, were as follows: pH of 5.73, 16.8 g kg−1 organic matter, 1.6 g kg−1 total N, 11.8 mg kg−1 available Olsen P, and 105.8 mg kg−1 exchangeable K.

2.2. Experimental Design and Cropping Management

The treatments were arranged in a split-plot design, with seasons as main plots and varieties as subplots. The three seasons had two sowing dates, each in each of the 2 years, set as main-plot treatments. Three regional maize hybrid varieties with various growth durations were designated as the subplots: Zhengdan 958 (ZD958), Denghai 9 (DH9), and Yidan 629 (YD629).
The experimental field was plowed and built into a broad bed and furrow system, with beds 200 cm wide and furrows 40 cm wide and 30 cm deep, before planting. Each subplot was 7 m long and 4.8 m wide and consisted of eight rows, with three repetitions. Maize seeds were sown manually, with three seeds per hole and 27.5 cm between holes, with wide and narrow row spacings of 80 and 40 cm, respectively. The two outside rows were borders. Plants were thinned at the three-leaf stage to two plants per hole and at the five-leaf stage to one plant per hole at a stand density of 6.0 plants m−2. Each subplot was fertilized with 27 g m−2 N, 15 g m−2 P2O5, and 18 g m−2 K2O at planting, of which 27 g N, 9.8 g P2O5, and 14.7 g K2O were applied by slow-release fertilizer (N:P2O5:K2O, 22%:8%:12%; Kingenta Com. Ltd., Linshu, China), 5.2 g P2O5 was applied as superphosphate (P2O5, 12%), and 3.3 g K2O was applied as potassium chloride (K2O, 60%). All management and agronomic practices were identical for each subplot. Experiments were rainfed without appreciable waterlogging stress. Diseases, pests, and weeds were controlled by using chemicals throughout the growing seasons.

2.3. Measurements Methods

2.3.1. Kernel Weight, Kernel Filling and Grain Yield

The emergence (VE), silking (R1), and maturity (R6) stage dates of each subplot are listed in Table 1. At least 50 plants in each subplot, representing average plants, were tagged in the R1 stage. Beginning 7 days after R1, the apical ear of two plants per subplot were sampled every 7–10 days until the kernels reached physiological maturity. After sampling, each ear was enclosed in a plastic bag and transported to our laboratory in an insulated cooler. In addition, 50 kernels after the 10th–15th of each ear were sampled [37]. We measured the dry weight of the 50 kernels for each ear with a balance that had an accuracy of 0.0001 g after drying them in a forced-air oven at 80 °C for at least 72 h.
At maturity, 20 ears from adjacent plants in the middle rows of each replication were harvested manually and threshed; we then measured the dry weight and moisture content, and the GY (g m−2) values were calculated at a moisture content of 14%.

2.3.2. Meteorological Data and Date Analysis

We obtained daily meteorological data (maximum temperature (Tmax), minimum temperature (Tmin), mean temperature (Tmean), Pr, and Ra) for 1 March to 30 November in both 2012 and 2013, from a local weather station (AWS 800, Campbell Scientific, Inc., Logan, UT, USA), at a distance of approximately 200 m from the experimental field (Figure 1).
The diurnal temperature difference (M△T, °C) was calculated as Tmax – Tmin.
The growing degree days (GDDs, °Cd) were defined according to McMaster and Wilhelm [38] and Yang et al. [39]:
G D D = 0 n T min + T max 2 T b a s e
where Tbase is 10 °C; the optimum temperature for maize growth (Topt) is set to 30 °C; and if Tmin < Tbase, then Tmin = Tbase, and if Tmax > Topt, then Tmax = Topt [38,39].
The high-temperature stress encountered during maize growth was counted for each day when Tmax > 30 °C, using the KDD (°C d), as defined by Lobell et al. [40] and Butler and Huybers [41]:
K D D = 0 i f T max 30 0 n ( T max 30 ) i f T max > 30
The kernel filling dynamic was estimated by fitting the sigmoid model in Equation (3) with curve-fitting software, with the average KW plotted against GDD from 7 days after silking until maturity [42]:
K W = a 1 + exp ( b × ( G D D c ) )
where KW is that measured (mg); GDD (°Cd) is the value after silking; and a, b, and c are estimated parameters—a is the final KW (mg), b is a parameter related to the rate of change in KW, and c is the GDD at the maximum KFR (GDDKFRmax).
We fitted a bilinear model to estimate the KFR during the linear kernel filling stage, as in Equation (4). The model was fitted with the KW from 10% of its final value to maturity, plotted against the GDD [21,43]:
K W = d + k × G D D     i f G D D < f d + k × f i f G D D f
where KW is that measured (mg), GDD (°Cd) is that after silking, days is the y-intercept (mg), k is the KFR during the linear kernel filling phase (KFRlkf, mg °Cd−1), and f is the total GDD during kernel filling (GDDmax°Cd).
The onset date of linear kernel filling (GDDonset°Cd) was determined according to Equation (5), and the duration of the linear kernel filling phase (GDDlkf°Cd) was determined according to Equation (6), which we fitted with the GDD from GDDonset to maturity [25].
G D D o n s e t = d k
G D D l k f = f + d k

2.4. Statistical Analysis

A two-way analysis of variance was used to analyze the interaction effects of seasons and varieties, and a least significant difference (LSD) test at the p = 0.05 or 0.01 probability level was used to compare treatments, using SPSS software (version 16.0; SPSS Inc., Chicago, IL, USA).

3. Results

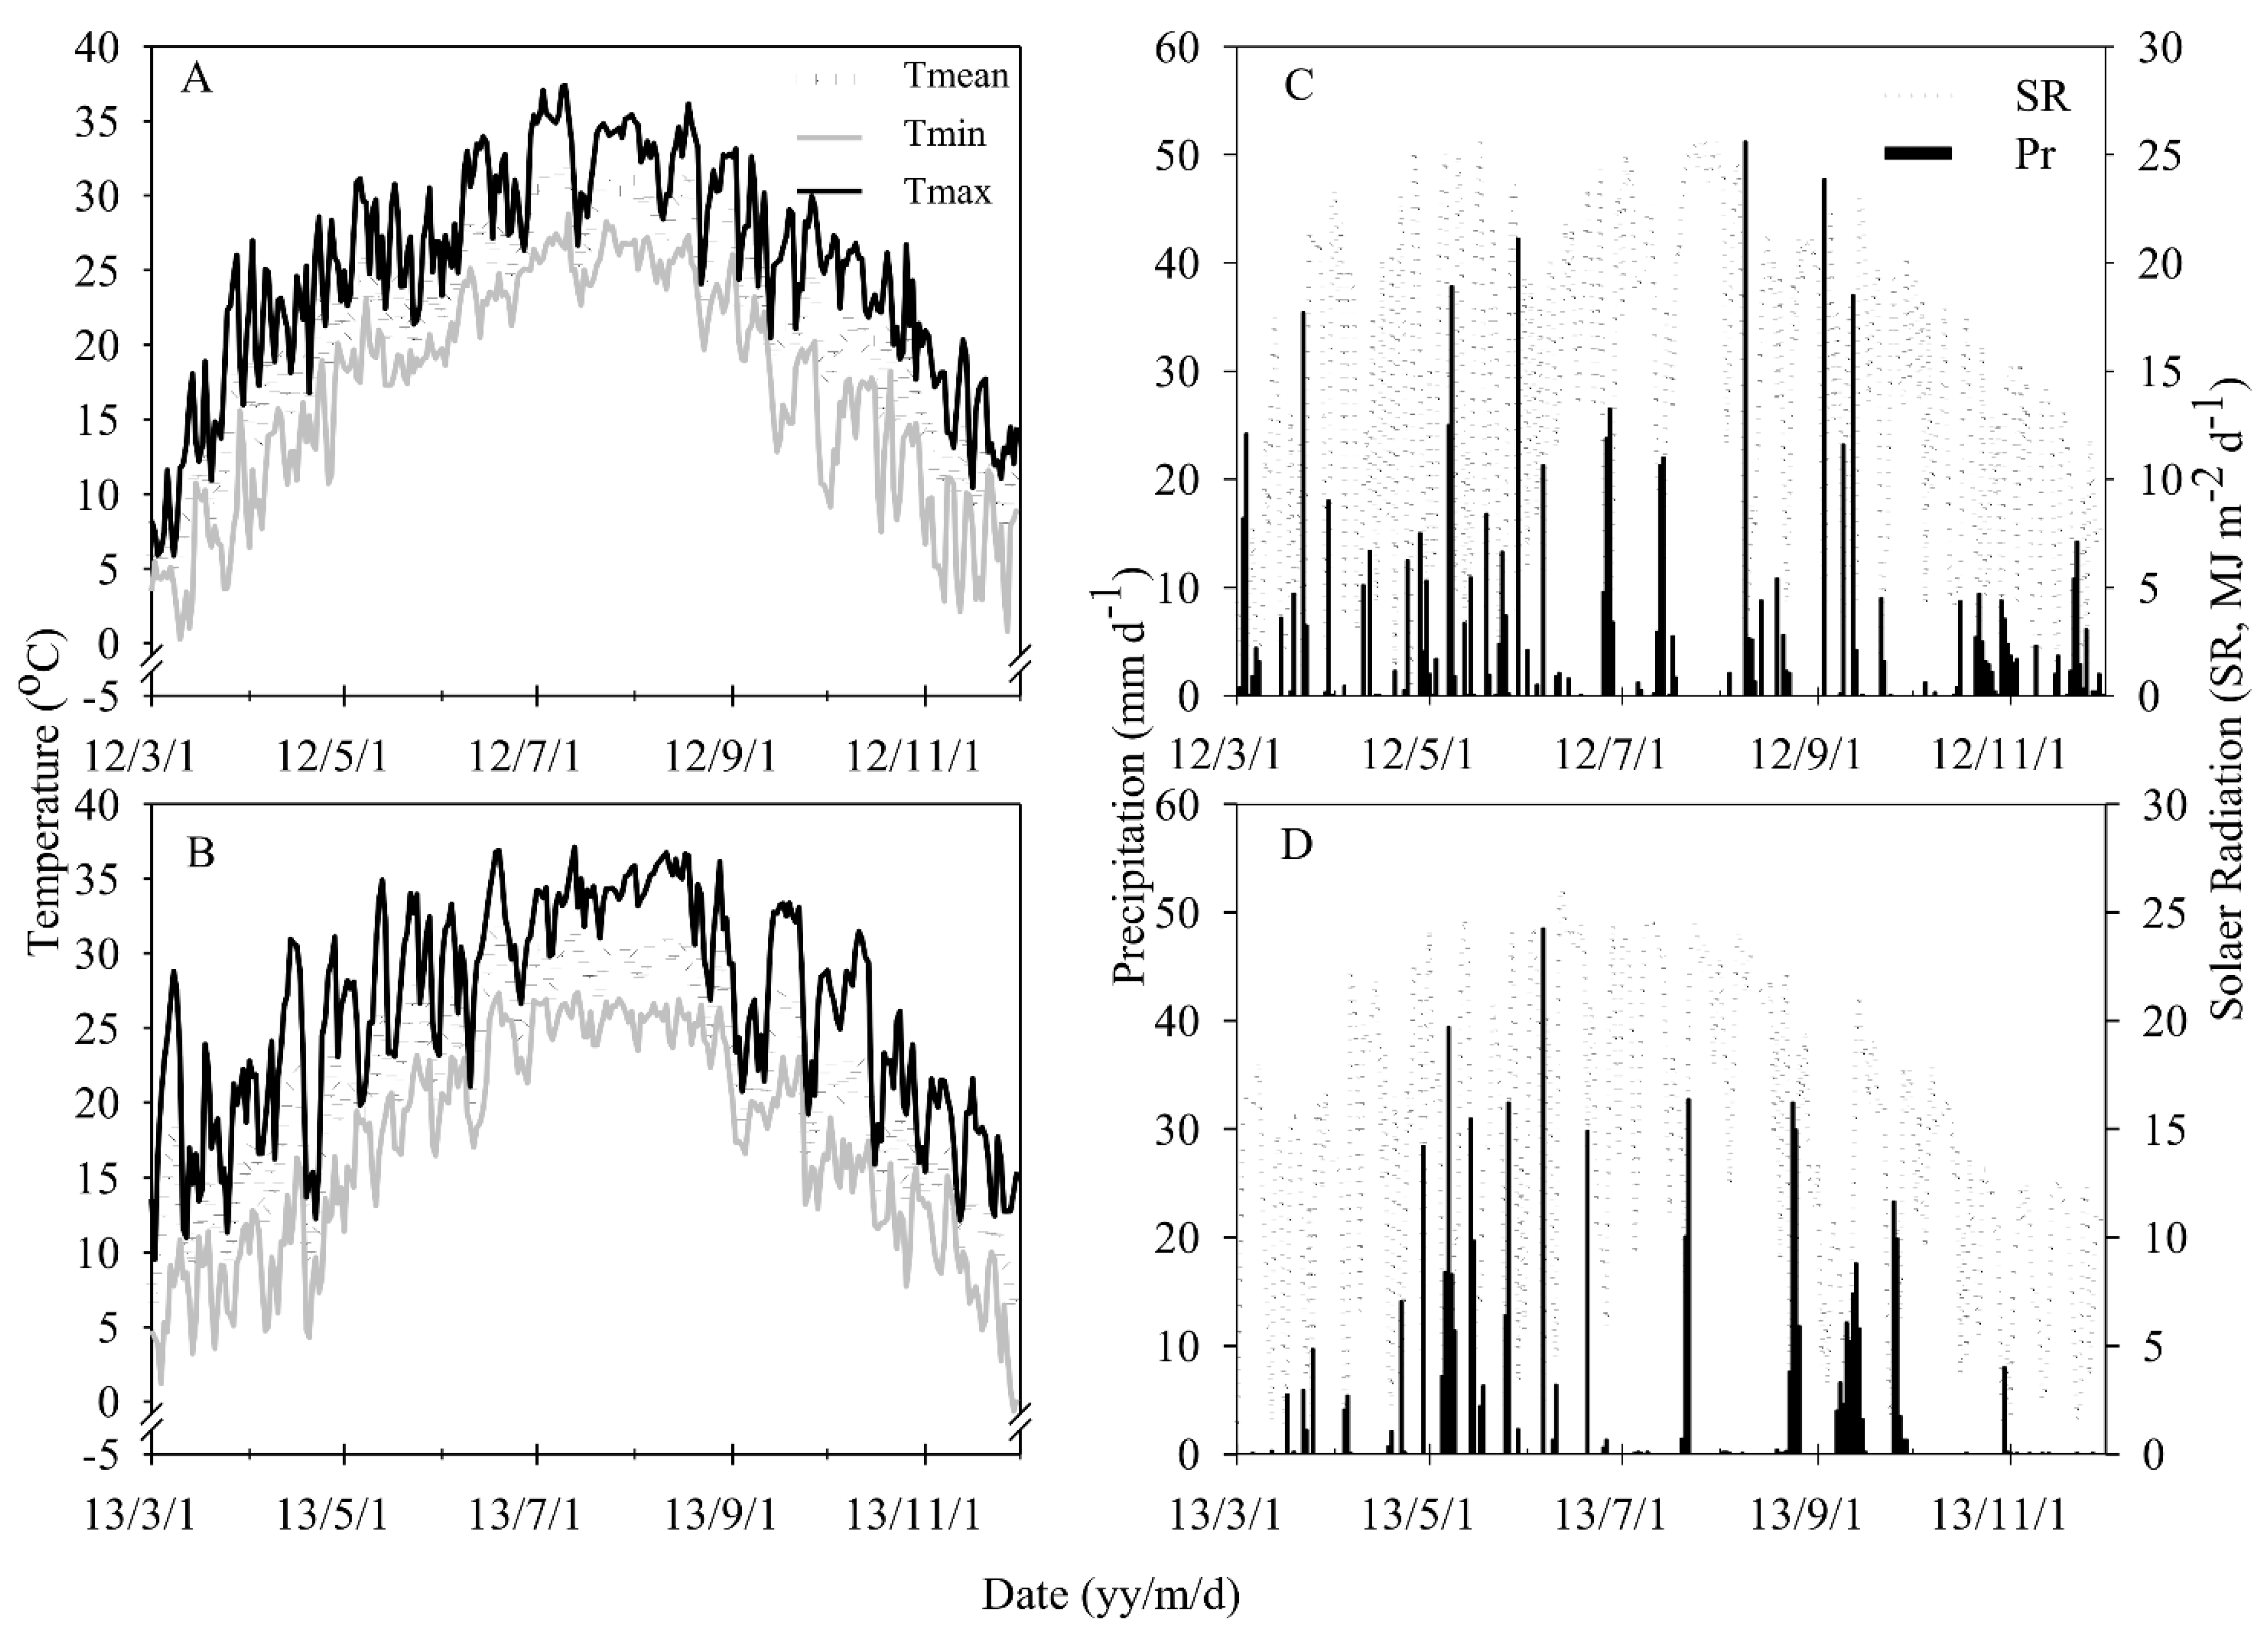
3.1. Calendar Time and Variation in Climatic Factors

There were significant differences in maize the growth duration (GD) and kernel filling duration (KFD) among different seasons across years and varieties (Table 1). The SUM GD was always shortened by 7~16 days and 25~29 days compared to SPM and AUM in 2012 and 2013, respectively, while there were no significant differences according to variety. The SPM and SUM KFDs were almost 20 days shorter than that of AUM (47.2 and 49.2 vs. 69.0 days), however.
Across years and varieties, the average growth degree days for total growth duration (GDDGD) for SUM was 142.3 and 149.8 °Cd higher than SPM and AUM, respectively (Table 2). Across seasons, the GDDGD for ZD958 was always significantly lower than that for DH9 and YD629. Across years and varieties, the mean daily temperature from VE to R6 (MTGD) for SUM was 4.3 and 2.1 °C higher than SPM and AUM, respectively (p < 0.01), resulting in the KDDGD being enhanced by 88.5 and 81.2 °Cd (p < 0.01); however, the mean temperature difference (M△TGD) significantly closed by 0.7~0.9 °C to 7.8 °C. Accumulate solar radiation during growth duration (RaGD) for AUM significantly lower than SPM and SUM by 62.9 and 97.7 MJ m−2 in two years, while the RaGD for ZD958 was reduced by 159.9~204.1 MJ m−2 and 48.6~100.2 MJ m−2 than DH9 and YD629 (p < 0.01), respectively. ZD958 obtained less accumulate precipitation (PrGD) than DH9 and YD 629 from VE to R6 (349.7 vs. 405.4 and 423.4 mm, p < 0.05) in 2012, while SPM acquired more PrGD than SUM and AUM in 2013 (387.8 vs. 260.8 and 250.6 mm, p < 0.01).
The average GDD during the kernel filling duration (GDDKF) for AUM was 142.3 and 200.9 °Cd less than SPM and SUM, respectively, across years and varieties (Table 3). Across seasons, the GDDKF values for ZD958 were 39 °C and 62 °Cd significantly higher than for DH9 and YD629, respectively, in 2013. Across years and varieties, the MTs from R1 to R6 (MTKF) for AUM were 9.0 °C and 9.8 °C lower than SPM and SM (p < 0.01), respectively. There were significantly differences in M△T during kernel filling (M△TKF) among seasons, which for AUM were significantly increased by 1.5~1.9 °C and 0.6~2.0 °C than SPM and SUM, respectively. Both years showed the same tendency in the average KDD during kernel filling (KDDKF) for SUM, in that they were significantly higher than they were for SPM and AUM, and AUM’s KDDKF values were reduced by 109.6 °C and 154.8 °Cd than SPM and SUM, respectively (p < 0.01). The Ra after silking (RaKF) for SUM significantly increased by 125 and 130 MJ m−2 compared to SPM and AUM, respectively, in 2012. There were no significant differences in RaKF between SPM and SUM ((876 and 888 MJ m−2), which were significantly higher than AUM in 2013 (790 MJ m−2). There were no significant differences in Pr during kernel filling across seasons or varieties in two years.

3.2. Grain Yield and Final Kernel Weight

Across seasons and varieties, the SpM GYs were significantly increased by 200.8 and 25.4 g m−2, and 101.7 and 32.6 g m−2 higher than SUM and AUM, respectively, in 2012 and 2013 (Figure 2). The GYs for YD629 were always the lowest compared to ZD958 and DH9 in two years (p < 0.01), while DH9 obtained significantly higher GYs than ZD958 in 2013 (713.3 vs. 814.2 g m−2), across the three seasons.
Across the three varieties, among the three seasons, the AUM KWs were the largest in 2012 (309.3 vs. 287.5 vs. 320.9 mg kernel−1) and 2013 (275.0 vs. 263.3 vs. 346.8 mg kernel−1; p < 0.01; Figure 3). The kernel dry matter accumulation dynamics for ZD958 were always the lowest in SUM, while there were no significant differences in SPM and SUM for DH9 and YD629. The KWs for YD629 were significantly higher than for ZD958 and DH9 in 2012 (322.9 vs. 297.8 and 297.2 mg kernel−1, respectively), while there was a significant difference between ZD958 and DH9 in 2013 (283.3 vs. 305.5 mg kernel−1), across the three seasons.

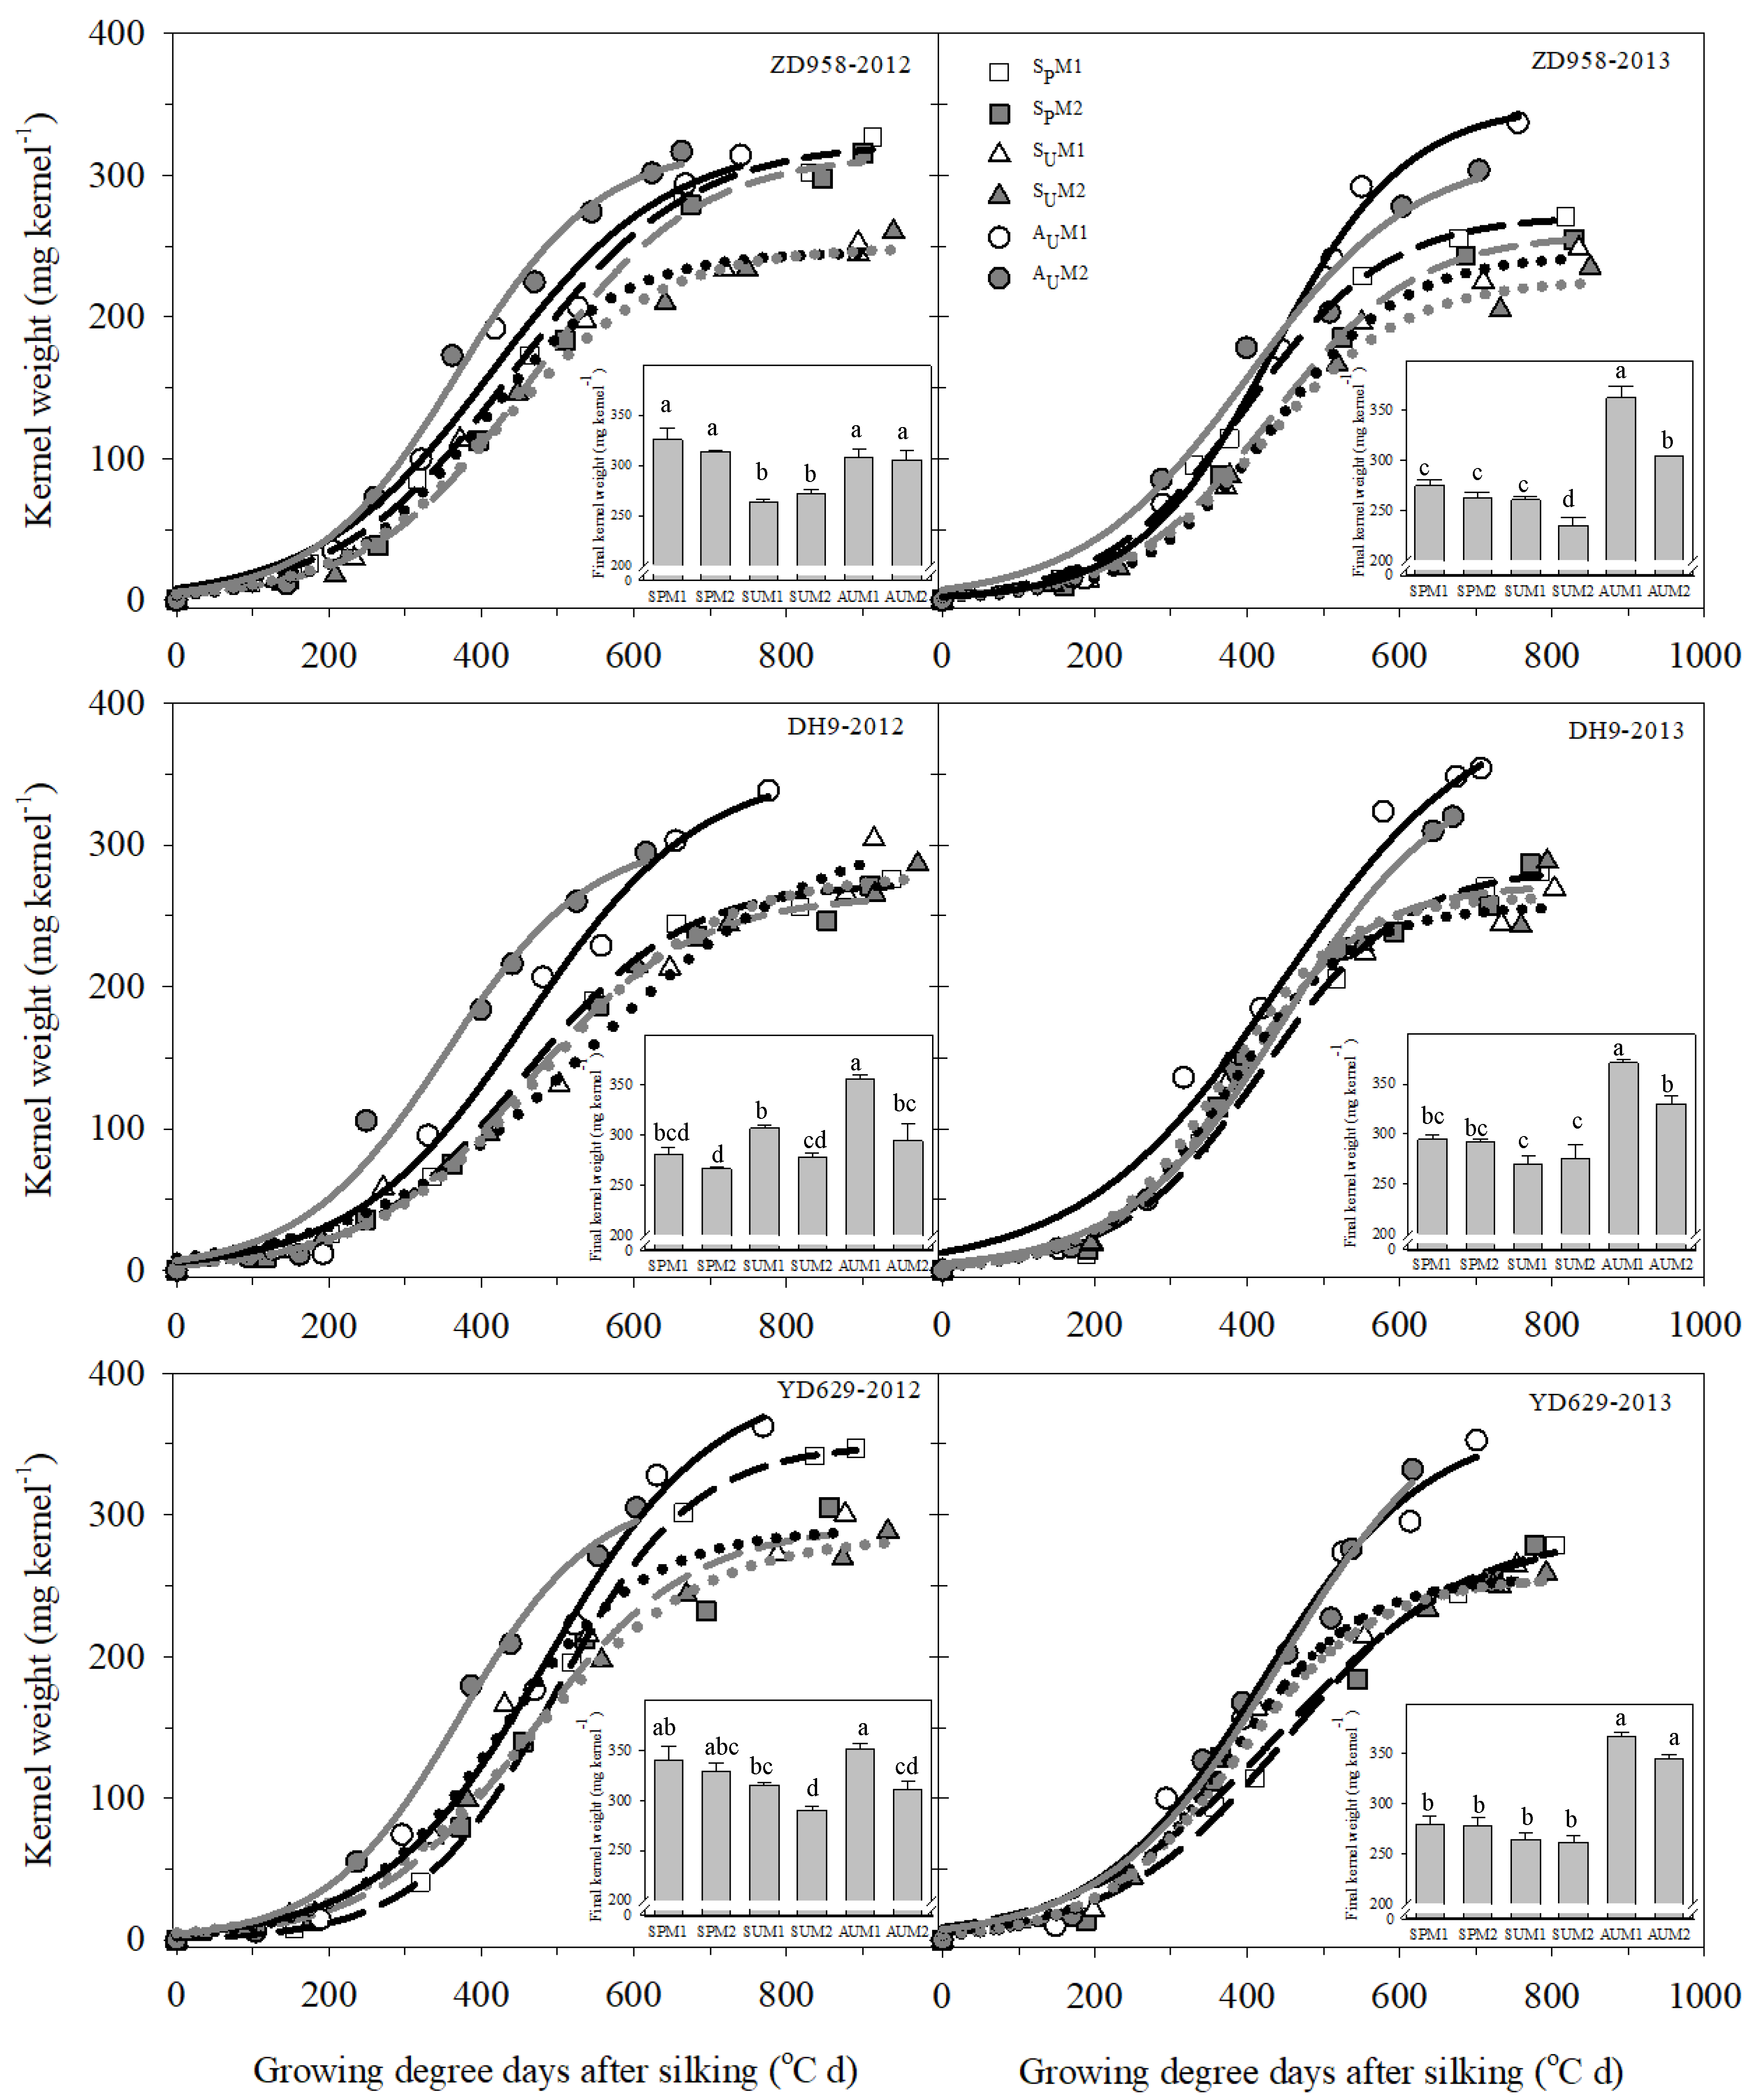
3.3. Maize Kernel Filling Characteristic Parameters

Kernel filling rate (KFR) during the linear kernel filling period (KFRlkf, mg °Cd−1) varied significantly among seasons and varieties only in 2012 (Table 4). We saw the same tendency in KFRlkf among three varieties: SUM’s KFRlkf was significantly lower than that of SPM and AUM in 2012 (p < 0.05); meanwhile, in each season, the KFRlkf values for YD629 were higher than ZD958 and DH9 (p < 0.05). In 2013, AUM obtained the highest KFRlkf among three varieties (p < 0.05), while the KFRlkf for ZD958 in SPM was higher than that of SUM (0.548 vs. 0.462 mg °Cd−1), and that for YD629 was lower in SPM than SUM (0.425 vs. 0.566 mg °Cd−1; p < 0.05). In SPM, YD629’s KFRlkf was lower than that of ZD958 and DH9 (0.425 vs. 0.548 and 0.568 m g °Cd−1; p < 0.05), while the KFRlkf in SUM for ZD958 was the lowest (0.460 vs. 0.563 and 0.566 mg °Cd−1; p < 0.05).
Across varieties, there were significant differences in the GDD for the onset of the linear kernel filling (GDDonset, °Cd) among seasons only in 2012, with no significant differences in 2013 (Table 4). All varieties showed the same tendency, in that SPM had the highest GDDonset compared to SUM and AUMin in 2012 (p < 0.05), while DH9 showed the same tendency in 2013. The GDDonset was lower in AUM for ZD958 and SPM forYD629 than in the other two seasons in 2013 (p < 0.05). In 2012, the GDDonset for YD629 in SUM was lower than in SPM and AUM, and in SUM, the GDDonset values for ZD958 and YD629 were higher than that for DH9 (161 °C and 170 °C vs. 148 °Cd). However, in the SPM, the GDDonset for ZD958 and DH9 was higher than for YD629 (170 °C and 160 °C vs. 108 °Cd; p < 0.05), while ZD958’s GDDonset in SUM and AUM was higher than for the SPM in 2013 (p < 0.05).
There were no significant differences in GDD during linear kernel filling (GDDlkf, °Cd) across the seasons, varieties, and years (Table 4). The variation in the GDDlkf for different varieties among seasons was different in two years. The GDDlkf for ZD958 was lowest during SUM than SPM and AUM in 2012 (462 vs. 555 and 529 °Cd), but it was the highest in 2013 (535 vs. 468 and 488 °Cd). On the contrary, the GDDlkf in SUM was always higher than in SPM and AUM for DH9 (712 vs. 513 and 524 °Cd) and YD629 (528 vs. 451 and 454 °Cd) in 2012, despite being the lowest for DH9 (464 vs. 483 and 557 °Cd) and YD629 (437 vs. 660 and 521 °Cd) in 2013. In SPM and AUM, the GDDlkf values for ZD958 and DH9 were higher than for YD629, while the GDDlkf for ZD958 was lowest, and for DH9, it was the highest in SUM in 2012. In contrast, in 2013, the GDDlkf for ZD958 and DH9 in SPM was lower than YD629, and the GDDlkf for ZD958 was highest in SUM and lowest in AUM.
The GDD at the maximum KFR (GDDKFRmax, °Cd) did not significantly differ among seasons and varieties in 2012, while it was lower in SUM than in SPM and AUM across varieties in 2013 (p < 0.05; Table 4). All varieties showed the same variation in 2012, in that the GDDKFRmax was lower in AUM than in SPM and SUM (p < 0.05), while the GDDKFRmax values in SUM for DH9 and YD629 were lower than in both SPM and AUM in 2013 (p < 0.05). The variation among different varieties during one season showed that the GDDKFRmax values for YD629 in SPM and AUM were higher than ZD958 and DH9 in 2012 (p < 0.05), which had similar values to the SPM in 2013. During SUM, DH9 had the highest GDDKFRmax in 2012; however, this was highest for ZD958 in 2013 (p < 0.05).
The total GDD values for kernel filling duration (GDDmax, °Cd) differed among years, seasons, and varieties. There were no significant differences in the GDDmax among the varieties for SPM and AUM in 2012 or for AUM in 2013. ZD958’s GDDmax was higher in SPM than SUM and AUM in 2012 (723 vs. 622 and 648 °Cd), but that it was highest in SUM in 2013 (717 vs. 637 and 643 °Cd; p < 0.05; Table 4). The variation in the GDDmax during SUM changed for DH9, with it being the highest across three seasons in 2012 (860 vs. 699 and 648 °Cd) but the lowest in 2013 (606 vs. 643 and 689 °Cd). The GDDmax for YD629 in SPM and SUM was higher than in AUM in 2012 (687 vs. 698 and 625 °Cd), whereas in SPM and AUM in 2013, it was higher than in SUM (768 vs. 663 and 584 °Cd). Among varieties, the GDDmax for YD629 was higher than for ZD958 and DH9 in SPM in 2013 (768 vs. 637 and 643 °Cd), while during the SUM season, the GDDmax for DH9 was the highest in 2012 (860 vs. 622 and 698 °Cd), and for ZD958, it was the highest in 2013 (717 vs. 606 and 684 °Cd).

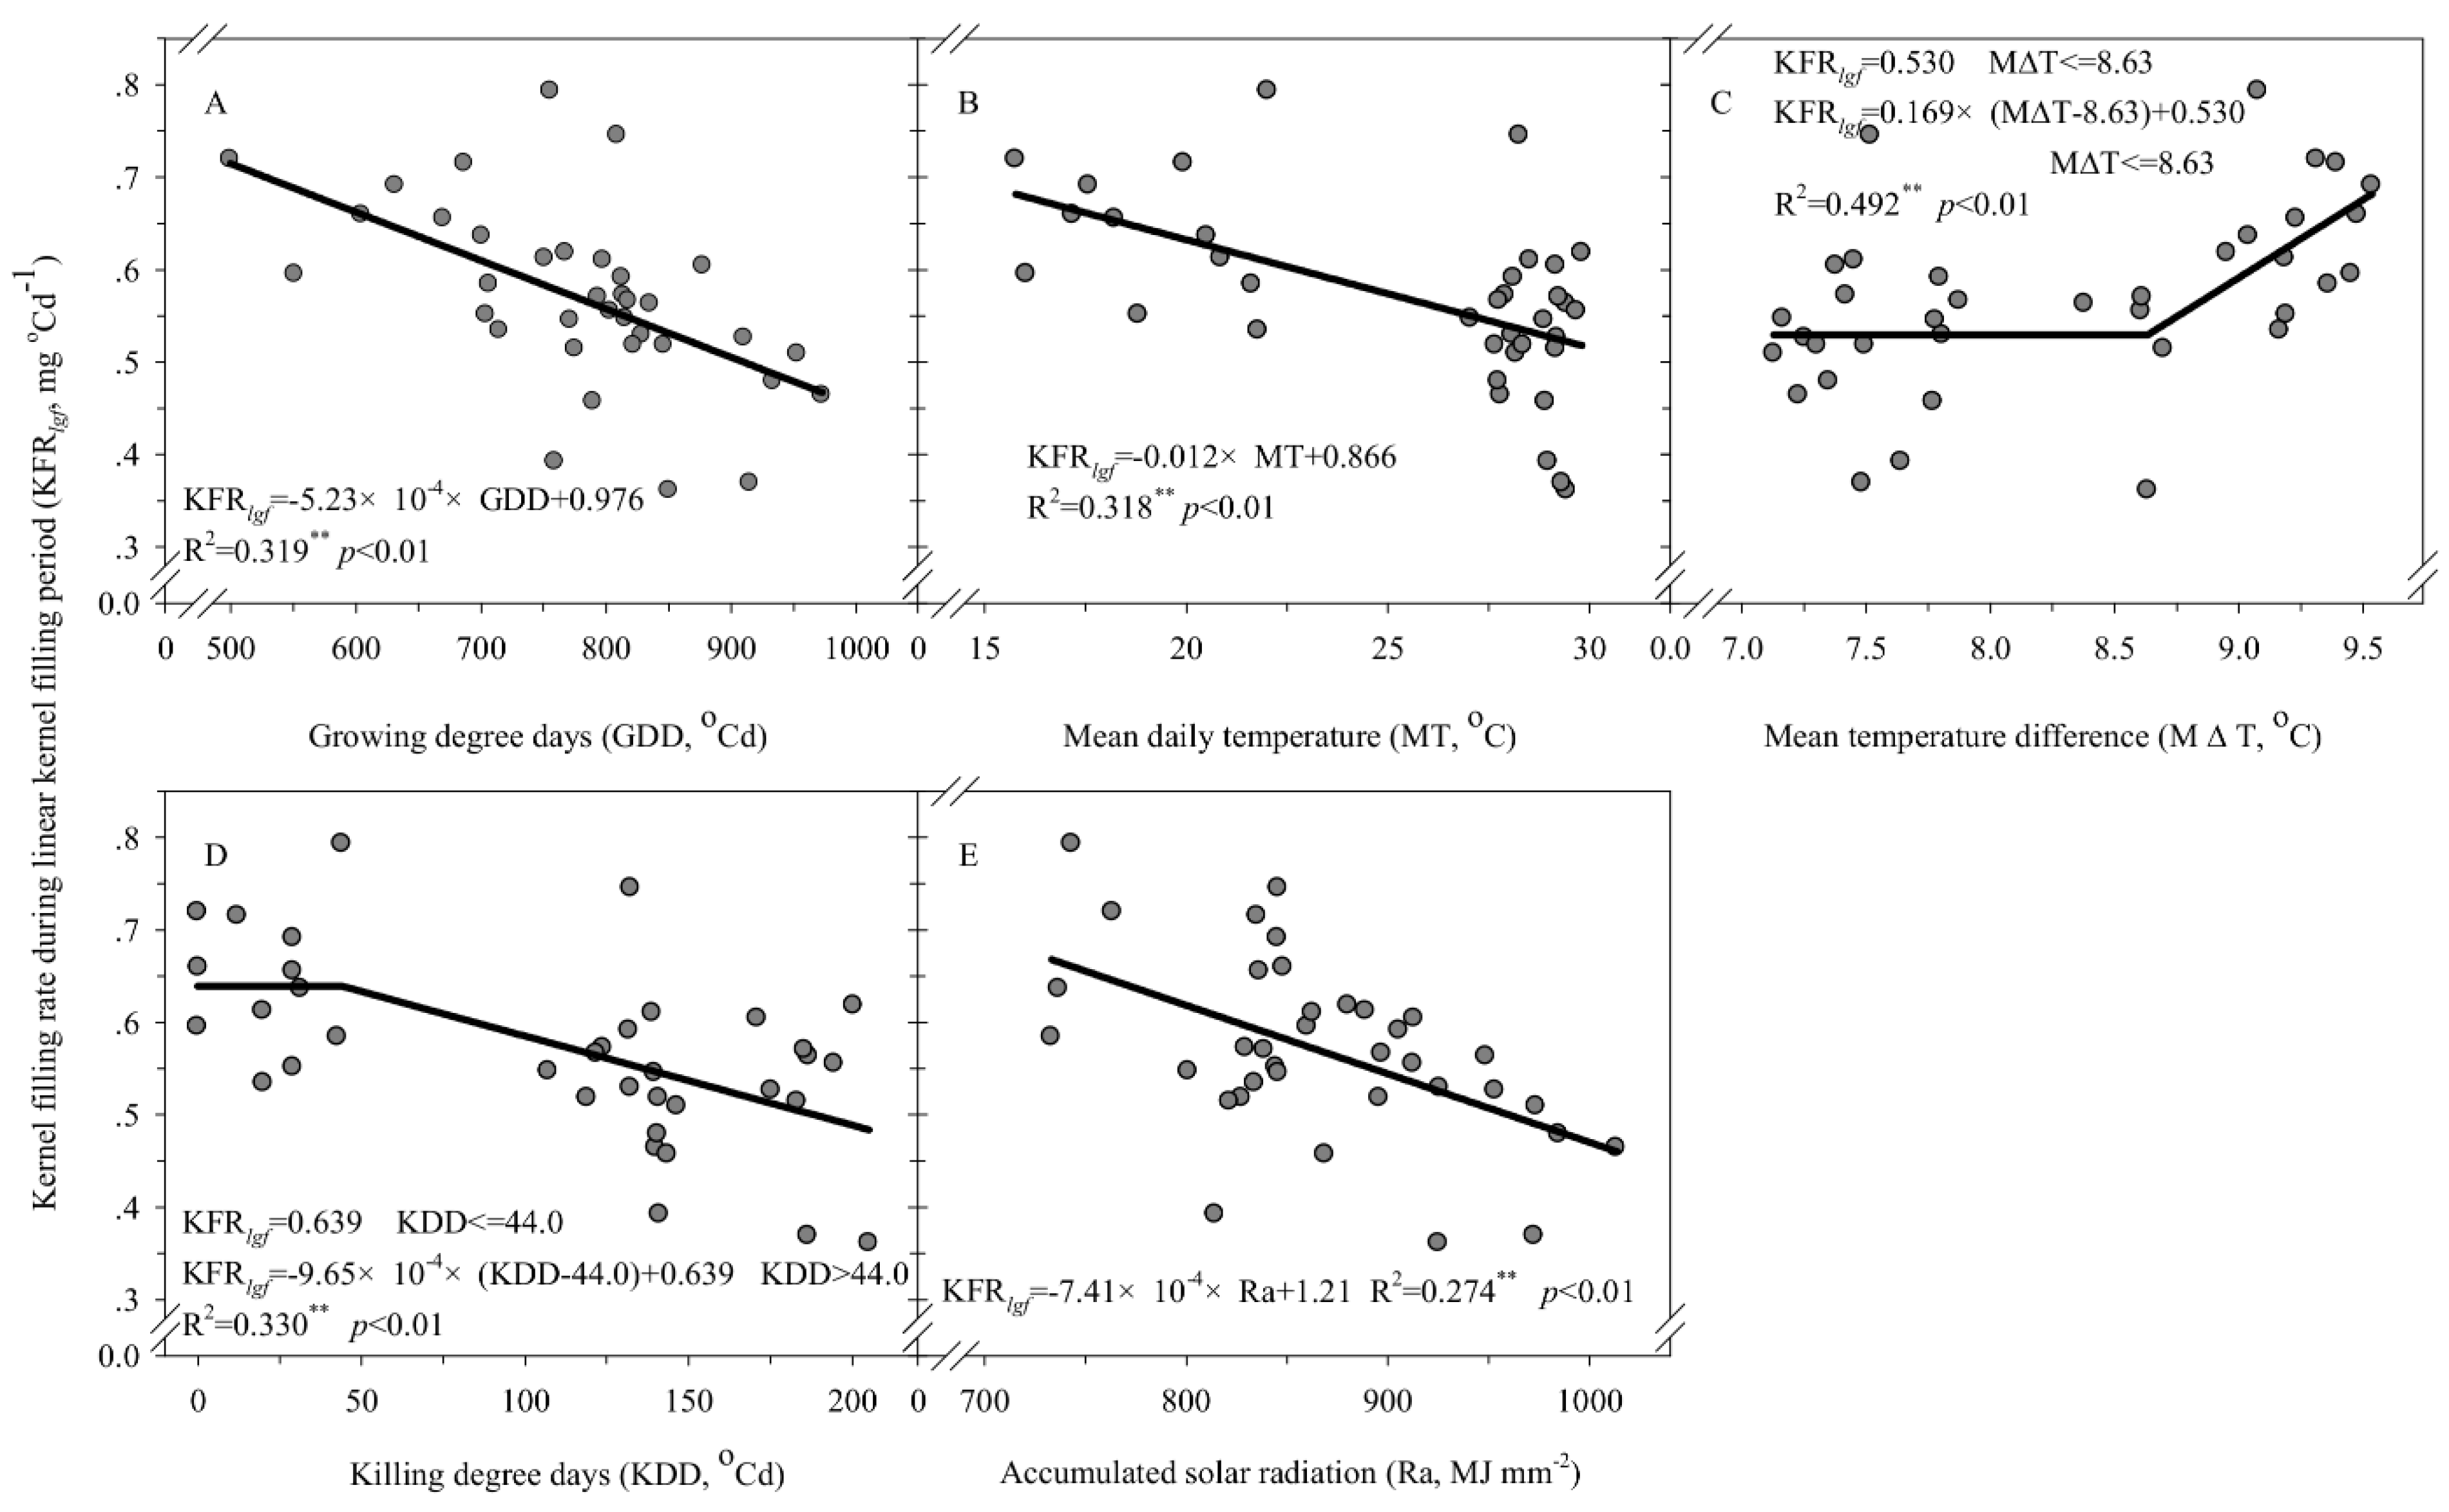
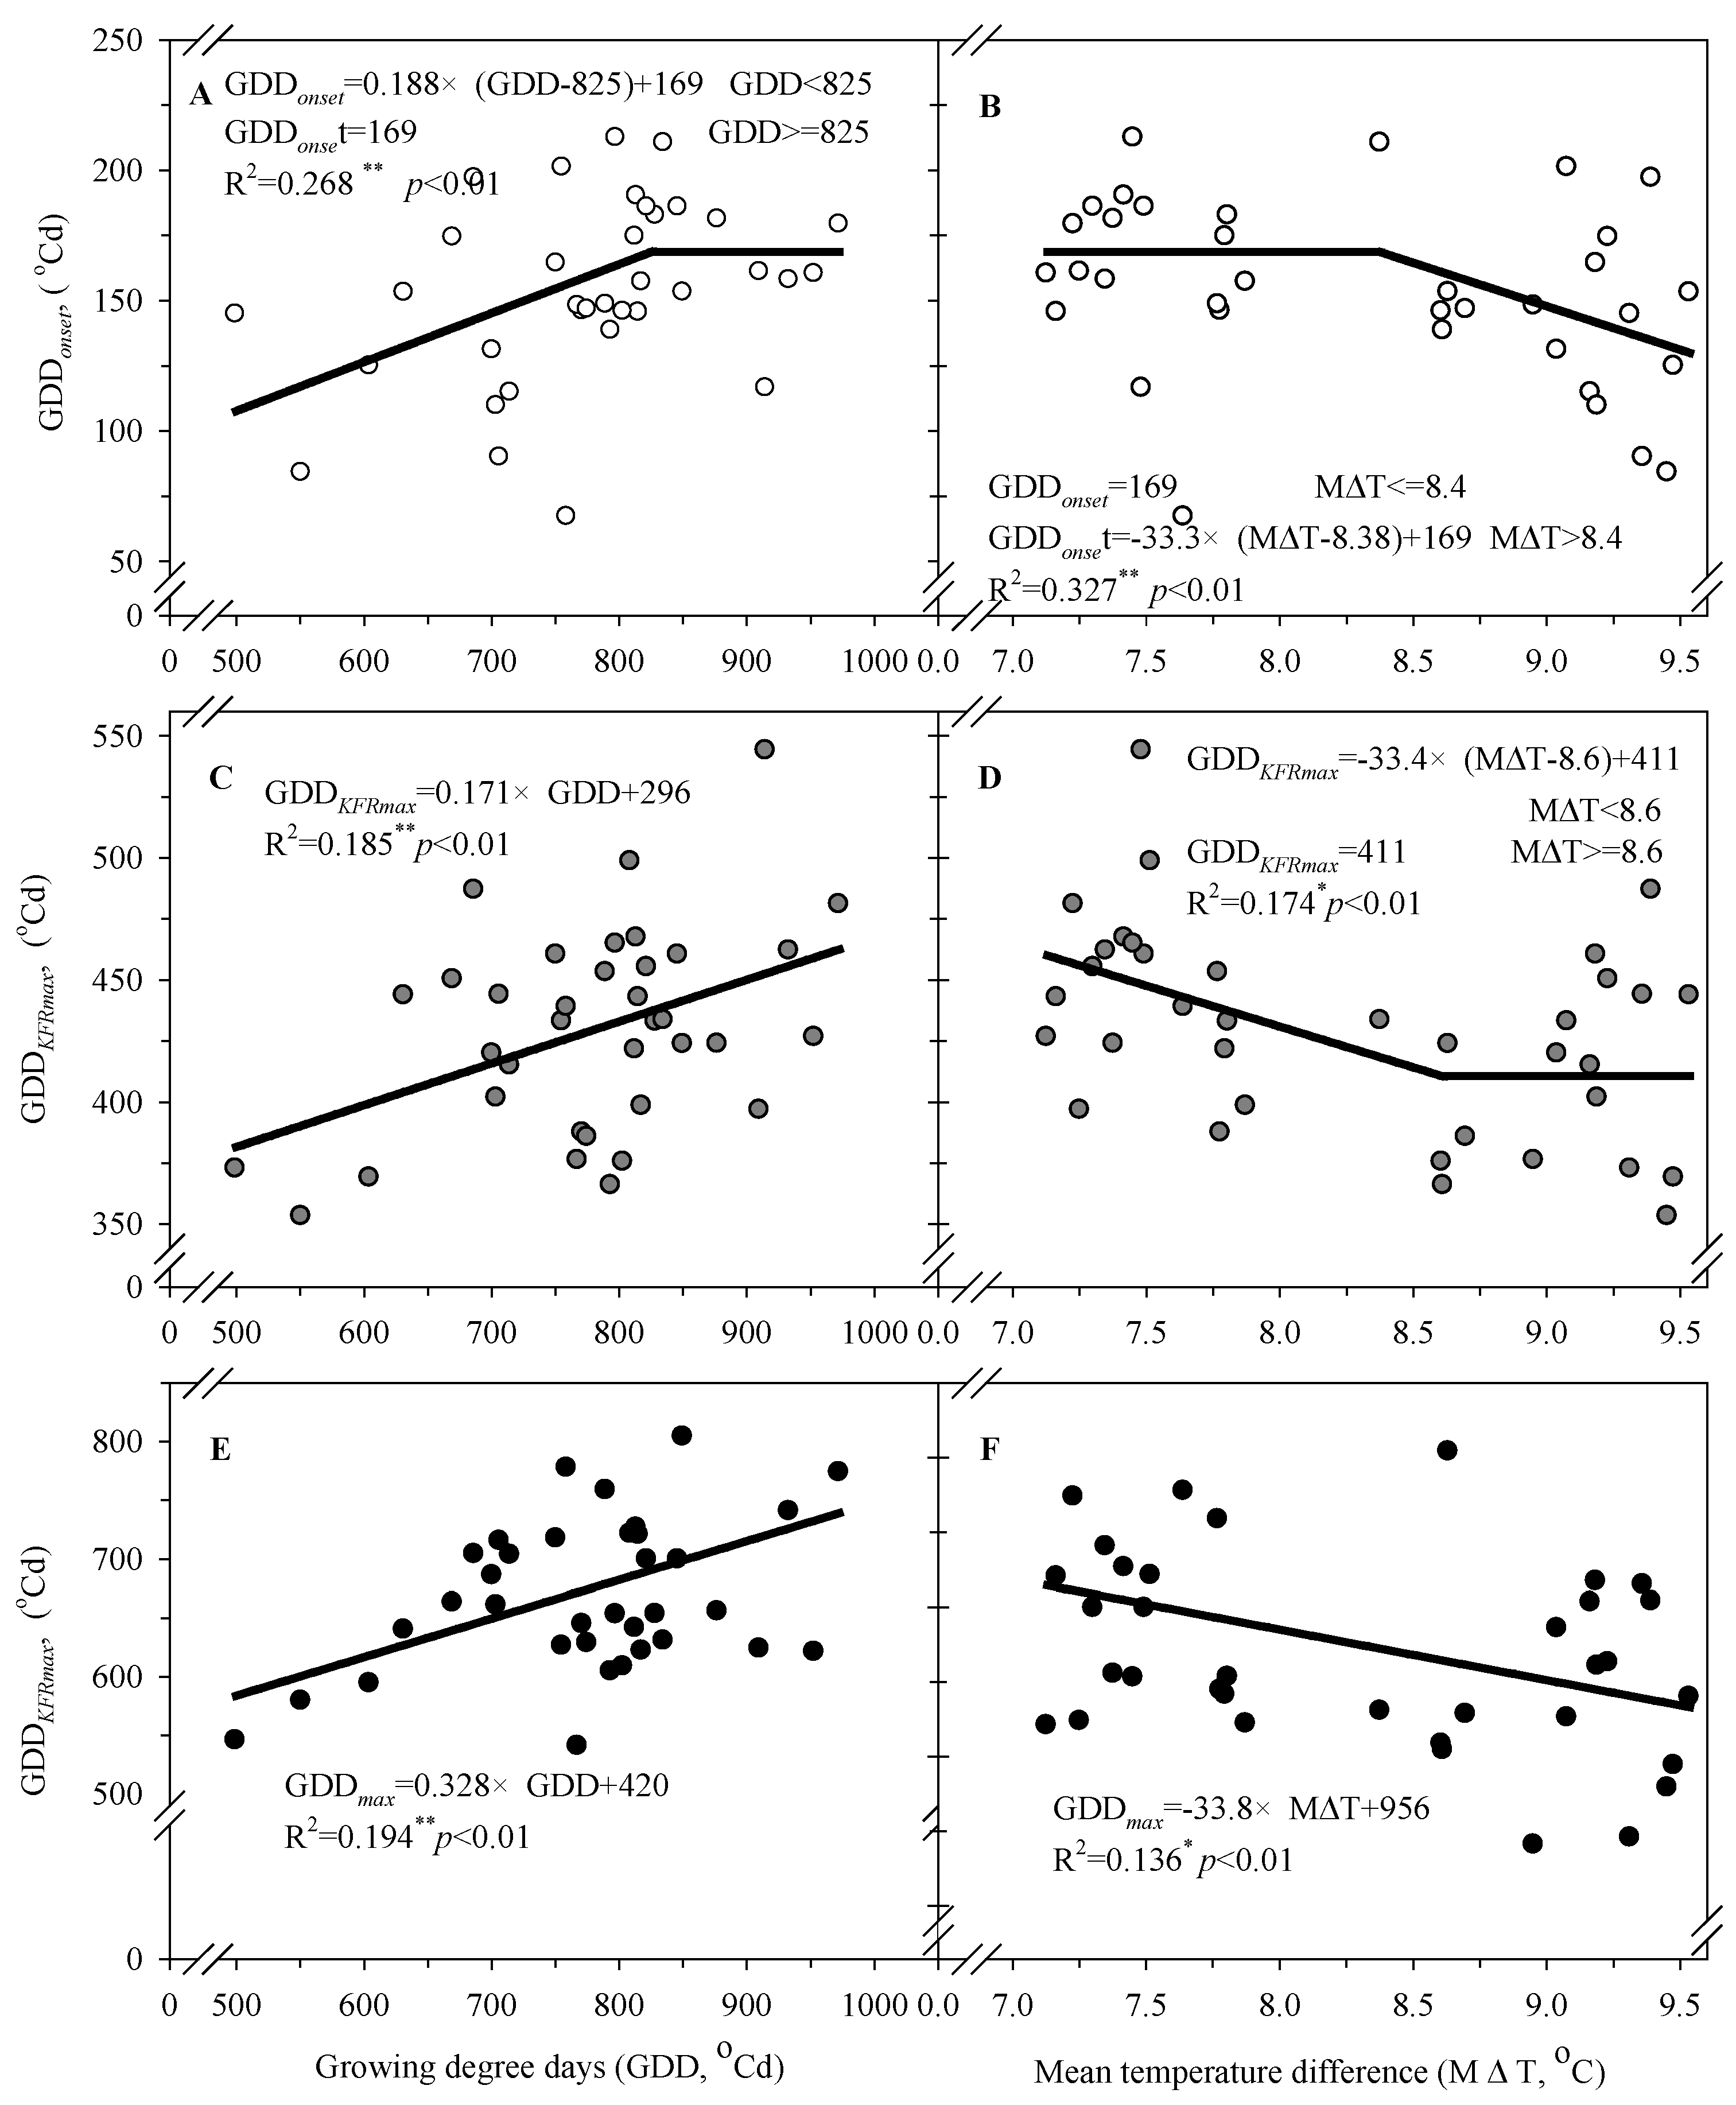
3.4. Relationships among GY, KW, Kernel Filling Characteristic Parameters and Climatic Factors

A correlation analysis was performed to explore how climatic conditions affect the GY, KW, and kernel filling characteristic parameters. The temperature index during maize growth duration, including the GDDGD, MTGD, and KDDGD, always played significantly negative roles on GY, as well as RaGD, while there were no significant correlations between the GY, M△TGD, and PrGD (Table 5). The regression analysis showed that maize’s GY linearly decreased by 0.314 g m−2 and 0.634 g m−2, respectively, when the GDDGD and KDDGD increased by 1 °C d within the studied range (Figure 4A,C). If the MTGD was lower than 25.8 °C, the GY was initially reduced by 42.4 g m−2 for each 1 °C increase, and then the GY was stabilized at 703.5 g m−2 when the MTGD exceeded 25.8 °C (Figure 4 B). The same tendency occurred in GY and RaGD: the GY was higher than 722.5 g m−2 if the RaGD was less than 1805 MJ m−2, and the GY decreased by 0.499 g m−2 (MJ m−2)−1 with RaGD increased (Figure 4D).
During the maize kernel filling stage, the GDDKF, MTKF, KDDKF, and RaKF had significant negative correlations with the KW, whereas the M△TKF and PrKF played significant positive roles (Table 5). The further regression analysis showed a quadratic response of KW to GDDKF and MTKF, with the KW increasing pristinely and then decreasing when the GDDKF and MTKF exceeded 538.4 °Cd and 27 °C, respectively (Figure 5A,B). On the contrary, the KW initially decreased when the M△TKF increased, and then increased steeply when the M△TKF exceeded 8.1 °C (Figure 5C). The KWs were reduced linearly by 0.441 mg kernel−1 for each 1 °Cd increase in KDDKF beyond 44.3 °Cd, especially in SPM and SUM (Figure 5D). The final KW was greater than 273.9 mg kernel−1 if the RaKF was less than 925.3 MJ m−2, and the KW increased by 0.399 mg kernel−1 (MJ m−2)−1 as the RaKF decreased (Figure 5E). The KW exhibited a positive linear relationship with PrKF, with it increasing by 0.338 mg kernel−1 for each 1 mm increase within the studied range (Figure 5F).
The final KW was principally determined by the KFR; the KFRlkf exhibited significant negative correlations with GDDKF, MTKF, KDDKF, and RaKF; and the M△TKF had a significant positive correlation with KFRlkf (Table 5). The regression analysis showed that KFRlkf had significant, linear, negative responses to GDDKF, MTKF, and RaKF. The KFRlkf decreased sharply by 0.0523, 0.012, and 0.0741 mg °C d−1 when the GDDKF, MTKF, and RaKF increased by 100 °Cd, 1 °C, and 100 mm, respectively (Figure 6A,B,E). There were bilinear relationships between the M△TKF, KDDKF, and KFRlkf; the KFRlkf increased by 0.169 mg °Cd−1 for each 1 °C increase in the M△TKF if the M△TKF exceeded 8.63 °Cd (Figure 6C), but when the KDDKF was greater than 44.0 °Cd, the KFRlkf decreased by 0.0965 mg °C d−1 for each 100 °Cd increase in the KDDKF (Figure 6D).
Moreover, the GDDKF had significant positive effects on the GDDonset, GDDKFRmax, and GDDmax, which were significantly and negatively affected by the MTKF. The GDDlkf had no relationships with any climatic factors (Table 5). When the GDDKF increased by 1 °Cd, the GDDonset, GDDKFRmax, and GDDmax increased linearly by 0.188 °C, 0.171 °C, and 0.328 °Cd, respectively, and the GDDonset values were stabilized if the GDDKF values were higher than 825 °Cd, (Figure 7A,C,E). The GDDonset stabilized at 169 °Cd if the M△TKF was less than 8.4 °C, and then it decreased by 33.3 °Cd when the M△TKF increased by 1 °C (Figure 7B). However, the GDDKFRmax decreased by 33.4 °Cd for each 1 °Cd increase in the M△TKF if the M△TKF was lower than 8.6 °C (Figure 7D), while with each 1 °Cd increase in the M△TKF GDDmax always decreased linearly by 33.8 °Cd (Figure 7F).

4. Discussion

With global climate change, the mean temperature has increased by 1.2 °C since 1960, [44] and the severity of drought stress has increased [45]; together, the climate change and drought stress cause negative effects on maize due to more frequent extreme climatic conditions [46,47], which have a significant influence on maize kernel filling and yield [47]. In Hou et al.’s studies, the maize yield was reduced by 0.83 t ha−1°C−1 with the mean temperature increase in different maize regions of China [6]. Therefore, clarifying the impacts of climatic conditions on maize yield and KW after pollination is vital, which will aid the expansion of breeding and targeted management strategies. Maize growth duration is determined by the variation in weather conditions and each variety’s growth degree days requirements [48,49]. Our results show that the GD and KFD lengthen when the planting date is delayed due to the lower MTKF and GDDKF requirements; these results confirmed the findings of studies on the North China Plain and in Central China that maize growth duration is shortened by increased temperature [2,35,50]. Moreover, in our study, we found that high-temperature stress (KDDKF) occurs more frequently in SUM kernel filling duration possibly because of the higher RaKF, while M△TKF and PrKF are increased when the planting date is delayed.
The maize grain yield is controlled by the kernel number per unit area and individual KW [51,52]; the kernel number decreased by 42–77% under drought stress from tassel emergence to 6 days after silking [53], and the maize yield decreased by 0.85 t ha−1 with accumulated photosynthetically active radiation reduced by 100 MJ [6]. The different planting date is an effective approach to examine the climatic conditions’ effects on maize growth and KW, without variation in the soil environment [5,13,34]. Our results showed that SPM always obtained a higher GY than SUM and AUM, and SUM GY always obtained the lowest in Central China, because the higher GDDGD, MTGD, and KDDGD during SUM growth duration had a significantly negative impact on GY, especially the higher temperature stress result in lowest KW for SUM. The results were confirmed by that, the temperature increased with the plant date delayed, which resulted in maize GY redcued New Mexico State, US [5], and the SUM‘s GY was highest due to the suitable climatic conditions in the North China Plain [35].
Under drought stress and higher temperature stress, maize’s KW was reduced by 5.0–11.0% and 18.0–37.6% in the field and the laboratory, respectively [20]; the kernel number decreased by 42–77% under drought stress after silking [53]. The kernel numbers were constant for different planting dates, indicating that KW is the dominant factor for GY on the North China Plain [35]; however, in a previous report, we found that the kernel number and KW are equally important for GY in Central China [2]. Maize KW is determined by the combination of KFR and linear KFD [8,10,11], which always vary according to the weather conditions [5,54]. In the present study, the KW was lowest for SUM and highest for AUM. The maize linear kernel filling period (KFRlkf) and KFD initially declined and then increased with the planting date; in contrast, GDDKF exhibited the opposite tendency. These findings are not consistent with previous studies, which found that KW decreases linearly with the planting date in temperate regions [11,13] and initially increased and then decreased in cool regions and on the North China Plain [35,55]. These findings might be explained by three factors: firstly, SUM has a shorter KFD than AUM; secondly, thermal parameters, such as GDDKF, MTKF, and KDDKF, and RaKF affect KW negatively; and finally, KW exhibits positive relationships with M△TKF and PrKF. All of these effects affirm that the maize KW is closely related to the KFR during the linear kernel filling period [8,11,56], and the KW decreases when the KFD is shortened by drought stress [32,54]; plant time delays always especially reduce negative drought effects on the KFR and KW in temperate Argentina [57], and it has been confirmed that there is no relationship with Pr in irrigated systems [35].
The maize kernel filling progress was determined by the dry matter supplied from the source [58] and was expressed by different kernel filling parameters [59], which always relate to the climatic conditions during KFD, especially the effective KFD [7,9,60]. The kernel growth rate correlates with temperature and temperature range, and the effective grain-filling period correlates with accumulated temperature and Ra on the North China Plain [35]. According to our regression analyses, KFRlkf exhibits significant negative correlations with GDDKF, MTKF, KDDKF, and RaKF. In addition, KFRlkf increases by 0.169 mg °Cd−1 for each 1 °C increase when M△TKF is larger than 8.63 °Cd. This finding confirms that KFR is the main factor affecting KW, thus leading us to conclude that maize KW was determined by KFR and the duration of the phases [61]. Moreover, GDDKF has positive linear relationships with GDDonset, GDDKFRmax, and GDDmax, while MTKF has a negative relationship. This is because high-temperature stress may be caused by higher Ra in SUM after silking, thus reducing the amount of radiation that can be used for photosynthesis, and therefore a shorter KFD [11,20], while less Pr causes drought stress in Central China [7,32], thereby decreasing KW. These findings are consistent with those of previous studies [13,35].

5. Conclusions

Our study demonstrated that, during SUM growth and the kernel filling duration, there were higher temperatures, which resulted in more GDDs than for SPM and AUM, and there were a greater number of KDDs, while after silking, SPM and SUM obtained higher GDDs and seriously higher KDDs than AUM. GDD, MT, and Ra played significantly negative roles on KFRlkf, resulted in SUM KW were the lowest and AUM KW were the highest. Therefore, the GY linearly decreased, while GDD, KDD, MT, and Ra increased, respectively. We conclude that the different seasons of maize GY manifestations of the SPM were highest, and for SUM, they were the lowest; therefore, farmers should plant SPM first and then AUM in an attempt to minimize plant SUM in Central China.

Author Contributions

Funding acquisition and conceiving and designing the experiment, J.G., B.Z. and C.C. (Chuanyong Chen); data collection and writing—original draft, J.G. and Y.X.; writing—review and editing, M.Z. (Ming Zhan), C.C. (Cougui Cao), and M.Z. (Ming Zhao). All authors have read and agreed to the published version of the manuscript.

Funding

This work was funded by the National Natural Science Foundation of China (31701378), and the Key National Research and Development Program of China (2017YFD0300305).

Data Availability Statement

Not applicable.

Conflicts of Interest

The authors declare no conflict of interest.

References

  1. FAO. 2020. Available online: https://www.fao.org/faostat/en/#data/QCL/visualize (accessed on 25 June 2022).
  2. Ge, J.Z.; Xu, Y.; Zhong, X.Y.; Li, S.Y.; Tian, S.Y.; Yuan, G.Y.; Cao, C.G.; Zhan, M.; Zhao, M. Climatic Conditions varied by planting date affects maize yield in central China. Agron. J. 2016, 108, 966–977. [Google Scholar] [CrossRef]
  3. Hou, P.; Liu, Y.; Liu, W.; Liu, G.; Xie, R.; Wang, K.; Ming, B.; Wang, Y.; Zhao, R.; Zhang, W.; et al. How to increase maize production without extra nitrogen input. Resour. Conserv. Recycl. 2020, 160, 104913. [Google Scholar] [CrossRef]
  4. Liu, Y.E.; Hou, P.; Huang, G.R.; Zhong, X.L.; Li, H.R.; Zhao, J.R.; Li, S.K.; Mei, X.R. Maize grain yield and water use efficiency in relation to climatic factors and plant population in northern China. J. Integr. Agric. 2021, 20, 156–3169. [Google Scholar] [CrossRef]
  5. Djaman, K.; Allen, S.; Djaman, S.D.; Koudahe, K.; Irmak, S.; Puppala, N.; Darapuneni, K.M.; Angadi, V.S. Planting date and plant density effects on maize growth, yield and water use efficiency. Environ. Chall. 2022, 6, 100417. [Google Scholar] [CrossRef]
  6. Hou, P.; Liu, Y.E.; Liu, W.M.; Yang, H.S.; Xie, R.Z.; Wang, K.R.; Ming, B.; Liu, G.Z.; Xue, J.; Wang, Y.H.; et al. Quantifying maize grain yield losses caused by climate change based on extensive field data across China. Resour. Conserv. Recycl. 2021, 174, 105811. [Google Scholar] [CrossRef]
  7. Li, E.; Zhao, J.; Pullens, J.W.M.; Yang, X.G. The compound effects of drought and high temperature stresses will be the main constraints on maize yield in Northeast China. Sci. Total Environ. 2022, 812, 152461. [Google Scholar] [CrossRef]
  8. Borrás, L.; Gambín, B.L. Trait dissection of maize kernel weight: Towards integrating hierarchical scales using a plant growth approach. Field Crop. Res. 2010, 118, 1–12. [Google Scholar] [CrossRef]
  9. Beruski, G.C.; Schiebelbein, L.M.; Pereira, A.B. Maize yield components as affected by plant population, planting date, crop growing season and soil coverings in Brazil. Agriculture 2020, 10, 579. [Google Scholar] [CrossRef]
  10. Sala, R.G.; Westgate, M.E.; Andrade, F.H. Source/sink ratio and the relation-ship between maximum water content, maximum volume, and final dry weight of maize kernels. Field Crop. Res. 2007, 101, 19–25. [Google Scholar] [CrossRef]
  11. Chazarreta, Y.D.; Amas, J.I.; Otegui, M.E. Kernel filling and desiccation in temperate maize: Breeding and environmental effects. Field Crop. Res. 2022, 271, 108733. [Google Scholar] [CrossRef]
  12. Liu, Y.E.; Hou, P.; Xie, R.Z.; Li, S.K.; Mei, X.R. Spatial variation in the utilization efficiency of accumulated temperature for maize and measures to efficiently use it in China. Crop Sci. 2015, 55, 1806–1817. [Google Scholar] [CrossRef]
  13. Cirilo, A.G.; Anddrade, F.H. Sowing date and kernel weight in maize. Crop Sci. 1996, 36, 325–331. [Google Scholar] [CrossRef]
  14. Commuri, P.D.; Jones, R.J. Ultra structural characterization of maize (Zea mays L.) kernels exposed to high temperature during endosperm cell division. Plant Cell Environ. 1999, 22, 375–385. [Google Scholar] [CrossRef]
  15. Greaves, J.A. Improving suboptimal temperature tolerance in maize—The search for variation. J. Exp. Bot. 1996, 3, 307–323. [Google Scholar] [CrossRef]
  16. Ying, J.; Lee, E.A.; Tollenaar, M. Response of maize leaf photosynthesis to low temperature during the grain-filling period. Field Crop. Res. 2000, 68, 87–96. [Google Scholar] [CrossRef]
  17. Zhang, Y.; Dai, J.Y.; Su, Z.S. Damage of low temperature during grain filling stage on maize grain. Acta Agron. Sin. 1995, 21, 71–76. [Google Scholar]
  18. Killi, D.; Bussotti, F.; Raschi, A.; Haworth, M. Adaptation to high temperature mitigates the impact of water deficit during combined heat and drought stress in C3 sunflower and C4 maize varieties with contrasting drought tolerance. Physiol. Plant. 2017, 159, 130–147. [Google Scholar] [CrossRef]
  19. Killi, D.; Raschi, A.; Bussotti, F. Lipid peroxidation and chlorophyll fluorescence of photosystem ii performance during drought and heat stress is associated with the antioxidant capacities of C3 sunflower and C4 maize varieties. Int. J. Mol. Sci. 2020, 21, 44846. [Google Scholar] [CrossRef]
  20. Liu, X.W.; Yu, Y.H.; Huang, S.B.; Xu, C.C.; Wang, X.; Gao, J.; Meng, Q.F.; Wang, P. The impact of drought and heat stress at flowering on maize kernel filling: Insights from the field and laboratory. Agric. For. Meteorol. 2022, 312, 108733. [Google Scholar] [CrossRef]
  21. Muchow, R.C. Effect of high temperature on grain growth in field grown maize. Field Crop. Res. 1990, 23, 145–158. [Google Scholar] [CrossRef]
  22. Muchow, R.C.; Sinclair, T.R.; Bennett, J.M. Temperature and solar radiation effects on potential maize yield across locations. Agron. J. 1990, 82, 338–343. [Google Scholar] [CrossRef]
  23. Liu, X.W.; Wang, X.L.; Wang, X.Y.; Gao, J.; Meng, Q.F.; Wang, P. Dissecting the critical stage in the response of maize kernel set to individual and combined drought and heat stress around flowering. Environ. Exp. Bot. 2020, 179, 104213. [Google Scholar] [CrossRef]
  24. Lindquist, J.L.; Arkebauer, T.J.; Walters, D.T.; Cassman, K.G.; Dobermann, A. Maize radiation use efficiency under optimal growth conditions. Agron. J. 2005, 97, 72–78. [Google Scholar] [CrossRef]
  25. Chen, C.; Baethgen, W.E.; Robertson, A. Contributions of individual variation in temperature, solar radiation and precipitation to crop yield in the North China Plain: 1961–2003. Clim. Change 2013, 116, 767–788. [Google Scholar] [CrossRef]
  26. Yang, Y.S.; Guo, X.X.; Liu, G.Z.; Liu, W.M.; Xue, J.; Ming, B.; Xie, R.Z.; Wang, K.R.; Hou, P.; Li, S.K. Solar radiation effects on dry matter accumulations and transfer in maize. Front. Plant Sci. 2021, 12, 1927. [Google Scholar] [CrossRef]
  27. Feng, L.Y.; Raza, M.A.; Chen, Y.; Khalid, M.H.B.; Meraj, T.A.; Ahsan, F.; Fan, Y.; Du, J.; Wu, X.; Song, C.; et al. Narrow-wide row planting pattern improves the light environment and seed yields of intercrop species in relay intercropping system. PLoS ONE 2019, 14, e0212885. [Google Scholar] [CrossRef]
  28. Gao, Z.; Sun, L.; Ren, J.H.; Liang, X.G.; Shen, S.; Lin, S.; Zhao, X.; Chen, X.M.; Wu, G.; Zhou, S.L. Detasseling increases kernel number in maize under shade stress. Agri. Forest Meteorol. 2019, 280, 107811. [Google Scholar] [CrossRef]
  29. Guo, X.X.; Yang, Y.S.; Liu, H.F.; Liu, G.Z.; Liu, W.M.; Wang, Y.H.; Zhao, R.L.; Ming, B.; Xie, R.Z.; Wang, K.R.; et al. Effects of solar radiation on root and shoot growth of maize and the quantitative relationship between them. Crop. Sci. 2020, 61, 1414–1425. [Google Scholar] [CrossRef]
  30. Almaraz, J.J.; Mabood, F.; Zhou, X.; Gregorich, E.G.; Smith, D.L. Climate change, weather variability and corn yield at a higher latitude locale: Southwestern Quebec. Clim. Change 2008, 88, 187–197. [Google Scholar] [CrossRef]
  31. Zhou, H.L.; Zhou, G.S.; He, Q.J.; Zhou, L.; Ji, Y.H.; Zhou, M.Z. Environmental explanation of maize specific leaf area under varying water stress regimes. Environ. Exp. Bot. 2019, 171, 103932. [Google Scholar] [CrossRef]
  32. Wossen, T.; Abdoulaye, T.; Alene, A.; Feleke, S.; Menkir, A.; Manyong, V. Measuring the impacts of adaptation strategies to drought stress: The case of drought tolerant maize varieties. J. Environ. Manag. 2017, 203, 106–113. [Google Scholar] [CrossRef] [PubMed]
  33. Huang, C.; Gao, Y.; Qin, A.Z.; Liu, Z.G.; Zhao, B.; Ning, D.F.; Ma, S.T.; Duan, A.W.; Liu, Z.D. Effects of waterlogging at different stages and durations on maize growth and grain yields. Agric. Water Manag. 2022, 261, 107334. [Google Scholar] [CrossRef]
  34. Cirilo, A.G.; Anddrade, F.H. Sowing Date and Maize Productivity: I. Crop growth and dry matter partitioning. Crop Sci. 1994, 34, 1039–1043. [Google Scholar] [CrossRef]
  35. Zhou, B.Y.; Yue, Y.; Sun, X.F.; Ding, Z.S.; Ma, W.; Zhao, M. Maize kernel weight responses to sowing date-associated variation in weather conditions. Crop J. 2017, 5, 43–51. [Google Scholar] [CrossRef]
  36. Dahmardeh, M. The effect of sowing date and some growth physiological index on grain yield in three maize hybrids in southeastern Iran. Asian J. Plant Sci. 2010, 9, 432–436. [Google Scholar] [CrossRef]
  37. Gambín, B.L.; Borrás, L.; Otegui, M.E. Source–sink relations and kernel weight differences in maize temperate hybrids. Field Crop. Res. 2006, 95, 316–326. [Google Scholar] [CrossRef]
  38. Mcmaster, G.S.; Wilhelm, W.W. Growing degree days: One equation, two interpretations. Agric. Forest Meteorol. 1997, 87, 291–300. [Google Scholar] [CrossRef]
  39. Yang, H.S.; Dobermann, A.; Lindquist, J.L.; Walters, D.T.; Arkebauer, T.J.; Cassman, K.G. Hybrid-maize–Amaize simulation model that combines two crop modeling approaches. Field Crop. Res. 2004, 87, 131–154. [Google Scholar] [CrossRef]
  40. Lobell, D.B.; Bänziger, M.; Magorokosho, C.; Vivek, B. Nonlinear heat effects on African maize as evidenced by historical yield trials. Nat. Clim. Change 2011, 1, 41–45. [Google Scholar] [CrossRef]
  41. Butler, E.E.; Huybers, P. Adaptation of US maize to temperature variations. Nat. Clim. Change. 2013, 3, 68–72. [Google Scholar] [CrossRef]
  42. Acreche, M.M.; Slafer, G.A. Grain weight, radiation interception and use efficiency as affected by sink-strength in Mediterranean wheat released from 1940 to 2005. Field Crop Res. 2009, 110, 98–105. [Google Scholar] [CrossRef]
  43. Tollenaar, M.; Daynard, T. Kernel growth and development at two positions on the ear of maize (Zea mays). Can. J. Plant Sci. 1978, 58, 189–197. [Google Scholar] [CrossRef]
  44. Meng, Q.F.; Hou, P.; Lobell, D.B.; Wang, H.F.; Cui, Z.L.; Zhang, F.S.; Chen, X.P. The benefits of recent warming for maize production in high latitude China. Clim. Change 2014, 122, 341–349. [Google Scholar] [CrossRef]
  45. Wang, L.J.; Liao, S.H.; Huang, S.B.; Ming, B.; Meng, Q.F.; Wang, P. Increasing concurrent drought and heat during the summer maize season in Huang–Huai–Hai Plain, China. Int. J. Climatol. 2018, 38, 3177–3190. [Google Scholar] [CrossRef]
  46. Tao, F.; Yokozawa, M.; Xu, Y.L. Climate changes and trends in penology and yields of field crops in China: 1981–2000. Agric. Forest Meteorol. 2006, 138, 82–92. [Google Scholar] [CrossRef]
  47. Wang, J.; Wang, E.L.; Yang, X.G.; Zhang, F.S.; Yin, H. Increased yield potential of wheat-maize cropping system in the North China Plain by climate change adaptation. Clim. Change 2012, 113, 825–840. [Google Scholar] [CrossRef]
  48. Sun, H.Y.; Zhang, X.Y.; Chen, S.Y.; Pei, D.; Liu, C.M. Effects of harvest and sowing time on the performance of the rotation of winter wheat–summer maize in the North China Plain. Ind. Crop. Prod. 2007, 25, 239–247. [Google Scholar] [CrossRef]
  49. Birch, C.J.; Hammer, G.L.; Rickert, K.G. Temperature and photoperiod sensitivity of development in five cultivars of maize (Zea mays L.) from emergence to tassel initiation. Field Crop. Res. 1998, 55, 93–107. [Google Scholar] [CrossRef]
  50. Liu, Y.E.; Xie, R.Z.; Hou, P.; Li, S.K.; Zhang, H.B.; Ming, B.; Long, H.L.; Liang, S.M. Phenological responses of maize to changes in environment when grown at different lati-tudes in China. Field Crop. Res. 2013, 144, 192–199. [Google Scholar] [CrossRef]
  51. Li, S.K.; Wang, C.T. Potential and Ways to High Yield in Maize; Science Press: Beijing, China, 2010. [Google Scholar]
  52. Otegui, M.E.; Andrade, F.H.; Suero, E.E. Growth, water use, and kernel abortion of maize subjected to drought at silking. Field Crop. Res. 1995, 40, 87–94. [Google Scholar] [CrossRef]
  53. Oury, V.; Tardieu, F.; Turc, O. Ovary apical abortion under water deficit is caused by changes in sequential development of ovaries and in silk growth rate in maize. Plant Physiol. 2016, 171, 986–996. [Google Scholar]
  54. Borrás, L.; Slafer, G.A.; Otegui, M.E. Seed dry weight response to source–sink manipulations in wheat, maize and soybean: A quantitative reappraisal. Field Crop. Res. 2004, 86, 131–146. [Google Scholar] [CrossRef]
  55. Tsimba, R.; Edmeades, G.O.; Millner, J.P.; Kemp, P.D. The effect of planting date on maize grain yields and yield components. Field Crop. Res. 2013, 150, 135–144. [Google Scholar] [CrossRef]
  56. Zhou, B.Y.; Yue, Y.; Sun, X.F.; Wang, X.B.; Wang, Z.M.; Ma, W.; Zhao, M. Maize grain yield and dry matter production responses to variations in weather conditions. Agron. J. 2015, 108, 196–204. [Google Scholar] [CrossRef]
  57. Otegui, M.E.; Riglos, M.; Mercau, J.L. Genetically modified maize hybrids and delayed sowing reduced negative drought effects across a rainfall gradient in temperate Argentina. J. Exp. Botany. 2021, 72, 371–376. [Google Scholar] [CrossRef]
  58. Hisse, I.R.; D’Andrea, K.E.; Otegui, M.E. Source-sink relations and kernel weight in maize inbred lines and hybrids: Responses to contrasting nitrogen supply levels. Field Crop. Res. 2019, 230, 151–159. [Google Scholar] [CrossRef]
  59. Andrade, F.H.; Vega, C.; Uhart, S.; Cirilo, A.; Cantarero, M.; Valentinuz, O. Kernel number determination in maize. Crop Sci. 1999, 39, 453–459. [Google Scholar] [CrossRef]
  60. Jones, R.J.; Gengenbach, B.G.; Cardwell, V.B. Temperature effects on in vitro kernel development of maize. Crop Sci. 1981, 21, 761–766. [Google Scholar] [CrossRef]
  61. Egli, D.B. Seed Biology and the Yield of Grain Crops; CAB International: Oxfordshire, UK, 1998. [Google Scholar]
Figure 1. The dynamics of daily temperature (mean temperature (Tmean), minimum temperature (Tmin), and maximum temperature (Tmax)), solar radiation (Ra), and precipitation (Pr) during maize growing seasons in 2012 (A,C) and 2013 (B,D).
Agronomy 12 01816 g001
Figure 2. Spring maize (SPM), summer maize (SUM); AUM and autumn maize (AUM) grain yield for three seasons in 2012 and 2013. Note:, The bar in means standard deviations, and the different letters indicate significant differences at p < 0.05 levels.
Agronomy 12 01816 g002
Figure 3. Kernel dry matter accumulation dynamics and kernel weight as a function of growing degree days after silking for three seasons and three hybrids in 2012 and 2013. Note: SPM, spring maize, SUM, summer maize, AUM, autumn maize, The bar in means standard deviations, the different letters indicate significant differences at p < 0.05 levels.
Agronomy 12 01816 g003
Figure 4. Relationships between growing degree days (GDD, (A)), mean temperature (MT, (B)), killing degree days (KDD, (C)) and accumulated solar radiation (Ra, (D)) from emergence to maturity, and maize grain yield (GY). * p < 0.05, ** p < 0.01.
Agronomy 12 01816 g004
Figure 5. Relationships between growing degree days (GDD, (A)), mean temperature (MT, (B)), mean temperature difference (M△T, (C)), killing degree days (KDD, (D)), accumulated solar radiation (Ra, (E)) and accumulated precipitation (Pr, (F)) from silking to maturity, and maize kernel weight (KW). * p < 0.05, ** p < 0.01.
Agronomy 12 01816 g005
Figure 6. Relationships between growing degree days (GDD, (A)), mean temperature (MT, (B)), mean temperature difference (M△T, (C)), killing degree days (KDD, (D)), and accumulated solar radiation (Ra, (E)) from silking to maturity, and maize kernel filling rate during linear kernel filling period (KFRlkf). ** p < 0.01.
Agronomy 12 01816 g006
Figure 7. Relationships between growing degree days for onset of linear kernel filling (GDDonset); growing degree days at maximum kernel filling rate (GDDKFRmax), total growing degree days for kernel filling (GDDmax), and growing degree days (GDD, (A,C,E)) and mean temperature difference (M△T, (B,D,F)) from silking to maturity. * p < 0.05, ** p < 0.01.
Agronomy 12 01816 g007
Table 1. Maize crop phenology in three different maize seasons in 2012 and 2013.
SeasonsVarietiesMazie Growth Stage (Day/Month)
20122013
PDVER1R6PDVER1R6
SPM1ZD95814/33/429/518/718/32/43/622/7
DH93/622/78/626/7
YD6298/625/714/629/7
SPM2ZD95828/38/45/622/726/38/47/626/7
DH98/627/714/628/7
YD62913/629/718/631/7
SUM1ZD9584/510/527/617/85/512/527/613/8
DH930/620/82/716/8
YD6294/722/87/719/8
SUM2ZD95823/528/511/74/920/525/59/726/8
DH913/78/914/728/8
YD62918/711/917/730/8
AUM1ZD9587/711/724/822/107/712/723/824/10
DH926/829/1027/826/10
YD62931/85/1130/83/11
AUM2ZD95822/725/79/922/1121/725/75/920/11
DH914/930/119/925/11
YD62919/930/1113/928/11
Note: SPM, spring maize; SUM, summer maize; AUM, autumn maize; PD, planting date; VE, emergence stage; R1, silking stage; R6, maturity stage.
Table 2. Climatic conditions during maize growth duration for different seasons in 2012 and 2013.
SeasonsVarietiesGrowing Degree Days
(GDD, °Cd)
Mean Daily Temperature (MT, °C)Mean Temperature Difference (M△T, °C)Killing Degree Days
(KDD, °Cd)
Accumulated Solar Radiation (Ra,MJ m2)Accumulated Precipitation (Pr, mm)
201220132012201320122013201220132012201320122013
SPM1ZD9581404.81446.623.623.47.79.5110.5154.21565.81762.0399.8365.3
DH91474.61518.921.023.67.79.4122.4170.61654.41855.4401.5398.0
YD6291526.61574.021.523.87.79.3135.7182.41707.81924.3401.5398.0
SPM2ZD9581476.41487.421.824.17.69.4127.2170.61613.61782.3400.6388.4
DH91531.51524.122.024.27.69.3144.3178.41703.81828.2400.6388.4
YD6291583.41578.222.724.37.69.3152.7192.81764.41891.5400.6388.4
SUM1ZD9581593.41511.825.127.47.28.5206.8257.91678.91684.2335.6252.1
DH91705.31564.825.327.47.28.6213.8274.71859.61748.0394.8252.1
YD6291764.51618.526.027.57.38.7204.6292.91916.51805.6400.4252.1
SUM2ZD9581664.11560.428.528.07.38.2244.8281.41709.81700.2341.8261.6
DH91795.91594.928.528.07.38.2172.5286.21915.21734.6442.4273.4
YD6291853.51630.327.728.07.38.2174.1294.01950.91767.8483.6273.4
AUM1ZD9581488.31503.628.225.18.29.0150.2237.71614.11577.8292.6271.9
DH91645.91519.027.825.08.39.185.6237.71845.01602.9453.0271.9
YD6291692.51566.527.724.38.48.9113.3237.71913.31655.6464.8280.2
AUM2ZD9581385.01416.027.022.28.78.9115.6186.21650.61576.1327.6226.4
DH91461.11429.726.221.88.68.984.3186.21814.31605.5340.0226.5
YD6291515.71436.925.321.48.68.9108.3186.21804.51639.4389.3226.6
Seasons15.4 **7.5 *21.1 **21.3 **94.3 **44.5 **40.2 **34.7 **29.2 **332.2 **ns72.3 **
Varieties6.1 *4.6 *nsnsnsnsnsNs45.7 **62.2 **5.5 *ns
Seasons * VarietiesnsnsnsnsnsnsnsNsnsnsnsns
Note: SPM, spring maize; SUM, summer maize; AUM autumn maize; * difference significant at p < 0.05; ** difference significant at p < 0.01; ns no significant difference.
Table 3. Climatic conditions during maize kernel filling duration for different seasons in 2012 and 2013.
SeasonsVarietiesGrowing Degree Days
(GDD, °Cd)
Mean Daily Temperature
(MT, °C)
Mean Temperature Difference
(M△T, °C)
Killing Degree Days
(KDD, °Cd)
Accumulated Solar Radiation (Ra,MJ m2)Accumulated Precipitation (Pr, mm)
201220132012201320122013201220132012201320122013
SPM1ZD958815.4817.927.127.87.27.9107.2121.8801.1897.1197.7110.0
DH9822.2812.727.728.17.37.8119.0131.8827.5905.5153.094.2
YD629809.1789.828.328.97.57.8132.4143.6845.6868.9130.786.5
SPM2ZD958814.0828.827.928.17.47.8123.9132.2829.5925.8152.094.2
DH9846.4771.528.428.97.57.8140.9139.6895.7845.8130.786.5
YD629797.6759.128.529.07.57.6138.9141.1862.8814.4126.886.5
SUM1ZD958910.3835.229.229.47.38.4175.4186.8953.3948.7165.655.4
DH9915.2803.429.329.77.58.6186.6194.6972.6912.6143.155.4
YD629877.5767.729.229.87.49.0171.1200.5913.1880.3148.755.1
SUM2ZD958953.1850.328.229.47.18.6146.5205.2973.6925.1199.1125.8
DH9972.7793.927.829.27.28.6140.0185.41013.4838.7193.0137.4
YD629933.5775.227.729.27.48.7140.6183.3984.9821.5167.5137.4
AUM1ZD958714.7755.521.822.09.29.120.044.1834.1743.3141.2216.2
DH9751.0706.520.921.69.29.419.942.7889.0733.2185.1134.5
YD629686.8700.919.920.59.49.012.231.5835.2736.8195.2142.8
AUM2ZD958604.7704.117.218.89.59.20.229.1848.1844.6185.0143.2
DH9551.2669.916.018.29.59.20.029.1860.2836.3133.2132.7
YD629499.7631.615.817.69.39.50.029.1763.5845.4133.190.9
Seasons24.5 **33.9 **49.2 **96.9 **357 **120 **121 **530 **30.6 **6.24 *nsns
Varietiesns8.71 **nsnsnsnsnsnsnsnsnsns
Seasons * Varietiesnsnsnsnsnsnsnsnsnsnsnsns
Note: SPM, spring maize; SUM, summer maize; AUM, autumn maize; * difference significant at p < 0.05; ** difference significant at p < 0.01; ns, no significant difference. The same as follows.
Table 4. KFRlkf, GDDonset, GDDlkf, GDDKFRmax, and GDDmax for different maize seasons in 2012 and 2013.
YearsSeasonsKFRlkf (mg °Cd−1)GDDonset (°Cd)GDDlkf (°Cd)GDDKFRmax (°Cd)GDDmax (°Cd)
ZD958DH9YD629ZD958DH9YD629ZD958DH9YD629ZD958DH9YD629ZD958DH9YD629
2012SPM10.547 ± 0.03 bc0.518 ± 0.03 b0.745 ± 0.04 a185 ± 9 a186 ± 9 a259 ± 13 a575 ± 29 a513 ± 26 c462 ± 23 bc443 ± 22 a455 ± 23 b498 ± 25 a720 ± 36 a699 ± 35 b721 ± 36 a
SPM20.572 ± 0.02 b0.518 ± 0.02 b0.61 ± 0.02 b190 ± 7 a186 ± 7 a212 ± 7 b536 ± 19 b513 ± 18 c440 ± 15 c467 ± 16 a460 ± 16 b465 ± 16 ab726 ± 25 a699 ± 24 b653 ± 23 b
SUM10.526 ± 0.01 cd0.369 ± 0.01 d0.604 ± 0.02 b161 ± 4 b116 ± 3 c181 ± 5 c463 ± 12 c830 ± 21 a474 ± 12 bc397 ± 10 b544 ± 14 a424 ± 11 b623 ± 16 b946 ± 24 a655 ± 16 b
SUM20.509 ± 0.02 d0.464 ± 0.02 c0.479 ± 0.02 c160 ± 7 b179 ± 8 ab158 ± 7 cd461 ± 19 c594 ± 25 b582 ± 24 a426 ± 18 ab481 ± 20 ab462 ± 19 ab621 ± 26 b773 ± 32 b740 ± 31 a
AUM10.534 ± 0.02 cd0.612 ± 0.02 a0.715 ± 0.03 a115 ± 5 c164 ± 7 b197 ± 8 bc588 ± 24 a553 ± 22 bc507 ± 20 ab415 ± 17 ab460 ± 18 b487 ± 19 a703 ± 28 a717 ± 29 b704 ± 28 ab
AUM20.659 ± 0.03 a0.595 ± 0.02 a0.719 ± 0.03 a125 ± 5 c84 ± 3 d145 ± 6 d469 ± 19 c495 ± 20 c401 ± 16 c369 ± 15 b353 ± 14 c373 ± 15 c594 ± 24 b579 ± 23 c545 ± 22 c
F values
Seasons (S)11.4 ** 5.21 * ns ns ns
Varieties (V)8.75 ** ns ns ns ns
S×Vns ns ns ns ns
2013SPM10.566 ± 0.03 b0.591 ± 0.03 ab0.457 ± 0.02 c157 ± 8 c174 ± 9 a148 ± 7 a465 ± 23 c467 ± 23 b610 ± 31 ab398 ± 20 a421 ± 21 ab453 ± 23 a622 ± 31 b641 ± 32 ab758 ± 38 a
SPM20.529 ± 0.02 b0.545 ± 0.02 b0.392 ± 0.01 d182 ± 6 b146 ± 5 b167 ± 6 b471 ± 16 c499 ± 17 b710 ± 25 a433 ± 15 a387 ± 14 b439 ± 15 a653 ± 23 b644 ± 23 ab777 ± 27 a
SUM10.563 ± 0.01 b0.555 ± 0.01 b0.618 ± 0.02 a210 ± 5 a146 ± 4 b148 ± 4 a420 ± 11 d463 ± 12 b393 ± 10 d433 ± 11 a375 ± 9 b376 ± 9 b630 ± 16 b608 ± 15 b541 ± 14 c
SUM20.361 ± 0.02 c0.57 ± 0.02 ab0.514 ± 0.02 b153 ± 6 c138 ± 6 b147 ± 6 a651 ± 27 a466 ± 20 b482 ± 20 c424 ± 18 a366 ± 15 b386 ± 16 b804 ± 34 a604 ± 25 b628 ± 26 b
AUM10.793 ± 0.03 a0.584 ± 0.02 ab0.636 ± 0.03 a201 ± 8 a90 ± 4 c131 ± 5 a425 ± 17 d625 ± 25 a555 ± 22 b433 ± 17 a444 ± 18 a420 ± 17 ab626 ± 25 b715 ± 29 a686 ± 27 ab
AUM20.551 ± 0.02 b0.655 ± 0.03 ab0.691 ± 0.03 a110 ± 4 d174 ± 7 a153 ± 6 a551 ± 22 b489 ± 20 b487 ± 19 c402 ± 16 a450 ± 18 a444 ± 18 a661 ± 26 b663 ± 27 ab640 ± 26 b
F values
Seasons (S)ns ns ns 9.91 ** ns
Varieties (V)ns ns ns ns ns
S×Vns ns ns 6.02 * 4.16 *
Note: SPM, spring maize, SUM, summer maize, AUM, autumn maize, KFRlkf, kernel filling rate during linear kernel filling period; GDDonset, growing degree days for onset of linear kernel filling; GDDlkf, growing degree days for duration of linear kernel filling; GDDKFRmax, growing degree days at maximum kernel filling rate; GDDmax, total growing degree days for kernel filling. Different letters after values indicate significant differences at p < 0.05 levels, and * = p < 0.05, ** = p < 0.01, and ns = p >0.05, respectively.
Table 5. Correlation coefficients of GY, KW, KFRlkf, GDDonset, GDDlkf, GDDKFRmax, GDDmax, and climatic factors.
GDDMTM△TKDDRaPr
GY−0.384 *−0.528 **−0.152−0.315 *−0.336 *0.257
KW−0.421 *−0.592 **0.400 *−0.673 **−0.589 **0.397 *
KFRlkf−0.565 **−0.563 **0.492 **−0.573 **−0.523 **0.170
GDDonset0.345 *0.290−0.343 *0.2300.2100.110
GDDlkf0.2400.110−0.1800.0700.1100.110
GDDKFRmax0.429 **0.190−0.409 *0.0800.2100.260
GDDmax0.440 **0.270−0.374 *0.1900.2300.180
Note: Correlation coefficients significant at * = p < 0.05, and ** = p < 0.01. GDDs, growing degree days; MT, mean daily temperature; M△T, mean temperature difference; KDDs, killing degree days; Ra, accumulated solar radiation; Pr, accumulated precipitation; GY, grain yield; KW, kernel weight; KFRlkf, kernel filling rate during linear kernel filling period; GDDonset, growing degree days for onset of linear kernel filling; GDDlkf, growing degree days for duration of linear kernel filling; GDDKFRmax, growing degree days at maximum kernel filling rate; GDDmax, total growing degree days for kernel filling.
Publisher’s Note: MDPI stays neutral with regard to jurisdictional claims in published maps and institutional affiliations.

