Article

SNP Genotyping for Purity Assessment of a Forage Oat (Avena sativa L.) Variety from Colombia

by
Luis Fernando Campuzano-Duque
1,
Diego Bejarano-Garavito
2,
Javier Castillo-Sierra
2,
Daniel Ricardo Torres-Cuesta
2,
Andrés J. Cortés
3,† and
Matthew Wohlgemuth Blair
4,*
1
Corporación Colombiana de Investigación Agropecuaria (AGROSAVIA)-CI La Libertad, Villavicencio 230002, Colombia
2
Corporación Colombiana de Investigación Agropecuaria (AGROSAVIA)-CI Tibaitatá, Bogotá 111321, Colombia
3
Corporación Colombiana de Investigación Agropecuaria (AGROSAVIA)-CI La Selva, Rionegro 054048, Colombia
4
Department of Agricultural and Environmental Sciences, Tennessee State University, Nashville, TN 37209, USA
*
Author to whom correspondence should be addressed.
Secondary Address: Departamento de Ciencias Forestales, Facultad de Ciencias Agrarias, Universidad Nacional de Colombia, Sede Medellín, Medellín 050034, Colombia.
Agronomy 2022, 12(7), 1710; https://doi.org/10.3390/agronomy12071710
Submission received: 20 May 2022 / Revised: 4 July 2022 / Accepted: 13 July 2022 / Published: 20 July 2022
(This article belongs to the Special Issue Omics Approaches for Crop Improvement)

Abstract

:
Single nucleotide polymorphism (SNP) markers have multiple applications in plant breeding of small grains. They are used for the selection of divergent parents, the identification of genetic variants and marker-assisted selection. However, the use of SNPs in varietal purity assessment is under-reported, especially for multi-line varieties from the public sector. In the case of variety evaluation, these genetic markers are tools for maintaining varietal distinctness, uniformity and stability needed for cultivar release of multi-line or pure-line varieties of inbred crops. The objective of this research was to evaluate the purity and relationships of one original (AV-25) and two multi-line sub-populations (AV25-T and AV25-S) of the inbreeding species, oats (Avena sativa L.). Both sub-populations could be useful as forages in the central highland region of Colombia (>2000 masl), such as in the departments of Boyacá and Cundinamarca, even though they were derived from an original composite mixture widely used in the mountainsides of the southern department of Nariño named Avena 25. Representative single plant selections (SPS) from the two sub-populations were grown together with SPS harvests from off-type plants (early and late) and plants from the original AV25 composite mixture, to determine their genetic similarity. Plants were genotyped by DNA extraction of a plateful of 96 individual plant samples and SNPs were detected for an Illumina Infinium 6K Chip assay. The data were used for the analysis of genetic structure and population relationships. The grouping observed based on the genetic data indicated that AV25-T and AV25-S were homogeneous populations and somewhat divergent in their genetic profile compared to the original AV25-C mix. In addition, to the two commercial, certified oat varieties (Cajicá and Cayuse) were different from these. The early and late selections were probable contaminants and could be discarded. We concluded that the use of SNP markers is an appropriate tool for ensuring genetic purity of oat varieties.

1. Introduction

Cultivated oat (Avena sativa L.) is a hexaploid small grain species (2n = 6x = 42) with a large genome (11.3–14.0 Gb) that originated in the Fertile Crescent region known as the Near East in western Asia and from there spread around the world [1]. Oats arrived in the Americas with European conquests and are currently among the most important cereals in the world after maize (Zea mays L.), rice (Oryza sativa), wheat (Triticum aestivum), sorghum (Sorghum bicolor), millets (Panucum, Pennisetum, Setaria spp.) and barley (Hordeum vulgare) but more popular than rye (Secale cereale). Unlike some of these cereals, oats are confined to temperate areas in northern latitudes or cool wet climates, such as those in highlands of the subtropics.
Major producers of oats include Canada, Russia, Finland, Poland and the United Kingdom in the northern hemisphere, and Australia and Brazil in the southern hemisphere. In highland (>2000 m above sea level) areas of the Andes, from Bolivia to Colombia, Ecuador and Peru, oats are used as a fodder source, in pasture, hay or silage, alone or with forage legumes [2] and is considered a food alternative for the diet of dairy cows to improve milk production and quality, especially in times of forage shortages by drought or frost [3].
Molecular markers are well known tools for plant breeding [4] with many methods developed since the advent of the polymerase chain reaction (PCR), which allowed the development of easy-to-use genetic assays for varied purposes adaptable to many of the different stages of genetic improvement of plants and animals [5,6,7]. These include the pre-breeding steps of biodiversity analysis, conservation, utilization [6,8], breeding analysis of the reproductive system of a species, characterization and selection of parents in crossing plans and monitoring of segregating populations [9]. Markers have been used as genetic tools for analysis of qualitative and quantitative characters and introgression of genes from wild species (e.g., [10]). They have also been used successfully in other lines of plant research, such as phylogeny [8], and the diagnosis of pests or pathogens [11]. In post-breeding steps, molecular markers are useful for confirming the identity, purity and homogeneity of varieties and in the tracking of genetically modified organisms (GMOs) [6,9]
In the last decade, single nucleotide polymorphisms (SNPs) have become the most common type of biallelic sequence-based molecular marker used in plant and animal genomes [7,12,13]. In addition to having stable inheritance from generation to generation, SNP markers target loci where only two alleles are observed within a population that arise from mutations or mismatch repair [9]. The use of SNPs is widespread in genetic studies of plants, which includes genomic diversity [4,14], construction of linkage maps [15,16], genomic selection [17,18], population structure analysis [19,20,21], genetic mapping [5] and genome–environment associations [22].
The target number of SNPs for a crop depends on its genome size, level of ploidy, research investments, population stratification and overall linkage disequilibrium patterns [23]. As examples, the capacity of currently available SNP arrays from Illumina go up to 820,000 (820K) in the large-genome hexaploid wheats (Triticum aestivum), 700K in rice (Oryza sativa) [4], 487K in triploid apples (Malus domestica) [24], 345K in the dodecaploid genome of sugar cane (Saccharum officinarum) [25], 90K in octoploid strawberries (Fragaria vesca) [26] and 58K in tetraploid peanuts (Arachis hypogaeae) [27,28]. Diploid species require less SNPs for coverage.
In the case of common oats, the first SNP array developed with Illumina technology contained 3072 assays and was applied to build a consensus map with 985 mapped loci [29]. The SNP chip was later expanded to the 6K Illumina oat BeadChip containing nearly 6000 assays, with a success rate of 86.6% [6,7]. Recently, this SNP array has been transformed into a 6K BeadChip layout containing 257 Infinium I and 5486 Infinium II features corresponding to 5743 SNPs.
The goal of this study was to determine the variety purity, plant to plant diversity and early or late season off-types of a multi-line (composite mix) population of forage oats (AV25-C) commonly grown in the highlands (>2000 masl) of southern Colombia along with the diversity of two derived sub-populations (AV25-S and AV25-T) selected for similar altitudes in central Colombian departments of Boyacá and Cundinamarca by using SNP fingerprinting based on the Infinium assay and two control genotypes along with selection of phenological extremes and multi-plant sampling. This is a first use of SNP chips for evaluating varietal purity in a forage oat multi-line. We plan to utilize SNPs to determine the genetic underpinning of the phenotypic variants of cereal oats.

2. Materials and Methods

2.1. Plant Materials Used

The main forage oat (Avena sativa L.) variety used in this study was AV25, a multi-line population developed in southern Colombia early in the 21st century by the Colombian Agricultural Research Corporation (AGROSAVIA). As a candidate population for varietal release in 2014, the multi-line was grown in a plot for foundation seed at the Obonuco Research Station of AGROSAVIA in Pasto, Colombia (1°11′56″ N, 77°41′44″ W). For the next generation, dormancy was broken over a six-month storage period. Then, 100 spike-to-row selections were established at two field sites in 2015: (1) in the Tibaitatá Experimental station (near the town of Mosquera in the province of Cundinamarca) and (2) on the Finca Sutacón near the town of Susacón in the municipality of Paipa (Province Boyacá). Mass selection across and between rows was applied at each location, resulting in two new composite sub-populations, called AV25-T and AV25-S from Tibaitatá and Susacón, respectively. The original mixture: AV25-C (the population from Obonuco) was compared to the two subpopulations: AV25-T (Tibaitatá selection) and AV25-S (Sutacón selection) as well as to two off-types selections, namely AV25-P (early selection from Obonuco) and AV25-Ta (late selection from Obonuco). Two commercial varieties (Cajicá and Cayuse) were grown as checks.

2.2. Agronomic Locations Used

The grow out was carried out in the second half of 2016 at the Tibaitatá experimental station where 400 rows each of single plant selections (SPS) from the populations AV25-C, AV25-T, AV25-S were grown. In addition, 25 SPS rows for each of the off-type oats, AV-25-P, AV25-Ta and each of the commercial varieties Cajica and Cayuse were established there. Each row was 4.0 m long, and rows were planted 0.3 m apart. A planting density of 60 kg seed ha−1 was used, and the fertilizer regime and weed control followed the recommendation of AGROSAVIA [3], with the goal of obtaining approximately 60 t ha−1 in forage yield. Harvesting was set at stage Z7.0 as in Zadoks et al. [30].

2.3. Leaf Tissue and DNA Extraction

A total of 96 single plant DNA samples were taken from the flag leaves of an equal number of plants that were selected based on representation of the full SPS plot when they had reached the heading stage (Z6.0) according to the maturity scale of Zadoks et al. [30]. The leaf samples included 22 plants from AV25-C, 30 each from AV25-T and AV25-S; 4 each from Cajicá and Cayuse, and 3 each from AV25-P and AV25-Ta. DNA was extracted from approximately 4 cm of leaf tissue placed in individual 1.5 mL Eppendorf tubes on ice. These tissue samples were then ground to a powder with liquid nitrogen and a plastic mortar. The Mo-Bio® kit for plant tissue (PowerPlant® ProDNA Isolation, San Francisco, CA, USA) was used to obtain DNA from ground leaves. The quantity and quality of the DNA was evaluated with a NanoDrop® 2000 spectrophotometer (Thermo Fisher Scientific Inc., Wilmington, DE, USA). Samples with a 260/280 UV wavelength ratio close to 1.8, and a 260/230 ratio close to 2.0 with a minimum DNA concentration of 50 ng µL−1 were obtained after dilution.

2.4. SNP Genotyping

The iSelect 6K BeadChip specific to oats [6] was used to evaluate the 96 DNA samples describe above. The process was carried out in the molecular genetics laboratory at the Tibaitatá research facility of AGROSAVIA, and the procedure for array hybridization was according to the Infinium-II assay instructions (Illumina, Inc., San Diego, CA, USA). SNP genotypes were analyzed with the software GenomeStudio v2011.1 with a GeneCaller setting of 0.15. Additionally, a quality control process was carried out on the genotyping data, according to the rules described by Wiggans et al. (2010), using PLINK v1.9 software [31].

2.5. Data Analysis

The ‘genome function’ of the PLINK was used to perform the grouping analysis and to evaluate diversity patterns. We used a grouping approach based on an identity matrix estimated from the allelic frequencies. The distance matrix was also calculated and used for (a) principal component analysis (PCA), and (b) neighbor joining (NJ) dendogram reconstruction also in PLINK. These analyses allowed the visualization of direct relationships and the grouping of samples from the different varieties, which were later quantified explicitly by means on an analysis of molecular variance (AMOVA) test.
In addition, the population structure was determined with the ADMIXTURE software version 1.3.0 [32]. Five independent simulations were run for values from K = 2 to K = 4, under the parameters established by default (100,000 burn-ins and 200,000 iterations in the MCMC analysis). The best K value was determined based on the PCA diagrams, AMOVA analysis, cross-run cluster stability, and with the cross-validation likelihood procedure. This methodology allowed us to determine the genetic profile of each sample and establish the degree of purity or admixture of the individual plants. To graph the results of these analyses, we used R software (R Core Team, 2017).
Based on the optimum level of clustering, pairwise relative divergence (FST) scores, according to Weir and Cockerham (1984), were computed per marker for each pair of clusters using customized R scripts. Bidirectional gene flow among pairs of clusters was also estimated as the number of migrants per generation (Nem) following Beerli and Felsenstein [33]. Networks depicting pairwise relative divergence and bidirectional migration rates were drawn using the R package qgraph. Finally, in order to describe genetic patterns of diversity and identify FST-outlier SNP markers, we further computed per-marker expected (HE) and observed (HO) heterozygosity, nucleotide diversity as measured by π (Nei, 1987), Watterson’s theta (θ) estimator [34], and Tajima’s D [35] using the software Tassel v.5 [36] and customized R scripts. We compared these statistics among them via Pearson’s correlations (cor.test function), and FST against the π score, using customized R codes (R Core Team, 2017).

3. Results

3.1. Oat Selections Based on Harvest Date

During the grow-out for AV-25-C, phenotypic variation was observed especially for days to flowering. About 20% of plants were late flowering (110 days after planting, dap), 34% were early (55 dap) and 46% were intermediate (80 dap). Correspondingly, harvests were either late (starting at 150 dap), intermediate (135 dap) or early (100 dap). Selections (Allard, 1967) of off-type plants were harvested and threshed to produce the AV25-P (early) and AV25-Ta (late) mass selections from the original AV25-C population. Meanwhile, the AV25-S and AV25-T selections made in Sutacón and Tibaitatá locations also from the AV25-C composite were made over two years (2015–2017) to be more uniform. These were both intermediate in phenology, with flowering around 55 dap and harvest around 135 dap (Table S1).

3.2. Oat SNP Chip Success Rate

The iSelect 6K BeadChip array from Illumina® for oats allowed the genotyping of 4975 SNPs distributed throughout the A. sativa genome as described by Tinker et al. [6]. The initial screen was across the 96 DNA samples representing subsampling of each oat varietal selection. SNPs were excluded if the call rate was less than 90%, or if they presented an extreme deviation from a Hardy–Weinberg equilibrium (p-value < 0.01). In addition, any SNPs that were monomorphic or having a minimum allele frequency (MFA) below 0.05% were removed. After applying these criteria for quality control, 1672 SNP loci were retained that met the parameters for further analysis. In addition to SNP locus validation, there were eight DNA samples which had a call rate lower than 90%, perhaps indicating worse quality DNA, and were eliminated. These included three lines from AV25-C (13.6% of total), one from AV25-P (33.3%), one from AV25-S (3.3%) and one from AV25-Ta (33.3%). The study, therefore had 88 genotype samples for population analysis that were sufficient for evaluating structure with the main sub-populations (AV25-C, AV25-S and AV25-T), while noticing trends on the off-types (AV25-P and AV25-Ta). The latter were of less interest to us because they were not being considered for varietal release as the former were.

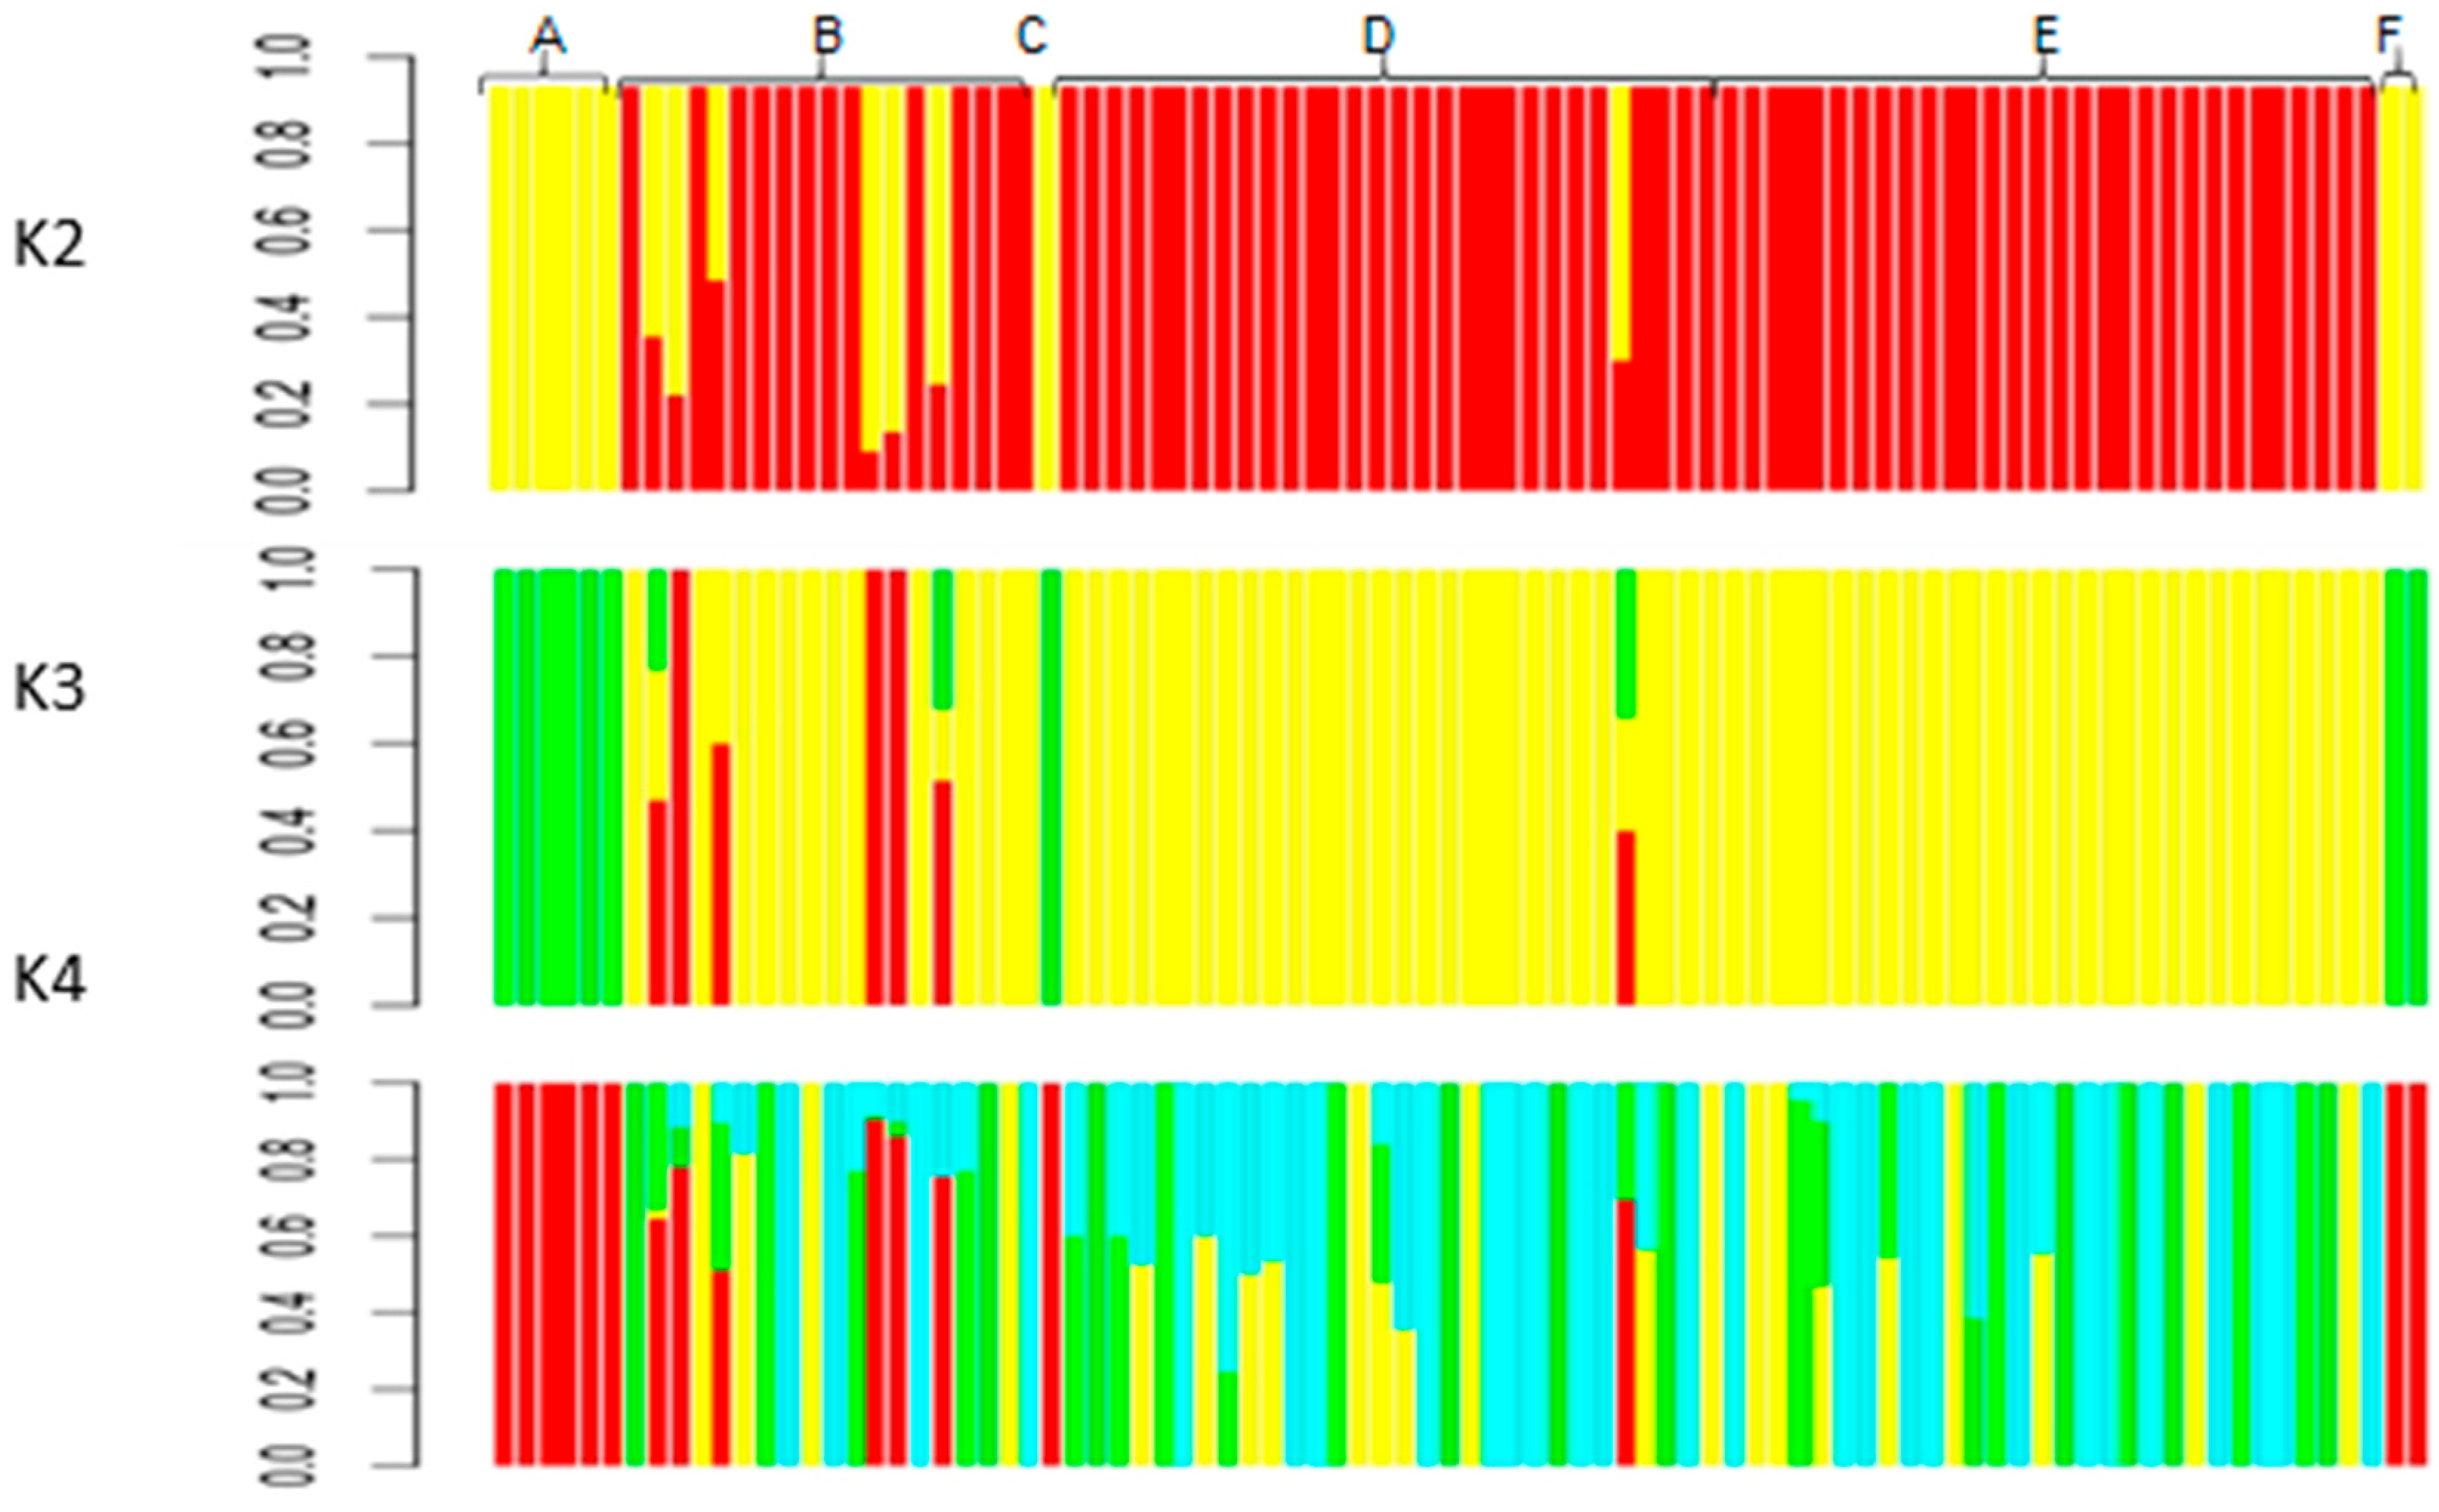
3.3. Clustering of Individual Plants

The analysis of the subpopulation structure made it possible to determine that there was genetic differentiation between the evaluated oat genotypes (Figure 1). With a value of K = 2, a subgroup with the largest number of genotypes (red bars) corresponded mostly to the purified selections for AV25-T and AV25-S and some genotypes from the mixed original population, AV25-C. The other subgroup observed (yellow bars) included the samples of the commercial varieties, the AV25-P and AV25-Ta plants and some of the AV25-C samples, mainly those that correspond to the early maturing phenotype. At K = 3 value, there was a subgroup (yellow color) with a similar genetic profile as at K = 2, including all the samples of the purified AV25-S and AV25-T genotypes and most but not all the AV25-C samples. The second group (green color) included commercial varieties and plants with early and late phenotypes, while the third genetic subgroup (red color) was present only in some of the AV25-C samples. It is evident that within AV25-C there is a significant degree of mixture and some late off-type genotypes that were eliminated by mass selection. These results coincide with field observations, since this cultivar presents plants of different phenologies (early, intermediate and late). With the K = 4 value, we still found a common genetic profile for Cayuse and Cajicá and AV25-P and AV25-Ta genotypes.

3.4. Principal Component Analysis

Figure 2 shows the principal component analysis for the 88 samples analyzed. The first two components of the PCA analysis showed three clearly defined groups, with a compact first group located to the left of the graph (Figure 2a) corresponding to the purified genotypes of AV25-S (29 genotypes with SNP profiles), all the AV25-T (30 genotypes) and some of the AV25-C samples (13 genotypes).
When expanding the area of the graph to the third component (Figure 2b,c), there was evidence of variation between samples for the AV-25 group: a second group located in the upper right part of the graph included the AV25-P samples and a single AV25-S sample. The variation that existed within this group was greater than that evidenced in the other groups, which suggests a possible mixture with the other genotypes. The third group identified in the PCA was in the lower right part of the graph with the first two components (Figure 2a) and corresponded to the samples of commercial varieties and AV25-P and AV25-Ta, which presented a well-defined, distinct genetic profile.
Different color dots were used to represent the groupings with the majority of the AV25-S lines in the orange group, the AV25-T lines in the blue group, the AV25-P lines in the brown group and the AV25-Ta lines in the purple group. The genotypes from the original mixed sample AV25-C were together with other groups.
The patterns were broadly concordant with the distance-based dendogram using the neighbor joining algorithm (Supplementary Figure S1) where dots on the tree and in the PCA were in same grouping colors. Nonetheless, this approach exhibited less resolution at distinguishing genetic differences among individual plants when compared to the PCA. An AMOVA test relying on the grouping from the NJ tree and from the PCA indicated that 63.6% of the genetic variation could be explained by genetic cluster, while 36.4% was found within genotype (p-value < 0.001). Finally, unsupervised Bayesian clustering allowed for a more detailed reconstruction of the admixture level within individual plants from the selections compared to the original population of AV25-C (Supplementary Figure S2). In K = 2, most AV25-T and AV25-S genotypes grouped together with some samples of AV25-C. The other group included the samples of the commercial varieties, the AV25-P and AV25-Ta plants and some of the AV25-C samples, mainly those that corresponded to the early phenotype.
Given that PCA diagrams, AMOVA analysis, and cross-run cluster stability had substructure beyond the hierarchical level of K = 2, we explored population stratification and admixture at two additional K strata. When using a K = 3 value there was a subgroup with a similar genetic profile to K = 2, which corresponded to all the samples of the purified AV25-T genotype and most of the AV25-S samples, except for one sample showing a mixed genetic profile. This group also included AV25-C samples. The second group was made up of commercial varieties and plants with extreme phenotypes (early and late), while the third genetic profile was present only in some of the AV25-C samples. It was evident that within AV25-C there was a significant degree of admixture, sharing genetic profiles with the other groups evaluated.

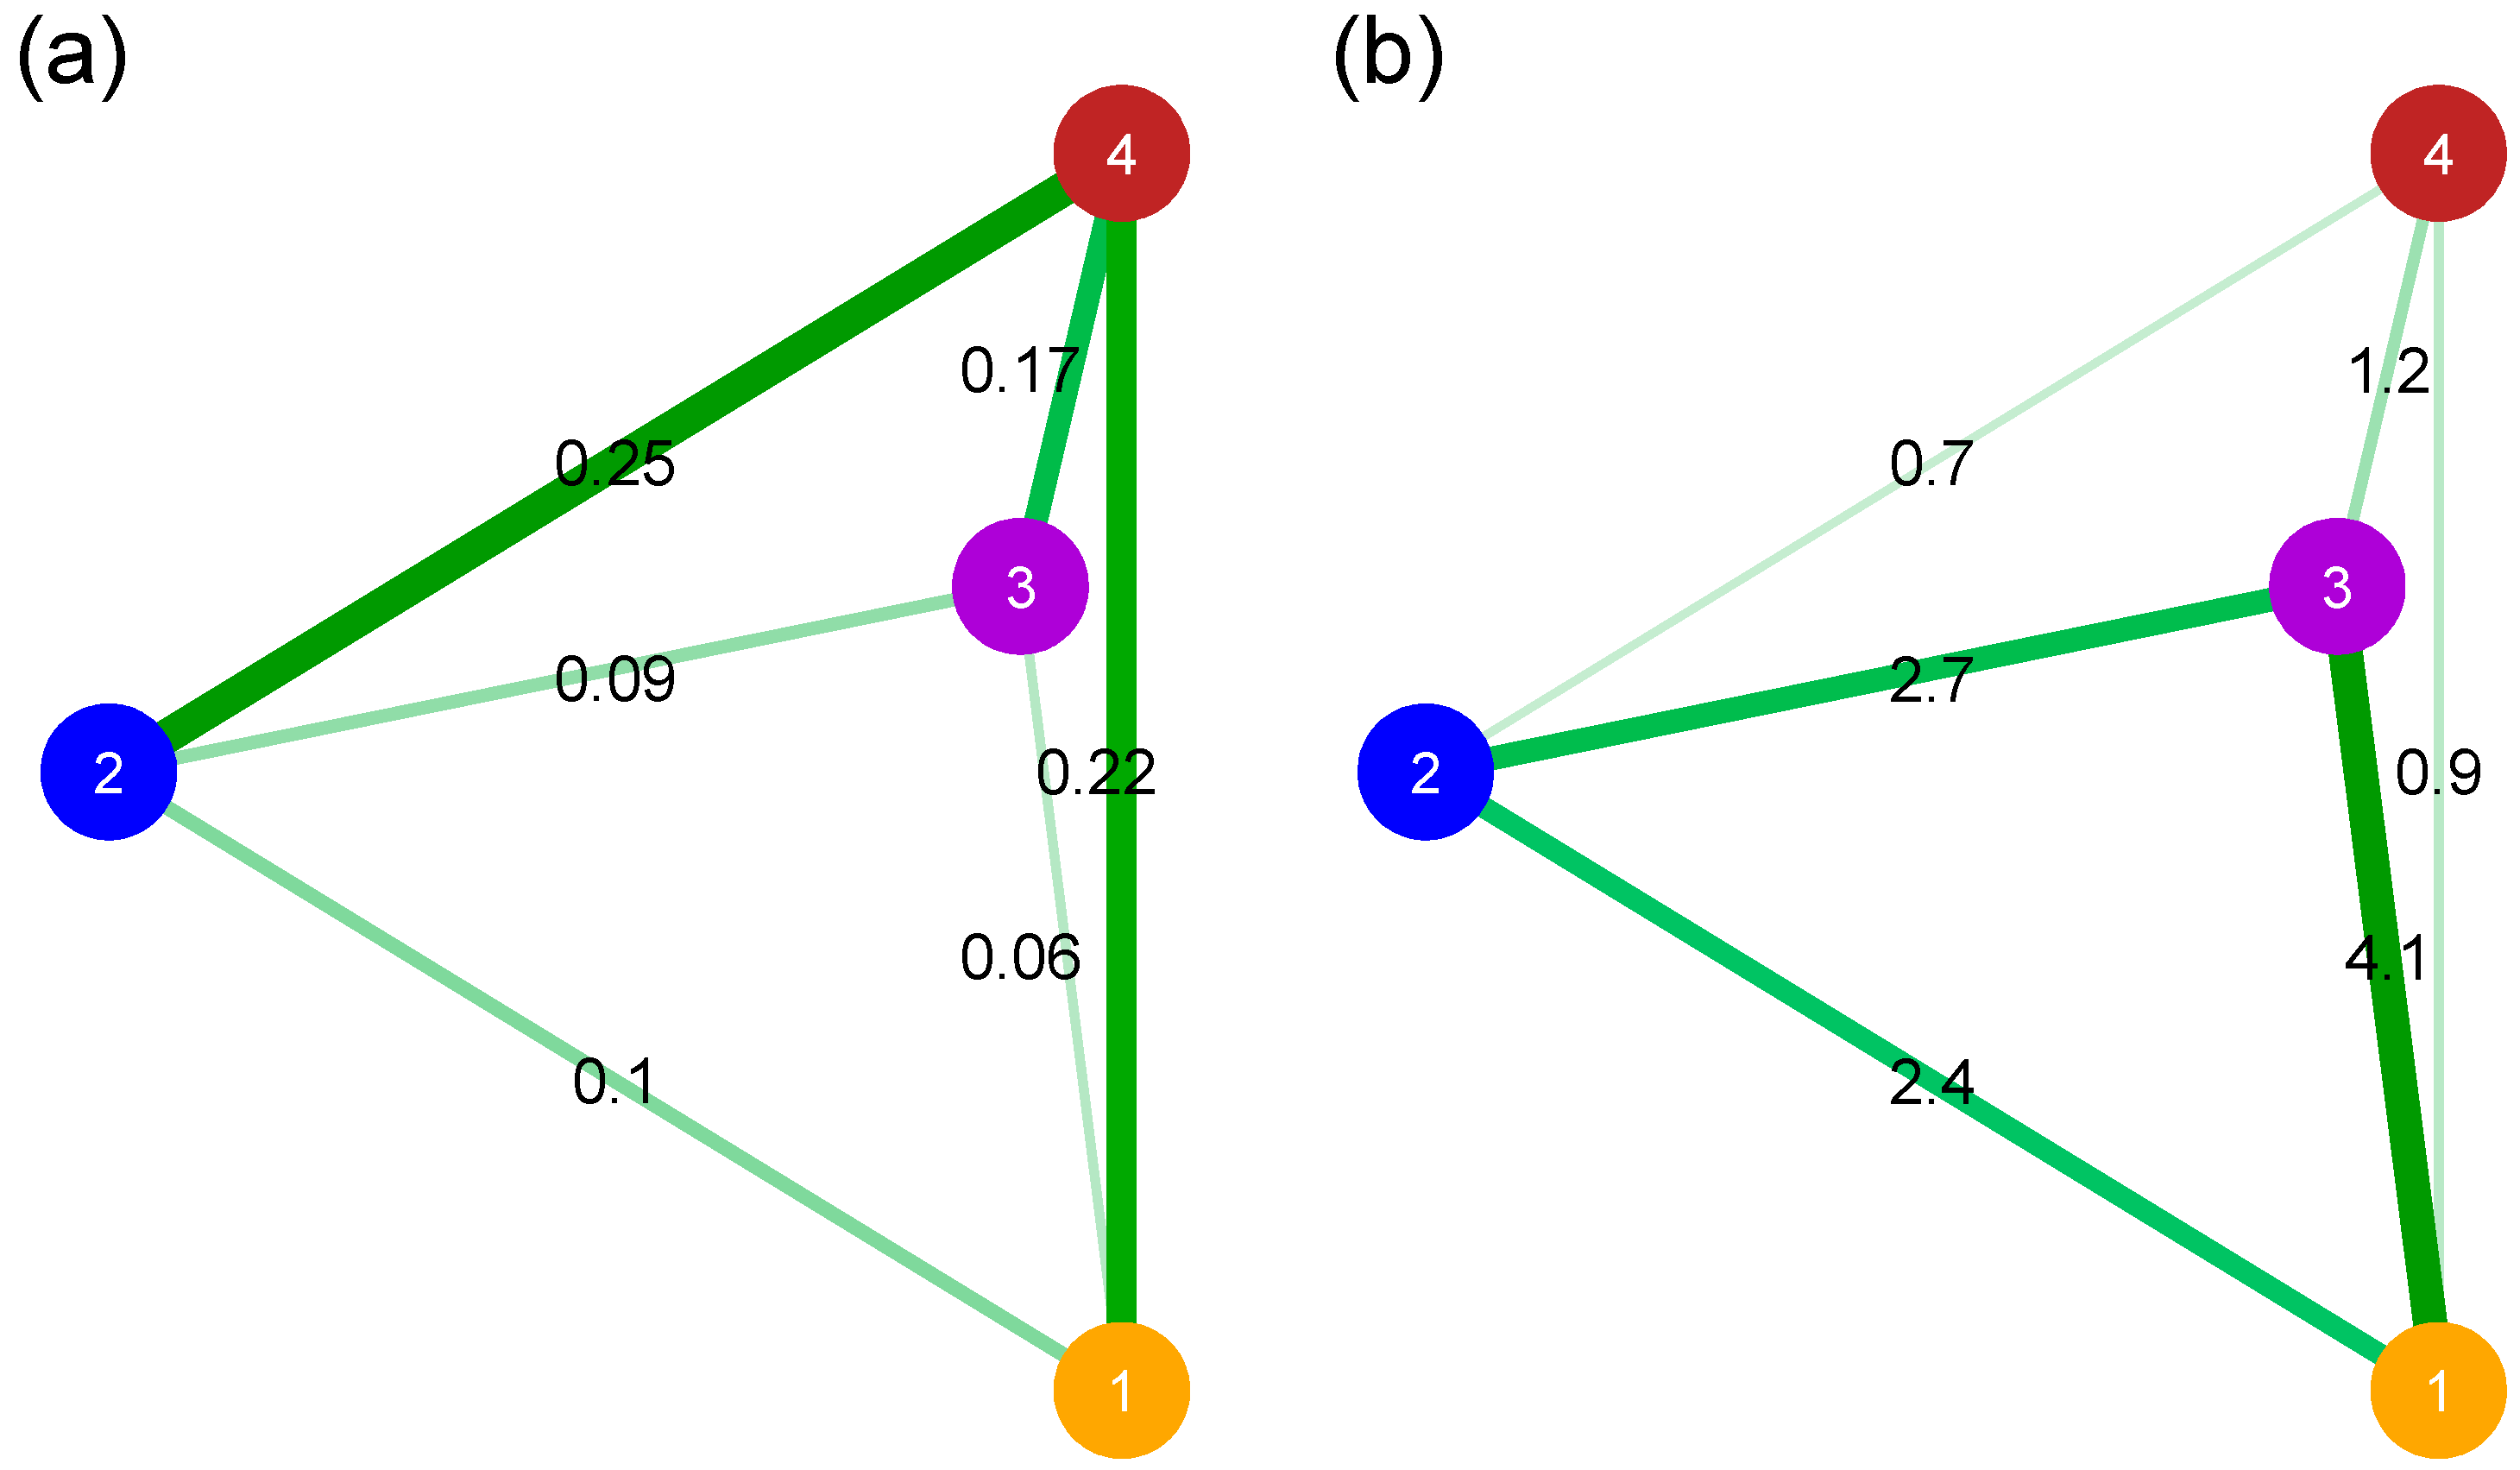
3.5. Relative Divergence and Genetic Patterns of Diversity

Based on the unsupervised genetic clustering described above, pairwise relative divergence (FST) scores were estimated between groups and ranged from 0.06 to 0.25 (Figure 3a). Pairwise FST scores were higher for all three comparisons of blue and red clusters against the brown cluster for AV25-P samples and a single AV25-S versus purple cluster with commercial varieties.
Meanwhile, the number of migrants per generation (Nem) ranked from 0.7 to 2.7 (Figure 3b) and was negatively correlated with the FST (r = 0.93, p-value < 0.001). The width and color intensity of the green lines were proportional to the FST score in the sub-figure (a), and proportional to number of migrants per generation (Nem) in sub-figure (b). The thinnest lines in the sub-figure corresponded to Nem values below one. Nem values above one indicated mixtures.

4. Discussion

Cultivated oat genotypes, whether they are for cereal or fodder, are considered autogamous, self-pollinating plants [1]. Therefore, the mixture of genotypes in the original AV25-C population, uncovered by SNP analysis, show that the forage variety had become contaminated and was a composite variety with multi-lines of different inbred oat lines. Phenotypic analysis showed that the most variable feature of this population was phenological, including flowering and harvest time. The genotypes AV-P and AV-Ta selected from this population showed that contaminant plant types were part of the composite AV variety and genotyping showed that this could be related to other varieties grown in Colombia, such as Cajica and Cayuse, which are both late flowering and maturing. Although the AV variety was developed in southern Colombia (Obonuco station in Nariño), purification by mass selection (MS) was successful in both locations in central Colombia (Tibaitatá station in Cundinamarca and Sutacón farm in Paipa, Boyacá), producing two sub-populations that were uniform in SNP fingerprint and in phenological characteristics important for having a uniform forage crop.
The results of genetic structure analysis coincided with field observations, since the original multi-line oat cultivar AV25-C presented plants of different phenotypes (early, intermediate and late). The purification of AV25-S and AV5-T was achieved to a certain extent as shown by the admixture levels and PCA/dendogram results and given that they all presented intermediate phenology and no longer included early and late plants. With the structure K = 4 value, it was still possible to find a common genetic profile of the oat varieties Cayuse and Cajicá with the early and late mass selections of AV25-P and AV25-Ta. However, clear differentiation between the AV25-T, AV25-S and AV25-C selections was not possible, showing that the derived mass selections for the central Colombian sites was indeed derived from the original composite variety from southern Colombia.
The rapid advances in the development of large-scale genotyping platforms with the consequent decrease in processing costs have made genotyping with SNP chips an attractive and practical approach to rapidly characterize genomes and populations [6]. In the short term, these resources have opened the door to mass selection (MS) and the evaluation of populations. Such processes can also lead to genomic selection (GS) programs that use genome-wide molecular markers to predict the genetic merit of complex and quantitative traits in the improvement plant populations [37]. However, these GS breeding programs are often beyond the capacity of developing country national programs, such as the one at AGROSAVIA. For example, our budget only allowed one 96-well plate to be analyzed limiting the sampling for off-types, although providing room for evaluation of mass selections for the new purified varieties of AV25-S and AV25-T is useful for central Colombia. Therefore, in our study we emphasized the use of SNP arrays to evaluate varietal purity in MS derived sub-populations from a forage oat originally from southern Colombia.
The same SNP chip we used here validated SNPs on 1100 genotypes from 6 recombinant inbred line mapping populations [7]. Here we used fewer samples but had almost as many validated SNP markers as that study with 4950 loci called in our study and 4975 loci called in that previous study. This was better than some previous testing on pools of various oat cultivars and lines, which only provided 3500 polymorphic Mendelian loci [38].
We evaluated fewer genotypes but found more SNPs to be successfully called on the variety AV25-C and the AV25-S and AV25-T subpopulations derived from mass selections. In addition, our ability to capture outlier SNP markers in our oat population further endorsed the implementation of indirect polygenic selection strategies for the species in addition to the uses of SNP chips for multi-or pure-line varietal certification.
The application of SNP technology is already a routine practice in the regulatory processes of varietal identity and protection of plant breeders’ rights. SNP chips have been used to strengthen the production of pure seed in other countries. For instance, the 4004 loci SoySNP6K chip (Lee et al., 2016) was used in 858 Glycine max varieties by the Argentine National Seed Commission to regulate varietal purity. Similar scenarios have been reported for other grain species: wheat (Triticum aestivum L., Akhunov et al., 2009; [9], barley (Hordeum vulgare L., [11]), rice (Oriza sativa L., [18]) and quinoa (Chenopodium quinua Willd, [39]).
Oat selections in Colombia have been classified as early, intermediate and late due to the long growing period available in the tropical environment where no winter or summer limits physiological growth. Here we had all three types of oats ranging from the earliest AV25-P to the latest AV25-Ta. Early oats are characterized by <100 days to time of forage harvest (Z7.1 stage). Intermediate oats are harvestable for forage at 135 days on average, and late oats exceed 150 days to be harvested for forage [3]. Days to harvest affects dry matter production and nutritional value of forage oats [30].
In addition to yield differences, the forage oat varieties showed differences in growth habit, plant height, stems per plant, and leaves per plant. The use of oats for livestock feed is very common in some countries, especially where processing of oatmeal and rolled oats for human consumption is limited. In some cases, oats are a dual function crop providing a boiled porridge food for humans and a fodder for animals, such as milk cows and sheep. Oats used for forage purposes in Colombia are grown in the same way as the cereal grain that is grown for its seed, but fields of livestock oats are opened up for pasture directly by animals, often sheep or cattle. On the other hand, the forage oats can be harvested for hay to supplement dairy cows or for use by the large horse breeding industry.
In Colombia, varietal purity regulations follow an agreement of the Andean Community of Nations (adopted by decision 345 and regulatory decree 533 in 1993–1994) called the Common Regime for Protection of Plant Variety and Breeders’ Rights. The decree assigned the Colombian Agricultural Institute (ICA) as the national authority for the management of variety regulations. Likewise, the ICA standardized and implemented phenotypic evaluation techniques for the identification of cultivars (Valencia et al., 2010). This technology follows UPOV rules that a new plant variety must be different (D) from any other well-known variety, sufficiently uniform (U) and stable (S), according to Breeder’s Rights (Community Plant Variety Office, 2015).
Conventional tests for DUS as outlined above, especially for multi-lines like the variety used here, make use of morphological characteristics, such as descriptors, and are based on UPOV’s or national protocols. The reliance on phenotyping alone is problematics, as it is well known that morphological traits are highly influenced by the environment, which makes the predictions unreliable [9,25]. The morphological testing should be complemented using molecular markers, as a biotechnology tool for varietal identity. In the specific case of the application of SNPs in varietal quality control, the markers are a complementary tool to the use of morphological descriptors [7] and can give both within variety and between variety diversity, as found in this study. Its application in variety development programs among row crops has been successful in corn [40], chickpea (Cicer arietinum, [6]), pigeon pea (Cajanus cajan, [41]) and canola (Brassica napus, [42]). Here we show the success of marker fingerprinting in the first study of forage oats in Colombia.

5. Conclusions

Overall, our results showed that SNP marker analysis confirmed that visual selection for phenology was reliable. SNP genotyping allowed the identification of genetic differences existing within the original multi-line oat variety AV25. The information on the mass selected sub-populations AV25-S and AV25-T will facilitate registration [19,38] and will support plant breeders’ rights through better fingerprinting [42]. Moving forward, other cultivars might require the implementation of procedures for the purification of single plant derived lines. The AV25 variety is now a candidate for wider release across more departments of Colombia. Previous use of the forage variety was limited to the southern department of Nariño and had become contaminated with off types. However, now, it has been multiplied in two central highland locations (Susacón and Tibaitatá) for distribution within other highland regions (>2000 masl) in Boyacá and Cundinamarca departments. With a better understanding of the population structure for the variety and its sub-populations we can disseminate the cultivar more widely with greater uniformity. Varietal purity in oats is especially important due to the delayed production of late-maturing genotypes compared to the mid-season intermediate maturing selections made here. Apart from the varietal implications of this study, the results of this research also represent an opportunity to generate new breeding techniques for oats, which might leverage GS for complex polygenic selection (Heffner et al., 2010) in an improvement program for forage oats, which would help accelerate a growing dairy industry. For this breeding to be successful, it would be necessary to broaden the base population for local oats with novel genomic and phenotypic resources while developing machine learning predictors [43] to boost prediction of key yield and adaptive traits (Jannink et al., 2010). The oat SNP chip can continue to be used for varietal certification of other forage oat cultivars. Similar procedures would be useful in wheat and barley.

Supplementary Materials

The following supporting information can be downloaded at: https://www.mdpi.com/article/10.3390/agronomy12071710/s1. Table S1: Variation in development for Avena sativa phenological stages in days after planting (dap) for forage oat selections grown in highland Colombia (>2000 masl), including, AV25-P (early), AV25-C/AV25-S/AV25-T (all intermediate) and AV25-Ta (late) with growth periods as defined by the Zadoks et al. [30] scale. Figure S1: neighbor joining (NJ) dendogram for genetic clustering among oat genotypes. Dots are colored following same coding, as shown in Figure 2. Figure S2: Unsupervised genetic clustering of 88 individual plants from seven forage oat cultivars. Each individual is represented by a single vertical line divided into K colors, where this is the number of groups; length of the colored segment represents the estimated proportion of sample membership to a particular group. Bars in K = 4 are colored following Figure 2: orange and blue dots shown as blue bars for purified genotypes AV25-S (29 samples) and AV25-T (30 samples) with some of the AV25-C genotypes (13 samples); the bars in brown were AV25-P and a single AV25-S sample; and purple bars included commercial varieties and AV25-Ta.

Author Contributions

Conceptualization, L.F.C.-D. and D.B.-G.; methodology, L.F.C.-D., D.B.-G. and J.C.-S.; formal analysis, L.F.C.-D., D.B.-G., D.R.T.-C. and A.J.C.; investigation, L.F.C.-D. and M.W.B.; resources, L.F.C.-D.; data curation, D.B.-G., D.R.T.-C. and A.J.C.; writing—original draft preparation, L.F.C.-D. and M.W.B.; writing—review and editing, A.J.C. and M.W.B.; visualization, D.R.T.-C. and A.J.C.; supervision, L.F.C.-D. and M.W.B.; funding acquisition, L.F.C.-D. and M.W.B. All authors have read and agreed to the published version of the manuscript.

Funding

Agrosavia-Tibaitatá Station and Tennessee State University—Nashville and their sponsors the Ministry of Agriculture and Rural Development (MADR) and United States Department of Agriculture (USDA) for support to this work. USDA funding included Evans Allen (TEN-X07) and AFRI-Plant Breeding (New Crops Conference). Additional funding to Agrosavia was from the Fund for Milk and Meat of MADR.

Data Availability Statement

Data is available in the Supplementary Materials.

Acknowledgments

We appreciate help form Rodrigo Martinez Sarmiento of AGROSAVIA for experimental design, and Jhon Alexander Berdugo Cely for preliminary data analysis.

Conflicts of Interest

The authors declare no conflict of interest.

References

  1. Yan, H.; Martin, S.L.; Bekele, W.A.; Latta, R.G.; Diederichsen, A.; Peng, Y.; Tinker, N.A. Genome size variation in the genus Avena. Genome 2016, 59, 209–220. [Google Scholar] [CrossRef] [PubMed] [Green Version]
  2. Arango-Quispe, S.J.S.; Viera-Valencia, M.; Gómez Bravo, C.A. Agronomic Evaluation and Nutritive Value of Oat (Avena Sativa) under Rainfall Restriction in the Andes. Cienc. Tecnol. Agropecu. 2022, 23. [Google Scholar] [CrossRef]
  3. Campuzano-Duque, L.F.; Castro-Rincón, E.; Torres-Cuesta, D.; Castillo-Sierra, J.; Nieto-Sierra, D.; Portillo-Lopez, P.A. Altoandina: Nueva variedad forrajera para la zona andina en Colombia. Agron. Mesoam. 2020, 31, 581–591. [Google Scholar] [CrossRef]
  4. McCouch, S.R.; Wright, M.H.; Tung, C.W.; Maron, L.G.; McNally, K.L.; Fitzgerald, M.; Singh, N.; DeClerck, G.; Agosto-Perez, F.; Korniliev, P.; et al. Open access resources for genome-wide association mapping in rice. Nat. Commun. 2016, 7, 10532. [Google Scholar] [CrossRef] [Green Version]
  5. Poland, J.; Endelman, J.; Dawson, J.; Rutkoski, J.; Wu, S.; Manes, Y.; Dreisigacker, S.; Crossa, J.; Sánchez-Villeda, H.; Sorrells, M.; et al. Genomic selection in wheat breeding using genotyping-by-sequencing. Plant Genome J. 2012, 5, 103–113. [Google Scholar] [CrossRef] [Green Version]
  6. Tinker, N.A.; Chao, S.; Lazo, G.R.; Oliver, R.E.; Huang, Y.F.; Poland, J.A.; Jellen, E.; Maughan, P.J.; Kilian, A.; Jackson, E.W. A SNP genotyping array for hexaploid oat. Plant Genome 2014, 7, 1–8. [Google Scholar] [CrossRef]
  7. You, Q.; Yang, X.; Peng, Z.; Xu, L.; Wang, J. Development and applications of a high throughput genotyping tool for polyploid crops: Single nucleotide polymorphism (SNP) Array. Front. Plant Sci. 2018, 9, 104. [Google Scholar] [CrossRef] [Green Version]
  8. Lu, F.; Lipka, A.E.; Glaubitz, J.; Elshire, R.; Cherney, J.H.; Casler, M.D.; Buckler, E.S.; Costich, D.E. Switchgrass Genomic Diversity, Ploidy, and Evolution: Novel Insights from a Network-Based SNP Discovery Protocol. PLoS Genet. 2013, 9, e1003215. [Google Scholar] [CrossRef] [PubMed] [Green Version]
  9. Tinker, N.A.; Kilian, A.; Wight, C.P.; Heller-Uszynska, K.; Wenzl, P.; Rines, H.W.; Bjørnstad, A.; Howarth, C.J.; Jannink, J.-L.; Anderson, J.M.; et al. New DArT markers for oat provide enhanced map coverage and global germplasm characterization. BMC Genom. 2009, 10, 39. [Google Scholar] [CrossRef] [Green Version]
  10. Korir, P.C.; Zhang, J.; Wu, K.; Zhao, T.; Gai, J. Association mapping combined with linkage analysis for aluminum tolerance among soybean cultivars released in Yellow and Changjiang River Valleys in China. Theor. Appl. Genet. 2013, 126, 1659–1675. [Google Scholar] [CrossRef]
  11. Bayer, M.M.; Rapazote-Flores, P.; Ganal, M.; Hedley, P.; Macaulay, M.; Plieske, J.; Ramsay, L.; Russell, J.; Shaw, P.D.; Thomas, W.; et al. Development and evaluation of a barley 50k iSelect SNP array. Front. Plant Sci. 2017, 8, 1792. [Google Scholar] [CrossRef] [PubMed] [Green Version]
  12. Bekele, W.A.; Wight, C.P.; Chao, S.; Howarth, C.; Tinker, N.A. Haplotype based genotyping-by-sequencing in oat genome research. Plant Biotechnol. J. 2018, 16, 1452–1463. [Google Scholar] [CrossRef] [PubMed] [Green Version]
  13. Waters, D.; Bundock, P.; Henry, R. Genotyping by allele-specific PCR. In Plant Genotyping II: SNP Technology; Henry, R., Ed.; CABI: Oxfordshire, UK, 2008; pp. 88–97. [Google Scholar]
  14. Chen, H.; Xie, W.; He, H.; Yu, H.; Chen, W.; Li, J.; Yu, R.; Yao, Y.; Zhang, W.; He, Y.; et al. A high-density SNP genotyping array for rice biology and molecular breeding. Mol. Plant 2014, 7, 541–553. [Google Scholar] [CrossRef] [Green Version]
  15. Felcher, K.J.; Coombs, J.J.; Massa, A.N.; Hansey, C.N.; Hamilton, J.P.; Veilleux, R.E.; Buell, C.R.; Douches, D.S. Integration of two diploid potato linkage maps with the potato genome sequence. PLoS ONE 2012, 7, e36347. [Google Scholar] [CrossRef] [Green Version]
  16. Ganal, M.W.; Durstewitz, G.; Polley, A.; Bérard, A.; Buckler, E.S.; Charcosset, A.; Clarke, J.D.; Graner, E.-M.; Hansen, M.; Joets, J.; et al. A large maize (Zea mays L.) SNP genotyping array: Development and germplasm genotyping, and genetic mapping to compare with the B73 reference genome. PLoS ONE 2011, 6, e28334. [Google Scholar] [CrossRef] [PubMed] [Green Version]
  17. Clarke, W.E.; Higgins, E.E.; Plieske, J.; Wieseke, R.; Sidebottom, C.; Khedikar, Y.; Batley, J.; Edwards, D.; Meng, J.; Li, R.; et al. A high-density SNP genotyping array for Brassica napus and its ancestral diploid species based on optimised selection of single-locus markers in the allotetraploid genome. Theor. Appl. Genet. 2016, 129, 1887–1899. [Google Scholar] [CrossRef] [Green Version]
  18. Yu, H.; Xie, W.; Li, J.; Zhou, F.; Zhang, Q. A whole-genome SNP array (RICE6K) for genomic breeding in rice. Plant Biotechnol. J. 2013, 12, 28–37. [Google Scholar] [CrossRef]
  19. Hulse-Kemp, A.M.; Lemm, J.; Plieske, J.; Ashrafi, H.; Buyyarapu, R.; Fang, D.D.; Frelichowski, J.; Giband, M.; Hague, S.; Hinze, L.L.; et al. Development of a 63K SNP Array for Cotton and High-Density Mapping of Intraspecific and Interspecific Populations of Gossypium spp. Genes|Genomes|Genet. 2015, 5, 1187–1209. [Google Scholar] [CrossRef] [Green Version]
  20. Unterseer, S.; Bauer, E.; Haberer, G.; Seidel, M.; Knaak, C.; Ouzunova, M.; Meitinger, T.; Strom, T.M.; Fries, R.; Pausch, H.; et al. A powerful tool for genome analysis in maize: Development and evaluation of the high density 600 k SNP genotyping array. BMC Genom. 2014, 15, 823. [Google Scholar] [CrossRef] [Green Version]
  21. Wang, S.; Wong, D.; Forrest, K.; Allen, A.; Chao, S.; Huang, B.E.; Maccaferri, M.; Salvi, S.; Milner, S.G.; Cattivelli, L.; et al. Characterization of polyploid wheat genomic diversity using a high-density 90,000 single nucleotide polymorphism array. Plant Biotechnol. J. 2014, 12, 787–796. [Google Scholar] [CrossRef] [Green Version]
  22. Cortés, A.J.; Blair, M.W. Genotyping by Sequencing and Genome—Environment Associations in Wild Common Bean Predict Widespread Divergent Adaptation to Drought. Front. Plant Sci. 2018, 9, 128. [Google Scholar] [CrossRef] [PubMed] [Green Version]
  23. Blair, M.W.; Cortes, A.J.; Farmer, A.D.; Huang, W.; Ambachew, D.; Penmetsa, R.V.; Carrasquilla-Garcia, N.; Assefa, T.; Cannon, S.B. Uneven recombination rate and linkage disequilibrium across a reference SNP map for common bean (Phaseolus vulgaris L.). PLoS ONE 2018, 13, e0189597. [Google Scholar] [CrossRef] [PubMed] [Green Version]
  24. Bianco, L.; Cestaro, A.; Linsmith, G.; Muranty, H.; Denance, C.; Théron, A.; Troggio, M. Development and validation of the Axiom Apple 480k SNP genotyping array. Plant J. 2016, 86, 62–74. [Google Scholar] [CrossRef] [PubMed] [Green Version]
  25. Aitken, K.; Farmer, A.; Berkman, P.; Muller, C.; Wei, X.; Demano, E.; Jackson, P.; Magwire, M.; Dietrich, B.; Kota, R. Generation of a 345K sugarcane SNP chip. Proc. Int. Soc. Sugar Cane Technol. 2016, 29, 1165–1172. Available online: http://www.issct.org/pdf/proceedings/2016/Molecular-Biology-papers/document-4.pdf (accessed on 12 July 2022).
  26. Bassil, N.V.; Davis, T.M.; Zhang, H.; Ficklin, S.; Mittmann, M.; Webster, T.; Mahoney, L.L.; Wood, D.; Alperin, E.S.; Rosyara, U.R.; et al. Development and preliminary evaluation of a 90K Axiom SNP array for the allo-octoploid cultivated strawberry Fragaria x ananassa. BCM Genom. 2015, 16, 155. Available online: https://bmcgenomics.biomedcentral.com/articles/10.1186/s12864-015-1310-1 (accessed on 12 July 2022). [CrossRef] [Green Version]
  27. Clevenger, J.; Chu, Y.; Chavarro, C.; Agarwal, G.; Bertioli, D.J.; Leal-Bertioli, S.C.M.; Pandey, M.K.; Vaughn, J.; Abernathy, B.; Barkley, N.A.; et al. Genome-wide SNP Genotyping Resolves Signatures of Selection and Tetrasomic Recombination in Peanut. Mol. Plant 2017, 10, 309–322. [Google Scholar] [CrossRef] [Green Version]
  28. Pandey, M.K.; Agarwal, G.; Kale, S.M.; Clevenger, J.; Nayak, S.N.; Sriswathi, M.; Chitikineni, A.; Chavarro, C.; Chen, X.; Upadhyaya, H.D.; et al. Development and evaluation of a high-density genotyping “axiom_arachis” array with 58 K SNPs for accelerating genetics and breeding in groundnut. Sci. Rep. 2017, 7, 40577. [Google Scholar] [CrossRef]
  29. Oliver, R.E.; Tinker, N.A.; Lazo, G.R.; Chao, S.; Jellen, E.N.; Carson, M.L.; Rines, H.W.; Obert, D.E.; Lutz, J.D.; Shackelford, I.; et al. SNP discovery and chromosome anchoring provide the first physically anchored hexaploid oat map and reveal synteny with model species. PLoS ONE 2013, 8, e58068. [Google Scholar] [CrossRef]
  30. Zadoks, J.C.; Chang, T.T.; Konzak, C.F. A decimal code for the growth stages of cereals. Weed Res. 1974, 14, 415–421. [Google Scholar] [CrossRef]
  31. Purcell, S.; Neale, B.; Todd-Brown, K.; Thomas, L.; Ferreira, M.A.R.; Bender, D.; Maller, J.; Sklar, P.; de Bakker, P.I.W.; Daly, M.J.; et al. PLINK: A tool set for whole-genome association and population-based linkage analyses. Am. J. Hum. Genet. 2007, 81, 559–575. [Google Scholar] [CrossRef] [Green Version]
  32. Alexander, D.H.; Novembre, J.; Lange, K. Fast model-base estimation of ancestry in unrelated individuals. Genome Res. 2009, 19, 1655–1664. [Google Scholar] [CrossRef] [PubMed] [Green Version]
  33. Beerli, P.; Felsenstein, J. Maximum likelihood estimation of migration rates and effective population numbers in two populations using a coalescent approach. Genetics 1999, 152, 763–773. [Google Scholar] [CrossRef] [PubMed]
  34. Watterson, G.A. Number of segregating sites in genetic models without recombination. Theor. Popul. Biol. 1975, 7, 256–276. [Google Scholar] [CrossRef]
  35. Tajima, F. Statistical method for testing the neutral mutation hypothesis by DNA polymorphism. Genetics 1989, 123, 585–595. [Google Scholar] [CrossRef]
  36. Bradbury, P.J.; Zhang, Z.; Kroon, D.E.; Casstevens, R.M.; Ramdoss, Y.; Buckler, E.S. TASSELL Software for association mapping of complex traits in diverse samples. Bioinformatics 2007, 23, 2633–2635. [Google Scholar] [CrossRef]
  37. Meuwissen, T.H.E.; Hayes, B.J.; Goddard, M.E. Prediction of total genetic value using genome-wide dense marker maps. Genetics 2001, 157, 1819–1829. Available online: https://www.ncbi.nlm.nih.gov/pmc/articles/PMC1461589 (accessed on 12 July 2022). [CrossRef]
  38. Tumino, G.; Voorrips, R.E.; Rizza, F.; Badeck, F.W.; Morcia, C.; Ghizzoni, R.; Germeier, C.U.; Paulo, M.-J.; Terzi, V.; Smulders, M.J.M. Population structure and genome-wide association analysis for frost tolerance in oat using continuous SNP array signal intensity ratios. Theor. Appl. Genet. 2016, 129, 1711–1724. [Google Scholar] [CrossRef] [Green Version]
  39. Maughan, P.J.; Smith, S.M.; Rojas-Beltran Elzinga, D.; Raney, J.A.; Jellen, E.N.; Fairbanks, J.D. Single nucleotide polymorphisms identification, characterization, and linkage mapping in Chenopodium quinua. Plant Genome 2012, 5, 1–7. [Google Scholar] [CrossRef]
  40. Winfield, M.O.; Allen, A.M.; Burridge, A.J.; Barker, G.L.A.; Benbow, H.R.; Wilkinson, P.A.; Coghill, J.; Waterfall, C.; Davassi, A.; Scopes, G.; et al. High-density SNP genotyping array for hexaploid wheat and its secondary and tertiary gene pool. Plant Biotechnol. J. 2015, 14, 1195–1206. [Google Scholar] [CrossRef]
  41. Saxena, R.K.; Varma Penmetsa, R.; Upadhyaya, H.D.; Kumar, A.; Carrasquilla-Garcia, N.; Schlueter, J.A.; Farmer, A.; Whaley, A.M.; Sarma, B.; May, G.D.; et al. Large-scale development of cost-effective single-nucleotide polymorphism marker assays for genetic mapping in Pigeonpea and comparative mapping in legumes. DNA Res. 2012, 19, 449–461. [Google Scholar] [CrossRef]
  42. Tinker, N.A.; Bekele, W.A.; Hattori, J. Haplotag: Software for Haplotype-Based Genotyping-by-Sequencing Analysis. Genes|Genomes|Genet. 2016, 6, 857–863. [Google Scholar] [CrossRef] [PubMed] [Green Version]
  43. Cortés, A.J.; López-Hernández, F. Harnessing Crop Wild Diversity for Climate Change Adaptation. Genes 2021, 12, 783. [Google Scholar] [CrossRef] [PubMed]
Figure 1. Genetic structure of 88 plants representing seven forage oat genotypes (A = Cajicá and Cayuse, commercial varieties), B = AV25-C, the mixed source population, C = AV25-P, the early selection D = AV25-S, mass selection samples from Sutacón, E = AV25-T mass selection samples from Tibaitatá and F = AV25-Ta, the late selection. Each individual panel is divided into subgroups coded in colors based on clustering K-value from 2 to 4 being the number of groups assumed. Length of the bar segment represents the estimated proportion of sample membership.
Agronomy 12 01710 g001
Figure 2. Analysis of main components (PCoA) for estimating genetic structure patterns of forage oat genotypes used in this study: with (a) first two components, (b) first and second components, and (c) second and third components. The percentage of variation explained by each component is shown within parenthesis in the label of the corresponding axis. Axes are drawn to the same scale to make comparisons. Different colors represent groups.
Agronomy 12 01710 g002
Figure 3. Networks depicting (a) relative divergence scores (FST), and (b) bidirectional gene flow (computed by migrants per generation, Nem) among four forage oat genetic clusters (circles). Clusters were determined following the unsupervised clustering approaches of the previous section: where the orange (1) and blue (2) clusters included samples of the purified genotypes AV25-S (29 lines), AV25-T (30) and some of the AV25-C samples (13); the purple cluster (3) included samples of commercial varieties, and AV25-P and AV25-Ta; and the brown cluster (4) included AV25-P samples and a single AV25-S sample.
Agronomy 12 01710 g003
Publisher’s Note: MDPI stays neutral with regard to jurisdictional claims in published maps and institutional affiliations.

