
Photosystem II Repair Cycle in Faba Bean May Play a Role in Its Resistance to Botrytis fabae Infection

 , ,
, , 
Abstract
:1. Introduction
2. Materials and Methods
2.1. Plant Material and Sample Collection
2.2. Protein Extraction and Gel Electrophoresis
2.3. Image Acquisition and Statistical Analysis
2.4. Protein Identification by Mass Spectrometry (MALDI-TOF/TOF)
2.5. Zymography
3. Results
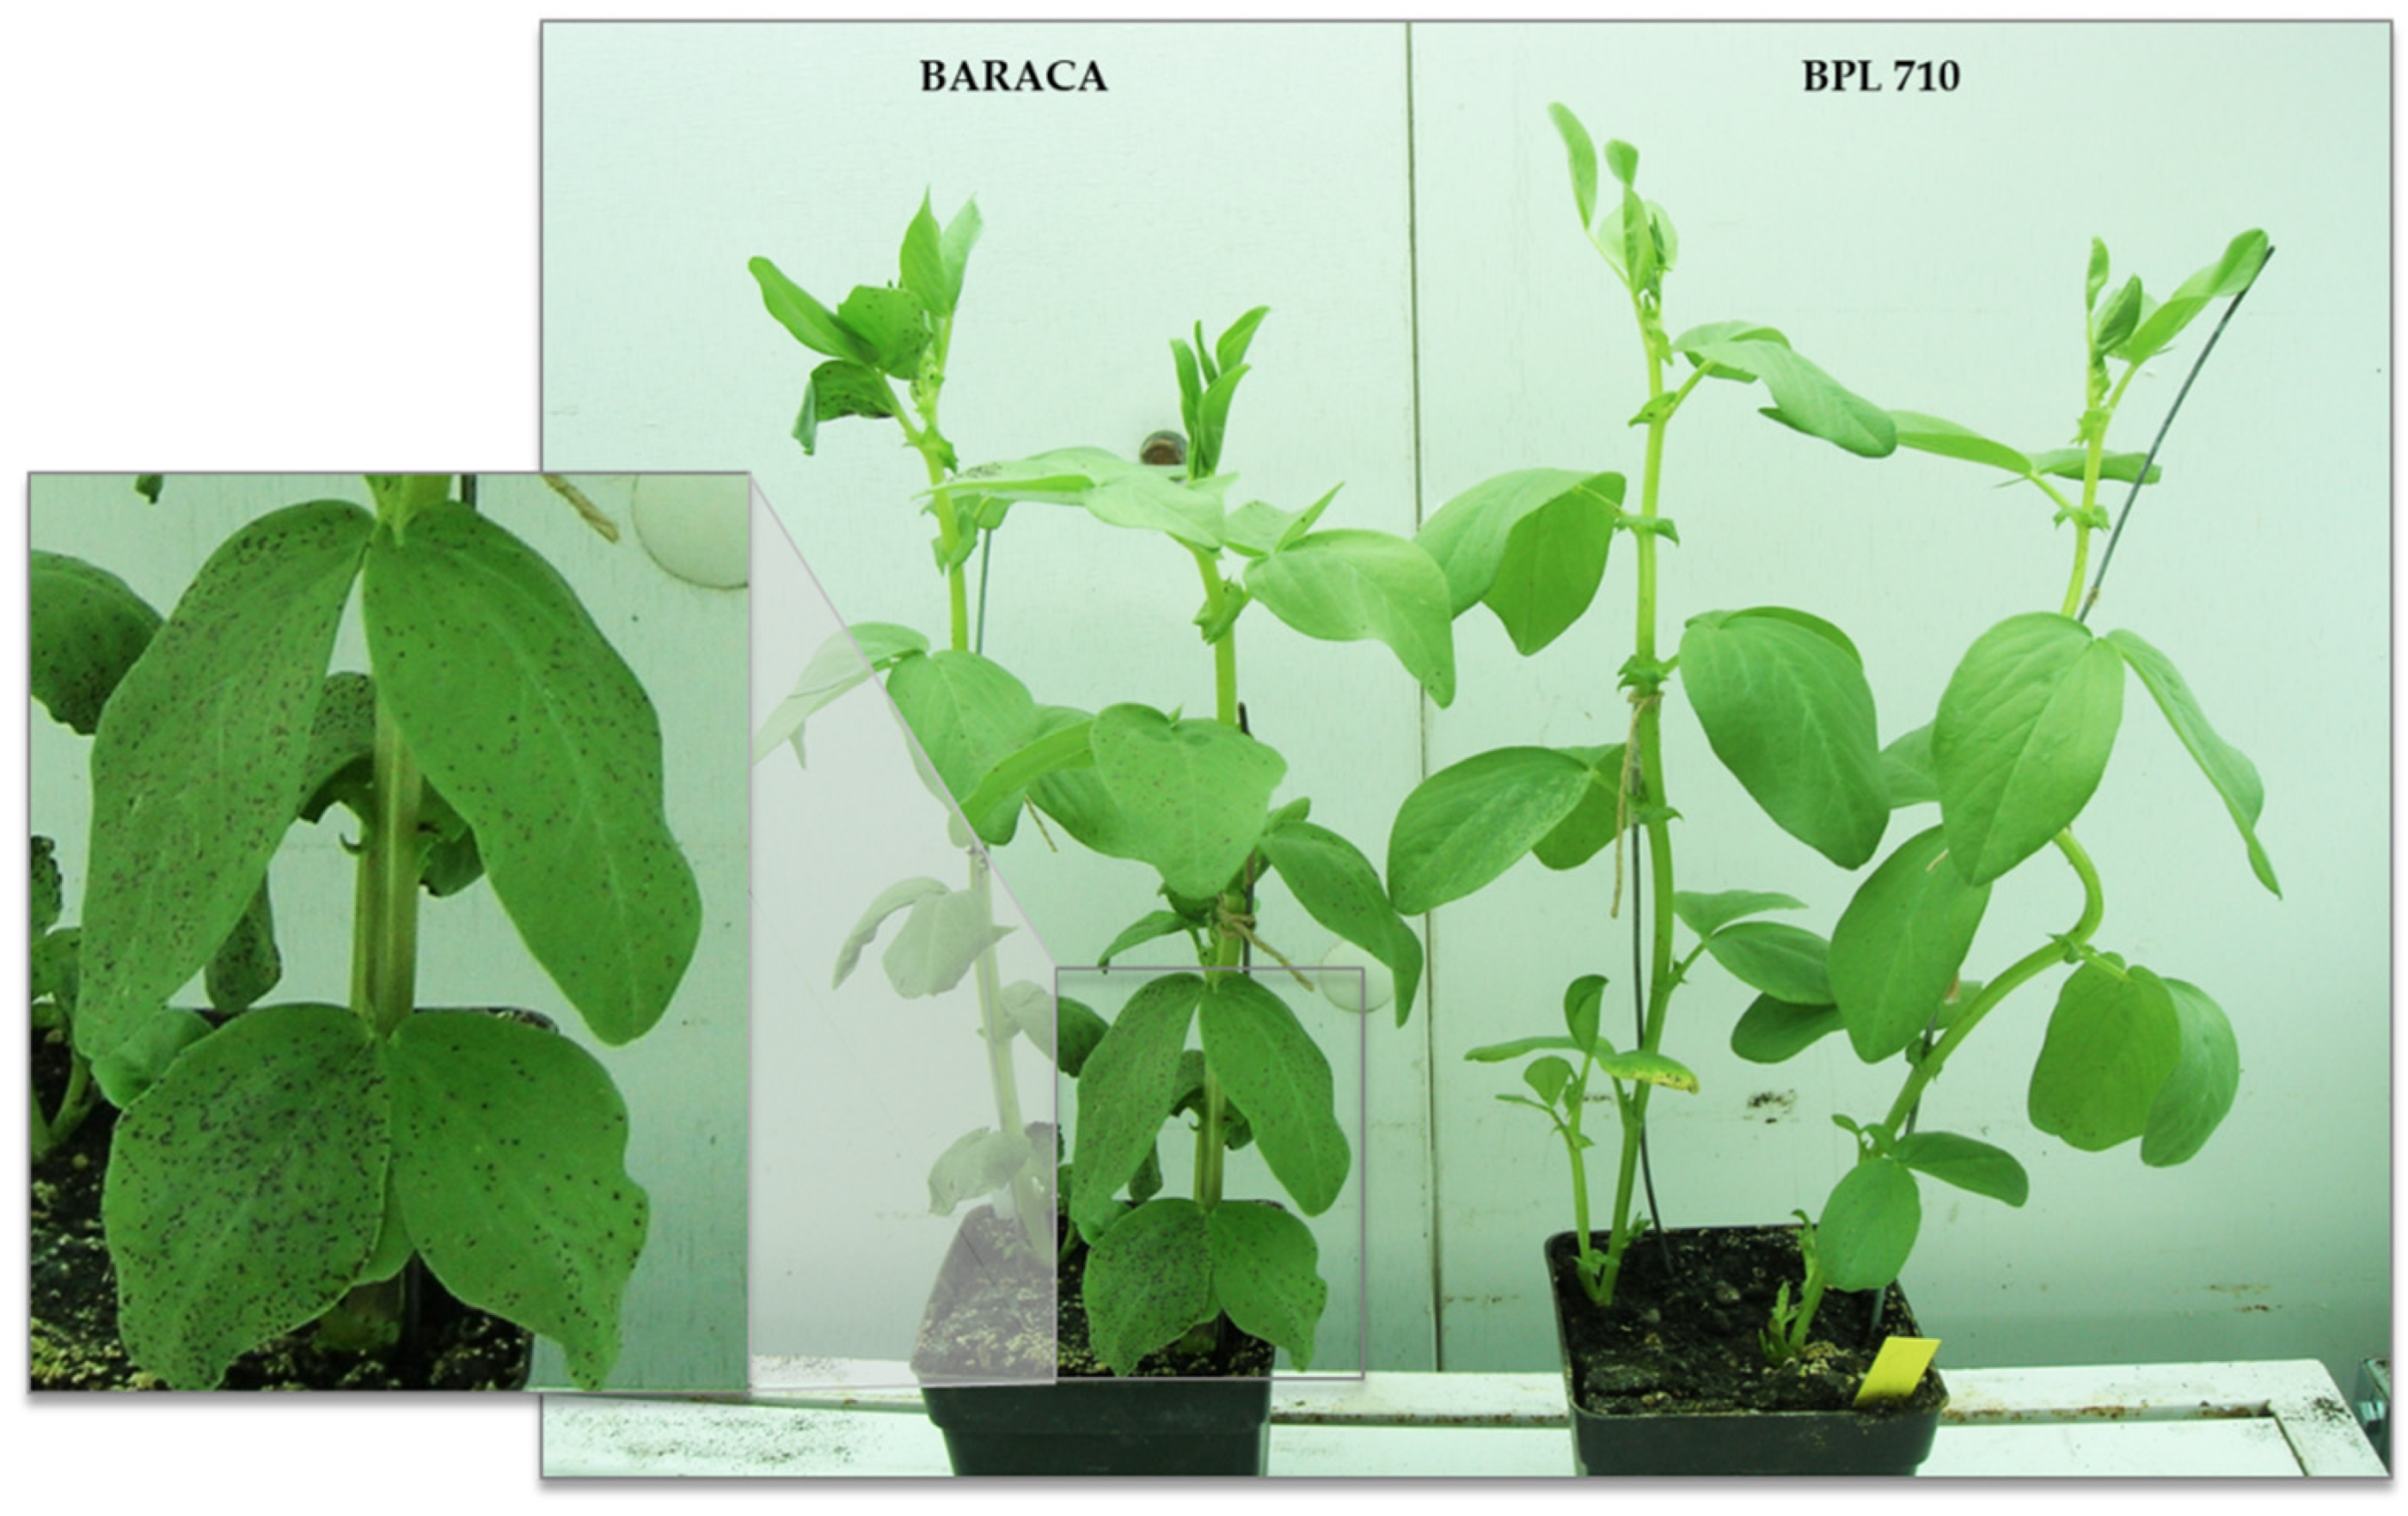
3.1. Disease Assessment
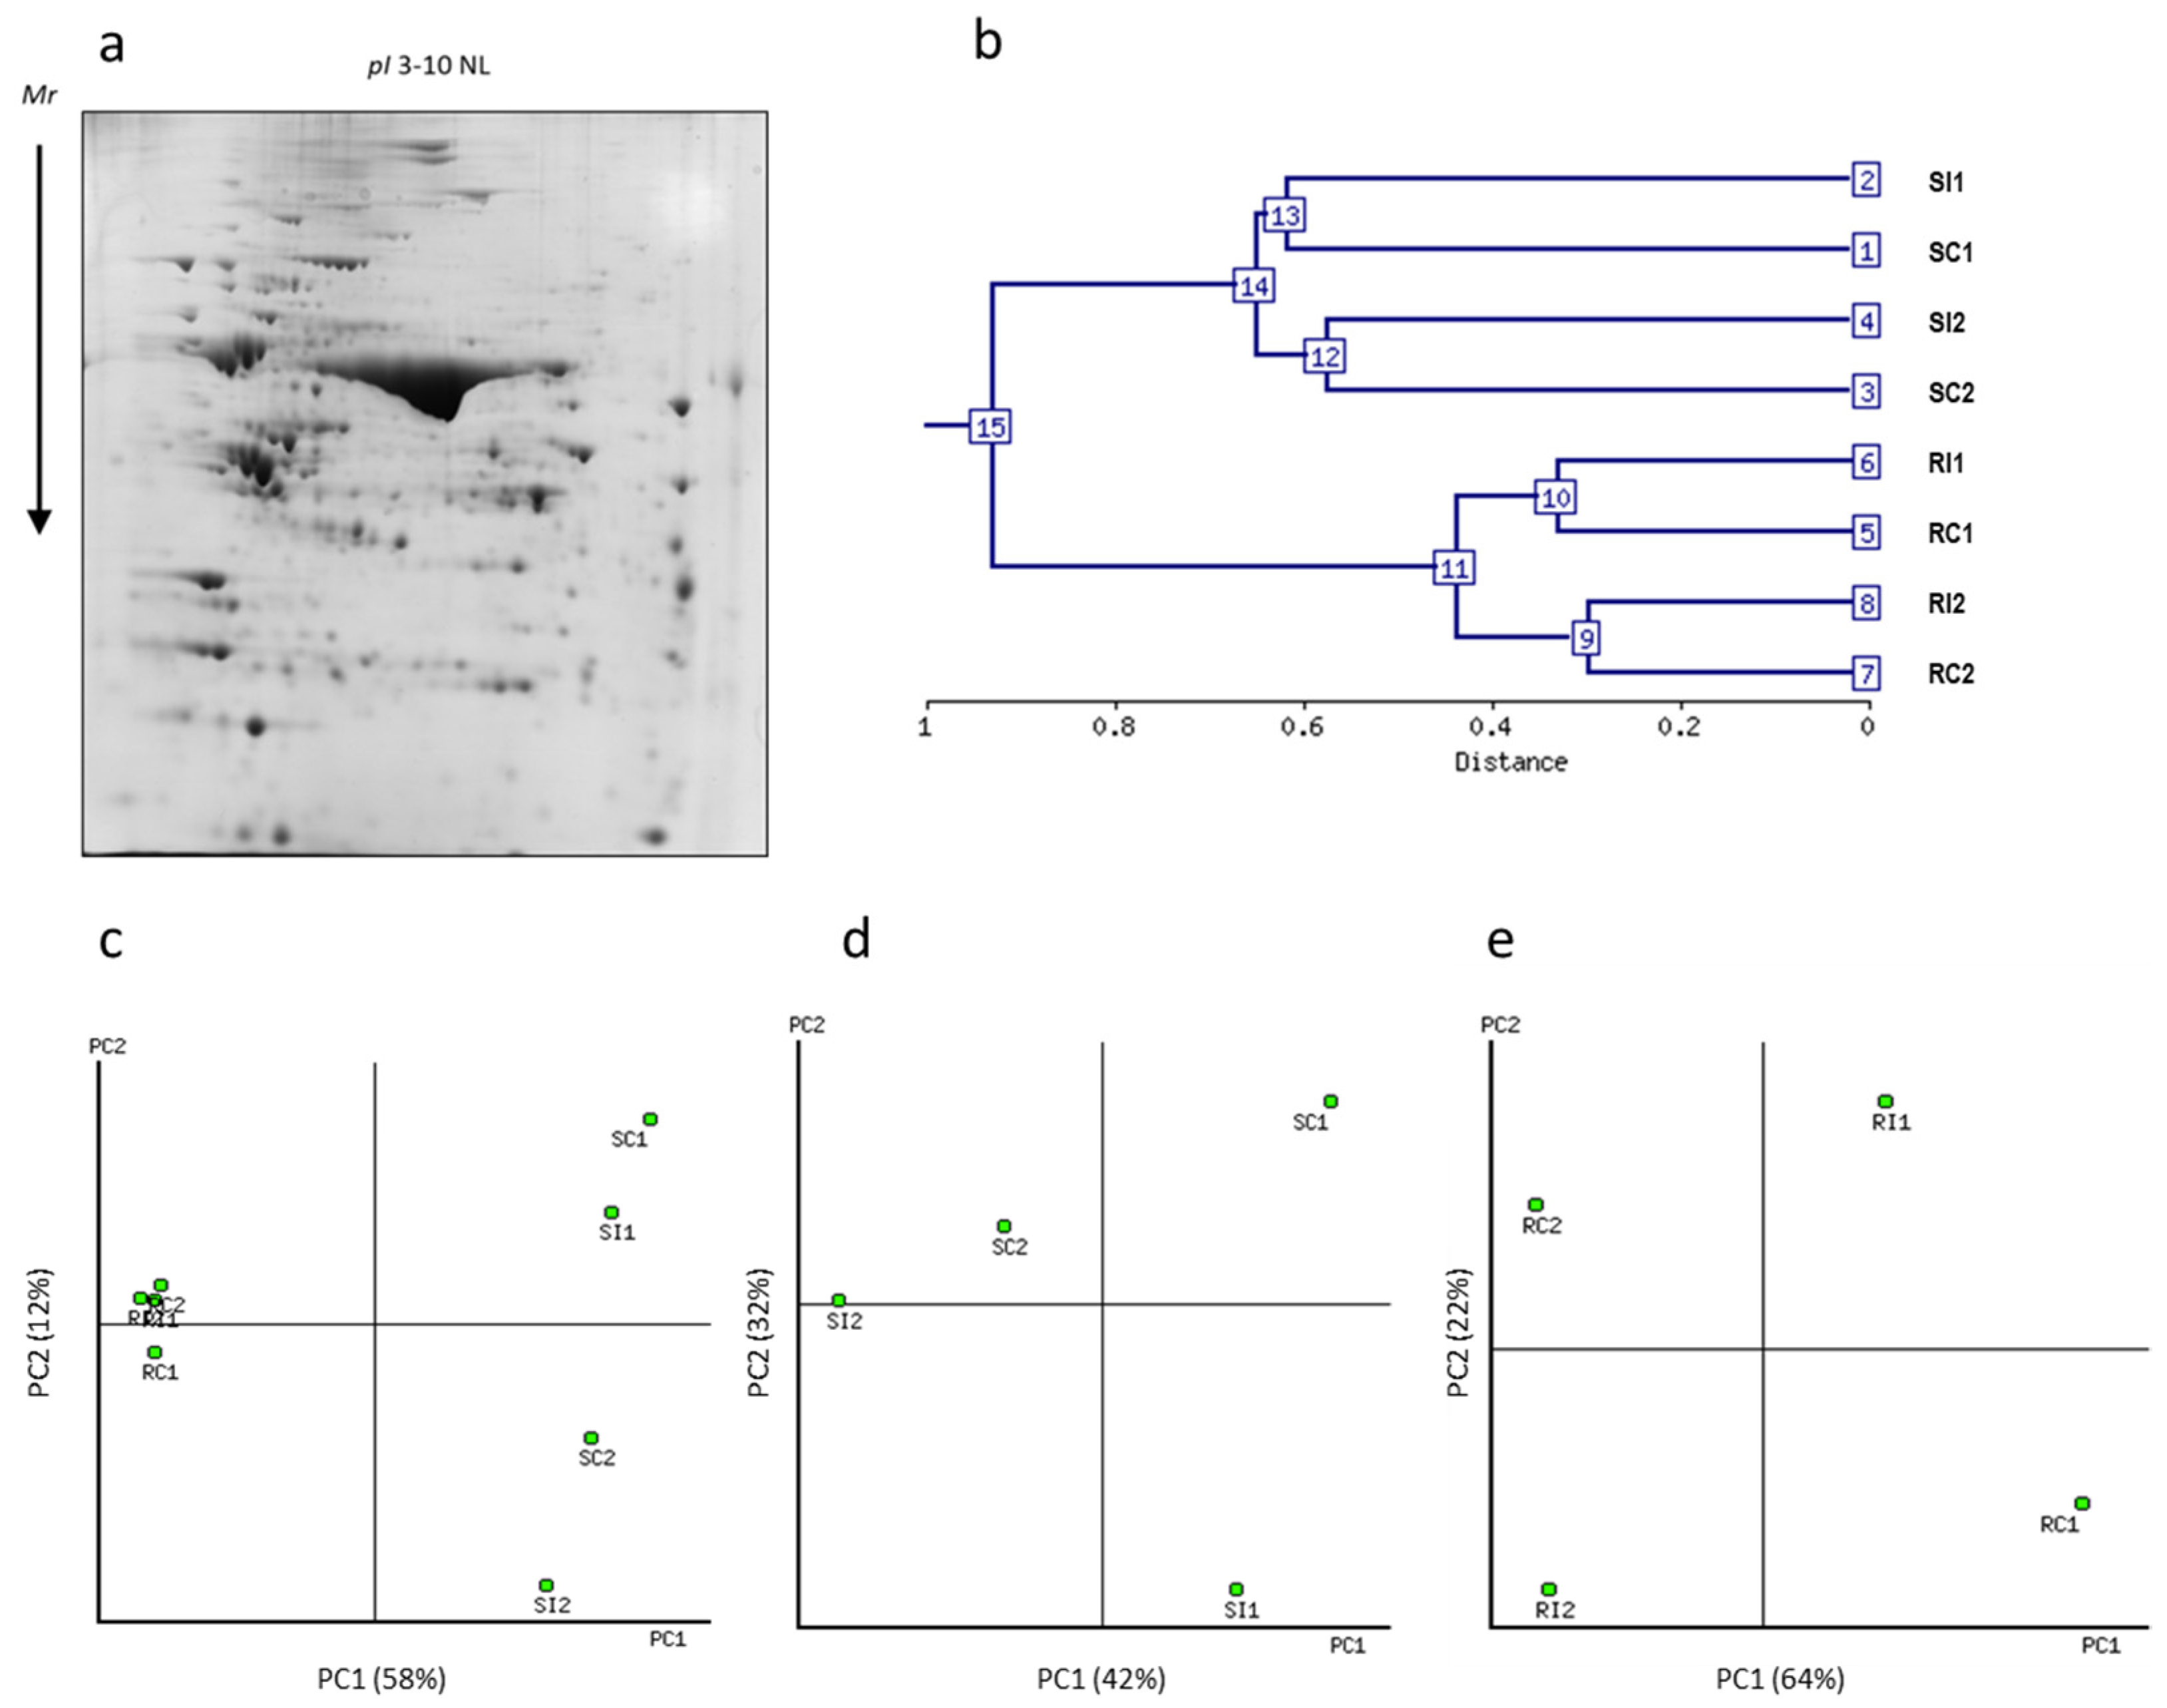
3.2. Two-Dimensional Gel Electrophoresis and MSMS Analysis
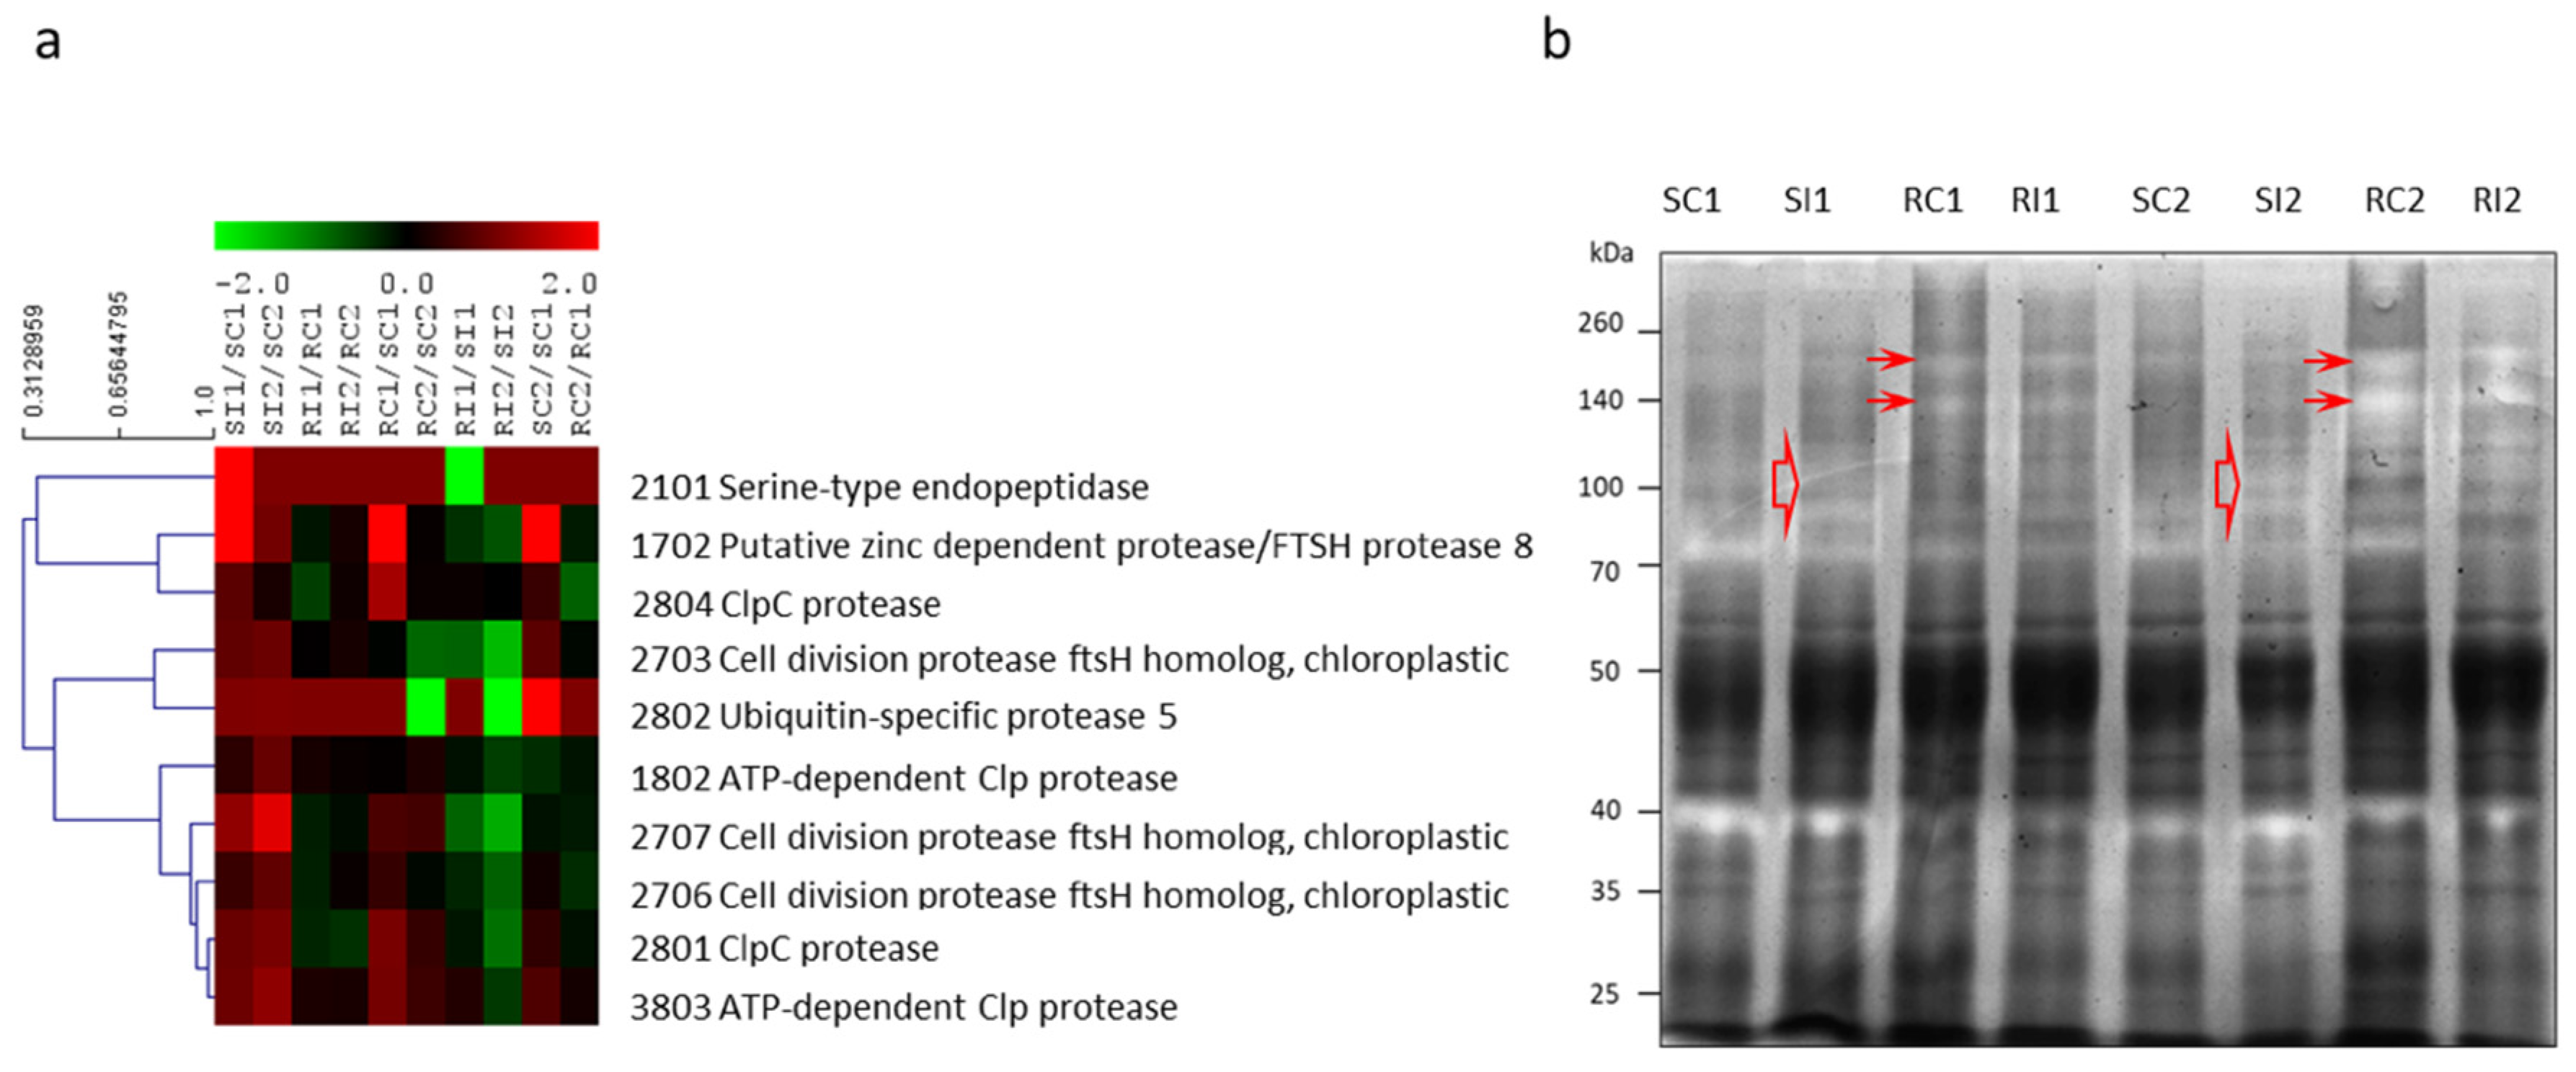
3.3. Protein Identification and Abundance Pattern Analysis
3.4. Protease Gel Activity
4. Discussion
4.1. The Role of Chloroplasts as Redox Sensors Eliciting an Acclimatory Response to Stressing Conditions
4.2. Homeostatic Control as a Dynamic Regulation Mechanism for Energy and Redox Status in Response to Botrytis fabae
5. Conclusions
Supplementary Materials
Author Contributions
Funding
Institutional Review Board Statement
Informed Consent Statement
Data Availability Statement
Acknowledgments
Conflicts of Interest
References
- Khazaei, H.; O’Sullivan, D.M.; Stoddard, F.L.; Adhikari, K.N.; Paull, J.G.; Schulman, A.H.; Andersen, S.U.; Vandenberg, A. Recent advances in faba bean genetic and genomic tools for crop improvement. Legum. Sci. 2021, 3, e75. [Google Scholar] [CrossRef]
- Rispail, N.; Kaló, P.; Kiss, G.B.; Ellis, T.N.; Gallardo, K.; Thompson, R.D.; Prats, E.; Larrainzar, E.; Ladrera, R.; González, E.M.; et al. Model legumes contribute to faba bean breeding. Field Crop. Res. 2010, 115, 253–269. [Google Scholar] [CrossRef] [Green Version]
- Cernay, C.; Ben-Ari, T.; Pelzer, E.; Meynard, J.-M.; Makowski, D. Estimating variability in grain legume yields across Europe and the Americas. Sci. Rep. 2015, 5, 11171. [Google Scholar] [CrossRef]
- Kharrat, M.; Le Guen, J.; Tivoli, B. Genetics of resistance to 3 isolates of Ascochyta fabae on Faba bean (Vicia faba L.) in controlled conditions. Euphytica 2006, 151, 49–61. [Google Scholar] [CrossRef]
- Tivoli, B.; Baranger, A.; Avila, C.; Banniza, S.; Barbetti, M.; Chen, W.; Davidson, J.; Lindeck, K.; Kharrat, M.; Rubiales, D.; et al. Screening techniques and sources of resistance to foliar diseases caused by major necrotrophic fungi in grain legumes. Euphytica 2006, 147, 223–253. [Google Scholar] [CrossRef]
- Stoddard, F.; Nicholas, A.; Rubiales, D.; Thomas, J.; Villegas-Fernández, A. Integrated pest management in faba bean. Field Crop. Res. 2010, 115, 308–318. [Google Scholar] [CrossRef] [Green Version]
- Harrison, J.G. Effects of environmental factors on growth of lesions on field bean leaves infected by Botrytis fabae. Ann. Appl. Biol. 1980, 95, 53–61. [Google Scholar] [CrossRef]
- Harrison, J.G. The biology of Botrytis spp. on Vicia beans and chocolate spot disease—A review. Plant Pathol. 1988, 37, 168–201. [Google Scholar] [CrossRef]
- Murray, G.M.; Brennan, J.P. The Current and Potential Costs from Diseases of Pulse Crops in Australia; Grains Research and Development Corporation: Canberra, Australia, 2012. [Google Scholar]
- Villegas-Fernández, A.; Sillero, J.; Emeran, A.; Winkler, J.; Raffiot, B.; Tay, J.; Flores, F.; Rubiales, D. Identification and multi-environment validation of resistance to Botrytis fabae in Vicia faba. Field Crop. Res. 2009, 114, 84–90. [Google Scholar] [CrossRef]
- Sillero, J.C.; Villegas-Fernández, A.M.; Thomas, J.; Rojas-Molina, M.M.; Emeran, A.A.; Fernández-Aparicio, M.; Rubiales, D. Faba bean breeding for disease resistance. Field Crop. Res. 2010, 115, 297–307. [Google Scholar] [CrossRef] [Green Version]
- Bouhassan, A.; Sadiki, M.; Tivoli, B. Evaluation of a collection of faba bean (Vicia faba L.) genotypes originating from the Maghreb for resistance to chocolate spot (Botrytis fabae) by assessment in the field and laboratory. Euphytica 2004, 135, 55–62. [Google Scholar] [CrossRef]
- Williamson, B.; Tudzynski, B.; Tudzynski, P.; van Kan, J.A. Botrytis cinerea: The cause of grey mould disease. Mol. Plant Pathol. 2007, 8, 561–580. [Google Scholar] [CrossRef] [PubMed]
- Cimmino, A.; Villegas-Fernández, A.M.; Andolfi, A.; Melck, D.; Rubiales, D.; Evidente, A. Botrytone, a New Naphthalenone Pentaketide Produced by Botrytis fabae, the Causal Agent of Chocolate Spot Disease on Vicia faba. J. Agric. Food Chem. 2011, 59, 9201–9206. [Google Scholar] [CrossRef] [PubMed]
- AbuQamar, S.F.; Moustafa, K.; Tran, L.S.P. ‘Omics’ and plant responses to Botrytis cinerea. Front. Plant. Sci. 2016, 7, 1658. [Google Scholar] [CrossRef] [PubMed] [Green Version]
- Ren, H.; Bai, M.; Sun, J.; Liu, J.; Ren, M.; Dong, Y.; Wang, N.; Ning, G.; Wang, C. RcMYB84 and RcMYB123 mediate jasmonate-induced defense responses against Botrytis cinerea in rose (Rosa chinensis). Plant. J. 2020, 103, 1839–1849. [Google Scholar] [CrossRef] [PubMed]
- AbuQamar, S.; Ajeb, S.; Sham, A.; Enan, M.R.; Iratni, R. A mutation in the expansin-like A2 gene enhances resistance to necrotrophic fungi and hypersensitivity to abiotic stress in Arabidopsis thaliana. Mol. Plant. Pathol. 2013, 14, 813–827. [Google Scholar] [CrossRef] [PubMed]
- AbuQamar, S. Expansins: Cell Wall Remodeling Proteins with a Potential Function in Plant Defense. J. Plant Biochem. Physiol. 2014, 2, 118. [Google Scholar] [CrossRef] [Green Version]
- VanEtten, H.D.; Mansfield, J.W.; Bailey, J.A.; Farmer, E.E. Two Classes of Plant Antibiotics: Phytoalexins versus ‘Phytoanticipins’. Plant Cell 1994, 6, 1191. [Google Scholar] [CrossRef]
- VAN Loon, L.; VAN Strien, E. The families of pathogenesis-related proteins, their activities, and comparative analysis of PR-1 type proteins. Physiol. Mol. Plant Pathol. 1999, 55, 85–97. [Google Scholar] [CrossRef]
- van Loon, L.; Rep, M.; Pieterse, C. Significance of Inducible Defense-related Proteins in Infected Plants. Annu. Rev. Phytopathol. 2006, 44, 135–162. [Google Scholar] [CrossRef] [PubMed] [Green Version]
- Dangl, J.L.; Jones, J.D.G. Plant pathogens and integrated defence responses to infection. Nature 2001, 411, 826–833. [Google Scholar] [CrossRef] [PubMed]
- Colmenares, A.J.; Aleu, J.; Duran-Patron, R.M.; Collado, I.G.; Hernandez-Galán, R. The putative role of botrydial and related metabolites in the infection mechanism of Botrytis cinerea. J. Chem. Ecol. 2002, 28, 997–1005. [Google Scholar] [CrossRef] [PubMed]
- Patykowski, J.; Urbanek, H. Activity of Enzymes Related to H2O2 Generation and Metabolism in Leaf Apoplastic Fraction of Tomato Leaves Infected with Botrytis cinerea. J. Phytopathol. 2003, 151, 153–161. [Google Scholar] [CrossRef]
- Rolke, Y.; Liu, S.; Quidde, T.; Williamson, B.; Schouten, A.; Weltring, K.-M.; Siewers, V.; Tenberge, K.B.; Tudzynski, B.; Tudzynski, P. Functional analysis of H2O2-generating systems in Botrytis cinerea: The major Cu-Zn-superoxide dismutase (BCSOD1) contributes to virulence on French bean, whereas a glucose oxidase (BCGOD1) is dispensable. Mol. Plant Pathol. 2004, 5, 17–27. [Google Scholar] [CrossRef]
- Hua, L.; Yong, C.; Zhanquan, Z.; Boqiang, L.; Guozheng, Q.; Shiping, T. Pathogenic mechanisms and control strategies of Botrytis cinerea causing post-harvest decay in fruits and vegetables. Food Qual. Saf. 2018, 2, 111–119. [Google Scholar] [CrossRef] [Green Version]
- Stamelou, M.-L.; Sperdouli, I.; Pyrri, I.; Adamakis, I.-D.; Moustakas, M. Hormetic Responses of Photosystem II in Tomato to Botrytis cinerea. Plants 2021, 10, 521. [Google Scholar] [CrossRef]
- El-Komy, M.H. Comparative Analysis of Defense Responses in Chocolate Spot-Resistant and -Susceptible Faba Bean (Vicia faba) Cultivars Following Infection by the Necrotrophic Fungus Botrytis fabae. Plant Pathol. J. 2014, 30, 355–366. [Google Scholar] [CrossRef] [Green Version]
- Villegas-Fernández, Á.M.; Krajinski, F.; Schlereth, A.; Madrid, E.; Rubiales, D. Characterization of Transcription Factors Following Expression Profiling of Medicago truncatula—Botrytis spp. Interactions. Plant Mol. Biol. Rep. 2014, 32, 1030–1040. [Google Scholar] [CrossRef] [Green Version]
- Birkenbihl, R.P.; Diezel, C.; Somssich, I.E. Arabidopsis WRKY33 Is a Key Transcriptional Regulator of Hormonal and Metabolic Responses toward Botrytis cinerea Infection. Plant Physiol. 2012, 159, 266–285. [Google Scholar] [CrossRef] [Green Version]
- Windram, O.; Madhou, P.; McHattie, S.; Hill, C.; Hickman, R.; Cooke, E.; Jenkins, D.J.; Penfold, C.A.; Baxter, L.; Breeze, E.; et al. Arabidopsis Defense against Botrytis cinerea: Chronology and Regulation Deciphered by High-Resolution Temporal Transcriptomic Analysis. Plant Cell 2012, 24, 3530–3557. [Google Scholar] [CrossRef] [Green Version]
- Marra, R.; Ambrosino, P.; Carbone, V.; Vinale, F.; Woo, S.L.; Ruocco, M.; Ciliento, R.; Lanzuise, S.; Ferraioli, S.; Soriente, I.; et al. Study of the three-way interaction between Trichoderma atroviride, plant and fungal pathogens by using a proteomic approach. Curr. Genet. 2006, 50, 307–321. [Google Scholar] [CrossRef] [PubMed]
- Shah, P.; Powell, A.L.; Orlando, R.; Bergmann, C.; Gutierrez-Sanchez, G. Proteomic Analysis of Ripening Tomato Fruit Infected by Botrytis cinerea. J. Proteome Res. 2012, 11, 2178–2192. [Google Scholar] [CrossRef] [PubMed] [Green Version]
- Mokhtar, M.M.; Hussein, E.H.A.; El-Assal, S.E.-D.S.; Atia, M.A.M. VfODB: A comprehensive database of ESTs, EST-SSRs, mtSSRs, microRNA-target markers and genetic maps in Vicia faba. AoB Plants 2020, 12, plaa064. [Google Scholar] [CrossRef]
- Villegas-Fernández, A.M.; Sillero, J.C.; Rubiales, D. Screening faba bean for chocolate spot resistance: Evaluation methods and effects of age of host tissue and temperature. Eur. J. Plant Pathol. 2011, 132, 443–453. [Google Scholar] [CrossRef]
- Wang, W.; Vignani, R.; Scali, M.; Cresti, M. A universal and rapid protocol for protein extraction from recalcitrant plant tissues for proteomic analysis. Electrophoresis 2006, 27, 2782–2786. [Google Scholar] [CrossRef] [PubMed]
- Castillejo, M.A.; Bani, M.; Rubiales, D. Understanding pea resistance mechanisms in response to Fusarium oxysporum through proteomic analysis. Phytochemistry 2015, 115, 44–58. [Google Scholar] [CrossRef]
- Mathesius, U.; Keijzers, G.; Natera, S.H.A.; Weinman, J.J.; Djordjevic, M.A.; Rolfe, B.G. Establishment of a root proteome reference map for the model legume Medicago truncatula using the expressed sequence tag database for peptide mass fingerprinting. Proteomics 2001, 1, 1424–1440. [Google Scholar] [CrossRef]
- Sharov, A.A.; Dudekula, D.; Ko, M.S.H. A web-based tool for principal component and significance analysis of microarray data. Bioinformatics 2005, 21, 2548–2549. [Google Scholar] [CrossRef]
- Shevchenko, A.; Wilm, M.; Vorm, O.; Mann, M. Mass Spectrometric Sequencing of Proteins from Silver-Stained Polyacrylamide Gels. Anal. Chem. 1996, 68, 850–858. [Google Scholar] [CrossRef]
- Bradford, M.M. A rapid and sensitive method for the quantitation of microgram quantities of protein utilizing the principle of protein-dye binding. Anal. Biochem. 1976, 7, 248–254. [Google Scholar] [CrossRef]
- Heussen, C.; Dowdle, E.B. Electrophoretic analysis of plasminogen activators in polyacrylamide gels containing sodium dodecyl sulfate and copolymerized substrates. Anal. Biochem. 1980, 102, 196–202. [Google Scholar] [CrossRef]
- Neuhoff, V.; Arold, N.; Taube, D.; Ehrhardt, W. Improved staining of proteins in polyacrylamide gels including isoelectric focusing gels with clear background at nanogram sensitivity using Coomassie Brilliant Blue G-250 and R-250. Electrophoresis 1988, 9, 255–262. [Google Scholar] [CrossRef] [PubMed]
- Torres, M.A.; Dangl, J.L. Functions of the respiratory burst oxidase in biotic interactions, abiotic stress and development. Curr. Opin. Plant Biol. 2005, 8, 397–403. [Google Scholar] [CrossRef]
- Karpinski, S.; Reynolds, H.; Karpinska, B.; Wingsle, G.; Creissen, G.; Mullineaux, P. Systemic Signaling and Acclimation in Response to Excess Excitation Energy in Arabidopsis. Science 1999, 284, 654–657. [Google Scholar] [CrossRef]
- Vandenabeele, S.; Vanderauwera, S.; Vuylsteke, M.; Rombauts, S.; Langebartels, C.; Seidlitz, H.K.; Zabeau, M.; Van Montagu, M.; Inzé, D.; Van Breusegem, F. Catalase deficiency drastically affects gene expression induced by high light in Arabidopsis thaliana. Plant J. 2004, 39, 45–58. [Google Scholar] [CrossRef]
- Laloi, C.; Stachowiak, M.; Pers-Kamczyc, E.; Warzych, E.; Murgia, I.; Apel, K. Cross-talk between singlet oxygen- and hydrogen peroxide-dependent signaling of stress responses in Arabidopsis thaliana. Proc. Natl. Acad. Sci. USA 2007, 104, 672–677. [Google Scholar] [CrossRef] [PubMed] [Green Version]
- Joo, J.H.; Wang, S.; Chen, J.G.; Jones, A.M.; Fedoroff, N.V. Different signaling and cell death roles of heterotrimeric G protein alpha and beta subunits in the Arabidopsis oxidative stress response to ozone. Plant Cell 2005, 17, 957–970. [Google Scholar] [CrossRef] [Green Version]
- Belhaj, K.; Lin, B.; Mauch, F. The chloroplast protein RPH1 plays a role in the immune response of Arabidopsis to Phytophthora brassicae. Plant J. 2009, 58, 287–298. [Google Scholar] [CrossRef]
- Kuźniak, E.; Świercz, U.; Chojak-Koźniewska, J.; Sekulska-Nalewajko, J.; Gocławski, J. Automated image analysis for quantification of histochemical detection of reactive oxygen species and necrotic infection symptoms in plant leaves. J. Plant Interact. 2014, 9, 167–174. [Google Scholar] [CrossRef]
- Nishiyama, Y.; Yamamoto, H.; Allakhverdiev, S.; Inaba, M.; Yokota, A.; Murata, N. Oxidative stress inhibits the repair of photodamage to the photosynthetic machinery. EMBO J. 2001, 20, 5587–5594. [Google Scholar] [CrossRef]
- Meng, L.; Höfte, M.; Van Labeke, M.-C. Leaf age and light quality influence the basal resistance against Botrytis cinerea in strawberry leaves. Environ. Exp. Bot. 2019, 157, 35–45. [Google Scholar] [CrossRef]
- Li, Z.; Wakao, S.; Fischer, B.B.; Niyogi, K.K. Sensing and Responding to Excess Light. Annu. Rev. Plant Biol. 2009, 60, 239–260. [Google Scholar] [CrossRef]
- Gawroński, P.; Burdiak, P.; Scharff, L.B.; Mielecki, J.; Górecka, M.; Zaborowska, M.; Leister, D.; Waszczak, C.; Karpiński, S. CIA2 and CIA2-LIKE are required for optimal photosynthesis and stress responses in Arabidopsis thaliana. Plant J. 2021, 105, 619–638. [Google Scholar] [CrossRef]
- Pulido, P.; Llamas, E.; Rodriguez-Concepcion, M. Both Hsp70 chaperone and Clp protease plastidial systems are required for protection against oxidative stress. Plant Signal. Behav. 2017, 12, e1290039. [Google Scholar] [CrossRef] [PubMed] [Green Version]
- Muthusamy, S.K.; Dalal, M.; Chinnusamy, V.; Bansal, K.C. Differential Regulation of Genes Coding for Organelle and Cytosolic ClpATPases under Biotic and Abiotic Stresses in Wheat. Front. Plant Sci. 2016, 7, 929. [Google Scholar] [CrossRef] [Green Version]
- Doyle, S.M.; Wickner, S. Hsp104 and ClpB: Protein disaggregating machines. Trends Biochem. Sci. 2009, 34, 40–48. [Google Scholar] [CrossRef]
- Park, S.; Rodermel, S.R. Mutations in ClpC2/Hsp100 suppress the requirement for FtsH in thylakoid membrane biogenesis. Proc. Natl. Acad. Sci. USA 2004, 101, 12765–12770. [Google Scholar] [CrossRef] [PubMed] [Green Version]
- Sjögren, L.L.; MacDonald, T.M.; Sutinen, S.; Clarke, A.K. Inactivation of the clpC1 Gene Encoding a Chloroplast Hsp100 Molecular Chaperone Causes Growth Retardation, Leaf Chlorosis, Lower Photosynthetic Activity, and a Specific Reduction in Photosystem Content. Plant Physiol. 2004, 136, 4114–4126. [Google Scholar] [CrossRef] [PubMed] [Green Version]
- Adam, Z.; Rudella, A.; van Wijk, K.J. Recent advances in the study of Clp, FtsH and other proteases located in chloroplasts. Curr. Opin. Plant Biol. 2006, 9, 234–240. [Google Scholar] [CrossRef] [PubMed]
- Wu, H.; Ji, Y.; Du, J.; Kong, D.; Liang, H.; Ling, H.-Q. ClpC1, an ATP-dependent Clp protease in plastids, is involved in iron homeostasis in Arabidopsis leaves. Ann. Bot. 2010, 105, 823–833. [Google Scholar] [CrossRef] [PubMed] [Green Version]
- Moghaddam, M.R.B.; Van Den Ende, W. Sugars and plant innate immunity. J. Exp. Bot. 2012, 63, 3989–3998. [Google Scholar] [CrossRef] [Green Version]
- Courbier, S.; Grevink, S.; Sluijs, E.; Bonhomme, P.; Kajala, K.; Van Wees, S.C.M.; Pierik, R. Far-red light promotes Botrytis cinerea disease development in tomato leaves via jasmonate-dependent modulation of soluble sugars. Plant Cell Environ. 2020, 43, 2769–2781. [Google Scholar] [CrossRef]
- Moustaka, J.; Moustakas, M. Photoprotective mechanism of the non-target organism Arabidopsis thaliana to paraquat exposure. Pestic. Biochem. Physiol. 2014, 111, 1–6. [Google Scholar] [CrossRef] [PubMed]
- Moustaka, J.; Tanou, G.; Adamakis, I.-D.; Eleftheriou, E.P.; Moustakas, M. Leaf Age-Dependent Photoprotective and Antioxidative Response Mechanisms to Paraquat-Induced Oxidative Stress in Arabidopsis thaliana. Int. J. Mol. Sci. 2015, 16, 13989–14006. [Google Scholar] [CrossRef] [PubMed] [Green Version]
- Ruban, A.V. Nonphotochemical Chlorophyll Fluorescence Quenching: Mechanism and Effectiveness in Protecting Plants from Photodamage. Plant Physiol. 2016, 170, 1903–1916. [Google Scholar] [CrossRef] [PubMed] [Green Version]
- Agathokleous, E.; Kitao, M.; Harayama, H. On the Nonmonotonic, Hormetic Photoprotective Response of Plants to Stress. Dose-Response 2019, 17, 1559325819838420. [Google Scholar] [CrossRef] [Green Version]
- Sperdouli, I.; Moustakas, M. A better energy allocation of absorbed light in photosystem II and less photooxidative damage contribute to acclimation of Arabidopsis thaliana young leaves to water deficit. J. Plant Physiol. 2014, 171, 587–593. [Google Scholar] [CrossRef]
- Kato, Y.; Sakamoto, W. FtsH Protease in the Thylakoid Membrane: Physiological Functions and the Regulation of Protease Activity. Front. Plant Sci. 2018, 9, 855. [Google Scholar] [CrossRef] [Green Version]
- Mulo, P.; Sirpiö, S.; Suorsa, M.; Aro, E.-M. Auxiliary proteins involved in the assembly and sustenance of photosystem II. Photosynth. Res. 2008, 98, 489–501. [Google Scholar] [CrossRef]
- Seo, S.; Okamoto, M.; Iwai, T.; Iwano, M.; Fukui, K.; Isogai, A.; Nakajima, N.; Ohashi, Y. Reduced Levels of Chloroplast FtsH Protein in Tobacco Mosaic Virus–Infected Tobacco Leaves Accelerate the Hypersensitive Reaction. Plant Cell 2000, 12, 917–932. [Google Scholar]
- Kangasjärvi, S.; Neukermans, J.; Li, S.; Aro, E.-M.; Noctor, G. Photosynthesis, photorespiration, and light signalling in defence responses. J. Exp. Bot. 2012, 63, 1619–1636. [Google Scholar] [CrossRef] [PubMed] [Green Version]
- Kiba, A.; Nishihara, M.; Tsukatani, N.; Nakatsuka, T.; Kato, Y.; Yamamura, S. A Peroxiredoxin Q Homolog from Gentians is Involved in Both Resistance against Fungal Disease and Oxidative Stress. Plant Cell Physiol. 2005, 46, 1007–1015. [Google Scholar] [CrossRef] [PubMed] [Green Version]


| SSP a | Protein Name (% Identity to V. faba Transcriptome Entry) b | NCBI Accession | Score c | Species | PM c/ Coverage % | Mr/pI Experimental (Theoretical) d | Functional Category | More/Less Abundance Change Ratio (FDR) e | |||||
|---|---|---|---|---|---|---|---|---|---|---|---|---|---|
| S1 | S2 | R1 | R2 | ||||||||||
| 3504 | Enolase (93.3% Vf_0033189) | gi|42521309 | 261 | Glycine max | 10/28 | 57.2/5.7 (48.0/5.3) | Carbohydrate met. | 3.0 | 6.3 | 1.0 | 1.0 | 0.0 | 0.0 |
| 6302 | Isocitrate dehydrogenase [NADP], chloroplastic (88.1% Vf_0028303) | gi|2497259 | 153 | Medicago sativa | 17/40 | 44.9/6.2 (48.7/6.2) | Carbohydrate met. | 0.4 | 9.0 | 0.8 | 0.6 | 1.2 | 0.6 |
| 2204 | Fructose-1,6-bisphosphatase (93.2% Vf_0032848) | gi|5305145 | 109 | Pisum sativum | 4/14 | 40.0/5.5 (36.3/6.3) | Carbohydrate met. | 16.4 | 6.7 | 1.7 | 0.2 | 0.4 | 0.9 |
| 6203 | Fructose-bisphosphate aldolase, cytoplasmic isozyme 1 (77.9% Vf_0020212) | gi|1168408 | 352 | Pisum sativum | 15/54 | 39.4/6.5 (38.7/6.4) | Carbohydrate met. | 1.1 | 3.8 | 1.5 | 1.5 | 0.3 | 0.1 |
| 4104 | Fructose-bisphosphate aldolase 2, chloroplastic (80.6% Vf_0020212) | gi|461501 | 183 | Pisum sativum | 10/37 | 38.4/5.8 (38.0/5.5) | Carbohydrate met. | 0.6 | 1.2 | 27.6 | 0.2 | 0.5 | 1.6 |
| 5103 | Fructose-bisphosphate aldolase 2, chloroplastic (80.6% Vf_0020212) | gi|461501 | 474 | Pisum sativum | 17/51 | 36.8/6.3 (38.0/5.5) | Carbohydrate met. | 3.8 | 1.9 | 27.7 | 0.0 | 0.3 | 1.5 |
| 105 | N-glyceraldehyde-2-phosphotransferase-like (84.2% Vf_0017868) | gi|8885622 | 133 | Arabidopsis thaliana | 7/22 | 33.4/5.2 (32.0/5.1) | Carbohydrate met. | 6.4 | 0.8 | 0.5 | 1.0 | 0.2 | 0.0 |
| 1007 | Triose-phosphate isomerase (75.1% Vf_0012679) | gi|15226479 | 205 | Arabidopsis thaliana | 9/25 | 29.5/5.6 (33.6/7.7) | Carbohydrate met. | 3.6 | 2.3 | 1.1 | 1.2 | 0.5 | 0.2 |
| 2002 | Triose-phosphate isomerase (75.1% Vf_0012679) | gi|15226479 | 292 | Arabidopsis thaliana | 11/29 | 29.1/5.8 (33.6/7.7) | Carbohydrate met. | 10.4 | 5.1 | 1.9 | 1.1 | 0.5 | 0.2 |
| 3004 | Triose-phosphate isomerase (89.1% Vf_0024793) | gi|57283985 | 165 | Phaseolus vulgaris | 7/31 | 21.9/5.6 (27.4/5.9) | Carbohydrate met. | 2.2 | 4.7 | 1.0 | 0.4 | 0.0 | 1.6 |
| 2705 | Phosphoglucomutase, cytoplasmic (97.9% Vf_0002214) | gi|12585296 | 109 | Pisum sativum | 10/8 | 74.3/5.6 (63.5/5.5) | Carbohydrate met. | 9.5 | 0.0 | 1.0 | 1.0 | 0.0 | 0.0 |
| 3702 | Phosphoglucomutase, cytoplasmic (97.9% Vf_0002214) | gi|12585296 | 222 | Pisum sativum | 10/23 | 70.8/5.7 (63.5/5.5) | Carbohydrate met. | 6.3 | 19.0 | 0.4 | 0.9 | 2.3 | 8.8 |
| 603 | Beta-amylase (88.5% Vf_0019893) | gi|3913031 | 149 | Medicago sativa | 7/17 | 61.3/5.0 (56.5/5.3) | Major CHO met. | 3.1 | 8.2 | 1.0 | 0.5 | 1.0 | 1.6 |
| 4808 | Methionine synthase/Cobalamin- independent synthase family protein (94.5% Vf_0005324) | gi|219522337 | 104 | Cicer arietinum | 12/19 | 92.8/5.9 (84.6/6.0) | Amino acid met. | 6.9 | 190.5 | 1.5 | 0.7 | 3.4 | 20.1 |
| 5805 | Methionine synthase/Cobalamin- independent synthase family protein (94.5% Vf_0005324) | gi|219522337 | 312 | Cicer arietinum | 15/26 | 93.2/6.0 (84.6/6.0) | Amino acid met. | 20.8 | 50.3 | 0.5 | 0.7 | 5.2 | 4.0 |
| 5808 | Methionine synthase/Cobalamin- independent synthase family protein (94.5% Vf_0005324) | gi|219522337 | 344 | Cicer arietinum | 20/31 | 92.2/6.1 (84.6/6.0) | Amino acid met. | 3.2 | 25.4 | 0.3 | 2.3 | 3.9 | 1.0 |
| 2402 | Alanine aminotransferase (82.2% Vf_0008300) | gi|29569153 | 140 | Oryza sativa | 8/17 | 54.1/5.6 (54.0/8.0) | Amino acid met. | 8.1 | 17.6 | 0.7 | 2.9 | 2.4 | 0.8 |
| 3402 | Alanine aminotransferase 2 (82.2% Vf_0008300) | gi|29569153 | 104 | Oryza sativa | 4/9 | 54.1/5.7 (54.0/8.0) | Amino acid met. | 63.4 | 0.0 | 1.3 | 1.4 | 51.7 | 11.9 |
| 1402 | 5-enolpyruvylshikimate 3-phosphate synthase (79.5% Vf_0032499) | gi|55740769 | 73 | Camptotheca acuminate | 8/14 | 52.1/5.2 (56.1/8.2) | Amino acid met. | 0.0 | 1.0 | 1.0 | 1.0 | 0.0 | 1.0 |
| 3613 | Ketol-acid reductoisomerase chloroplastic (97.3% Vf_0004275) | gi|6225542 | 560 | Pisum sativum | 23/43 | 61.5/5.7 (63.2/6.6) | Amino acid met. | 12.0 | 0.5 | 0.7 | 0.4 | 2.2 | 0.4 |
| 7501 | Serine hydroxymethyltransferase 2 (91.7% Vf_0037308) | gi|222142531 | 203 | Glycine max | 13/29 | 57.1/6.9 (55.0/8.2) | Amino acid met. | 2.1 | 1.7 | 1.6 | 1.0 | 0.3 | 0.0 |
| 1104 | Putative lactoylglutathione lyase (78.0% Vf_0028431) | gi|15810219 | 183 | Arabidopsis thaliana | 8/26 | 33.4/5.3 (32.0/5.1) | Amino acid met. | 3.7 | 1.2 | 0.6 | 0.4 | 0.5 | 0.4 |
| 7602 | Chain A, Dihydrolipoamide Dehydrogenase (99.6% Vf_0005095) | gi|9955321 | 337 | Pisum sativum | 22/62 | 57.4/6.4 (50.0/6.1) | Lipid metabolism | 51.2 | 25.1 | 0.9 | 0.8 | 7.7 | 1.9 |
| 2102 | Pyruvate dehydrogenase E1 component subunit beta, mitochondrial (96.1% Vf_0005095) | gi|1709454 | 171 | Pisum sativum | 6/18 | 39.3/5.5 (39.0/5.9) | Lipid metabolism | 0.7 | 6.7 | 1.0 | 1.0 | 0.0 | 0.0 |
| 3705 | Zeaxanthin epoxidase, chloroplastic (72.1% Vf_0030326) | gi|5902706 | 92 | Solanum lycopersicum | 5/9 | 74.3/5.8 (73.6/6.2) | Hormone met. | 1.0 | 1.0 | 0.6 | 1.1 | ∞ | ∞ |
| 5601 | Polyphenol oxidase A1, chloroplastic (98.5% Vf_0006701) | gi|1172586 | 254 | Vicia faba | 8/8 | 64.9/6.0 (68.9/7.0) | Pigment biosynt. | 0.0 | 1.0 | 1.0 | 1.0 | 0.0 | 1.0 |
| 5603 | Polyphenol oxidase A1, chloroplastic (98.5% Vf_0006701) | gi|1172586 | 253 | Vicia faba | 9/13 | 64.7/6.0 (68.9/7.0) | Pigment biosynt. | 9.5 | 0.0 | 1.0 | 1.0 | 0.0 | 0.0 |
| 4607 | Polyphenol oxidase A1, chloroplastic (98.5% Vf_0006701) | gi|1172586 | 274 | Vicia faba | 9/12 | 64.4/5.9 (68.9/7.0) | Pigment biosynt. | 1.0 | 1.0 | 0.0 | 1.0 | ∞ | 1.0 |
| 4605 | Polyphenol oxidase A1, chloroplastic (98.5% Vf_0006701) | gi|1172586 | 151 | Vicia faba | 11/13 | 61.8/5.8 (68.9/7.0) | Pigment biosynt. | 8.7 | 0.6 | 1.0 | 1.0 | 0.0 | 0.0 |
| 2103 | Coproporphyrinogen-III oxidase, chloroplastic (70.9% Vf_0022525) | gi|2493810 | 148 | Nicotiana tabacum | 4/11 | 38.6/5.6 (45.3/7.6) | Co-factor and vitamine met. | 7.7 | 1.2 | 1.0 | 1.0 | 0.0 | 0.0 |
| 2601 | ATP synthase CF1 alpha subunit (96.7% Vf_0021629) | gi|219673973 | 546 | Trifolium subterraneum | 19/36 | 59.9/5.4 (55.7/5.1) | Energy metabolism | 2.1 | 2.7 | 28.2 | 0.0 | 1.5 | 4.6 |
| 1601 | ATP synthase CF1 alpha subunit (95.3% Vf_0021629) | gi|139387459 | 126 | Phaseolus vulgaris | 9/20 | 57.0/5.3 (55.7/5.2) | Energy metabolism | 0.6 | 1.2 | 1.5 | 1.3 | 22.4 | 2.3 |
| 604 | ATP synthase CF1 beta subunit ATP synthase alpha/beta family protein (97.6% Vf_0007913) | gi|295136979 | 572 | Pisum sativum | 18/48 | 58.9/5.2 (53.2/5.1) | Energy metabolism | 0.7 | 2.7 | 1.0 | 1.6 | 9.0 | 2.3 |
| 505 | ATP synthase CF1 beta subunit ATP synthase alpha/beta family protein (97.6% Vf_0007913) | gi|295136979 | 882 | Pisum sativum | 26/65 | 57.9/5.2 (53.2/5.1) | Energy metabolism | 2.0 | 17.9 | 1.2 | 1.9 | 5.8 | 9.5 |
| 1503 | ATP synthase CF1 alpha subunit (95.4% Vf_0021629) | gi|295137014 | 573 | Pisum sativum | 21/38 | 56.5/5.3 (54.7/5.7) | Energy metabolism | 4.5 | 3.2 | 1.2 | 0.9 | 3.9 | 2.7 |
| 1501 | ATP synthase CF1 beta subunit ATP synthase alpha/beta family protein (97.6% Vf_0007913) | gi|295136979 | 755 | Pisum sativum | 21/51 | 56.2/5.2 (53.2/5.1) | Energy metabolism | 2.4 | 1.5 | 1.3 | 1.2 | 1.5 | 1.2 |
| 9701 | Sulfite reductase (96.4% Vf_0029426) | gi|119225844 | 129 | Pisum sativum | 17/25 | 75.6/8.8 (77.3/9.1) | S metabolism | ∞ | 1.0 | 1.0 | 1.0 | 1.0 | 1.0 |
| 3704 | Transketolase (95.5% Vf_0028016) | gi|4586600 | 214 | Cicer arietinum | 3/30 | 82.8/5.8 (17.1/5.8) | Photosynthesis | 11.3 | 7.0 | 1.2 | 1.0 | 35.9 | 3.2 |
| 3706 | Transketolase (95.5% Vf_0028016) | gi|4586600 | 91 | Cicer arietinum | 4/44 | 82.7/5.8 (17.1/5.8) | Photosynthesis | 4.0 | 4.0 | 1.0 | 0.5 | 18.0 | 2.8 |
| 4704 | Transketolase (95.5% Vf_0028016) | gi|4586600 | 86 | Cicer arietinum | 4/44 | 82.5/5.9 (17.1/5.8) | Photosynthesis | 3.8 | 17.1 | 0.6 | 0.7 | 6.4 | 1.7 |
| 4702 | Transketolase (95.5% Vf_0028016) | gi|4586600 | 189 | Cicer arietinum | 5/48 | 81.6/5.8 (17.1/5.8) | Photosynthesis | 3.8 | 3.1 | 1.0 | 1.1 | 8.1 | 1.5 |
| 1604 | RuBisCO large subunit-binding protein subunit beta chloroplastic/chaperonin subunit beta (96.3% Vf_0035079) | gi|2506277 | 423 | Pisum sativum | 16/39 | 67.8/5.5 (63.3/5.8) | Photosynthesis | 19.1 | 30.5 | 0.9 | 0.4 | 11.5 | 9.4 |
| 2602 | RuBisCO large subunit-binding protein subunit beta chloroplastic/chaperonin subunit beta (96.3% Vf_0035079) | gi|2506277 | 72 | Pisum sativum | 11/27 | 66.8/5.6 (63.3/5.8) | Photosynthesis | 1.8 | 2.4 | 2.2 | 0.5 | 1.9 | 1.5 |
| 1606 | RuBisCO large subunit-binding protein subunit beta chloroplastic/chaperonin subunit beta (96.3% Vf_0035079) | gi|2506277 | 257 | Pisum sativum | 10/26 | 65.7/5.5 (63.3/5.8) | Photosynthesis | 0.9 | 3.7 | 1.5 | 0.5 | 5.9 | 4.1 |
| 601 | RuBisCO large subunit-binding protein subunit alpha chloroplastic /chaperonin-60alpha (98.4% Vf_0031659) | gi|1710807 | 480 | Pisum sativum | 19/36 | 65.8/5.0 (62.0/5.2) | Photosynthesis | 2.4 | 5.2 | 0.7 | 0.2 | 1.0 | 3.3 |
| 4501 | Ribulose-1,5-bisphosphate carboxylase/oxygenase large subunit (95.9% Vf_0007913) | gi|825737 | 556 | Carya illinoinensis | 20/40 | 57.1/5.8 (51.6/6.1) | Photosynthesis | 26.5 | 7.5 | 0.5 | 37.7 | 4.3 | 2.8 |
| 4505 | Ribulose-1,5-bisphosphate carboxylase/oxygenase large subunit (96.5% Vf_0007913) | gi|33113311 | 584 | Carya ovate | 23/42 | 55.8/5.9 (51.4/6.1) | Photosynthesis | 5.1 | 1.7 | 6.2 | 1.4 | 41.3 | 3.3 |
| 4406 | Ribulose-1,5-bisphosphate carboxylase/oxygenase large subunit (95.6% Vf_0007913) | gi|21634071 | 485 | Cressa depressa | 23/44 | 55.5/5.8 (50.6/6.7) | Photosynthesis | 3.3 | 4.3 | 0.1 | 17.6 | 38.4 | 17.3 |
| 5507 | Ribulose-1,5-bisphosphate carboxylase/oxygenase large subunit (96.4% Vf_0007913) | gi|225544093 | 709 | Caragana camilli-schneideri | 25/45 | 54.4/6.0 (52.8/6.3) | Photosynthesis | 1.9 | 1.4 | 0.8 | 2.4 | 41.8 | 2.0 |
| 5408 | Ribulose-1,5-bisphosphate carboxylase/ oxygenase (95.7% Vf_0007913) | gi|74179244 | 619 | Aristolochia arborea | 23/44 | 52.5/6.1 (52.0/6.1) | Photosynthesis | 14.6 | 1.3 | 0.9 | 0.7 | 21.7 | 7.2 |
| 5407 | Ribulose-1,5-bisphosphate carboxylase/ oxygenase large subunit (95.3% Vf_0007913) | gi|62861204 | 759 | Paracroton zeylanicus | 25/50 | 50.8/6.2 (52.0/6.0) | Photosynthesis | 14.1 | 0.9 | 0.6 | 0.9 | 11.2 | 3.7 |
| 2304 | Phosphoglycerate kinase chloroplastic (86.1% Vf_0006851) | gi|129915 | 192 | Triticum aestivum | 9/19 | 49.6/5.6 (50.0/6.6) | Photosynthesis | 96.2 | 2.6 | 1.0 | 1.0 | 0.0 | 0.0 |
| 2301 | Phosphoglycerate kinase chloroplastic (86.1% Vf_0006851) | gi|129915 | 254 | Triticum aestivum | 7/16 | 46.1/5.6 (50.0/6.6) | Photosynthesis | 12.8 | 3.9 | 6.9 | 0.8 | 6.3 | 4.6 |
| 2303 | Phosphoglycerate kinase chloroplastic (85.6% Vf_0006851) | gi|2499497 | 571 | Nicotiana tabacum | 15/33 | 44.5/5.6 (50.3/8.5) | Photosynthesis | 3.2 | 3.7 | 2.5 | 1.5 | 3.7 | 1.7 |
| 7503 | Ribulose-1,5-bisphosphate carboxylase/ oxygenase large (95.9% Vf_0007913) | gi|825737 | 372 | Carya illinoinensis | 21/42 | 56.2/6.7 (51.6/6.1) | Photosynthesis | 3.5 | 6.8 | 0.9 | 1.8 | 98.3 | 3.2 |
| 6418 | Ribulose-1,5-bisphosphate carboxylase/ oxygenase (95.7% Vf_0007913) | gi|74179244 | 589 | Aristolochia arborea | 24/42 | 53.7/6.3 (52.0/6.1) | Photosynthesis | 15.2 | 1.7 | 0.8 | 1.4 | 1.3 | 2.5 |
| 8308 | Geranylgeranyl hydrogenase (91.3% Vf_0032793) | gi|19749359 | 267 | Glycine max | 18/38 | 48.6/8.7 (51.7/9.1) | Photosynthesis | 1.7 | 5.0 | 0.9 | 0.4 | 2.1 | 5.9 |
| 203 | Sedoheptulose-1,7-bisphosphatase (81.8% Vf_0007079) | gi|229597543 | 230 | Cucumis sativus | 9/21 | 42.8/5.2 (42.5/5.9) | Photosynthesis | 2.4 | 3.2 | 1.0 | 0.7 | 1.6 | 1.4 |
| 3202 | Sedoheptulose-1,7-bisphosphatase (81.8% Vf_0007079) | gi|229597543 | 215 | Cucumis sativus | 12/34 | 42.6/5.6 (42.5/5.9) | Photosynthesis | 5.5 | 11.2 | 1.5 | 3.3 | 1.7 | 1.5 |
| 1204 | Phosphoribulokinase (99.1% Vf_0003052) | gi|1885326 | 350 | Pisum sativum | 14/46 | 41.4/5.4 (39.2/5.4) | Photosynthesis | 2.4 | 2.5 | 4.8 | 0.9 | 2.3 | 2.7 |
| 2202 | Phosphoribulokinase (99.1% _0003052) | gi|1885326 | 160 | Pisum sativum | 7/27 | 41.1/5.5 (39.2/5.4) | Photosynthesis | 1.2 | 1.5 | 1.2 | 0.8 | 3.4 | 2.0 |
| 1201 | Photosystem II stability/assembly factor HCF136, chloroplast precursor (78.8% Vf_0033934) | gi|255559812 | 237 | Ricinus communis | 8/20 | 41.1/5.3 (43.4/7.1) | Photosynthesis | 1.3 | 2.2 | 1.8 | 2.0 | 0.5 | 0.3 |
| 3107 | Aldolase (80.8% Vf_0017749) | gi|169039 | 137 | Pisum sativum | 9/27 | 38.5/5.6 (38.0/5.5) | Photosynthesis | 2.3 | 1.6 | 5.3 | 1.2 | 0.3 | 1.7 |
| 3105 | Aldolase (80.8% Vf_0017749) | gi|169039 | 88 | Pisum sativum | 8/29 | 38.0/5.6 (38.0/5.5) | Photosynthesis | 0.0 | 0.1 | ∞ | 0.8 | 0.0 | 0.1 |
| 1001 | Chloroplast chlorophyll a/b binding protein (99.2% Vf_0037012) | gi|157786302 | 265 | Pisum sativum | 10/34 | 30.3/5.2 (28.4/5.5) | Photosynthesis | 0.9 | 0.8 | 6.8 | 0.9 | 0.3 | 1.4 |
| 4306 | Transaminase mtnE, putative (80.9% Vf_0021772) | gi|255562088 | 159 | Ricinus communis | 5/11 | 46.2/5.9 (50.9/6.9) | Photosynthesis | 1.2 | 4.4 | 1.0 | 1.0 | 0.0 | 0.0 |
| 401 | Chloroplast ribulose-1,5-bisphosphate carboxylase activase (81.0% Vf_0005564) | gi|115392208 | 122 | Triticum aestivum | 6/21 | 51.7/5.1 (40.3/6.5) | Photosynthesis | 0.9 | 0.0 | 1.0 | 1.0 | 0.0 | 0.0 |
| 1502 | UDP-glucose pyrophosphorylase (89.7% Vf_0034269) | gi|12585472 | 271 | Astragalus penduliflorus | 12/29 | 54.1/5.3 (51.6/5.9) | Protein synthesis | 1.1 | 2.3 | 1.0 | 1.0 | 0.0 | 0.0 |
| 2801 | ClpC protease (92.1% Vf_0007069) | gi|4105131 | 70 | Spinacia oleracea | 12/16 | 96.6/5.6 (99.6/8.8) | Protein degrad. | 6.7 | 8.8 | 0.5 | 0.4 | 8.9 | 2.7 |
| 2804 | ClpC protease (98.5% Vf_0007069) | gi|461753 | 145 | Pisum sativum | 19/26 | 96.1/5.6 (102.8/6.6) | Protein degrad. | 5.3 | 1.6 | 0.3 | 1.4 | 20.0 | 1.2 |
| 1802 | ATP-dependent Clp protease (98.5% Vf_0007069) | gi|461753 | 383 | Pisum sativum | 26/33 | 95.3/5.3 (102.8/6.6) | Protein degrad. | 2.3 | 6.4 | 1.5 | 1.2 | 1.1 | 1.7 |
| 2703 | Cell division protease ftsH homolog, chloroplastic (91.1% Vf_0034616) | gi|17865463 | 262 | Medicago sativa | 16/30 | 75.4/5.6 (75.8/5.6) | Protein degrad. | 5.9 | 7.0 | 1.1 | 1.6 | 0.9 | 0.2 |
| 2707 | Cell division protease ftsH homolog chloroplastic (91.1% Vf_0034616) | gi|17865463 | 140 | Medicago sativa | 10/19 | 74.8/5.7 (75.8/5.6) | Protein degrad. | 14.1 | 60.9 | 0.6 | 0.8 | 4.0 | 3.5 |
| 2706 | Cell division protease ftsH homolog, chloroplastic (91.1% Vf_0034616) | gi|17865463 | 315 | Medicago sativa | 21/38 | 70.9/5.7 (75.8/5.6) | Protein degrad. | 2.9 | 6.0 | 0.6 | 1.2 | 2.7 | 0.9 |
| 1702 | Putative zinc dependent protease/FTSH protease 8 (87.0% Vf_0002195) | gi|84468324 | 206 | Trifolium pretense | 11/22 | 74.5/5.3 (75.4/5.5) | Protein degrad. | ∞ | 8.0 | 0.7 | 1.6 | ∞ | 1.2 |
| 2101 | Serine-type endopeptidase (96.5% Vf_0035526) | gi|270342123 | 70 | Phaseolus vulgaris | 5/15 | 39.5/5.4 (45.2/7.7) | Protein degrad. | ∞ | 1.0 | 1.0 | 1.0 | 1.0 | 1.0 |
| 2802 | Ubiquitin-specific-processing protease 8 (62.7% Vf_0023012) | gi|257050978 | 61 | Arabidopsis thaliana | 13/27 | 99.1/5.2 (90.7/5.5) | Protein degrad. | 1.0 | 10.4 | 1.0 | 1.0 | 1.0 | 0.0 |
| 3803 | ATP-dependent Clp protease/CLPC homologue 1 (98.5% Vf_0007069) | gi|461753 | 308 | Pisum sativum | 19/26 | 83.8/5.7 (102.8/6.6) | Protein degrad. | 7.3 | 13.4 | 1.7 | 1.6 | 8.2 | 3.0 |
| 702 | Chaperone DnaK (stromal 70 kDa heat shock-related protein, chloroplastic) (93.7% Vf_0024557) | gi|92870233 | 955 | Medicago truncatula | 27/38 | 81.5/5.0 (75.8/5.2) | Stress response | 3.5 | 4.5 | 1.6 | 0.6 | 4.2 | 3.0 |
| 1701 | Heat shock protein 70 (92.1% Vf_0006213) | gi|56554972 | 562 | Medicago sativa | 23/40 | 81.8/5.3 (71.4/5.1) | Stress response | 3.6 | 4.5 | 2.1 | 0.8 | 1.7 | 5.3 |
| 2701 | Heat shock 70 kDa protein mitochondrial (93.1% Vf_0016658) | gi|585272 | 216 | Pisum sativum | 14/26 | 76.2/5.6 (72.4/5.8) | Stress response | 13.1 | 11.1 | 1.0 | 1.0 | 0.0 | 0.0 |
| 4302 | Monodehydroascorbate reductase I (92.0% Vf_0006284) | gi|51860738 | 167 | Pisum sativum | 10/24 | 47.9/5.8 (47.4/5.8) | Stress response | 3.7 | 2.2 | 6.4 | 1.0 | 1.4 | 0.3 |
| 3001 | L-ascorbate peroxidase, cytosolic (60.9% Vf_0035596) | gi|1351963 | 171 | Pisum sativum | 8/34 | 31.0/6.1 (27.2/5.5) | Stress response | 1.9 | 0.5 | 1.1 | 0.6 | 0.5 | 2.1 |
| 3103 | CDSP32 protein (Chloroplast Drought-induced Stress Protein of 32 kDa) (69.4% Vf_0033087) | gi|2582822 | 133 | Solanum tuberosum | 4/14 | 33.8/6.0 (33.8/8.1) | Stress response | 0.9 | 0.8 | 0.3 | 0.2 | 0.4 | 0.7 |
| 1206 | NADPH-dependent alkenal/one oxidoreductase, chloroplastic (85.3% Vf_0022282) | XP_003532009.1 | 190 | Glycine max | 6/28 | 40.6/5.4 (31.2/9.2) | Redox | 1.0 | 1.0 | 1.0 | ∞ | 1.0 | 1.0 |
| 11 | Thioredoxin peroxidase (80.1% Vf_0034677) | gi|21912927 | 108 | Nicotiana tabacum | 3/16 | 21.6/5.2 (30.1/8.2) | Redox | 2.4 | 0.3 | 16.3 | 0.6 | 0.0 | 0.7 |
| 5305 | GDP-D-Mannose 3′,5′-Epimerase (90.2% Vf_0021019) | gi|15241945 | 108 | Arabidopsis thaliana | 8/26 | 49.6/6.0 (43.1/5.8) | Cell wall | 8.0 | 19.0 | 1.0 | 1.0 | 0.0 | 0.0 |
| 502 | Hydroxyproline-rich glycoprotein family protein | gi|18411523 | 147 | Arabidopsis thaliana | 9/13 | 60.7/4.8 (49.4/5.2) | Cell wall | 3.8 | 2.0 | 0.8 | 0.7 | 0.8 | 0.6 |
| 4404 | Gdp-Mannose-3′, 5′-Epimerase (89.9% Vf_0021019) | gi|83754656 | 112 | Arabidopsis thaliana | 9/22 | 50.6/5.9 (43.2/5.8) | Cell wall | 0.5 | 3.7 | 1.0 | 1.0 | 0.0 | 0.0 |
| 101 | PAP fibrillin (84.1% Vf_0025094) | gi|87240799 | 268 | Medicago truncatula | 8/18 | 34.4/4.9 (34.1/4.9) | Cell organization | 1.4 | 1.7 | 1.8 | 0.5 | 0.2 | 1.5 |
| 1308 | Actin (99.7% Vf_0005527) | gi|34541966 | 560 | Trifolium pretense | 16/51 | 47.9/5.5 (41.9/5.3) | Cell organization | 0.7 | 12.9 | 0.4 | 7.7 | 3.1 | 0.5 |
| 1404 | Actin (99.1% Vf_0028038) | gi|1498334 | 113 | Glycine max | 8/39 | 49.3/5.3 (37.3/5.5) | Cell organization | 2.6 | 11.5 | 1.0 | 1.0 | 0.0 | 0.0 |
| 1304 | Actin (99.7% Vf_0005527) | gi|34541966 | 431 | Trifolium pretense | 16/53 | 49.0/5.3 (41.9/5.3) | Cell organization | 0.8 | 8.7 | 1.0 | 1.8 | 0.5 | 0.6 |
| 3205 | Actin (94.3% Vf_0008358) | gi|1498384 | 172 | Zea mays | 5/19 | 39.7/5.6 (37.3/5.5) | Cell organization | 0.0 | 6.4 | 1.0 | 1.0 | 0.0 | 0.0 |
| 3302 | Elongation factor Tu (97.5% Vf_0005994) | gi|6015084 | 284 | Pisum sativum | 17/35 | 48.1/5.6 (53.1/6.6) | Transcription/ Translation | ∞ | 2.8 | 2.5 | 1.2 | ∞ | 0.8 |
| 3309 | Elongation factor Tu (97.5% Vf_0005994) | gi|6015084 | 480 | Pisum sativum | 22/43 | 47.9/5.7 (53.1/6.6) | Transcription/ Translation | 0.3 | 13.0 | 11.7 | 2.2 | 1.7 | 1.4 |
| 3307 | Elongation factor Tu (97.5% Vf_0005994) | gi|6015084 | 584 | Pisum sativum | 22/46 | 47.7/5.7 (53.1/6.6) | Transcription/ Translation | 7.6 | 7.5 | 1.0 | 0.9 | 11.6 | 8.2 |
| 9401 | Elongation factor 1 alpha (96.9% Vf_0022300) | gi|61741088 | 201 | Actinidia deliciosa | 16/37 | 54.0/9.0 (49.6/9.2) | Transcription/ Translation | 4.4 | 4.8 | 1.3 | 2.4 | 7.0 | 4.9 |
| 3603 | Tic62 protein (89.8% Vf_0007594) | gi|21616072 | 99 | Pisum sativum | 7/24 | 61.8/5.7 (57.1/8.8) | Signaling | 1.0 | 0.0 | 1.0 | 1.0 | 1.0 | 0.0 |
| 1708 | V-type proton ATPase catalytic subunit A (95.9% Vf_0002956) | gi|12585490 | 146 | Citrus unshiu | 17/42 | 74.4/5.5 (68.9/5.3) | Transport | 8.9 | 54.4 | 0.7 | 1.2 | 3.8 | 5.3 |
| 5002 | Carbonate dehydratase (64.2% Vf_0022150) | gi|47606728 | 105 | Flaveria bidentis | 3/17 | 30.3/6.2 (35.9/5.8) | Miscellaneous | 1.3 | 5.8 | 1.3 | 0.6 | 0.5 | 3.1 |
| 6003 | Carbonic anhydrase (85.8% Vf_0022150) | gi|270342124 | 153 | Phaseolus vulgaris | 7/34 | 29.0/6.5 (35.9/8.1) | Miscellaneous | 0.9 | 0.5 | 3.3 | ∞ | 0.2 | 0.0 |
Publisher’s Note: MDPI stays neutral with regard to jurisdictional claims in published maps and institutional affiliations. |
© 2021 by the authors. Licensee MDPI, Basel, Switzerland. This article is an open access article distributed under the terms and conditions of the Creative Commons Attribution (CC BY) license (https://creativecommons.org/licenses/by/4.0/).
Share and Cite
Castillejo, M.Á.; Villegas-Fernández, Á.M.; Hernández-Lao, T.; Rubiales, D. Photosystem II Repair Cycle in Faba Bean May Play a Role in Its Resistance to Botrytis fabae Infection. Agronomy 2021, 11, 2247. https://doi.org/10.3390/agronomy11112247
Castillejo MÁ, Villegas-Fernández ÁM, Hernández-Lao T, Rubiales D. Photosystem II Repair Cycle in Faba Bean May Play a Role in Its Resistance to Botrytis fabae Infection. Agronomy. 2021; 11(11):2247. https://doi.org/10.3390/agronomy11112247
Chicago/Turabian StyleCastillejo, María Ángeles, Ángel M. Villegas-Fernández, Tamara Hernández-Lao, and Diego Rubiales. 2021. "Photosystem II Repair Cycle in Faba Bean May Play a Role in Its Resistance to Botrytis fabae Infection" Agronomy 11, no. 11: 2247. https://doi.org/10.3390/agronomy11112247
APA StyleCastillejo, M. Á., Villegas-Fernández, Á. M., Hernández-Lao, T., & Rubiales, D. (2021). Photosystem II Repair Cycle in Faba Bean May Play a Role in Its Resistance to Botrytis fabae Infection. Agronomy, 11(11), 2247. https://doi.org/10.3390/agronomy11112247