Article

Modification of Gene Expression, DNA Methylation and Small RNAs Expression in Rice Plants under In Vitro Culture

1
Faculty of Agronomy, Jilin Agricultural University, Changchun 131018, China
2
Key Laboratory of Molecular Epigenetics of the Ministry of Education (MOE), Northeast Normal University, Changchun 130024, China
3
School of Life Sciences, Central China Normal University, Wuhan 430079, China
4
Department of Biology, University of British Columbia Okanagan, Kelowna, BC V1V 1V7, Canada
*
Authors to whom correspondence should be addressed.
These authors contributed equally to this work.
Agronomy 2022, 12(7), 1675; https://doi.org/10.3390/agronomy12071675
Submission received: 27 May 2022 / Revised: 12 July 2022 / Accepted: 13 July 2022 / Published: 14 July 2022

Abstract

:
Tissue culture is an important experimental technique widely used for plant transformation and can induce somaclonal variation that is shown to be associated with genetic and epigenetic changes. However, the molecular basis of somaclonal variation and plant cell response to tissue culture has yet to be fully understood. In this study, we investigated gene expression, DNA methylation, and small RNA changes in regenerated lines (RL) compared with the wild-type progenitor plants (WT) of rice cv. Hitomebore. Using microarray, we identified many genes that were differentially expressed in the shoot-tip tissue and showed that TEs were generally activated in RL. Methylation Sensitive Amplification Polymorphism (MSAP) analysis of 5′CCGG sites combined with bisulfite sequencing detected a generally reduced DNA methylation in the RL lines. Small RNA sequencing analysis detected widespread changes in small RNA accumulation between RL and WT. In particular, repeat and TE-associated 24-nt size class of small RNAs, the inducer of RNA-directed DNA methylation, was in general down-regulated in RL, consistent with reduced CHG and CHH methylation at some of the differentially methylated TE loci. A large number of differentially expressed miRNAs were identified in RL and WT lines, including known and novel miRNAs. The expression of some of these miRNAs exhibited inverse correlation with the predicted target genes, suggesting a regulatory function. The RL plants looked similar to WT plants under normal conditions but showed significant phenotypic alterations under abiotic stress conditions. The widespread changes in DNA methylation, small RNA accumulation and gene expression in regenerated plants supports the role of epigenetic changes in tissue culture-induced somaclonal variation.

1. Introduction

Plant tissue culture is widely used for plant genetic transformation and clonal plant propagation [1,2,3]. The plant tissue culture process involves the regeneration of plants from differentiated somatic cells, which can induce the re-establishment of the plant genome causing somaclonal variation [4,5,6]. Studies in Arabidopsis, rice, and barley have indicated that genomic changes induced by tissue culture involve both genetic and epigenetic changes in the genome [7,8,9]. Though the phenotypic variation is not necessarily associated with the genetic and epigenetic variation, it is important to study the outcomes of tissue culture at the genotypic level [9].
Reprogramming of somaclonal cells during tissue culture can generate single nucleotide polymorphisms/indels alteration that can change gene expression and reactivate transposable elements [10,11,12]. In addition, epigenetic markers are dramatically changed in generated lines of somaclonal variation plants, including changes in DNA methylation, chromatin modification, and small RNAs [8,13,14]. Endogenous genes and transposable elements are shown to be activated by tissue culture and regulated by a complex epigenetic system during tissue culture process [12,15]. DNA methylation plays an important role in regulating gene expression and maintaining genome stability [15,16,17,18]. There are three types of cytosine DNA methylation in plants: CG, CHG, and CHH (where H is A, T, or C), while CG methylation was most abundant in the genome. CG and CHG methylation can be maintained by MET1 (DNA methyltransferase 1) and CMT3 (chromomethylases 3) during DNA replication, respectively [19,20]. Null mutation of the MET1-coding gene causes genome-wide loss of DNA methylation and pleiotropic developmental defects in plants [21,22]. The third class of methyltransferase gene, DRM, encodes a de novo methyltransferase. DRM is also a component of the RNA-directed DNA methylation (RdDM) pathway that uses siRNAs as a guide to direct cytosine methylation at CG, CHG, and CHH sites and is required to maintain the methylation at the CHH sites in plants [23,24]. Transposable elements (TEs) are often activated by tissue culture, which is regulated by a complex epigenetic system involving DNA methylation, chromatin modification, and small RNAs [25,26,27,28]. Previous studies in Arabidopsis have reported that TEs become hypomethylated and certain genes become hypermethylated in tissue culture-regenerated plants. While genes are methylated at primarily CG sites, TEs are methylated at all sequence contexts namely CG, CHG, and CHH sites [29]. In rice (cv. Nipponbare), tissue culture-regenerated lines exhibit loss of DNA methylation at certain sites across genome compared to wild-type lines. Most of the epigenetic alterations are stable over generations, whereas CG methylation is critical for retaining TE immobility and genome stability [8]. Although large numbers of TEs are transcriptionally activated in plant DNA methylation-deficient mutants, only limited numbers of TEs are mobilized [28]. Previous studies have revealed that the established function of cytosine methylation in the promoter region is to repress gene expression transcriptionally, and methylation within the gene body region plays a regulatory role in alternative RNA splicing [8,30]. Thus, the DNA methylation status in the coding and non-coding regions around the functional genes and TEs is important for plant growth and development.
Small RNAs play a key role in regulating biological processes in plants, including plant development, phase changing from vegetative growth to reproduction, and response to biotic/abiotic stress [31,32]. MicroRNAs (miRNAs) are 20–24 small RNAs controlling the expression of primarily regulatory genes via mRNA cleavages or translational repression [28,33]. It has been reported that embryogenic callus tissues of rice express a unique set of miRNAs, such as miR397, which target cell wall-associated genes to suppress cell wall thickening and keep the cells in a meristematic state [34]. In strawberry, miRNAs heritably change gene expression in generated lines to regulate gene expression associated with somaclonal variation [35]. The RdDM-associated 24-nt siRNAs are required for de novo cytosine methylation that contributes to heterochromatinization of TEs and repetitive DNA and regulation of gene expression across the plant genome [24,31,36]. Previous reports have shown that DNA methylation and 24-nt siRNAs are reduced by somaclonal variation in callus tissues and regenerated plants of rice (Nipponbare), especially in CHH contexts of the gene promoter regions [8]. The distribution of 24-nt siRNAs over CHH hypomethylation regions are enriched in wild-type but eliminated in regenerated plants [8]. However, epigenetic modifications in somatic cells during mitotic divisions to generate clonal individuals is still unclear. Furthermore, whether similar epigenetic variations would occur in different genotypes of rice during the tissue culture process is still unknown.
In this study, an extensively selfed somaclonal line and its wild-type donor (cv. Hitomebore) of rice were used to investigate (i) tissue culture-induced functional gene expression alteration; (ii) tissue culture-induced DNA methylation changes; (iii) tissue culture-induced small RNAs expression variation; and (iv) the link between changes in epigenetic changes and gene expression variations in the regenerated line and wild-type donor. Our findings supported the hypothesis that epigenetic modification is a key regulator in somaclonal variation in the plants.

2. Materials and Methods

2.1. Plant Materials

This study used regenerate lines and wild-type rice (Oryza sativa ssp. japonica cv. Hitomebore) as our plant materials. Conditions of tissue culture were the same as we reported previously [37]. Genomic DNA from leaf tissues of uncultured wild-type (WT) and regenerate line (RL, selfed for five consecutive generations) was isolated by a modified CTAB method [38] and purified by phenol extractions. Genomic DNA was used for Methylation-Sensitive Amplified Polymorphism (MSAP) and bisulfite sequencing experiments. Total RNA was isolated from the same seedlings with the Trizol Reagent (Invitrogen, Carlsbad, USA) according to the manufacturer’s instructions. The RNA was then treated with RNase-free DNaseⅠ (Invitrogen) to eliminate possible genomic DNA contamination before being reverse-transcribed with the SuperScript RNase H− Reverse Transcriptase (Invitrogen), which were used for smRNA sequencing, microarray transcriptional profiling, RT-PCR, and qRT-PCR experiments. Healthy seeds of RL and WT were selected for abiotic stress treatments, including 150 mM NaCl (salinity), 0.25 mM CuSO4 (heavy metal), 0.25 mM HgCl2 (heavy metal), and 1 mM sodium nitroprusside (nitric oxide), in concordance with previous reports [37].

2.2. Methylation-Sensitive Amplified Polymorphism (MSAP) Analysis

MSAP is a modified version of the amplified fragment length polymorphism (AFLP) to detect the stability and alteration in cytosine DNA methylation at 5′-CCGG sites [39]. The operation and calculation method were the same as the previous report [40], and the primers were listed in Supplementary Table S1. We selected ten plants to mix as a pool to detect. Each pool of WT-1, WT-2, RL-1, RL-2, and RL-3 was analyzed and presented by histograms.

2.3. Bisulfite Sequencing

Genomic DNA was modified using an EZ DNA Methylation Gold kit (Zymo Research) according to the manufacturer’s recommendations. Specific primers for amplification were designed with the MethPrimer program (http://www.urogene.org/methprimer/ (accessed on 12 July 2022)) and the same as our previous reports [41]. The sizes of the bisulfite PCR products were verified by agarose gel electrophoresis and then cloned into the pMD18-T vector (Takara Biotech. Inc., Dalian, China). The positive clones were sequenced with vector primers. The results were calculated and presented based on previous reports on the Kismeth website (http://katahdin.mssm.edu/kismeth (accessed on 12 July 2022)).

2.4. Analysis of SmRNA-Seq and Affymetrix GeneChip® Rice Genome Array

Total RNA of the samples WT and RT were prepared for smRNA sequencing based on the standard workflow of Illumina manufacturer’s instructions, the equivalent amounts of RNA from WT and RT were used for quantified and equalized analysis. As stated in our previous report [41], smRNA regions (15–30 nucleotide) were selected from the 15% TBE-urea denaturing PAGE gel when total RNA was purified by electrophoretic separation, then ligated with 5′ and 3′ RNA adapter by T4 RNA ligase and purified by urea PAGE gel electrophoretic separation. The smRNA ligated with adapter was subsequently transcribed into cDNA, and PCR amplified (using primers that anneal to the ends of the adapters), purified, and recovered. The final quality of the library was ensured by validation of the size, purity, and concentration using an Agilent Technologies 2100 Bioanalyzer. SmRNA libraries for WT and RL were constructed and sequenced by the HiSeq2000. Raw data were cleaned by removing adaptor contamination and low-quality reads using Trim Galore, as in our previous report [21]. TIGR_Oryza_Repeats.v3.3 (ftp://ftp.plantbiology.msu.edu (accessed on 12 July 2022)), small RNA clusters were annotated according to the overlapping relation between the genomic coordinates of repeats and small RNA clusters [24]. Additionally, tRNA (http://rice.plantbiology.msu.edu/analyses_search_tRNA.shtml (accessed on 12 July 2022)), rRNA (Rice Genome Annotation MSU7.0), and snoRNA (http://www.arb-silva.de/no_cache/download/archive/release_111/Exports/ (accessed on 12 July 2022)) were used as described in our previous report [21]. Clean reads were aligned to the rice MSU7.0 reference genome (ftp://ftp.plantbiology.msu.edu/pub/data/Eukaryotic_Projects/o_sativa/annotation_dbs/pseudomolecules/version_7.0/all.dir/ (accessed on 12 July 2022)) by Bowtie2 [42] allowing 0 mismatches. In accordance with our foregoing reports [41], small RNA reads of 18–27 nt in size were removed tRNA and then counted within every sliding 100 bp window along the rice genome, meanwhile, each window contained > 3 reads were tested by binomial test and FDR adjustment between RL and WT, the corrected p-value ≤ 0.05. We compared the median RPM (reads per million) values between RL and WT. The results were presented as histograms which X and Y were denoted for RL and WT, respectively. The fold value was log2(X/Y). The modifying miRDeep2 software was used to analyze miRNAs, while known miRNAs were annotated on the miRBase database (http://www.mirbase.org/ (accessed on 12 July 2022)). We found known miRNAs and novel miRNAs as described in previous research reports [41]. The data have been deposited at the SRA database (http://www.ncbi.nlm.nih.gov/sra/ (accessed on 12 July 2022)) with accession number SRP042238 and SRP378396. The microarray transcriptional profiling was performed by Affymetrix, Inc. in the Gene Company Ltd. (Shanghai, China), using procedures described in the GeneChip® Expression Analysis Technical Manual. The data were analyzed with Expression Console using RMA as normalization method as previously reported [43]. All microarray data have been submitted to the GEO repository under the accession number of GSE58007 and GSE207223.

2.5. Gene Ontology (GO) Analysis

The GO analysis was performed using the online PANTHER 15.0 platform (http://www.pantherdb.org/ (accessed on 12 July 2022)). Molecular function category GO terms with FDR-corrected p-value < 0.05 were considered overrepresented by the Fisher tests.

2.6. Real-Time qRT-PCR Analysis

The primers for amplifying the 12 genes were designed using the Primer 5 software and listed in Supplementary Table S2. We calculated the expression levels in RL and WT presented as histograms. The t-test was used to test for statistical differences in relative expression levels between RL and WT. The reaction protocol and amplify primers for Hemi-nested RT-PCR for detecting miRNA expression were in accordance with a previously published paper [41].

3. Results

3.1. Tissue Culture Induces Gene Expression Variation and TE Activation in Regenerate Line of Rice cv. Hitomebore

We performed Affymetrix GeneChip Rice Genome Array (The Affymetrix, Inc. Santa Clara, CA, USA) to investigate gene expression in regenerated rice lines (RL) and its donor wild-type (WT), ssp. japonica, cv. Hitomebore. A mixed pool of shoot-tip tissues of 30 plants for each genotype allowed for transcriptome profiling. Affymetrix analysis showed that there were 57,381 expressed genes, including 23,494 that showed expression in both RL and WT (Figure 1A). Of these genes, 888 showed significant differential expression between the two genotypes (>2 fold in t-test, p < 0.05), including 299 upregulated and 589 downregulated genes in RL (Figure 1A). The differentially expressed genes (DEGs) were distributed randomly across the 12 rice chromosomes (Figure 1B). To examine the function of the DEGs identified between WT and RL, we performed GO enrichment analyses. Interestingly, the notably enriched GO terms contained a number of Gene Ontology categories including response to stress and response to stimulus (Figure 1C). To verify the microarray results, we randomly selected 12 genes and analyzed their expression using qRT-PCR. The result showed the same trend of differential expression for 11 of the 12 genes (Figure 1D), confirming the high quality of the microarray data.
We also compared the expression of several retro-transposable elements (TE) using semi-quantitative RT-PCR, which was not represented in the microarray data due to a generally low level of transcription of TEs. The results showed that TE transcription was mostly up-regulated in the callus and regenerated seedling tissues compared to wild-type plant tissues (Supplementary Figure S1). This result suggested that the tissue culture process induced transcriptional activation of some TEs.

3.2. Tissue Culture Induced DNA Methylation Alteration in Regenerated Line of Rice cv. Hitomebore

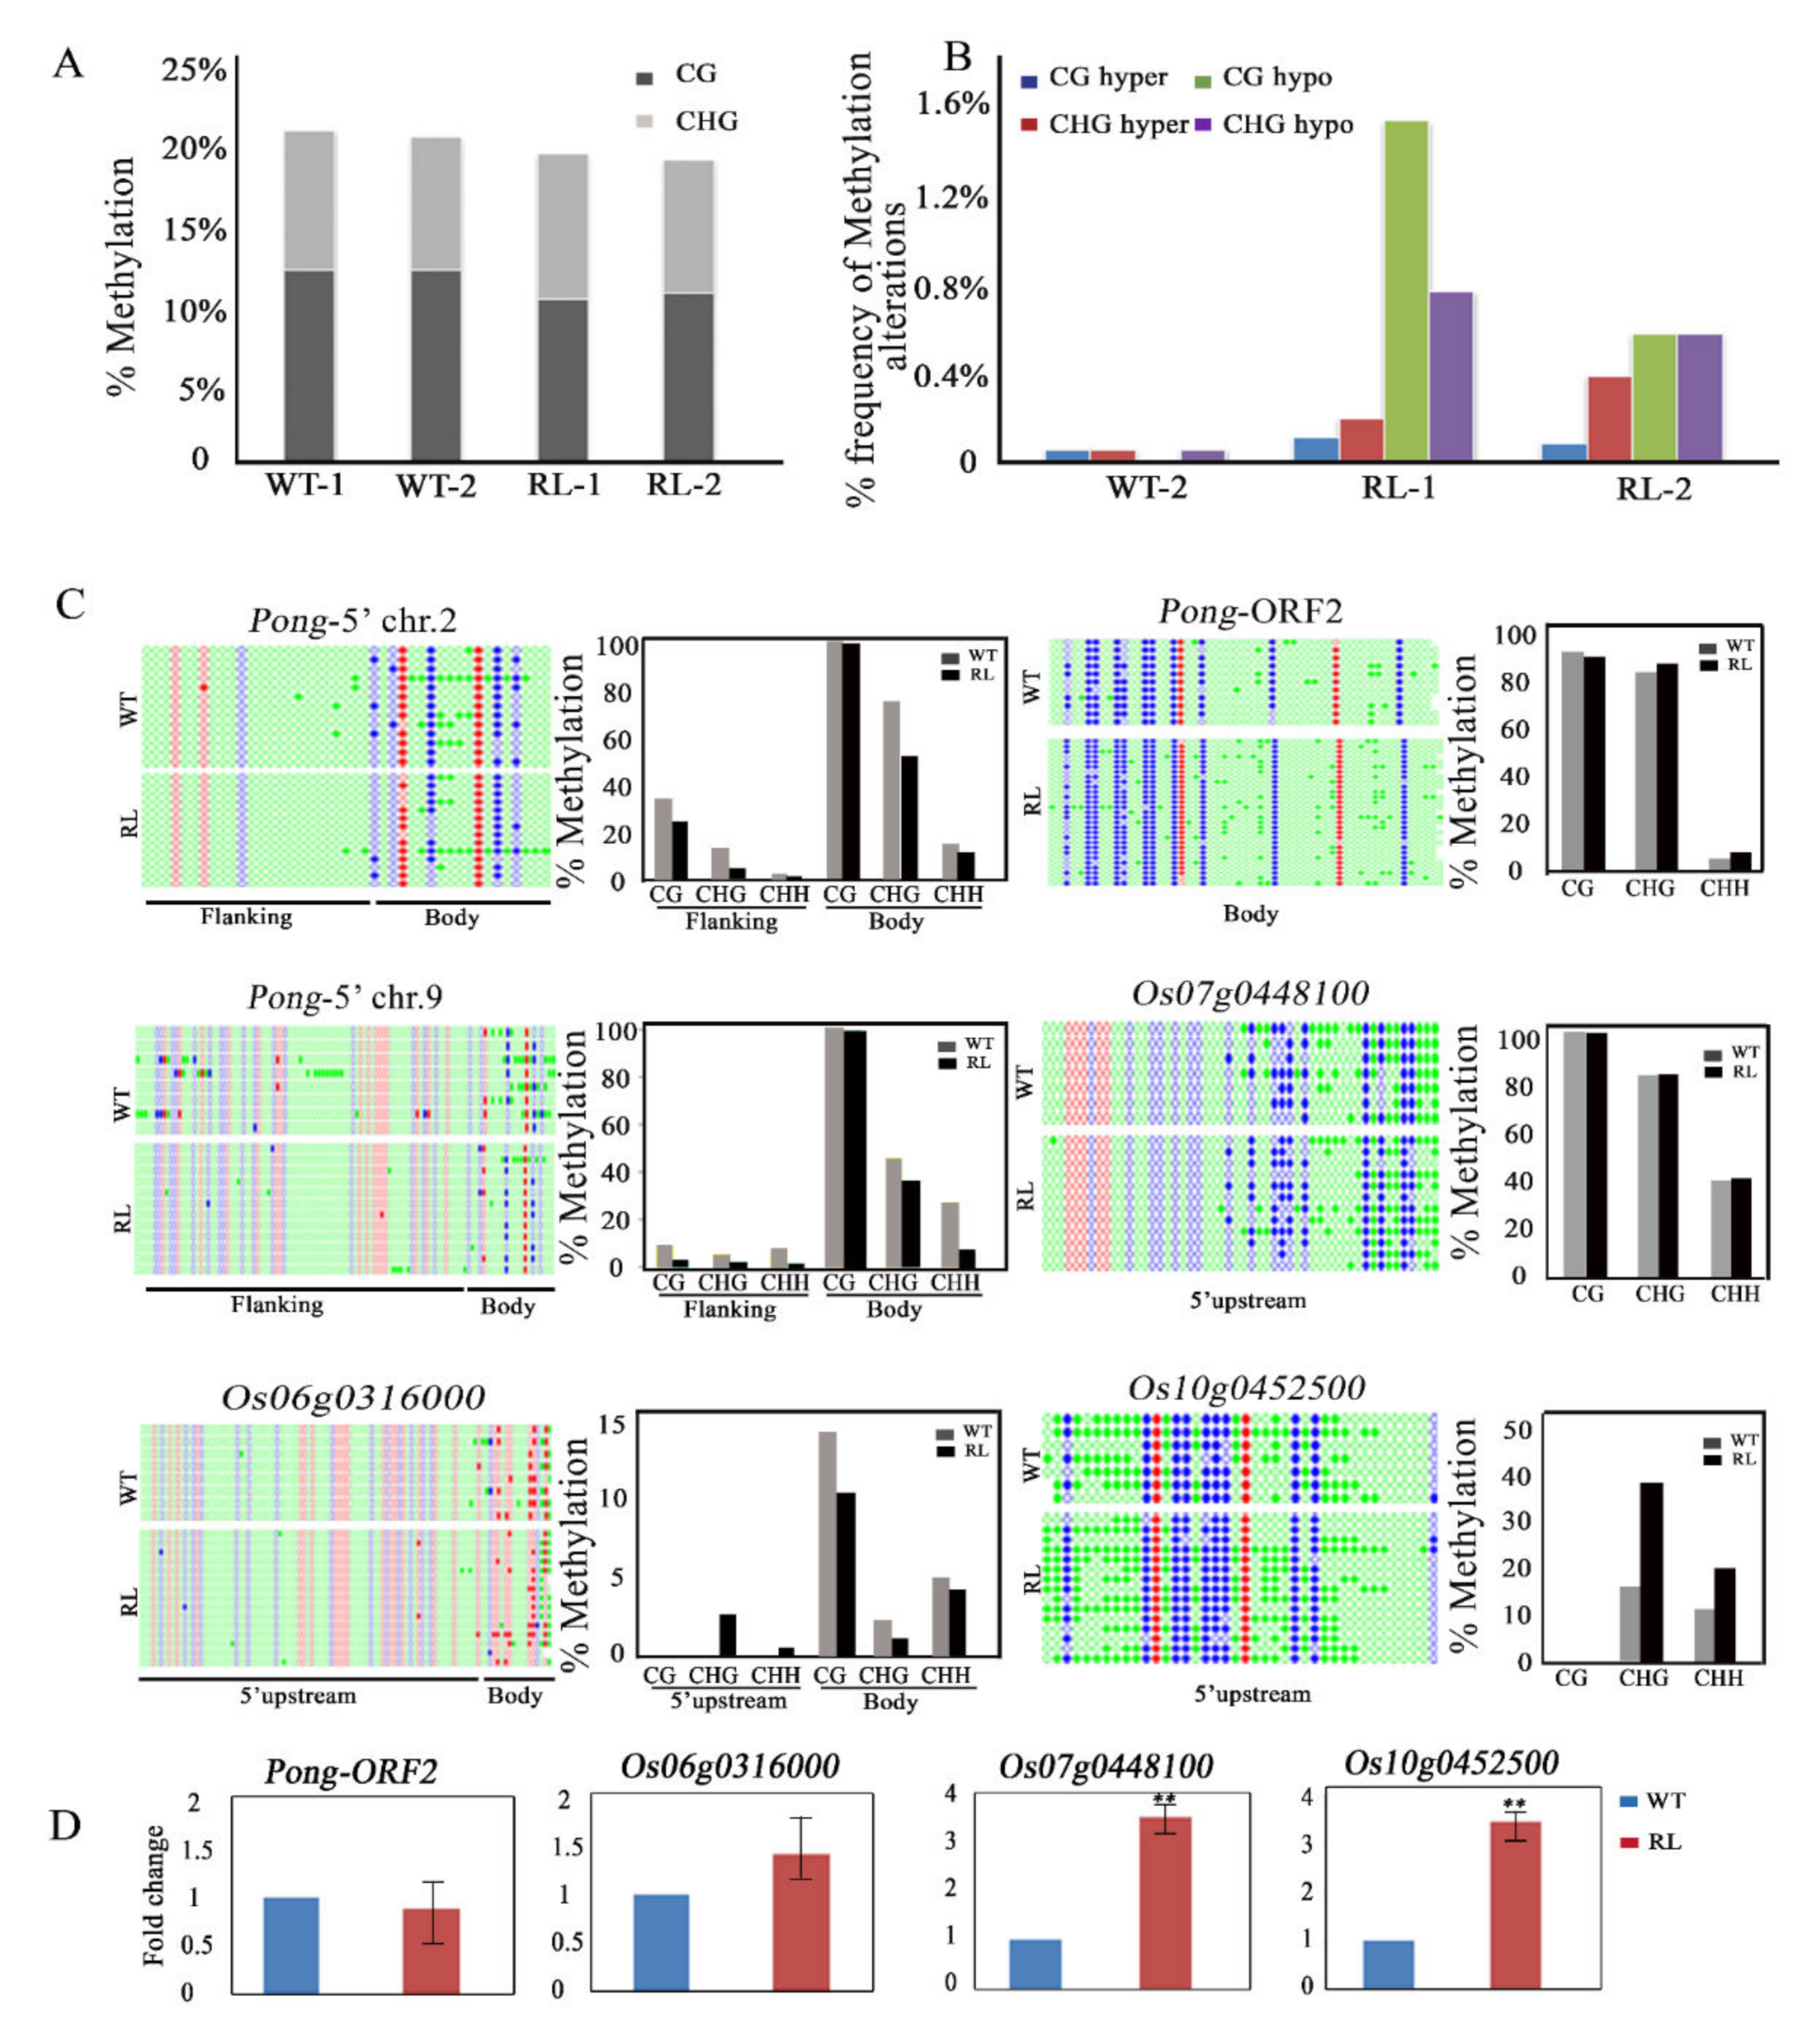
To investigate the DNA methylation profiles and examine if the differential gene expression detected by microarray was associated with DNA methylation changes, we used MSAP (for 5′-CCGG sites) and locus-specific bisulfite sequencing to determine DNA methylation variation between RL and WT. A total of 1160 clear bands were scored in the MSAP analysis using 20 pairs of selective primers (Supplementary Table S1). The DNA cytosine methylation levels of the CCGG sites were 20.90%, 20.52%, 19.42%, and 19.06 in WT1, WT2, RL1, and RL2, respectively (Figure 2A), indicating that tissue culture caused a small reduction in overall DNA methylation at the CCGG sites. However, when methylation at the CG context was compared, the reduction was more pronounced (10.26% and 10.64% in RL1 and RL2 respectively compared to 12.1% and 12.1% in WT1 and WT2) (Figure 2A). To better examine the alteration of DNA methylation, we summarized hyper-/hypo-DNA methylation in RL compared to WT1 in Figure 2B, which showed that the frequencies of DNA methylation pattern alterations ranged from 0 to 2.93%: (1) the biggest change was CG hypo-methylation (2.93%) in RL1, the smallest change were CG hyper-methylation (0.20%, 0.15%) in RL1 and RL2; (2) CHG hyper-methylation were at 0.37% and 0.73% frequencies in RL1 and RL2, respectively; (3) CHG hypo-methylation were at 1.47% and 1.10% frequencies in RL1 and RL2. Thus, RL1 and RL2 showed much more frequent DNA hypo-methylation than hyper-methylation. These results are consistent with the results that reduced DNA methylation in tissue cultured rice [8].
To explore whether tissue culture-induced DNA methylation changes played a role in regulating gene expression and transposon transposition in RL lines, we examined locus-specific DNA methylation variations in several TE and gene-associated sequences using bisulfite sequencing (Figure 2C): (1) Pong is a Class Ⅱ TE that transposes through a “cut and paste” mechanism, and encodes all functional products required for the transposition. No visible mobilization of Pong was detected by Southern blot (Supplementary Figure S2), but notably, in contrast to the general stability in methylation level, the 5′ portion of the Pong gene body together with the immediate upstream flanking region showed significant changes in DNA methylation in RL at all sequence contexts (CG, CHG and CHH). This pattern of DNA methylation alteration between RL and WT was similar on both two chromosomal copies (Chromosome 2 and Chromosome 9). Except for the heavy CG methylation of the 5′ gene body region that showed no variation between RL and WT, CG methylation in the flanking sequence and CHG and CHH methylation in both the flanking and the 5′ gene body regions were all reduced in RL compared to WT. However, the ORF2 gene body region of Pong had similarly strong CG and CHG methylation in RL and WT. (2) We investigated the DNA methylation variation in upstream flanking regions and/or gene body of three genes that were upregulated in RL (Figure 2D), Os06g0316000, Os10g0452500 and Os07g0448100. For Os06g0316000, the upstream flanking region showed no CG methylation but increased CHG and CHH methylation in RL, whereas the gene body had reduced methylation at all three contexts. The upstream region of the multi-copy gene Os07g0448100 also showed increased CHG and CHH methylation with no CG methylation in RL (Figure 2C), with similarly heavy methylation in the gene body in RL and WT. For the Os10g0452500 gene, there was heavy CG, CHG and CHH methylation in the 5′ flanking sequence in both RL and WT. Thus, the increased expression of Os06g0316000 and Os07g0448100 was associated with changes in DNA methylation in the upstream and/or gene body region, whereas that of the Os10g0452500 gene was not linked with methylation changes in these near-gene regions.

3.3. Tissue Culture Induced smRNAs Expression Variation in Regenerated Line of Rice cv. Hitomebore

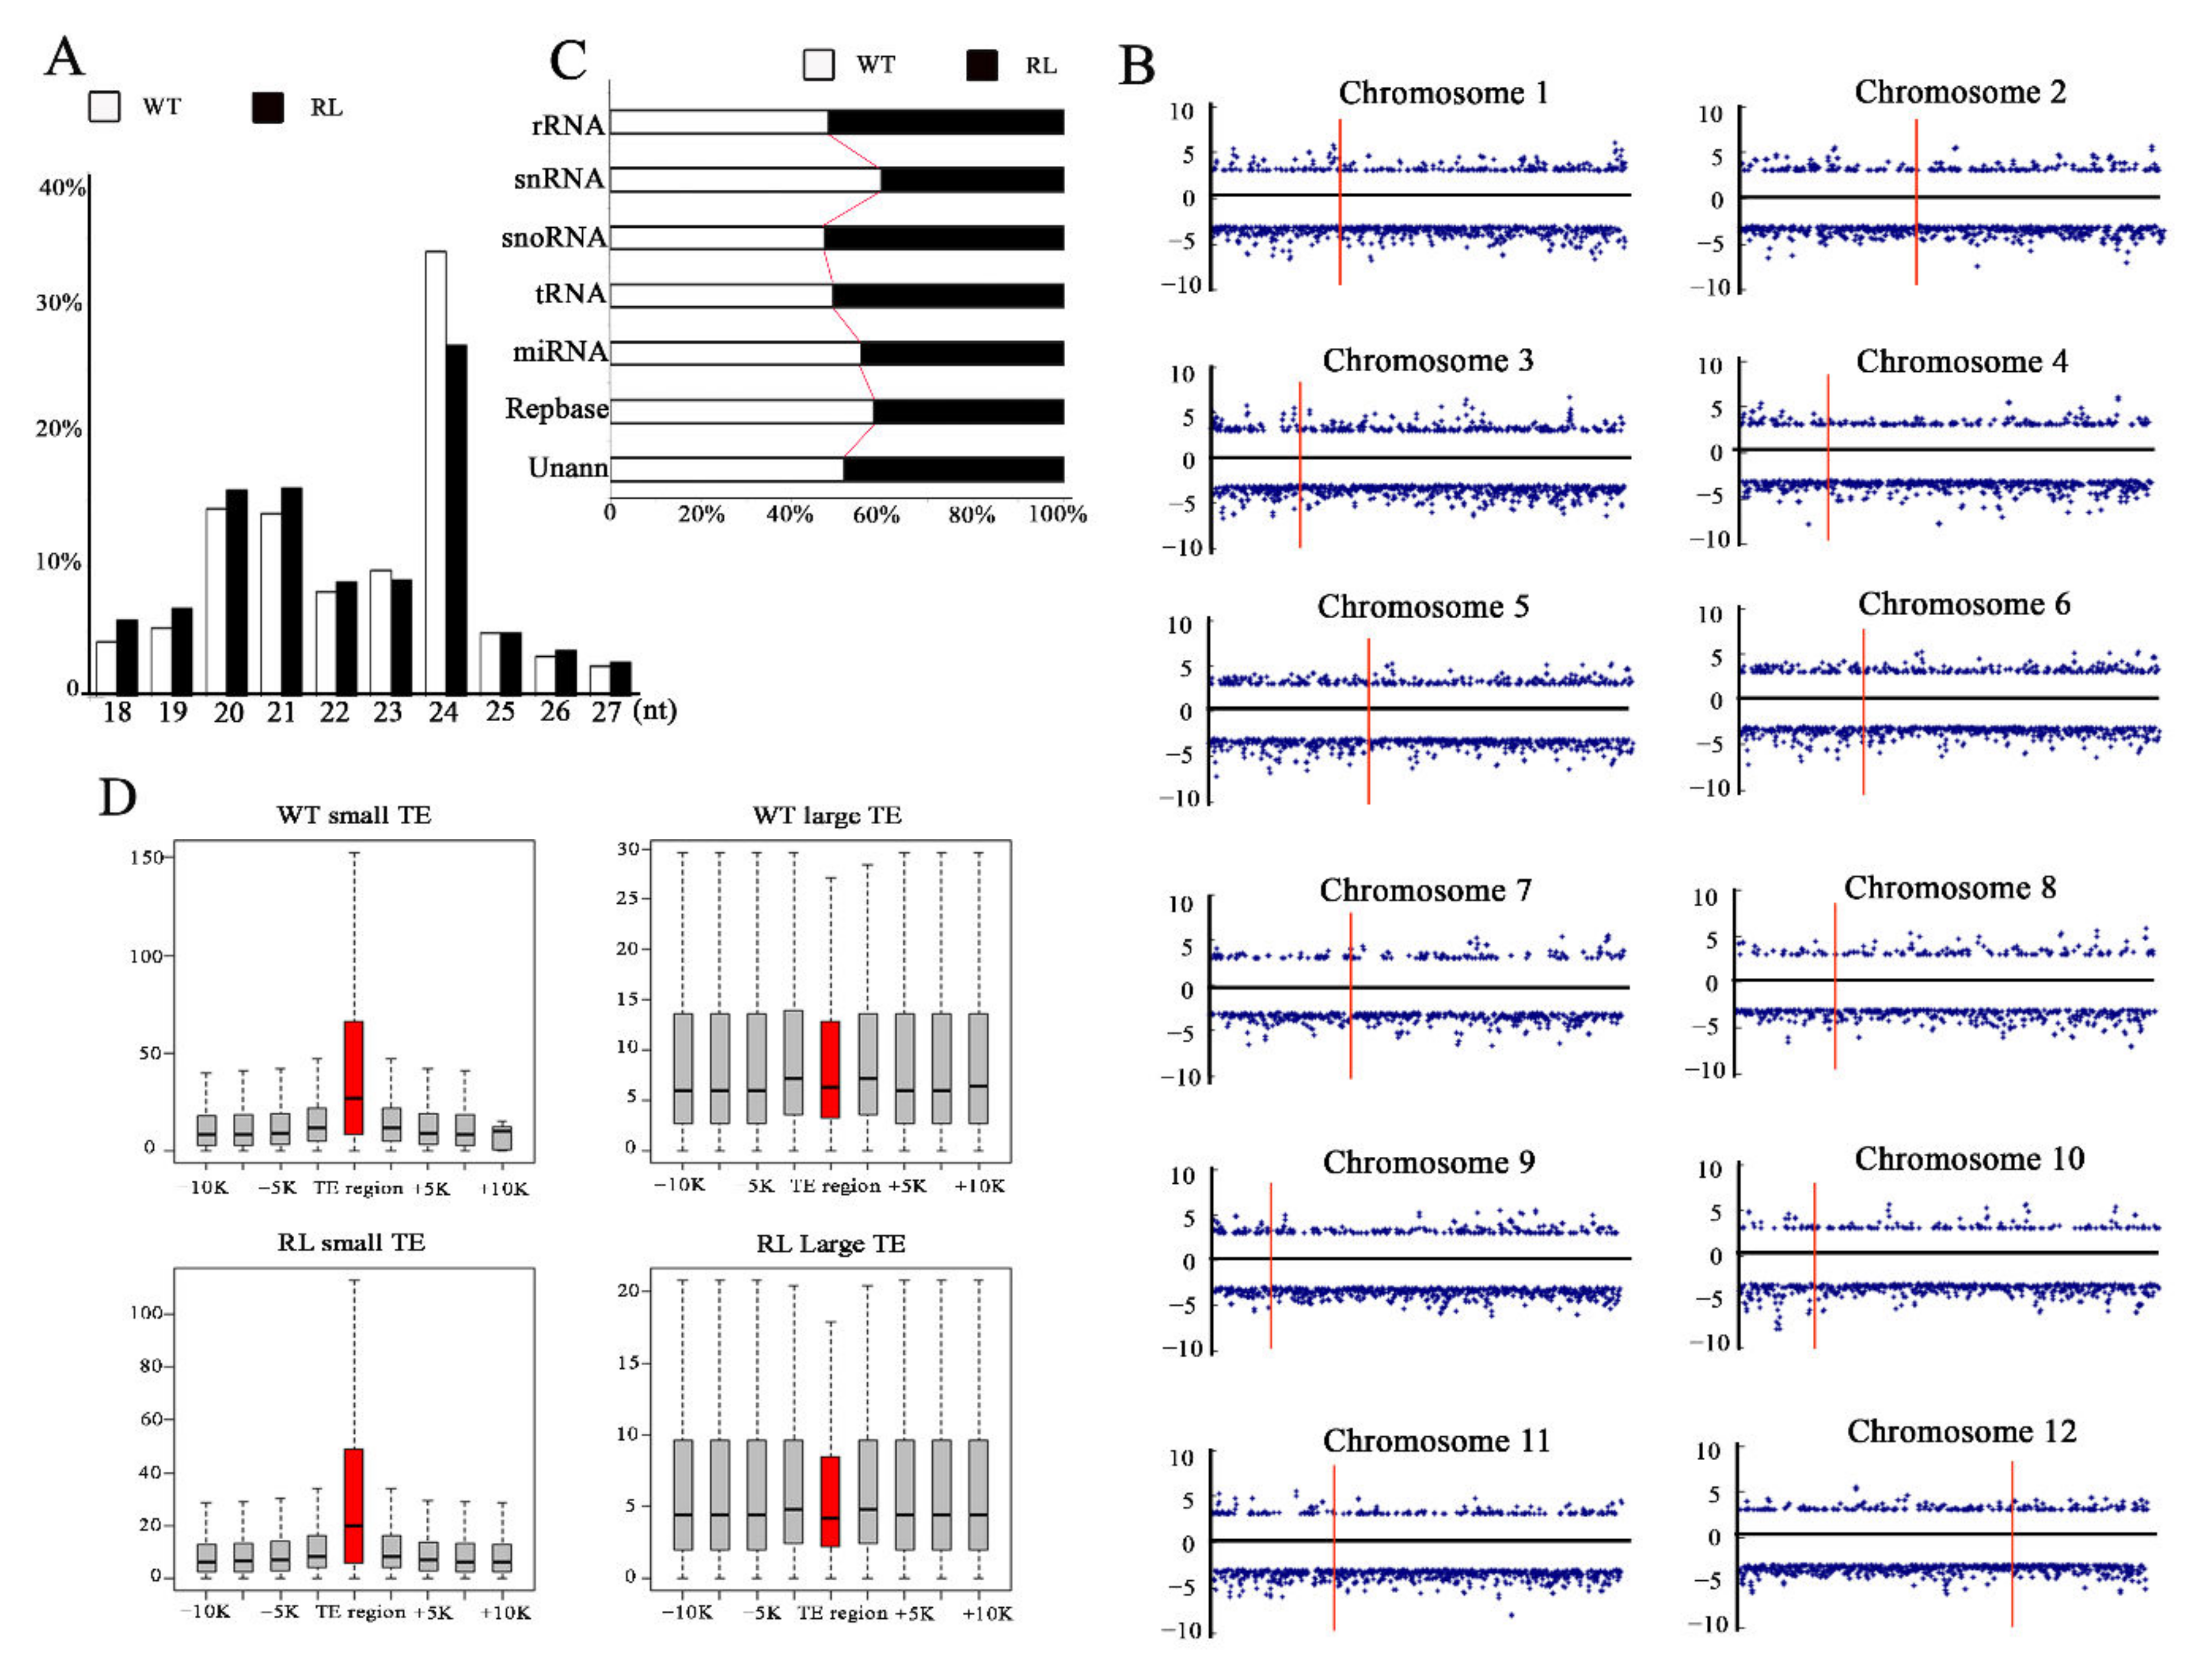
We investigated whether and to what extent smRNA profiles were affected by tissue culture by performing deep sequencing of small RNAs from RL and WT rice plants. The RL and WT sRNA libraries generated 11,827,487 and 12,271,065 high-quality reads, respectively. After discarding the adaptor sequences, poly-A sequences, and <18 nt sequences, we obtained 11,391,442 and 11,929,355 clean reads, respectively. Comparative analysis of these clean reads showed that: (1) among the 18–27 nt sRNAs, the 24-nt sRNAs were the most abundant, consistent with previous observation of sRNA size distribution in plants (Figure 3A); (2) the relative abundance of 24-nt siRNAs (and the related 23-nt siRNAs) were reduced in RL compared to WT (26.84% in RL and 34.03% in WT), indicating a reduction in RdDM activity in RL, which was distinct from the other size classes that generally showed a slight increase in RL (Figure 3A).
To further analyze the abundance of 24-nt siRNA between RL and WT across the rice genome, we created a density heatmap of 24-nt siRNA across the 12 chromosomes using a 100,000 bp sliding window, which showed a clear reduction in 24-nt siRNA abundance in RL compared to WT (Supplement Figure S3). This genome-wide reduction of 24-nt siRNAs was likely to be associated with some of the differentially methylated loci in RL.
We also investigated the difference in localized smRNA accumulation between RL and WT by mapping the cleaned smRNA reads to 100 bp sliding windows across each of the 12 rice chromosomes, and the result, normalized to reads per million, was depicted in Figure 3B. Differentially accumulated smRNA clusters were distributed evenly across the rice genome, with no obvious “hot spot”. By searching against GenBank, Rfam, tRNAdb, Silva, and Repbase databases using the bowtie2 software, these differentially accumulated siRNAs were shown to include siRNAs from both protein coding and noncoding genes as well as repetitive DNA (Table 1 and Figure 3C). Of the highly represented groups of sRNAs (rRNA, miRNA, repeat-derived sRNA, exon-, and intron-derived), the repeat-derived sRNAs showed the greatest reduction of abundance in RL compared to WT, followed by intron-derived sRNAs and miRNAs (Table 1). sRNAs from the non-coding antisense strand of exons also showed reduction in RL. Thus, the result showed a general reduction of sRNAs from non-protein coding sequences in RL.
The unannotated sRNA sequences of the differential sRNA clusters (Table 1) were further characterized by matching them with transposable elements (TE) in the rice genome. Based on the length of TEs, we divided the TEs into two groups, with TEs of <1000 bp in length as small TEs and those of >1000 bp as large TEs, and analyzed the accumulation of small RNAs matching both groups. As shown in Figure 3D, sRNA accumulation of both the small and large TEs was down-regulated in RL. Notably, the decreased sRNA accumulation occurred in both the TE body and its flanking regions (−10 kb~+10 kb). To verify this result, we analyzed small RNA distribution across the Pong and Tos17 TEs, and determined small RNAs cluster variations with bins between RL and WT. The result showed that the accumulation of sRNAs matching the 5′-region was reduced for both TEs in RL compared with WT (Supplementary Figure S4). This reduced sRNA abundance coincides with the CHG and CHH hypomethylation at these sites (DNA methylation variation on Pong shown in Figure 2C and DNA methylation variation on Tos17 shown in our previous study), which strongly suggested that altered expression of small RNAs plays a role in the tissue culture-induced methylation changes in transposable elements. We also analyzed sRNA accumulation pattern of randomly selected Os06g0316000, Os07g0448100 and Os010g0452500 (Figure 2C), in which the particular genes showed the sRNA level is reduced but methylation is not reduced (Figure 2C, Supplementary Figure S4).
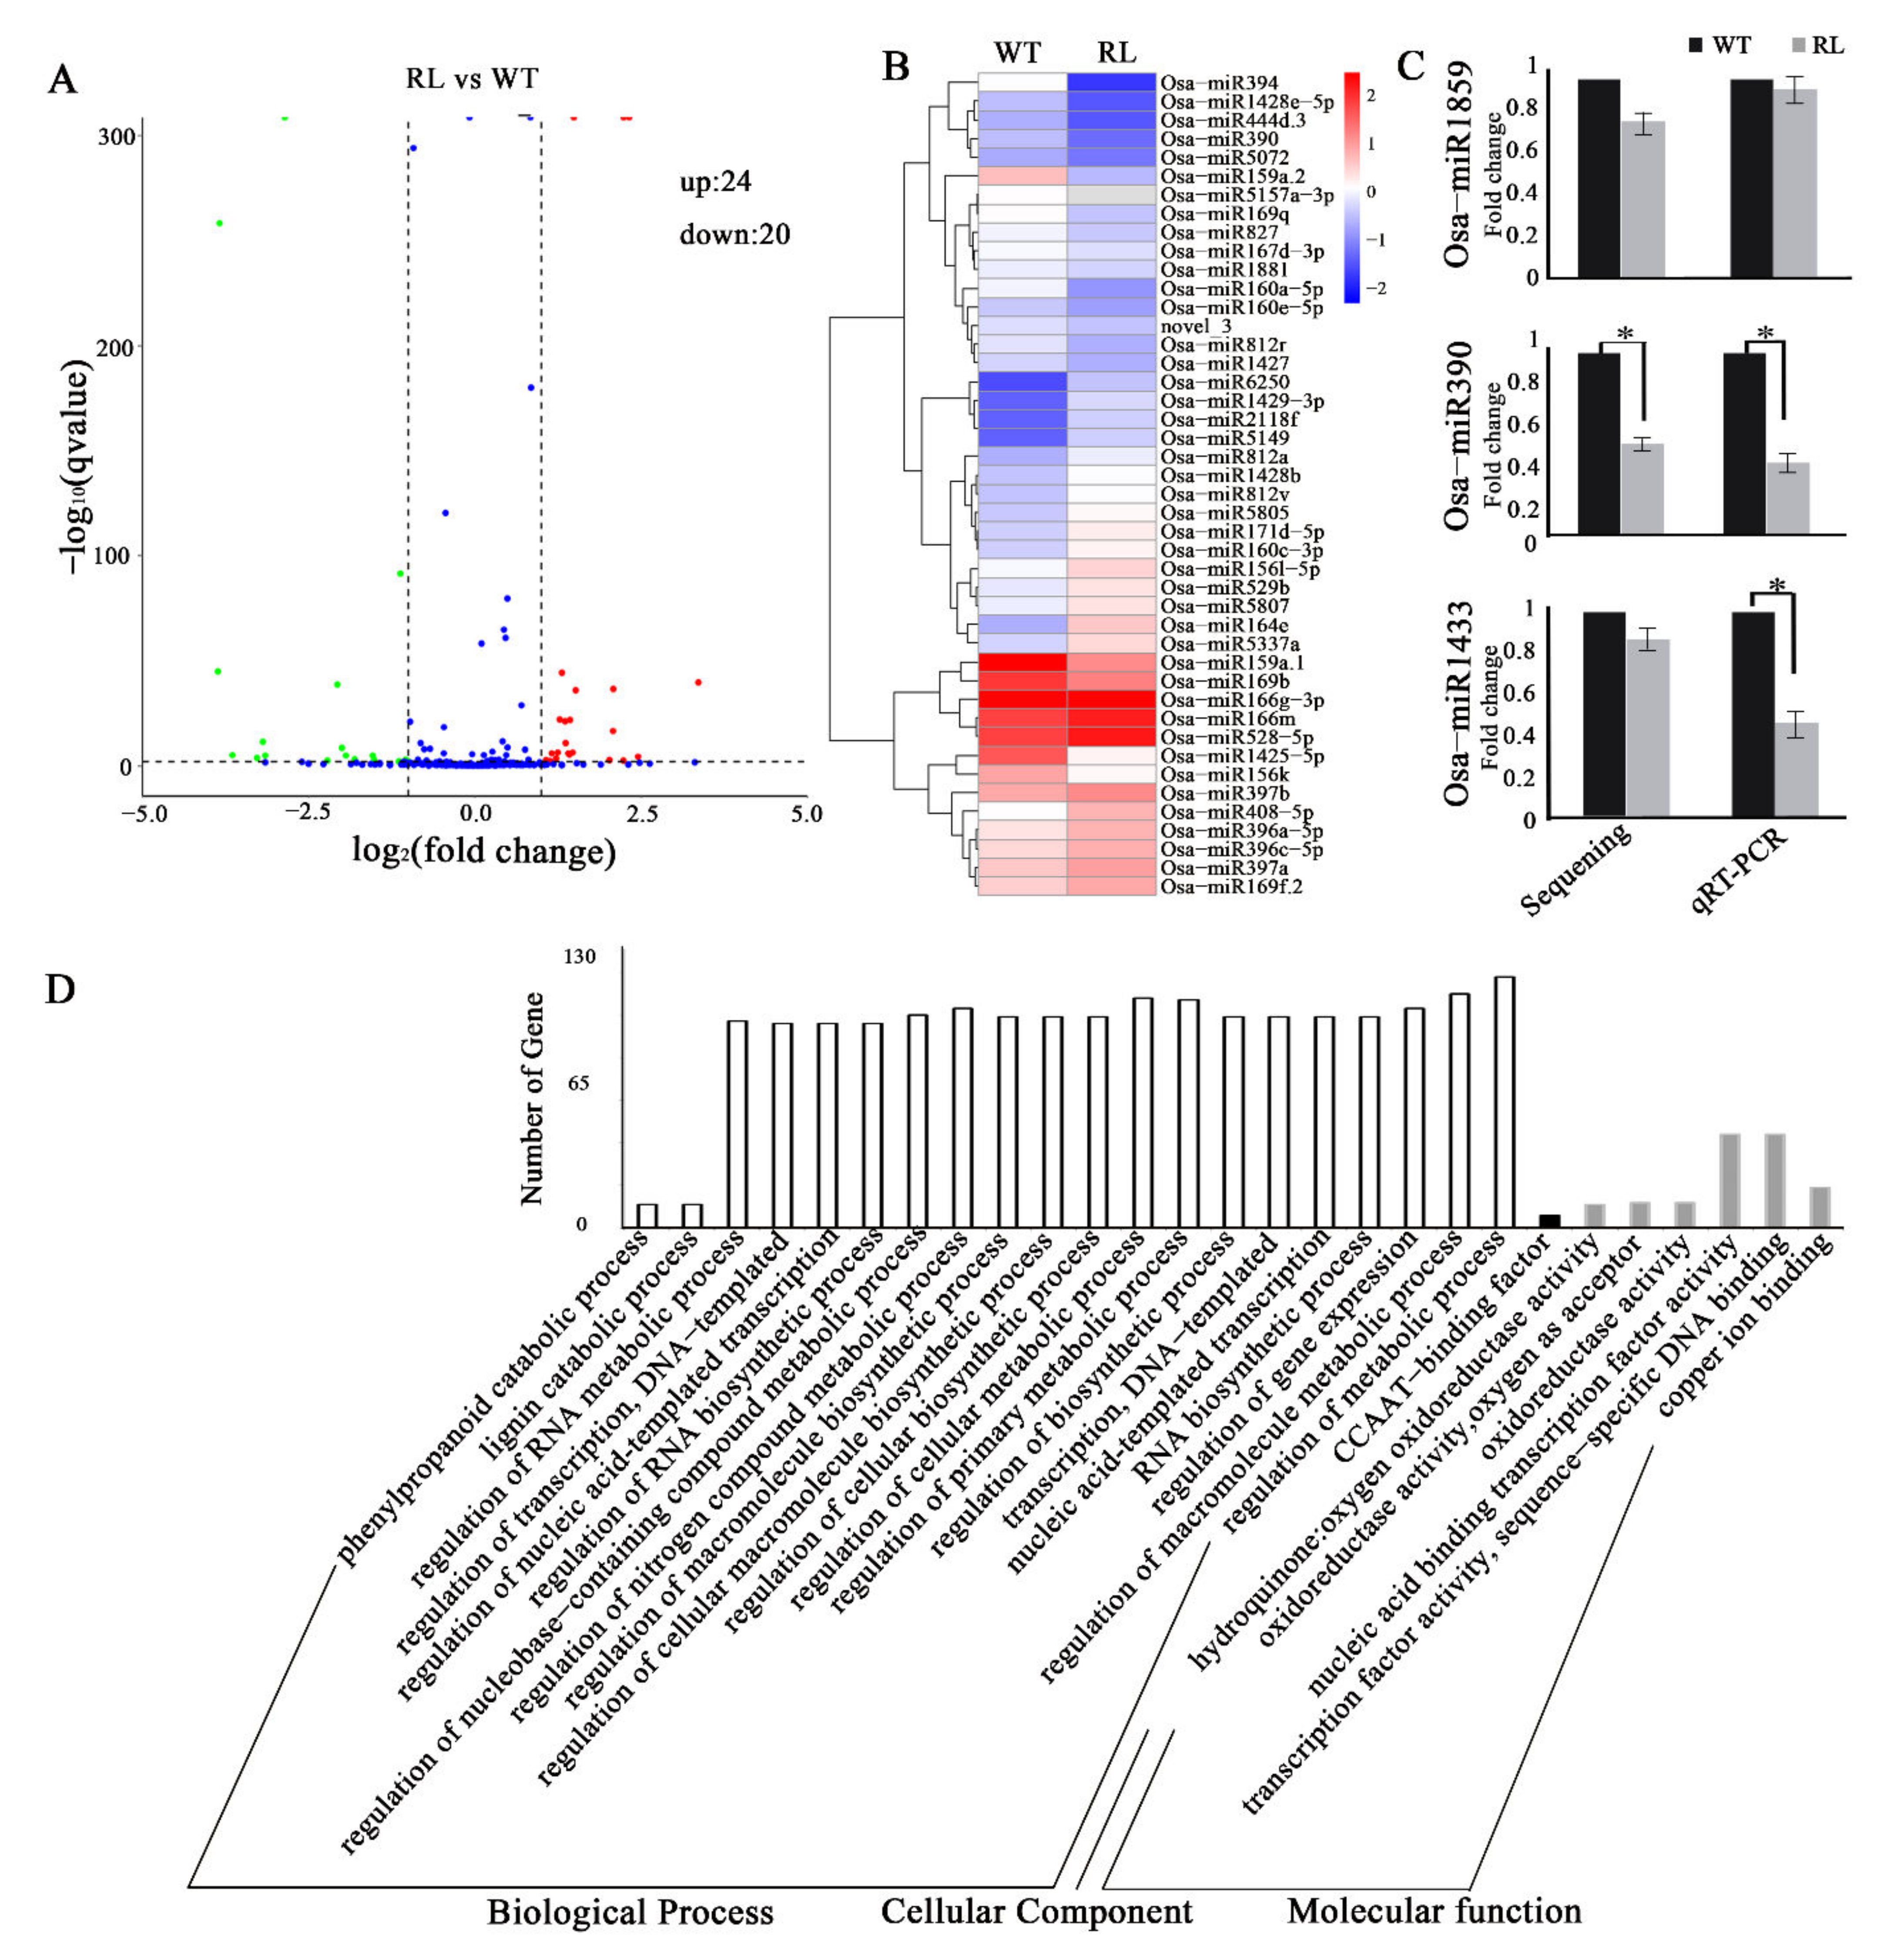
We identified 389 known miRNAs in RL and WT using a Blast search against the pre- and mature miRNA sequences in the miRBase database. In addition, we found 29 putative novel osa-miRNAs from the small RNA data of RL and WT plants based on the prediction of pre-miRNA-like stem-loop structures in the rice genome (Supplementary Figure S5, Supplementary Table S4). Of these 418 miRNAs, 24 (5.7%) expression showed up-regulation and 20 (4.8%) down-regulation in RL compared with WT (q value < 0.01, log2(fold_change) > 1), with the majority (375 or 89.5%) showing similar abundance in RL and WT (Figure 4A and Supplementary Table S3); the most abundant differentially expressed miRNAs were from the osa-miR160 and osa-miR169 families (Figure 4B), while miRNAs with the strongest up-regulation (log2.Fold change 3.36) and down-regulation (log2.Fold change −7.25) were osa-miR164e and osa-miR5157a-3p, respectively. osa-miR812a and osa-miR812r are members of the same miRNA family but their expression showed opposite directions, with osa-miR812a showing up-regulation (log2.Fold change 1.13) and the latter down-regulation (log2.Fold change −1.94) in RL. RT-qPCR analysis of 3 randomly selected miRNAs (osa-miR1859, osa-miR390 and osa-miR1433) confirmed the differential expression between RL and WT detected by sRNA sequencing data (Figure 4C).
To investigate the potential functions of the differentially accumulated miRNAs, we used TargetFinder software to predict putative target genes on all 44 differentially expressed miRNAs, resulting in a total of 3997 putative target genes (Supplementary Table S5). We next applied gene ontology (GO) analyses to categorize these miRNA targets. All expressed target genes were distributed on 27 GO terms, including 20 GO terms listed in biological process, 1 GO term in cellular component, and 6 GO terms in molecular function (Figure 4D). The most abundant GO term was regulation of macromolecule metabolic process (GO: 0060255). Using our microarray results, we identified 96 of these putative miRNA target genes showing altered gene expression that were associated with miRNA expression variation. In particular, the down-regulation of 15 target genes correlated with increased miRNA accumulation in RL, 19 down-regulated genes were associated with down-regulated miRNAs, and 3 and 57 genes showed co-upregulation and co-downregulation with their respective miRNAs, respectively (Supplementary Table S6). The results indicated that tissue culture induces wide-spread changes in miRNA expression, and that changes can result in changes in target gene expression.

3.4. Regenerated Plants Display Phenotypic Variations Only under Stress Conditions

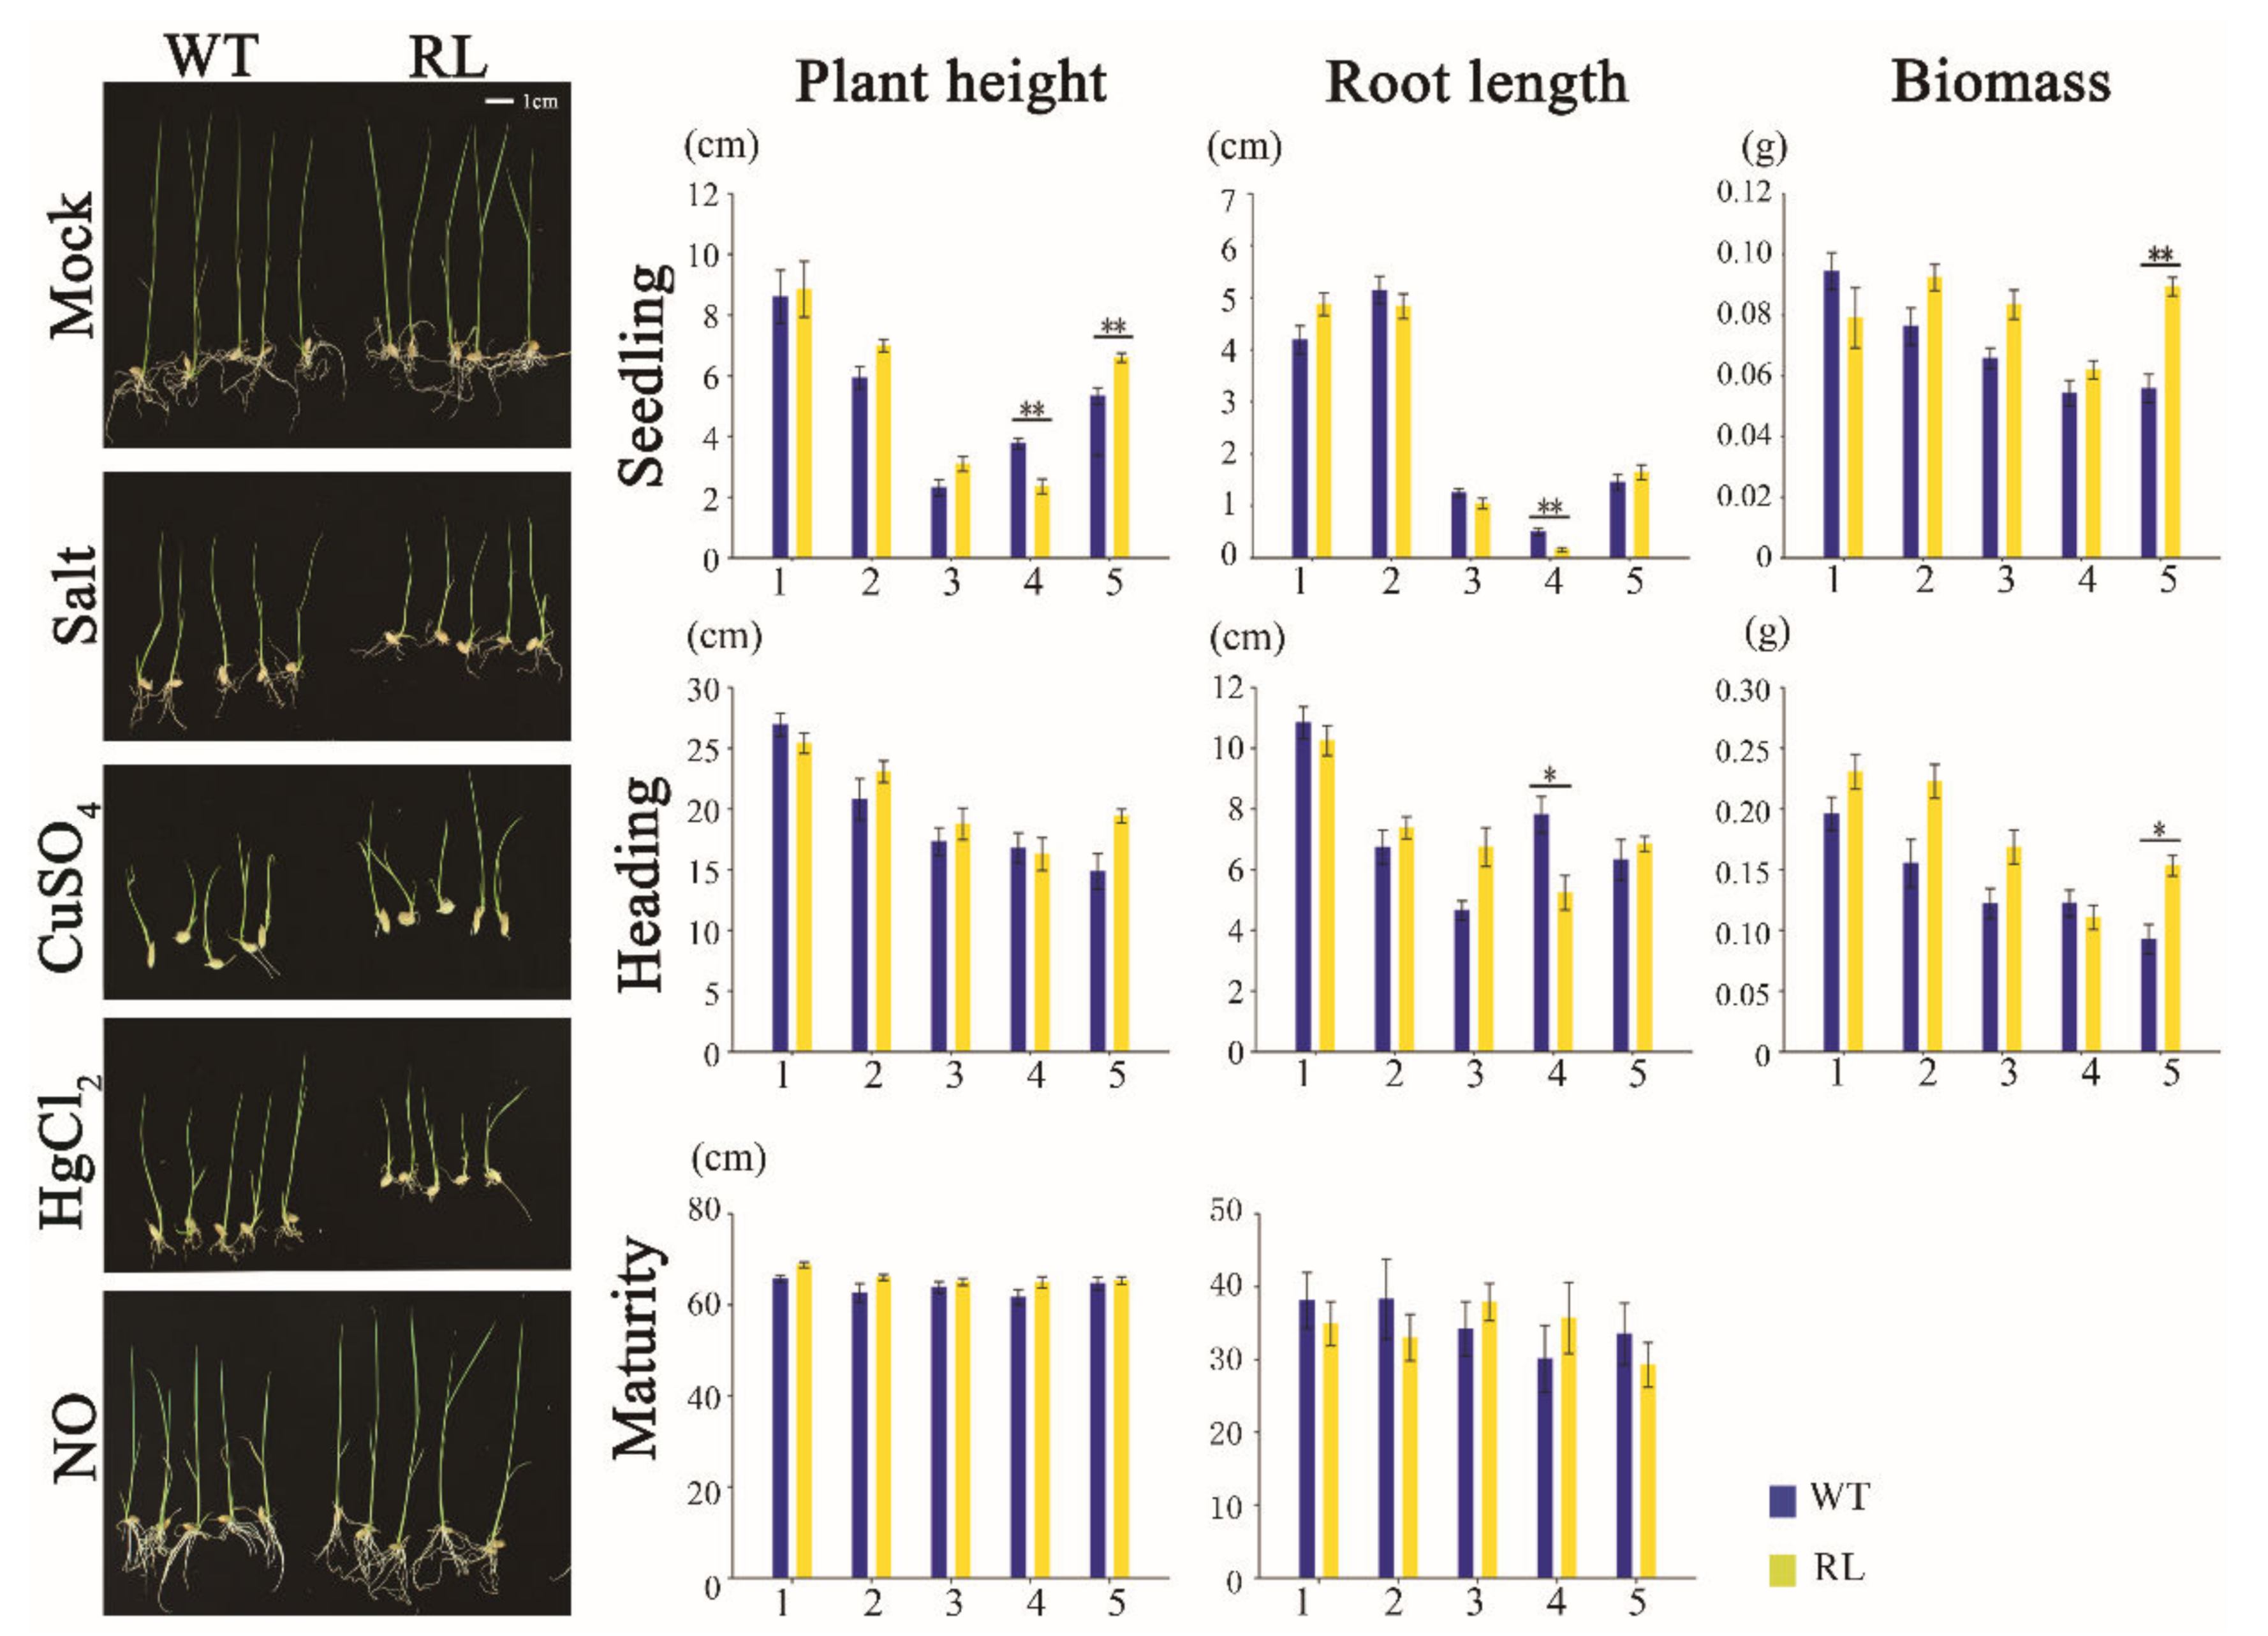
Although we detected genomic variations across the genome of the regenerated line, no visible phenotypic alteration was observed under normal growth condition. However, under abiotic stress conditions, clear changes in plant height, root length, and biomass were observed (Figure 5), which was consistent with our previous observation [37]. In particular, under HgCl2 stress there were dynamic differences in plant height and root length between RL and WT at the seedling and heading stages, but these differences largely disappeared at the maturity stage. Under the NO stress, plant height and biomass both showed alteration in RL compared to WT at the seedling stage.

4. Discussion

Tissue culture-induced somaclonal variations have long been observed, but genetic and the epigenetic changes associated with somaclonal variation are just beginning to be revealed in recent studies [40,44,45,46]. In this study, we used stabilized regenerated lines and their WT donor of rice cv. Hitomebore to investigate the changes in gene expression, DNA methylation, and small RNAs induced by tissue culture. Our results are in broad agreement with a previous study (8), but also contained unique observations. One interesting finding was that the majority of the 888 differentially expressed protein coding genes was down-regulated in the RL plants compared to WT donor plants. Furthermore, these genes were enriched for the GO category of “response to stress and response to stimulus”, which implied that the tissue culture process generated an endogenous stress to induce gene expression variation of stress response genes. Several recent studies showed whole-genome reduction of DNA methylation in regenerated line of rice cv. Nipponbare [8]. Differentially methylated regions (DMRs) were enriched for hypomethylation at the CG context, and certain hypomethylated sites were able to regain methylation over generations [8]. The loss of CG methylation was generally associated with a loss of CHG methylation and to a lesser extent with a loss of CHH methylation [8], which suggests that tissue culture treatment would cause large-scale remodeling of DNA methylation in rice. The MSAP analysis detected widespread 5′-CCGG methylation variation across the genome of rice cv. Hitomebore in regenerated lines, with the most numerous changes being CG hypo-methylation. This result was similar to that reported for Nipponbare [8], and indicated a general enrichment of CG hypo-methylation under the tissue culture process [8]. Using bisulfite sequencing of a subset of TEs and genes, we confirmed the frequent methylation variations in the RL lines. In our previous report, we showed that methylation of the retro-transposable element Tos17 located on chromosomes 7 and 10 was altered at all sequence contexts (CG, CHG and CHH) by tissue culture, which could affect the activity of Tos17 in RL [37]. Here, hypo-methylation was detected in the Pong TE and the Os06g031600 gene, where the variations of CHG and CHH methylation were associated with CG hypo-methylation on the same regions. However, the expression of the ORF2 of Pong and the Os06g031600 gene was not changed in the RL plants. For the Os07g044810 and Os010g0452500 genes, which were up-regulated in RL plants, the CHG and CHH sites at the 5′ upstream region was either hyper-methylation or unchanged. Thus, while most of the CHG and CHH sites were hypo-methylated and associated with CG hypo-methylation, these DNA methylation markers were correlated with the expression patterns of the genes. It was possible that some of the specific sites required for gene regulation were not included in the bisulfite sequencing analysis, or gene expression regulated by multiple genetic and epigenetic factors.
Both genetic and epigenetic changes were found to be associated with tissue culture-induced somaclonal variation [13,47,48]. Misregulation of microRNAs and small RNA pathways can make a significant contribution to the phenomenon [31,49]. The miRNA pathway was unusually susceptible to tissue culture caused by potential alterations in both the microRNA and their target genes [44]. In addition, the 24-nt siRNAs are the inducer of RdDM and required for maintaining CHH methylation in plants [31]. The previous study in rice, cv. Nipponbare, showed that the abundance of 24-nt siRNAs over hypomethylated CHH DMRs were reduced in regenerated plants [8].
Our small RNA analysis detected a clear down-regulation of the RdDM-associated 24-nt siRNAs in RL plants. Furthermore, the 24-nt siRNAs were diminished in some TEs and their franking region in the RL plants, which might be associated with CHH hypo-methylation across the rice genome (cv. Hitomebore). Some TEs are found to be transcriptionally reactivated across plant genome by the tissue culture process [37,50]. We detected the up-regulation of several transposase genes in callus and seedling of RL (Supplementary Figure S1), indicating that TEs were reactivated by the tissue culture process. The retro-transposable element Tos17 was transcriptionally activated, which was associated with DNA methylation variation in the RL lines [37]. We found that small RNA clusters were down-regulated in the 5′ flanking region and 5′ LTR region of Tos17 (the copies on chromosome 7 and chromosome 10) in RL (Figure S3), suggesting a direct link of siRNA accumulation with DNA methylation and Tos17 expression. Small RNA clusters were also down-regulated on the specific sites of 5′ flanking region of Pong, which correlated with CHH hypo-methylation in RL (Supplementary Figure S3). However, unlike Tos17, we did not detect the transposon activity, or differential expression, of Pong in RL (Supplementary Figure S2). Collectively, our results in this study indicated that the accumulation of siRNAs corresponding to CHH hypo-methylated regions were diminished in regenerated plants.
miRNAs expression is affected by different stresses in plants which would regulate mRNA levels to respond to environmental alteration and affect plant development and growth [44,51,52,53]. To clarify the targeted regulatory relationship between miRNAs and mRNAs, single miRNA to mRNA analysis or miRNA-mRNA integrated analysis are widely conducted [54,55]. In this study, we examined the miRNA expression alteration and its impact on target gene expression in the RL plants compared to the WT doner plants of rice cv. Hitomebore. miR397 was previously shown to be highly expressed in embryogenic callus cells of rice [34]. Here we found that miR397a and miR397b showed >2 folds up-regulation in RL plants, which correlated with their target gene (Os05g0458600) being significantly down-regulated. miR159, as another example, is induced by loss of competence for embryogenic development or by abiotic stress [31,51], and we found that miR159a.1 with high expression level was significantly down-regulated in RL which correlated with up-regulated expression of its target gene (Os09g0125900). Additionally, miR528 and miRNA164 play a critical role during plant development and growth and are inducible by stress with changed target gene expression in plants [56,57]. We found that miR528-5p was highly expressed with >4 folds up-regulation in RL compared to WT plants, and that its target gene (Os06g0567900) was significantly down-regulated. miRNA164e, targeting NAC transcript factor genes, showing accumulation in RL that correlated with reduced expression of the target gene Os12g0610600. Taken together, our results supported the previous observation that rice embryogenic callus generated a unique set of miRNAs which regulated gene expression [58]. miRNAs have also been suggested to play a role in epigenetic modification. They have been found to be enriched around transposons and inverted repeat regions and their expression regulates DNA methylation at some specific locations [59].
The changes in gene expression, DNA methylation and small RNAs in the RL plants did not result in clear morphological changes with the WT donor plants under normal growth conditions, which is consistent with the previous report examining tissue culture-induced changes [9,60]. However, the genomic changes detected in the RL plants may be generated in the tissue culture process where plant cells are under endogenous or external stress. Interestingly, we observed clear phenotypic variation between the RL and WT donor plants under a number of abiotic stress conditions. This result suggests that tissue culture-induced genomic variations are biologically important for plants, particularly in stress responses.
Overall, we report gene expression, small RNA expression, and DNA methylation alteration following somaclonal variation in rice (cv. Hitomebore) and identified 24-nt siRNAs were significant decreased in RL compared with its donor WT, the reduced sRNA abundance coincides with the CHG and CHH hypo-methylation on transposable element Pong. miRNAs expression was changed following with tissue culture. Our results provided more information to understand the genetic and epigenetic alteration associated with somaclonal variation in rice.

Supplementary Materials

The following supporting information can be downloaded at: https://www.mdpi.com/article/10.3390/agronomy12071675/s1, Figure S1: Expression of retro-transposases in callus and seedling in WT and RL; Figure S2: The Southern blot results of transposable element pong in WT and RL; Figure S3: The distribution of 24-nt siRNAs across rice genome in WT and RL; Figure S4: The specific location of sRNA expression variation between WT and RL. The specific region detected by bisulfite sequencing were marked with blue column; Figure S5: The secondary structures of predict novel miRNAs; Table S1: List of primers for MSAP amplification; Table S2: List of genes and their primers for qRT-PCR; Table S3: List of differentially expressed known miRNAs; Table S4: The stem-loop structure of precursor RNA of the novel miRNAs in WT and RL; Table S5: Target genes of miRNAs; Table S6: A summary of miRNAs and their target genes expression.

Author Contributions

Data curation, N.W., Y.Y. and Z.Z.; methodology, D.Z. and H.X.; software, Z.W. and G.L.; writing—original draft preparation, N.W. and Y.Y.; writing—review and editing, B.L. and J.Z. All authors have read and agreed to the published version of the manuscript.

Funding

This article was supported by National Natural Science Foundation of China (No. 31400256), Jilin Agricultural University high level researcher grant (JAUHLRG20102006) and Jilin Provincial Department of Education research foundation (JJKH20220350KJ).

Institutional Review Board Statement

Not applicable.

Informed Consent Statement

Not applicable.

Data Availability Statement

Not applicable.

Acknowledgments

We would like to thank Ming-bo Wang (CSIRO Agriculture and Food, Australia) for excellent advice.

Conflicts of Interest

The authors declare no conflict of interest.

References

  1. Grafi, G.; Avivi, Y. Stem cells: A lesson from dedifferentiation. Trends Biotechnol. 2004, 22, 388–389. [Google Scholar] [CrossRef] [PubMed]
  2. Grafi, G.; Florentin, A.; Ransbotyn, V.; Morgenstern, Y. The stem cell state in plant development and in response to stress. Front. Plant. Sci. 2011, 2, 53. [Google Scholar] [CrossRef] [PubMed] [Green Version]
  3. Thorpe, T.A. History of plant tissue culture. Methods Mol. Biol. 2006, 318, 9–32. [Google Scholar] [CrossRef] [PubMed]
  4. Mcclintock, B. The significance of responses of the genome to challenge. Science 1984, 226, 792–801. [Google Scholar] [CrossRef] [PubMed] [Green Version]
  5. Polanco, C.; Ruiz, M.L. AFLP analysis of somaclonal variation in Arabidopsis thaliana regenerated plants. Plant. Sci. 2002, 162, 817–824. [Google Scholar] [CrossRef]
  6. Larkin, P.J.; Scowcroft, W.R. Somaclonal variation-a novel source of variability from cell cultures for plant improvement. Theor. Appl. Genet. 1981, 60, 197–214. [Google Scholar] [CrossRef] [PubMed]
  7. Johannes, F.; Porcher, E.; Teixeira, F.K.; Saliba-Colombani, V.; Simon, M.; Agier, N.; Bulski, A.; Albuisson, J.; Heredia, F.; Audigier, P.; et al. Assessing the impact of transgenerational epigenetic variation on complex traits. PLoS Genet. 2009, 5, e1000530. [Google Scholar] [CrossRef]
  8. Stroud, H.; Ding, B.; Simon, S.A.; Feng, S.; Bellizzi, M.; Pellegrini, M.; Wang, G.; Meyers, B.C.; Jacobsen, S.E. Plants regenerated from tissue culture contain stable epigenome changes in rice. eLife 2013, 2, e354. [Google Scholar] [CrossRef]
  9. Bednarek, P.T.; Orłowska, R.; Koebner, R.M.D.; Zimny, J. Quantification of the tissue-culture induced variation in barley (Hordeum vulgare L.). BMC Plant. Biol. 2007, 7, 10. [Google Scholar] [CrossRef] [Green Version]
  10. Jiang, C.; Mithani, A.; Gan, X.; Belfield, E.J.; Klingler, J.P.; Zhu, J.K.; Ragoussis, J.; Mott, R.; Harberd, N.P. Regenerant Arabidopsis lineages display a distinct genome-wide spectrum of mutations conferring variant phenotypes. Curr. Biol. 2011, 21, 1385–1390. [Google Scholar] [CrossRef] [Green Version]
  11. Sabot, F.; Picault, N.; El-Baidouri, M.; Llauro, C.; Chaparro, C.; Piegu, B.; Roulin, A.; Guiderdoni, E.; Delabastide, M.; McCombie, R.; et al. Transpositional landscape of the rice genome revealed by paired-end mapping of high-throughput re-sequencing data. Plant. J. 2011, 66, 241–246. [Google Scholar] [CrossRef]
  12. Neelakandan, A.K.; Wang, K. Recent progress in the understanding of tissue culture-induced genome level changes in plants and potential applications. Plant. Cell Rep. 2012, 31, 597–620. [Google Scholar] [CrossRef]
  13. Lin, W.; Xiao, X.; Zhang, H.; Li, Y.; Liu, S.; Sun, W.; Zhang, X.; Wu, Q. Whole-Genome Bisulfite Sequencing Reveals a Role for DNA Methylation in Variants from Callus Culture of Pineapple (Ananas comosus L.). Genes 2019, 10, 877. [Google Scholar] [CrossRef] [Green Version]
  14. Smith, A.M.; Hansey, C.N.; Kaeppler, S.M. TCUP: A Novel hAT Transposon Active in Maize Tissue Culture. Front. Plant. Sci. 2012, 3, 6. [Google Scholar] [CrossRef] [Green Version]
  15. Kaeppler, S.M.; Phillips, R.L. Tissue culture-induced DNA methylation variation in maize. Proc. Natl. Acad. Sci. USA 1993, 90, 8773–8776. [Google Scholar] [CrossRef] [Green Version]
  16. Kaeppler, S.M.; Kaeppler, H.F.; Rhee, Y. Epigenetic aspects of somaclonal variation in plants. Plant. Mol. Biol. 2000, 43, 179–188. [Google Scholar] [CrossRef]
  17. Rhee, Y.; Sekhon, R.S.; Chopra, S.; Kaeppler, S. Tissue culture-induced novel epialleles of a Myb transcription factor encoded by pericarp color1 in maize. Genetics 2010, 186, 843–855. [Google Scholar] [CrossRef] [Green Version]
  18. Miguel, C.; Marum, L. An epigenetic view of plant cells cultured in vitro: Somaclonal variation and beyond. J. Exp. Bot. 2011, 62, 3713–3725. [Google Scholar] [CrossRef] [Green Version]
  19. Law, J.A.; Jacobsen, S.E. Establishing, maintaining and modifying DNA methylation patterns in plants and animals. Nat. Rev. Genet. 2010, 11, 204–220. [Google Scholar] [CrossRef]
  20. Zhang, H.; Lang, Z.; Zhu, J. Dynamics and function of DNA methylation in plants. Nat. Rev. Mol. Cell Biol. 2018, 19, 489–506. [Google Scholar] [CrossRef]
  21. Hu, L.; Li, N.; Xu, C.; Zhong, S.; Lin, X.; Yang, J.; Zhou, T.; Yuliang, A.; Wu, Y.; Chen, Y.; et al. Mutation of a major CG methylase in rice causes genome-wide hypomethylation, dysregulated genome expression, and seedling lethality. Proc. Natl. Acad. Sci. USA 2014, 111, 10642–10647. [Google Scholar] [CrossRef] [Green Version]
  22. Aguilar-Cruz, A.; Grimanelli, D.; Haseloff, J.; Arteaga-Vázquez, M.A. DNA methylation in Marchantia polymorpha. New Phytol. 2019, 223, 575–581. [Google Scholar] [CrossRef] [Green Version]
  23. Matzke, M.A.; Mosher, R.A. RNA-directed DNA methylation: An epigenetic pathway of increasing complexity. Nat. Rev. Genet. 2014, 15, 394–408. [Google Scholar] [CrossRef]
  24. Wei, L.; Gu, L.; Song, X.; Cui, X.; Lu, Z.; Zhou, M.; Wang, L.; Hu, F.; Zhai, J.; Meyers, B.C.; et al. Dicer-like 3 produces transposable element-associated 24-nt siRNAs that control agricultural traits in rice. Proc. Natl. Acad. Sci. USA 2014, 111, 3877–3882. [Google Scholar] [CrossRef] [Green Version]
  25. Stroud, H.; Greenberg, M.V.C.; Feng, S.; Bernatavichute, Y.V.; Jacobsen, S.E. Comprehensive analysis of silencing mutants reveals complex regulation of the Arabidopsis methylome. Cell 2013, 152, 352–364. [Google Scholar] [CrossRef] [Green Version]
  26. Jiang, N.; Bao, Z.; Zhang, X.; Hirochika, H.; Eddy, S.R.; Mccouch, S.R.; Wessler, S.R. An active DNA transposon family in rice. Nature 2003, 421, 163–167. [Google Scholar] [CrossRef]
  27. Nakazaki, T.; Okumoto, Y.; Horibata, A.; Yamahira, S.; Teraishi, M.; Nishida, H.; Inoue, H.; Tanisaka, T. Mobilization of a transposon in the rice genome. Nature 2003, 421, 170–172. [Google Scholar] [CrossRef]
  28. Hu, L.; Li, N.; Zhang, Z.; Meng, X.; Dong, Q.; Xu, C.; Gong, L.; Liu, B. CG hypomethylation leads to complex changes in DNA methylation and transpositional burst of diverse transposable elements in callus cultures of rice. Plant. J. 2020, 101, 188–203. [Google Scholar] [CrossRef]
  29. Tanurdzic, M.; Vaughn, M.W.; Jiang, H.; Lee, T.; Slotkin, R.K.; Sosinski, B.; Thompson, W.F.; Doerge, R.W.; Martienssen, R.A. Epigenomic consequences of immortalized plant cell suspension culture. PLoS Biol. 2008, 6, 2880–2895. [Google Scholar] [CrossRef]
  30. Ramakrishnan, M.; Satish, L.; Kalendar, R.; Narayanan, M.; Kandasamy, S.; Sharma, A.; Emamverdian, A.; Wei, Q.; Zhou, M. The Dynamism of Transposon Methylation for Plant Development and Stress Adaptation. Int. J. Mol. Sci. 2021, 22, 11387. [Google Scholar] [CrossRef]
  31. Eamens, A.; Wang, M.; Smith, N.A.; Waterhouse, P.M. RNA silencing in plants: Yesterday, today, and tomorrow. Plant. Physiol. 2008, 147, 456–468. [Google Scholar] [CrossRef] [PubMed] [Green Version]
  32. Borges, F.; Martienssen, R.A. The expanding world of small RNAs in plants. Nat. Rev. Mol. Cell Biol. 2015, 16, 727–741. [Google Scholar] [CrossRef] [PubMed] [Green Version]
  33. Song, X.; Li, Y.; Cao, X.; Qi, Y. MicroRNAs and Their Regulatory Roles in Plant-Environment Interactions. Annu. Rev. Plant. Biol. 2019, 70, 489–525. [Google Scholar] [CrossRef] [PubMed]
  34. Luo, Y.; Zhou, H.; Li, Y.; Chen, J.; Yang, J.; Chen, Y.; Qu, L. Rice embryogenic calli express a unique set of microRNAs, suggesting regulatory roles of microRNAs in plant post-embryogenic development. FEBS Lett. 2006, 580, 5111–5116. [Google Scholar] [CrossRef] [Green Version]
  35. Li, H.; Zhang, Z.; Huang, F.; Chang, L.; Ma, Y. MicroRNA expression profiles in conventional and micropropagated strawberry (Fragaria × ananassa Duch.) plants. Plant. Cell Rep. 2009, 28, 891–902. [Google Scholar] [CrossRef]
  36. Cokus, S.J.; Feng, S.; Zhang, X.; Chen, Z.; Merriman, B.; Haudenschild, C.D.; Pradhan, S.; Nelson, S.F.; Pellegrini, M.; Jacobsen, S.E. Shotgun bisulphite sequencing of the Arabidopsis genome reveals DNA methylation patterning. Nature 2008, 452, 215–219. [Google Scholar] [CrossRef] [Green Version]
  37. Zhang, D.; Wang, Z.; Wang, N.; Gao, Y.; Liu, Y.; Wu, Y.; Bai, Y.; Zhang, Z.; Lin, X.; Dong, Y.; et al. Tissue culture-induced heritable genomic variation in rice, and their phenotypic implications. PLoS ONE 2014, 9, e96879. [Google Scholar] [CrossRef] [Green Version]
  38. Beckmann, J.S.; Osborn, T.C. Simple plant DNA isolation procedures. In Plant Genomes: Methods for Genetic and Physical Mapping; Springer: Dordrecht, The Netherlands, 1992; pp. 1–13. [Google Scholar] [CrossRef]
  39. Dong, Z.Y.; Wang, Y.M.; Zhang, Z.J.; Shen, Y.; Lin, X.Y.; Ou, X.F.; Han, F.P.; Liu, B. Extent and pattern of DNA methylation alteration in rice lines derived from introgressive hybridization of rice and Zizania latifolia Griseb. Theor. Appl. Genet. 2006, 113, 196–205. [Google Scholar] [CrossRef]
  40. Wang, X.; Wu, R.; Lin, X.; Bai, Y.; Song, C.; Yu, X.; Xu, C.; Zhao, N.; Dong, Y.; Liu, B. Tissue culture-induced genetic and epigenetic alterations in rice pure-lines, F1 hybrids and polyploids. BMC Plant. Biol. 2013, 13, 77. [Google Scholar] [CrossRef] [Green Version]
  41. Wang, N.; Zhang, D.; Wang, Z.; Xun, H.; Ma, J.; Wang, H.; Huang, W.; Liu, Y.; Lin, X.; Li, N.; et al. Mutation of the RDR1 gene caused genome-wide changes in gene expression, regional variation in small RNA clusters and localized alteration in DNA methylation in rice. BMC Plant. Biol. 2014, 14, 177. [Google Scholar] [CrossRef] [Green Version]
  42. Langmead, B.; Salzberg, S.L. Fast gapped-read alignment with Bowtie 2. Nat. Methods 2012, 9, 357–359. [Google Scholar] [CrossRef] [Green Version]
  43. Li, L.; Wang, X.; Xia, M.; Stolc, V.; Su, N.; Peng, Z.; Li, S.; Wang, J.; Wang, X.; Deng, X.W. Tiling microarray analysis of rice chromosome 10 to identify the transcriptome and relate its expression to chromosomal architecture. Genome Biol. 2005, 6, R52. [Google Scholar] [CrossRef] [Green Version]
  44. Chen, Y.; Zhang, M.; Jin, X.; Tao, H.; Wang, Y.; Peng, B.; Fu, C.; Yu, L. Transcriptional reprogramming strategies and miRNA-mediated regulation networks of Taxus media induced into callus cells from tissues. BMC Genom. 2020, 21, 168. [Google Scholar] [CrossRef] [Green Version]
  45. Zhao, N.; Zhang, K.; Wang, C.; Yan, H.; Liu, Y.; Xu, W.; Su, Z. Systematic Analysis of Differential H3K27me3 and H3K4me3 Deposition in Callus and Seedling Reveals the Epigenetic Regulatory Mechanisms Involved in Callus Formation in Rice. Front. Genet. 2020, 11, 766. [Google Scholar] [CrossRef]
  46. Zhang, H.; Guo, F.; Qi, P.; Huang, Y.; Xie, Y.; Xu, L.; Han, N.; Xu, L.; Bian, H. OsHDA710-Mediated Histone Deacetylation Regulates Callus Formation of Rice Mature Embryo. Plant. Cell Physiol. 2020, 61, 1646–1660. [Google Scholar] [CrossRef]
  47. Orłowska, R.; Machczyńska, J.; Oleszczuk, S.; Zimny, J.; Bednarek, P.T. DNA methylation changes and TE activity induced in tissue cultures of barley (Hordeum vulgare L.). J. Biol. Res. 2016, 23, 19. [Google Scholar] [CrossRef] [Green Version]
  48. Gulzar, B.; Mujib, A.; Malik, M.Q.; Sayeed, R.; Mamgain, J.; Ejaz, B. Genes, proteins and other networks regulating somatic embryogenesis in plants. J. Genet. Eng. Biotechnol. 2020, 18, 31. [Google Scholar] [CrossRef]
  49. Li, J.; Li, N.; Zhu, L.; Zhang, Z.; Li, X.; Wang, J.; Xun, H.; Zhao, J.; Wang, X.; Wang, T.; et al. Mutation of a major CG methylase alters genome-wide lncRNA expression in rice. G3 (Bethesda Md.) 2021, 11, jkab049. [Google Scholar] [CrossRef]
  50. Ngezahayo, F.; Xu, C.; Wang, H.; Jiang, L.; Pang, J.; Liu, B. Tissue culture-induced transpositional activity of mPing is correlated with cytosine methylation in rice. BMC Plant. Biol. 2009, 9, 91. [Google Scholar] [CrossRef] [Green Version]
  51. Zhang, S.; Zhou, J.; Han, S.; Yang, W.; Li, W.; Wei, H.; Li, X.; Qi, L. Four abiotic stress-induced miRNA families differentially regulated in the embryogenic and non-embryogenic callus tissues of Larix leptolepis. Biochem. Biophys. Res. Commun. 2010, 398, 355–360. [Google Scholar] [CrossRef]
  52. Barrera-Rojas, C.H.; Rocha, G.H.B.; Polverari, L.; Pinheiro Brito, D.A.; Batista, D.S.; Notini, M.M.; Da Cruz, A.C.F.; Morea, E.G.O.; Sabatini, S.; Otoni, W.C.; et al. miR156-targeted SPL10 controls Arabidopsis root meristem activity and root-derived de novo shoot regeneration via cytokinin responses. J. Exp. Bot. 2020, 71, 934–950. [Google Scholar] [CrossRef]
  53. Wang, M.; Masuta, C.; Smith, N.A.; Shimura, H. RNA silencing and plant viral diseases. Mol. Plant.-Microbe Interact. MPMI 2012, 25, 1275–1285. [Google Scholar] [CrossRef] [Green Version]
  54. Yang, X.; Kang, Y.; Liu, Y.; Shi, M.; Zhang, W.; Fan, Y.; Yao, Y.; Li, H.; Qin, S. Integrated analysis of miRNA-mRNA regulatory networks of potato (Solanum tuberosum L.) in response to cadmium stress. Ecotox. Environ. Saf. 2021, 224, 112682. [Google Scholar] [CrossRef]
  55. Yan, W.; Cao, S.; Wu, Y.; Ye, Z.; Zhang, C.; Yao, G.; Yu, J.; Yang, D.; Zhang, J. Integrated Analysis of Physiological, mRNA Sequencing, and miRNA Sequencing Data Reveals a Specific Mechanism for the Response to Continuous Cropping Obstacles in Pogostemon cablin Roots. Front. Plant. Sci. 2022, 13, 853110. [Google Scholar] [CrossRef]
  56. Luján-Soto, E.; Juárez-González, V.T.; Reyes, J.L.; Dinkova, T.D. MicroRNA Zma-miR528 Versatile Regulation on Target mRNAs during Maize Somatic Embryogenesis. Int. J. Mol. Sci. 2021, 22, 5310. [Google Scholar] [CrossRef] [PubMed]
  57. Wang, W.; Wang, J.; Wu, Y.; Li, D.; Allan, A.C.; Yin, X. Genome-wide analysis of coding and non-coding RNA reveals a conserved miR164-NAC regulatory pathway for fruit ripening. New Phytol. 2020, 225, 1618–1634. [Google Scholar] [CrossRef] [PubMed]
  58. Rodriguez-Enriquez, J.; Dickinson, H.G.; Grant-Downton, R.T. MicroRNA misregulation: An overlooked factor generating somaclonal variation? Trends Plant. Sci. 2011, 16, 242–248. [Google Scholar] [CrossRef] [PubMed]
  59. Wu, L.; Zhang, Q.; Zhou, H.; Ni, F.; Wu, X.; Qi, Y. Rice MicroRNA Effector Complexes and Targets. Plant. Cell. 2009, 21, 3421–3435. [Google Scholar] [CrossRef] [Green Version]
  60. Stelpflug, S.C.; Eichten, S.R.; Hermanson, P.J.; Springer, N.M.; Kaeppler, S.M. Consistent and heritable alterations of DNA methylation are induced by tissue culture in maize. Genetics 2014, 198, 209–218. [Google Scholar] [CrossRef] [Green Version]
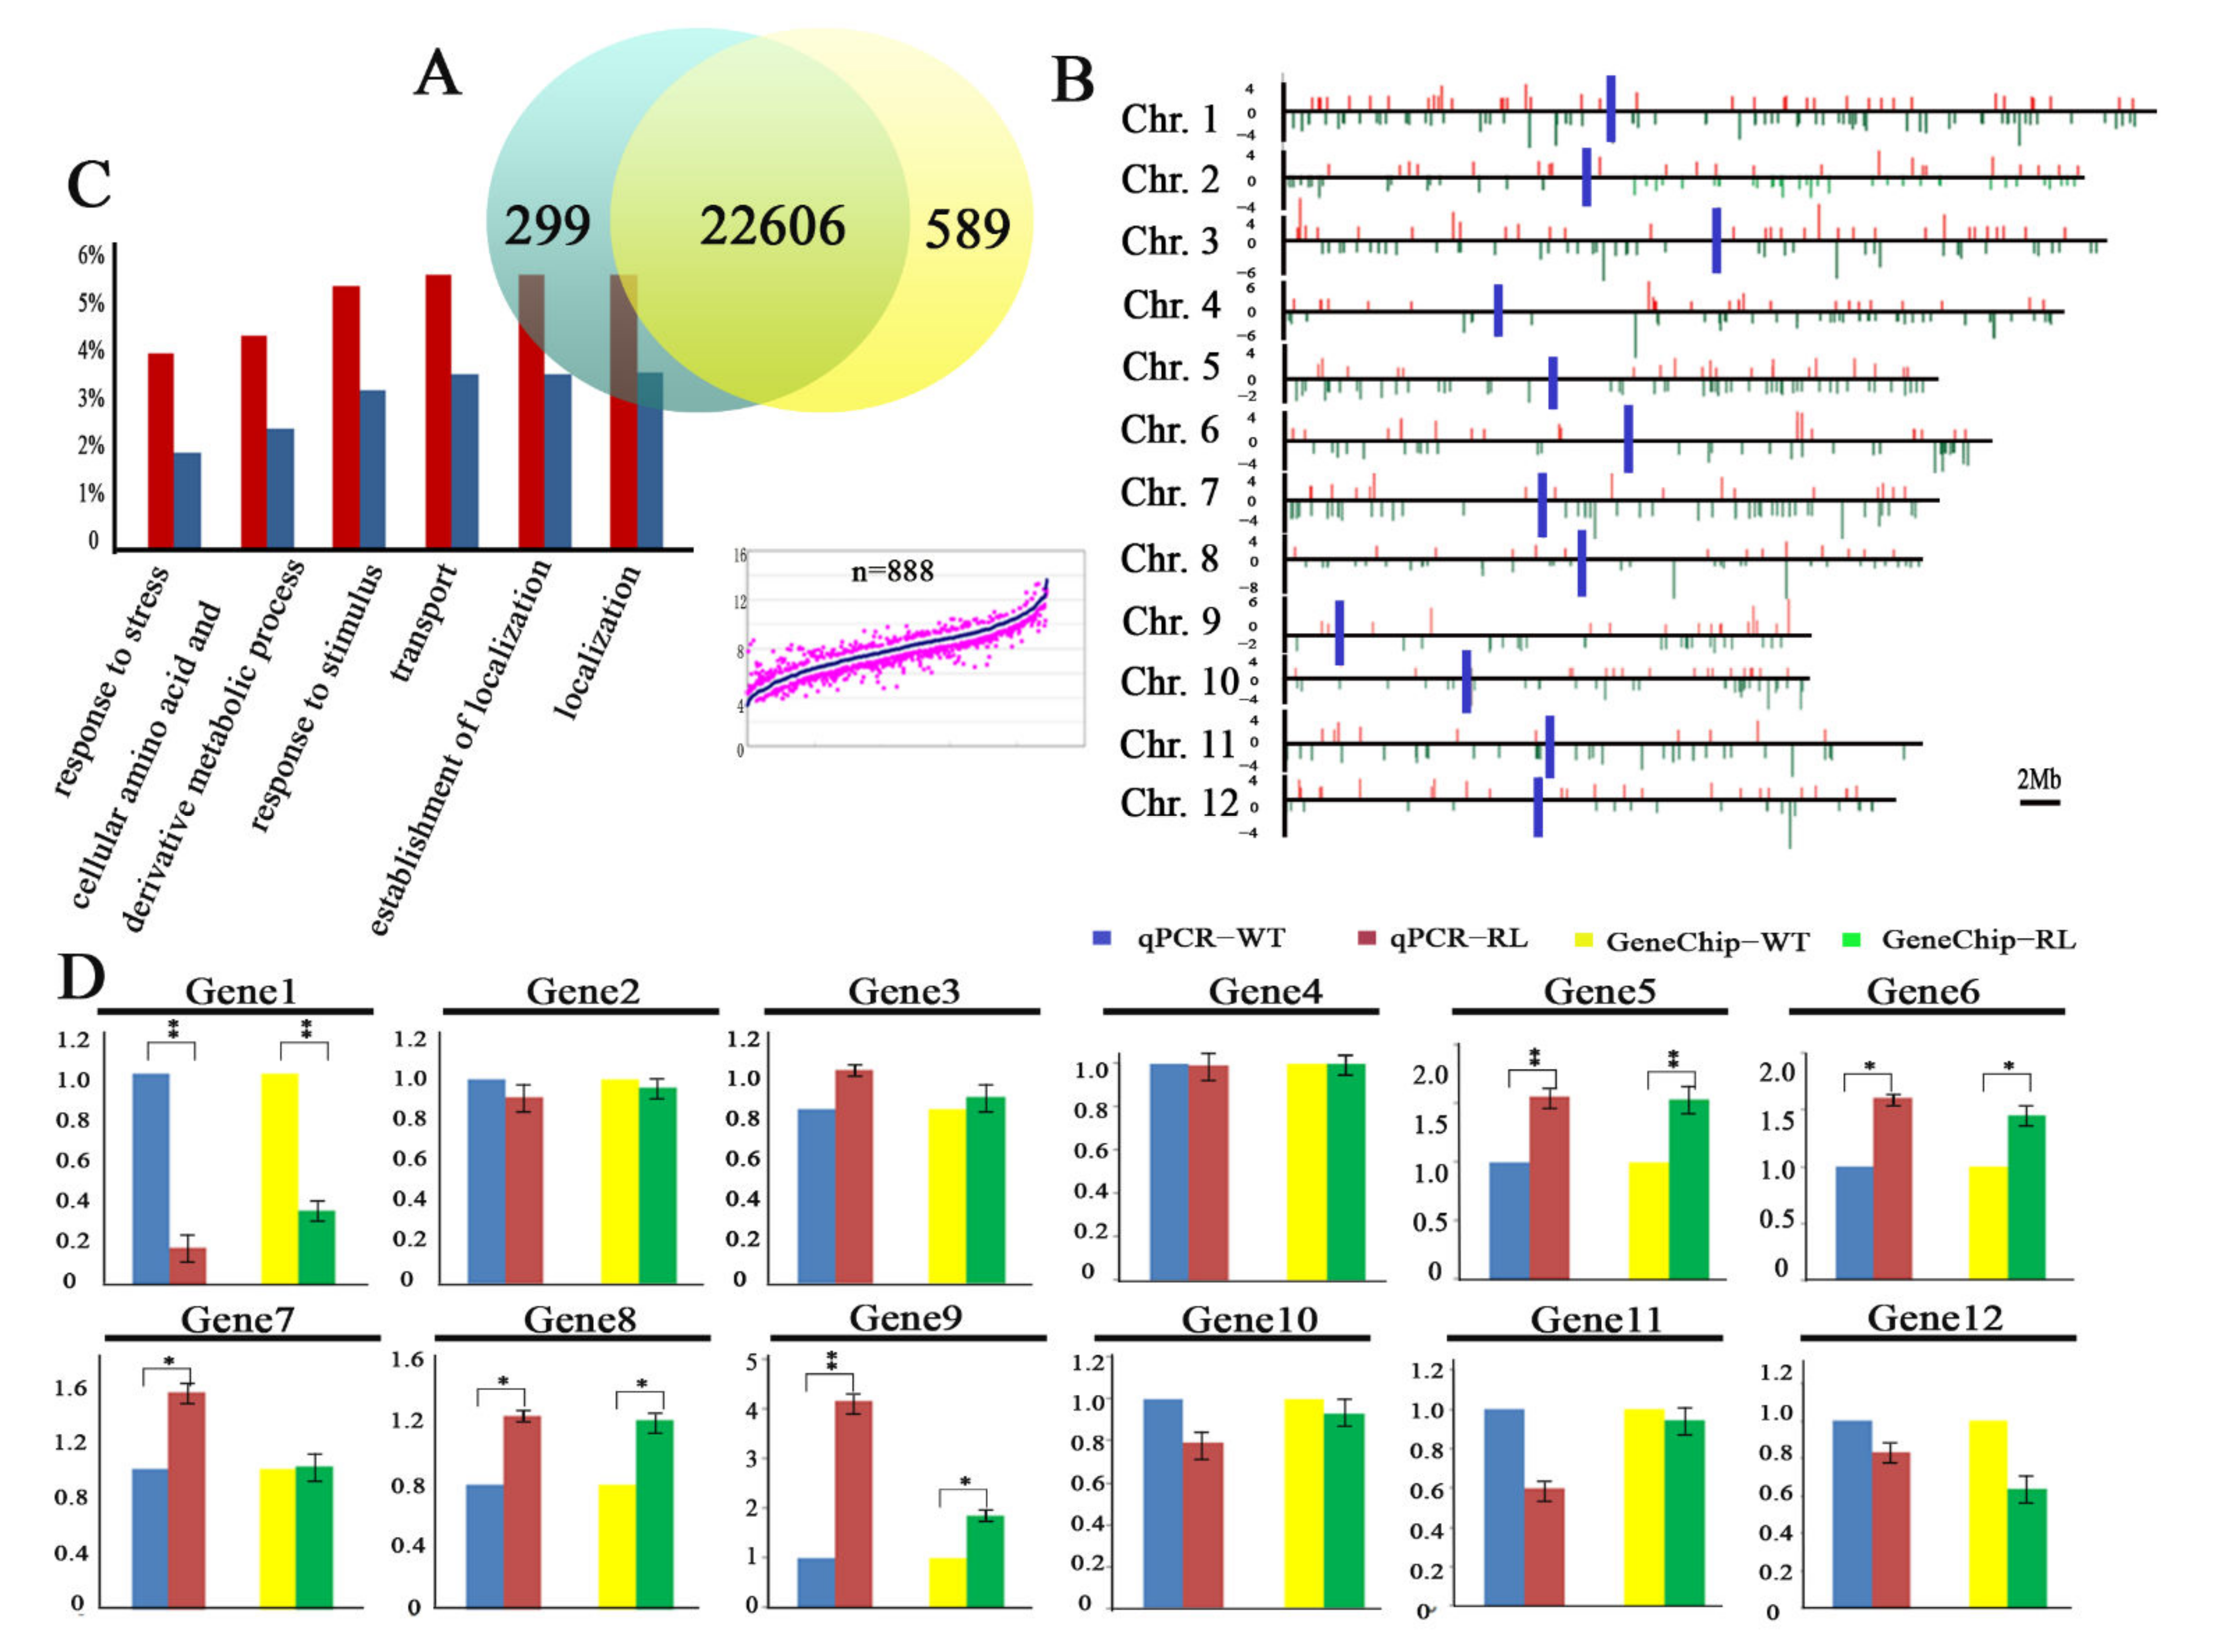
Figure 1. Genes expression variation between RL and its donor WT. (A) Microarray analysis identified 888 differential expressed genes induced by tissue culture, including 299 upregulated and 589 downregulated genes, respectively. (B) The distribution of differentially expressed genes across rice genome. The red bars represent upregulated genes and the green bars downregulated genes. The blue bar represented centromere region. (C) Gene Ontology (GO) classification and enrichment analysis of the differentially expressed genes between RL and WT. The distribution of differentially expressed genes across rice genome. The red bars represent upregulated genes and the green bars downregulated genes. The blue bar represented centromere region. (D) The expression of 12 genes was amplified by qRT-PCR for the verification of the microarray results. * p < 0.05, ** p < 0.01.
Agronomy 12 01675 g001
Figure 2. The analysis of DNA methylation variation comparison RL and its donor WT. (A) The results of 5′CCGG methylation levels in WT (WT-1 and WT-2) and RL (RL-1 and RL-2) by MSAP profiles, respectively. Ten plants were pooled for each line. (B) The frequency of hyper-/hypo-methylation alteration of CG and CHG in RL vs. WT. All lines were compared against WT1. (C) The sites of CG, CHG and CHH methylation around TEs and genes detected by locus-specific bisulfite sequencing in RT vs. WT. The red dots, blue dots and green dots represent CG, CHG and CHH methylation, respectively. (D) The transcript expression of Pong’s ORF2, Os06g0316000, Os07g0448100 and Os10g0452500 between RL and WT. ** p < 0.01.
Agronomy 12 01675 g002
Figure 3. Genome-wide small RNA expression alteration between RL and its donor WT. (A) Size distribution (18 nt–27 nt) of small RNAs in WT and RL. (B) Distribution of small RNA cluster variation between RL and WT across rice genome. x axis represents chromosome length, y axis represents the fold difference of RPM value (log value, base2). (C) The relative proportion of different categories of small RNAs in WT and RL. (D) Box plots showing the distribution of small RNA sequences (removed tRNA, rRNA, miRNA, snRNA and snoRNA) mapped to small/large TE region and their flank region (~10 kb) in RL and WT.
Agronomy 12 01675 g003
Figure 4. Differential expression of miRNAs between RL and its donor WT based on small RNA sequencing. (A) 44 miRNAs showed differential expression in RL vs. WT. The red dots represent up-regulated and green dots down-regulated. (B) Expression profiles of differentially expressed miRNA in WT and RL. (C) Nest-qRT-PCR verified variation of miRNA accumulation in WT and RL. * p < 0.05. (D) GO classification and enrichment analysis of putative target genes of the 44 differentially expressed miRNAs in WT and RL.
Agronomy 12 01675 g004
Figure 5. Phenotypic variation following between RL and its donor WT following different abiotic stress. Plant height, root length, and biomass were determined at seedling stage, heading stage, and maturity stage in WT and RL, respectively. * Cp < 0.05, ** Cp < 0.01.
Agronomy 12 01675 g005
Table 1. Summary of sRNAs in differentially accumulated sRNA clusters.
Source of sRNARLWT% Changes
(RL vs. WT)
rRNA1,370,1411,269,569+7.9%
snRNA11821759−32.8%
snoRNA69916242+12%
miRNA1,216,5501,510,997−19.5%
Repeat DNA1,677,1292,324,040−27.8%
Exon-sense892,763794,805+12.3%
Exon-antisense29,75135,949−17.2%
Intron-sense25,31433,277−23.9%
Intron-antisense20,77625,570−18.7%
unannotated3,379,7293,395,299
Publisher’s Note: MDPI stays neutral with regard to jurisdictional claims in published maps and institutional affiliations.