Article

Physical Clogging Characteristics of Labyrinth Emitters under Low-Quality (Sand-Laden Water) Irrigation

Key Laboratory of Agricultural Soil and Water Engineering in Arid Areas, Ministry of Education, Northwest A&F University, Xianyang 712100, China
*
Author to whom correspondence should be addressed.
Agronomy 2022, 12(7), 1615; https://doi.org/10.3390/agronomy12071615
Submission received: 8 June 2022 / Revised: 1 July 2022 / Accepted: 1 July 2022 / Published: 5 July 2022
(This article belongs to the Section Water Use and Irrigation)

Abstract

:
Drip irrigation technology has obvious advantages in solving the shortage of agricultural water. The demand for using low-quality water sources for irrigation is becoming urgent. Research on the physical blockage formation has become the main part of solving the emitter blockage in China. The purpose of this study is to investigate the blockage characteristics of the emitters in the drip irrigation system with a low-quality water source and to provide some basis for the anti-clogging measures. Therefore, we configured different concentrations (1.8 g/L, 2.8 g/L, 3.8 g/L) and different particle sizes (0–0.054 mm, 0.054–0.075 mm, 0.075–0.1 mm) of low-quality water sources and carried out drip irrigation tests. The holistic and local characteristics of the physical blockage occurrence and distribution were compared under the sand-laden water source irrigation, then the structure and element composition of the blockage material were analyzed. The results show that the clogging characteristics are related to the emitter types, sediment content, and sediment particle size. The higher sediment concentration means that the single emitter is more likely to be blocked completely, and the whole clogging development is short and quick. However, at lower sediment concentration treatments, the probability of complete clogging decreases, and the clogging process is uniform and slow. The blockage position of large flow channel emitters (E1) appears at the head and middle of the drip irrigation tape, and the internal blockage usually occurs at the inlet. The small size channel emitters (E2 and E3) are concentrated in the head and end of drip irrigation tape, and the internal blockage usually occurs in the low-speed zone of the labyrinth channel such as the inlet fence. The internal blocked material is the accumulation structure formed by sediment particles and the coupled precipitation aggregate formed by the reaction of various chemical ions. Among them, the mixing of large and small sediment particles is more inclined to form a stable blocking skeleton structure.

1. Introduction

As a water-saving irrigation technology, drip irrigation significantly improves water use efficiency [1], grain yield, and quality [2,3], and has obvious advantages in solving agricultural water shortage [4,5]. However, the blockage reduces the irrigation quality of drip irrigation projects, increases the maintenance cost, and shortens the service life of drip irrigation systems [6,7,8]. Emitter clogging can also lead to uneven water distribution in the soil and reduced crop yield [6,7]. Therefore, emitter clogging is the key restriction to the use of drip systems for low-quality water applications.
Existing studies have shown that to ensure stability and efficiency, irrigation systems are usually equipped with filters of 120 to 200 mesh [9,10,11]. Even after filtration, there are still particles smaller than 0.1 mm that get into the drip irrigation system. Due to the mixing of suspended solids in the labyrinth channel, the contact probability between particles increases [12], and the emitter is easily clogged [13,14]. In addition, some farmland along the Huanghe river (such as northwest China) mainly uses the Huanghe river as an irrigation water source [15] and the demand for irrigation with low-quality water sources becomes more urgent [16]. According to research, the study about physical blockage formation process has become the main part of emitter studies in China [2,10].
Many scholars have discussed and tested the possibility of low-quality water source irrigation. Irrigation sources including reservoir water sources [17,18], urban wastewater [19], sewage [20,21], recycle water [22,23], saline water [24], and brackish water [15] are mainly low-quality water sources with biochemical reactions and blockage, but there are few studies on physical clogging. The few studies mostly focus on the influence factors on clogging performance [25], sediment particle motion state [26], adaptive selection [27], and optimal design [28] of emitters. Wen [29] carried out periodic intermittent irrigation tests, studied the clogging influence process of sediment-water, compared the clogging degree, and proposed the structure coefficient index, but the research and discussion on the structure and component characteristics of the clogging material are not mentioned. The research on clogging characteristics of high sediment content water is not comprehensive. It is of great significance to study and discuss the clogging characteristics of emitters under sand-water source irrigation. This paper tested and analyzed the clogging performance and the main clogging composition under the sand-water irrigation to provide a theoretical basis for low-quality irrigation.
In addition, the composition of the suspended particles in water may lead to different degrees and forms of emitter blockage [13]. Moreover, the different shapes and surface charge of mineral particles may produce different sedimentation processes. Therefore, we selected quartz sand as the test sediment, which is similar to sand in chemical composition, particle shape, and surface charge. However, in the irrigation process of the sand water, the number, activity, and organic matter content of microorganisms are all at a low level [26]. Moreover, only a few microorganisms and organics may have a non-negligible influence on the blockage formation and growth [30], so microorganisms and extracellular polymers (EPS) can be temporarily ignored in the sedimentation and flocculation process of suspended solids.

2. Materials and Methods
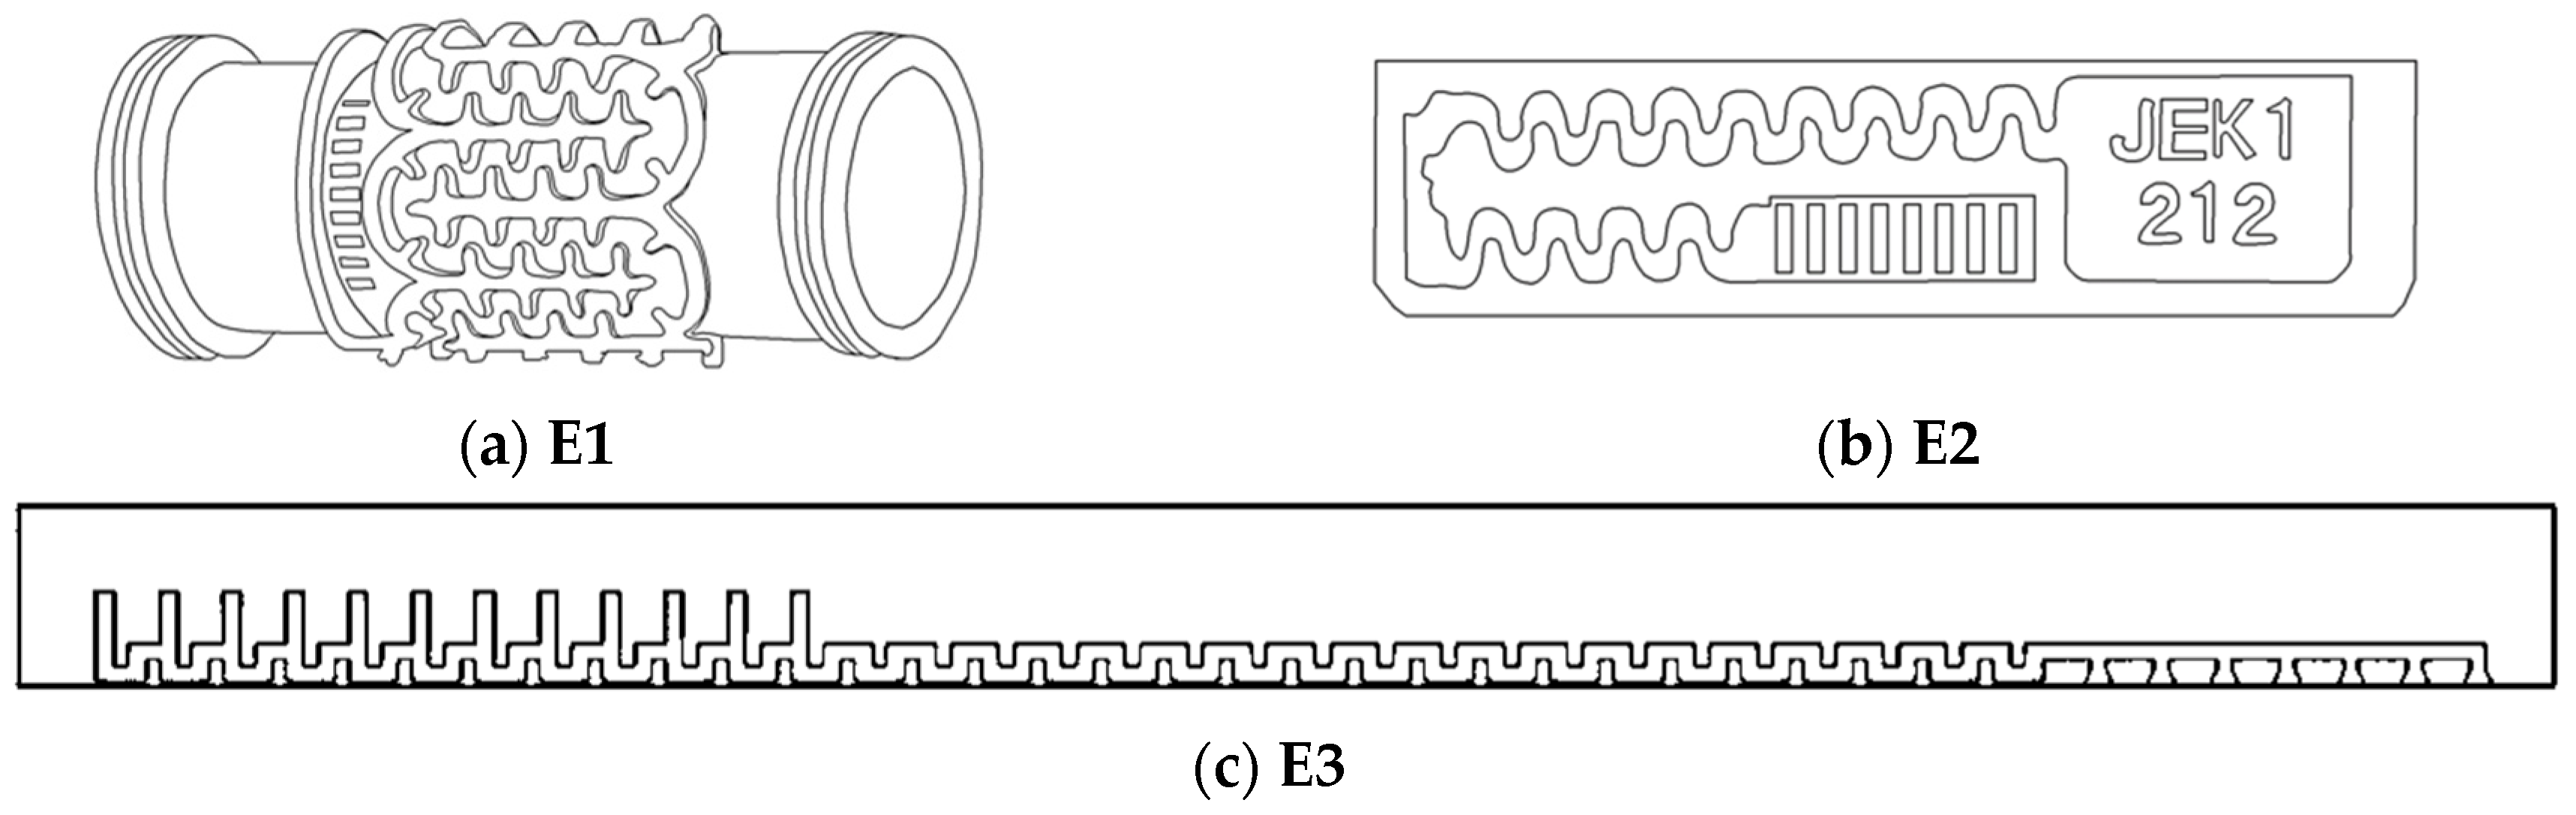
2.1. Emitters

Three non-pressure compensation emitters were selected. The structure schematic diagram of tested emitters is shown in Figure 1. Rated pressure and rated flow are given by the manufacturer, and all hydraulic performance indexes (Table 1) are determined according to the specification (GB/T 17187-2009).

2.2. Irrigation Source

Due to the large amount of sand required, and the pure composition of quartz sand (more than 98% silica), it is more conducive to analyze the clogging process and reduce the interference caused by other substances. Therefore, the tested sand was selected as the sifted quartz sand particles (hereinafter referred to as the sand), and the particle size of the sand was 0–0.054 mm (a), 0.054–0.075 mm (b), and 0.075–0.1 mm (c), respectively. The sand is divided into three gradations into pairs according to different mass percentages (Table 2), and the clogging degree under different gradations is tested. Yangling tap water was selected for the test, and the components and ions in the water were from the water quality inspection report of Yangling District in 2021, as shown in Table 3.

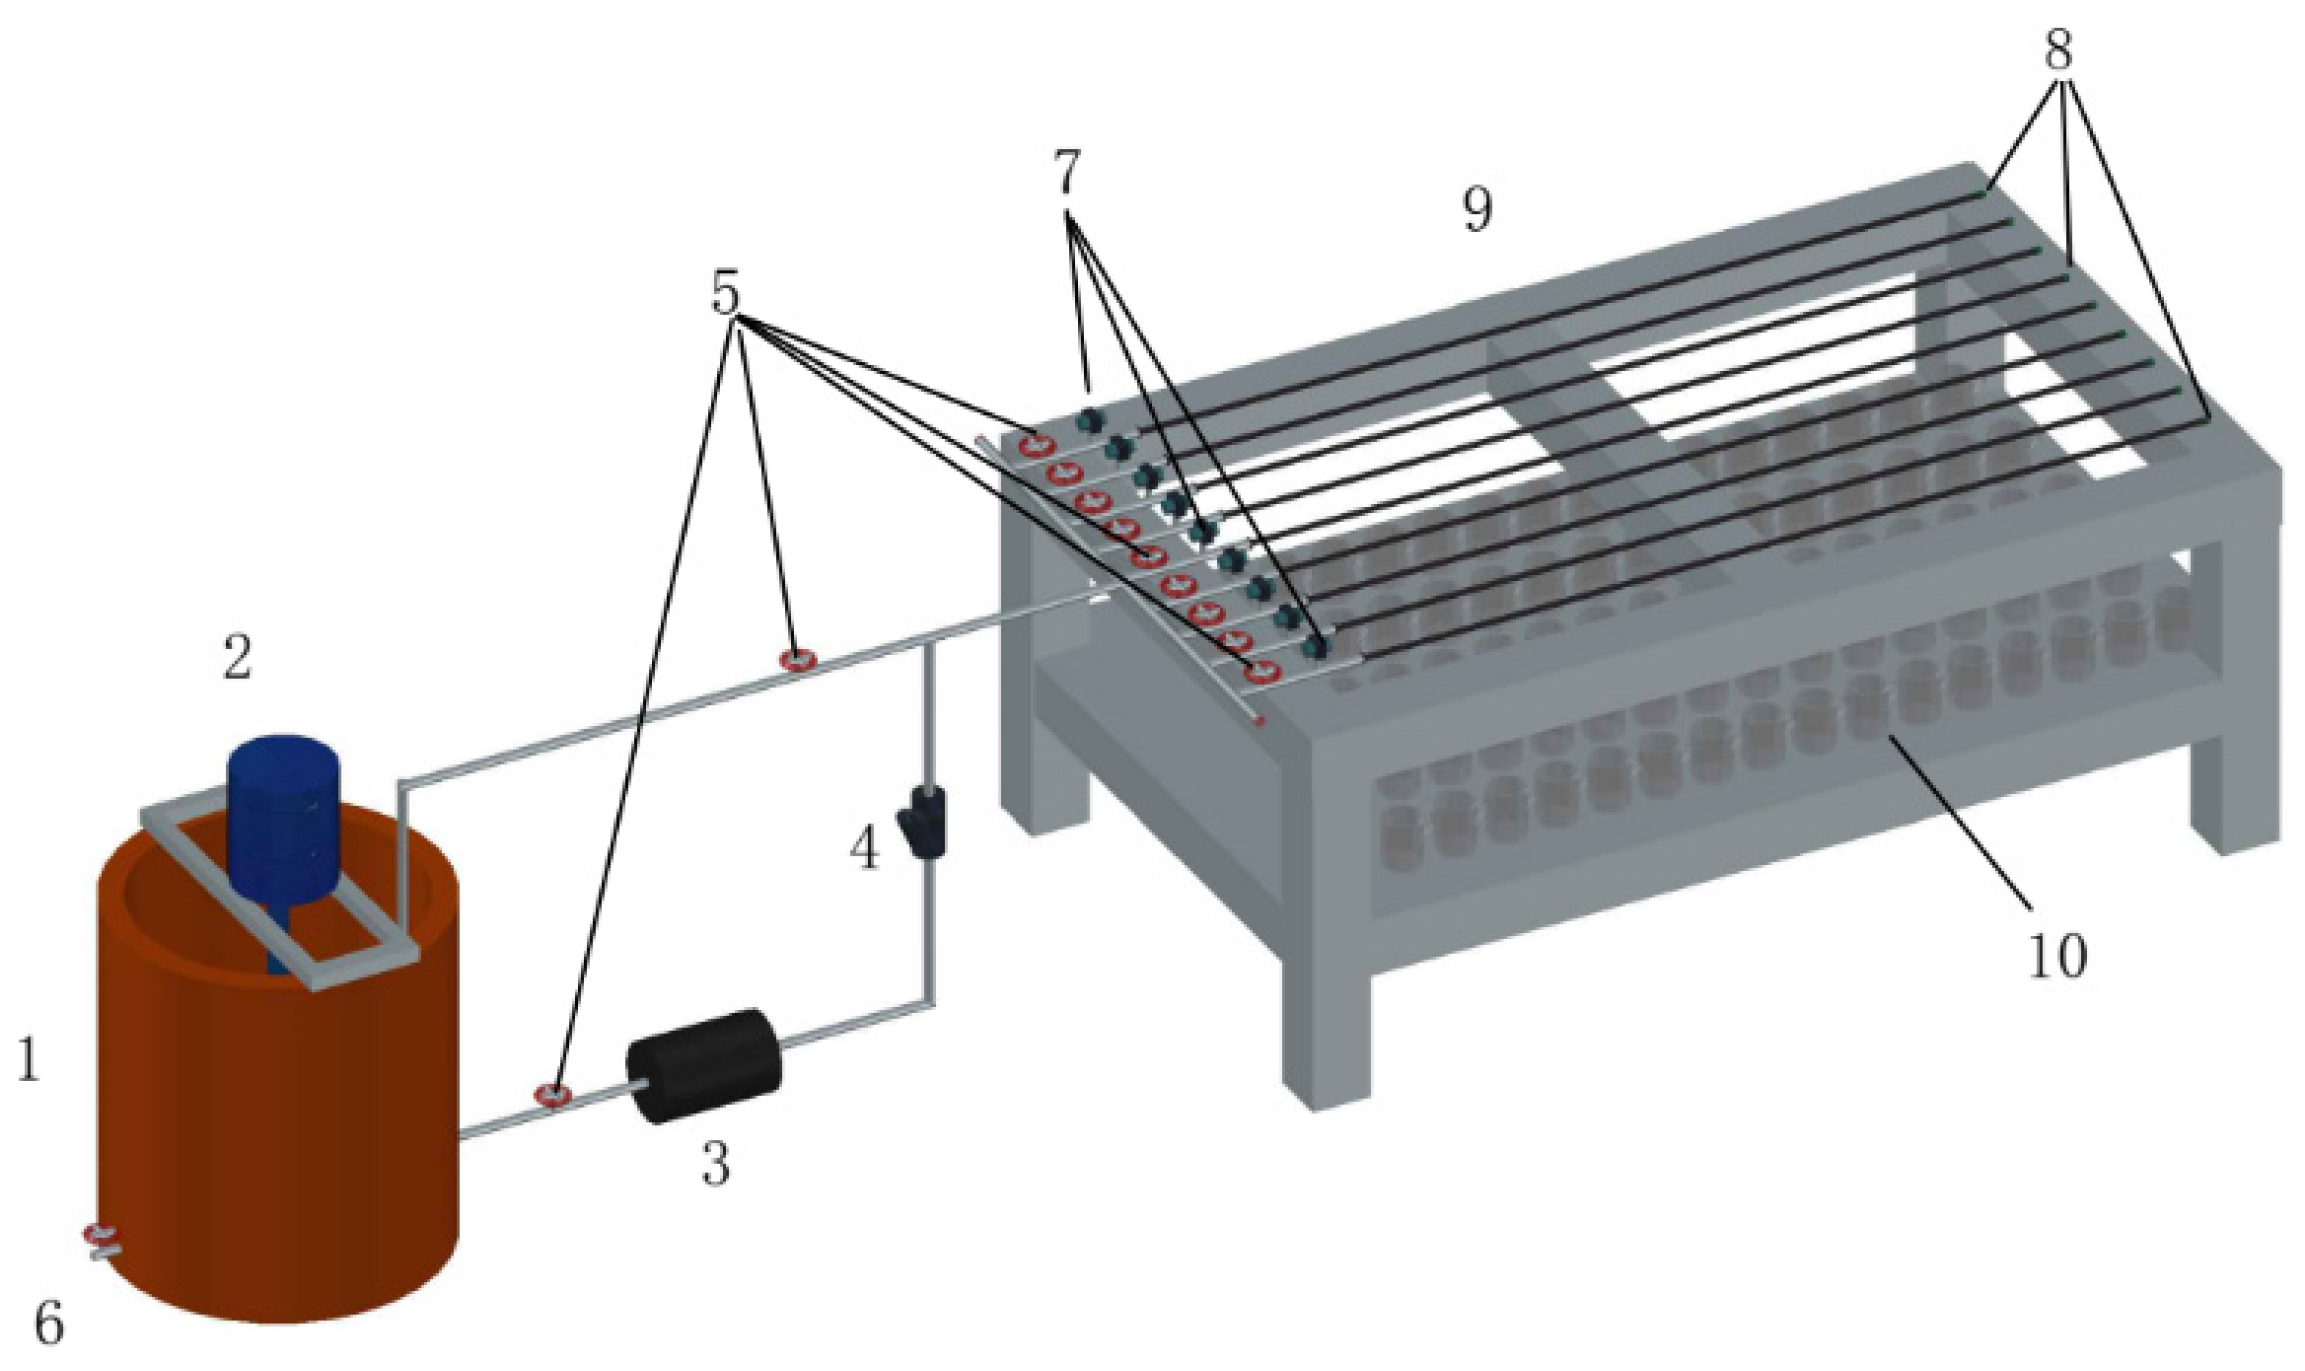
2.3. System Layout and Test Design

The layout of the indoor irrigation test system is shown in Figure 2. The experiment was a short-cycle simulation experiment, using the intermittent muddy water drip irrigation method. The irrigation event occurred twice a day for 2 h each time, and each treatment was repeated twice. The irrigation cycle duration of each test (excluding the repeated test) was 20 days. The water temperature was measured by an industrial-grade temperature thermometer (range −30 °C to 100 °C, accuracy 0.1 °C) before the irrigation event. When the number of irrigation events reaches 40 times or the relative average flow is less than 75% (ISO/TC 23/SC 18/WG5 N4), it is regarded as the signal to stop irrigation. After each treatment, the pipes were cleaned, and the drip irrigation tapes were replaced.

2.4. Flow Measurement and Clogging Matter Sampling

The flow rate was measured by the weighing method. When the irrigation event is carried out for 1 h 50 min, the plastic measuring cup is placed under each emitter for 10 min after ensuring that the working pressure of the test system is stable at this stage. We measured the water weight within 10 min and converted it to the emitter flow (L/h). The flow measured in the test was corrected by the temperature difference formula [22].
After irrigation, the sediment in emitters was sampled and tested. All emitters were removed from the drip irrigation tape, collected, and numbered. The selected emitters were stored in a zip-lock bag for later use and dried, and thereafter the emitters were peeled to observe the surface topography using field-emission scanning electronic microscopy (FSEM) at a magnification of 200–1000×. The sediment fouling was stripped using an ultrasonic cleaning machine (model: KQ-600KDE; manufacturer: Kunshan Shumei, Jiangsu, China; working power: 600 kW; oscillation frequency: 100 Hz). The dry weight (DW) was weighed using a high-precision electronic balance (accuracy: 10−3 g).

2.5. Evaluation Index and Determination Method

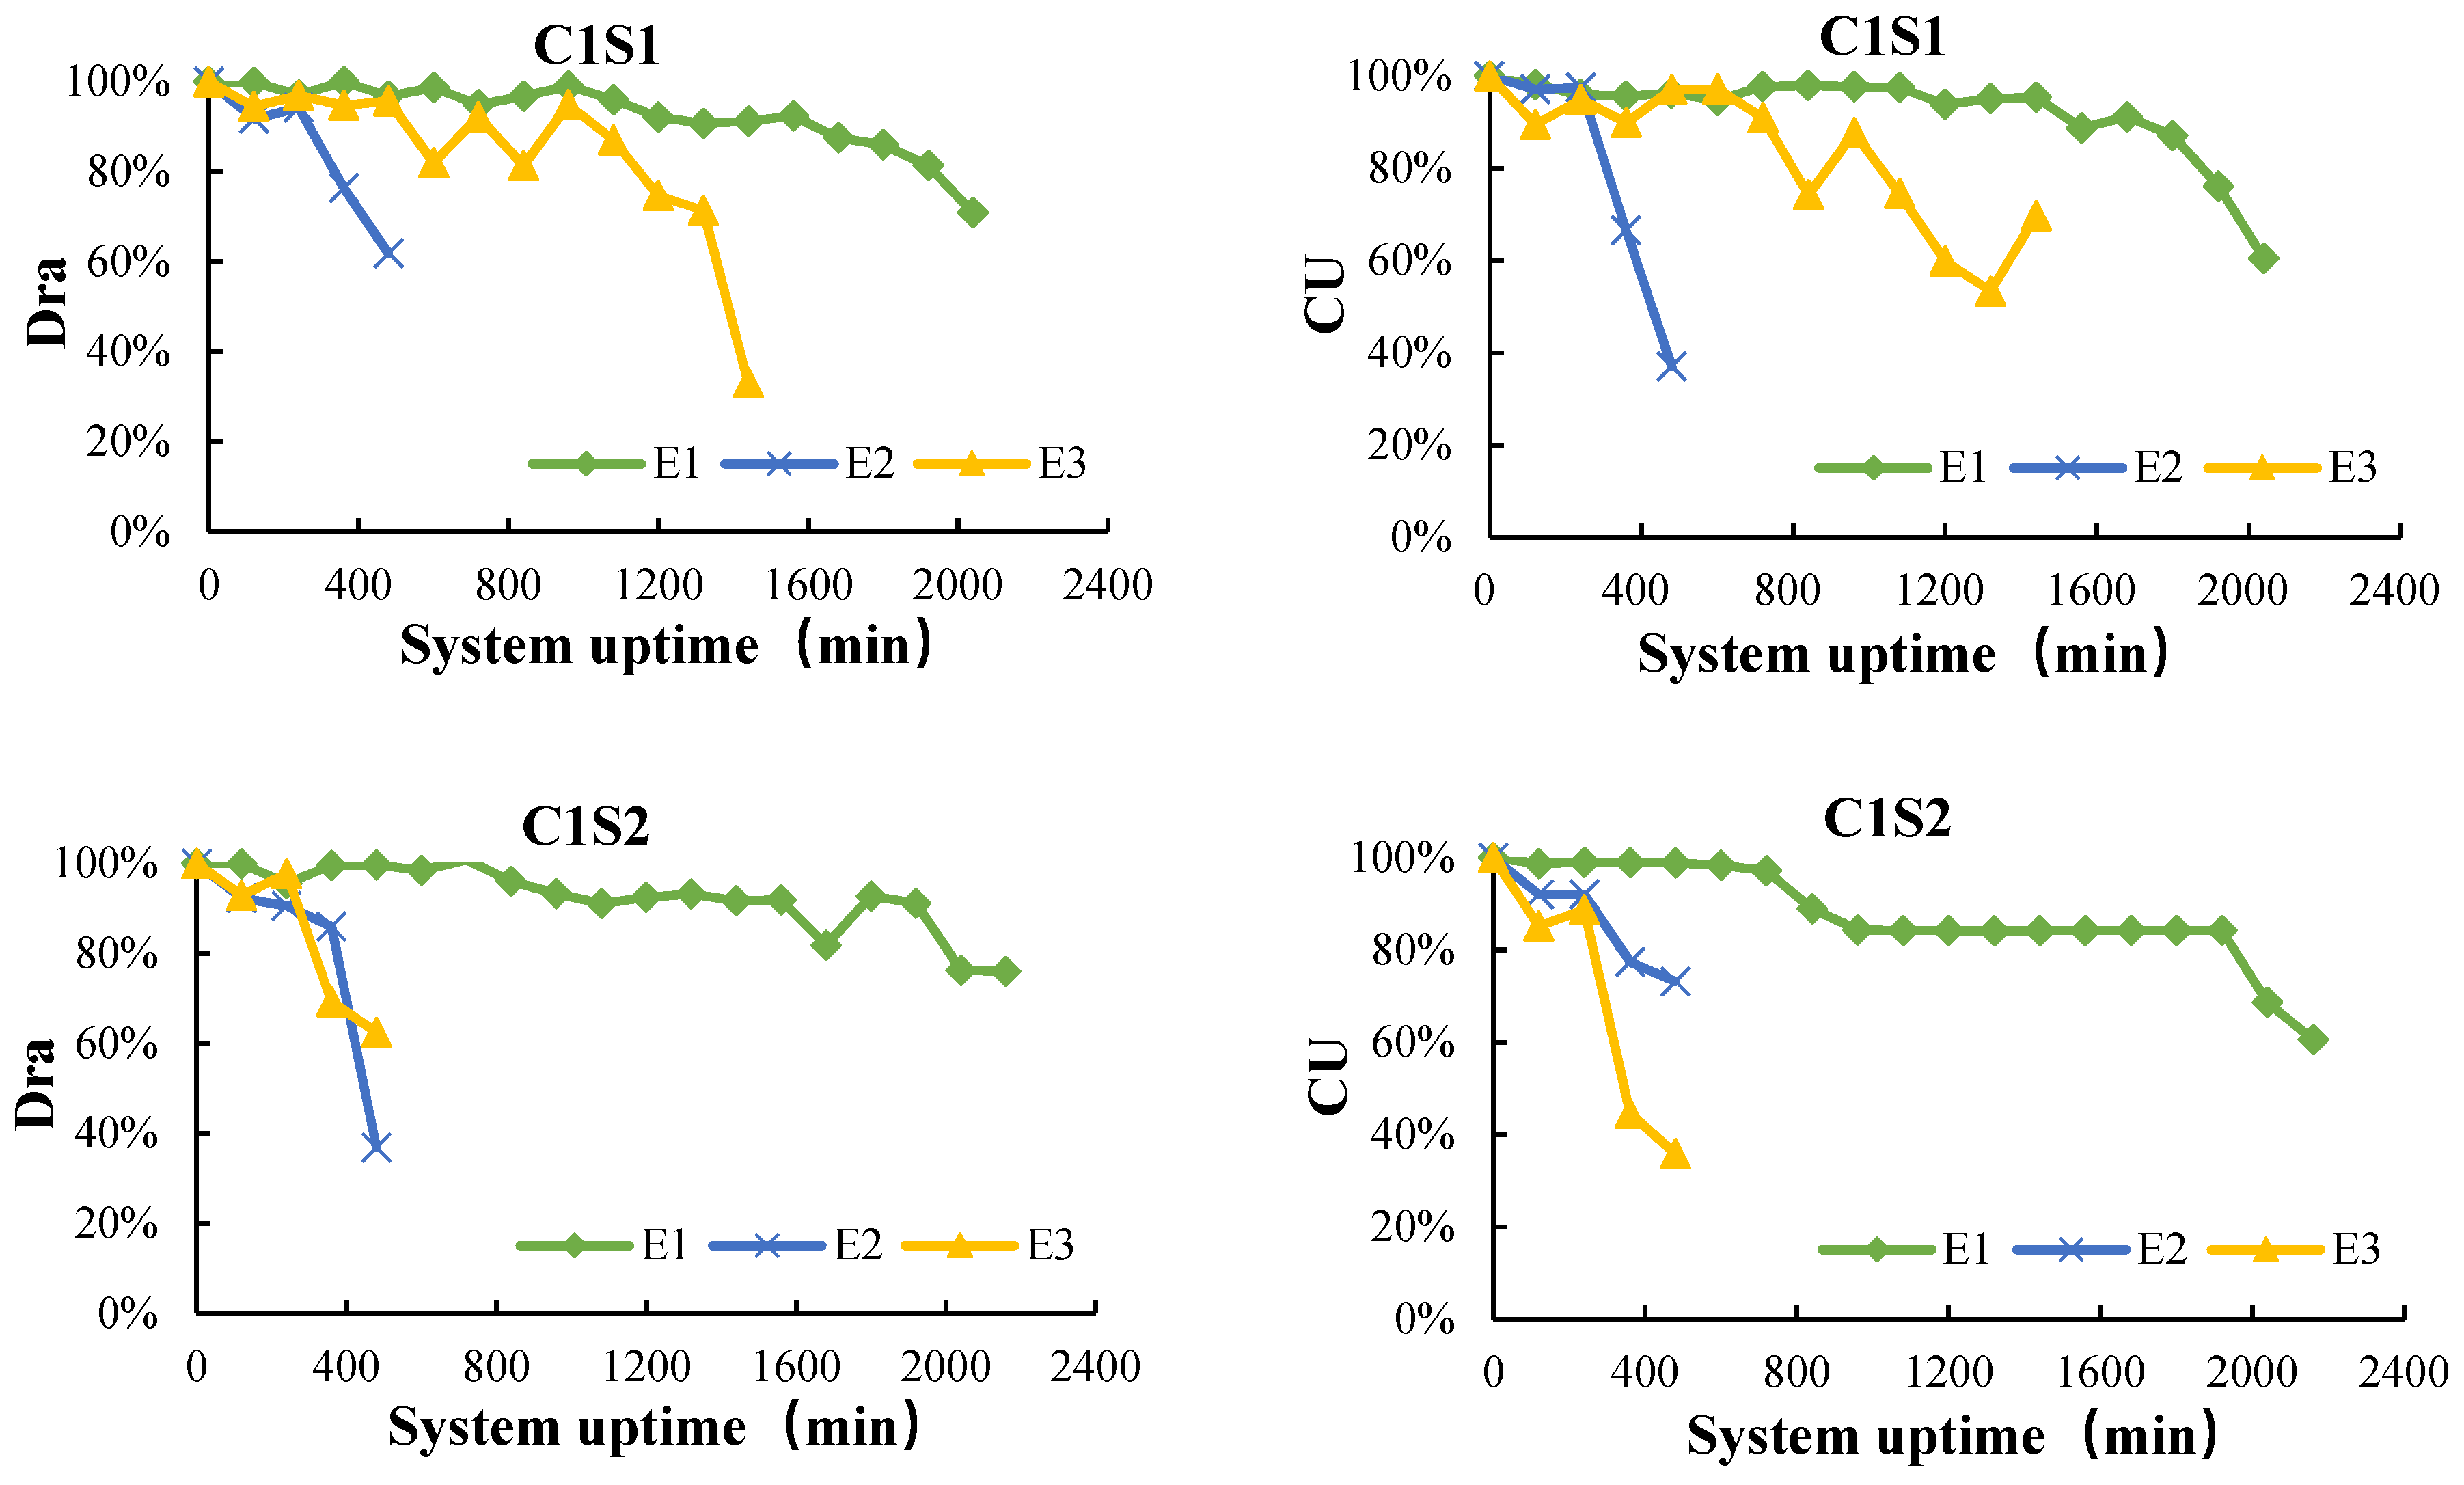
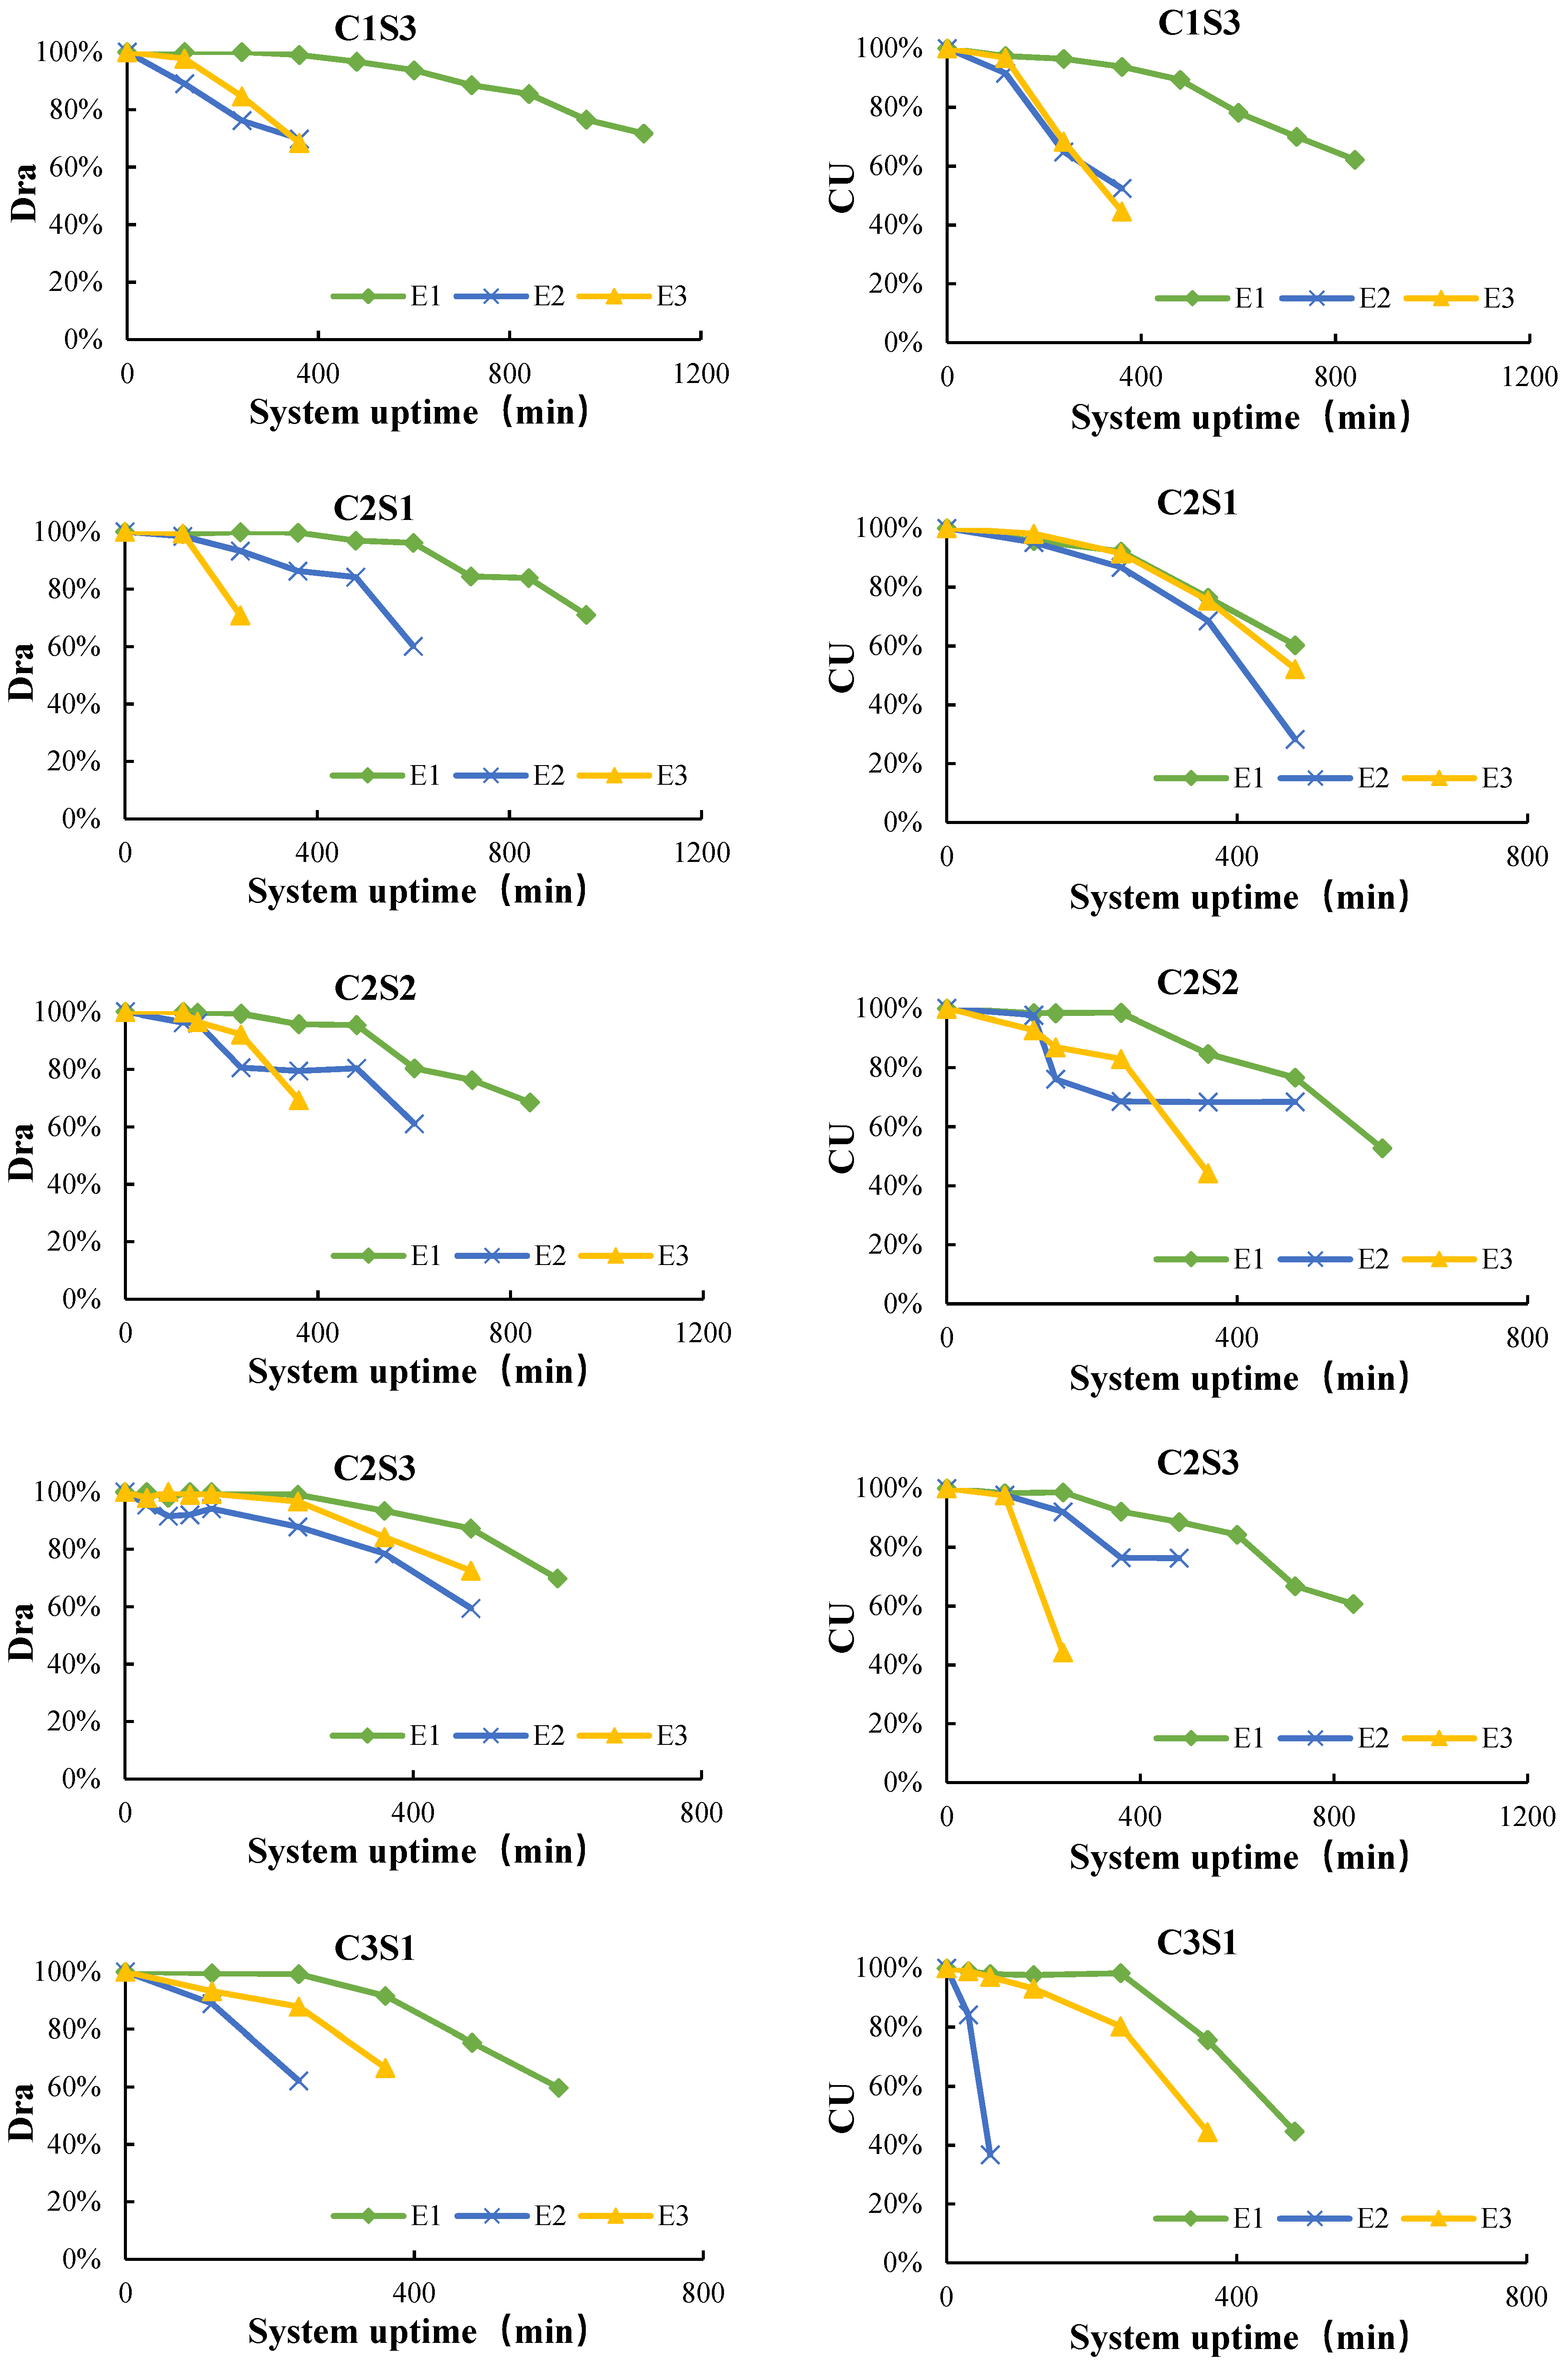
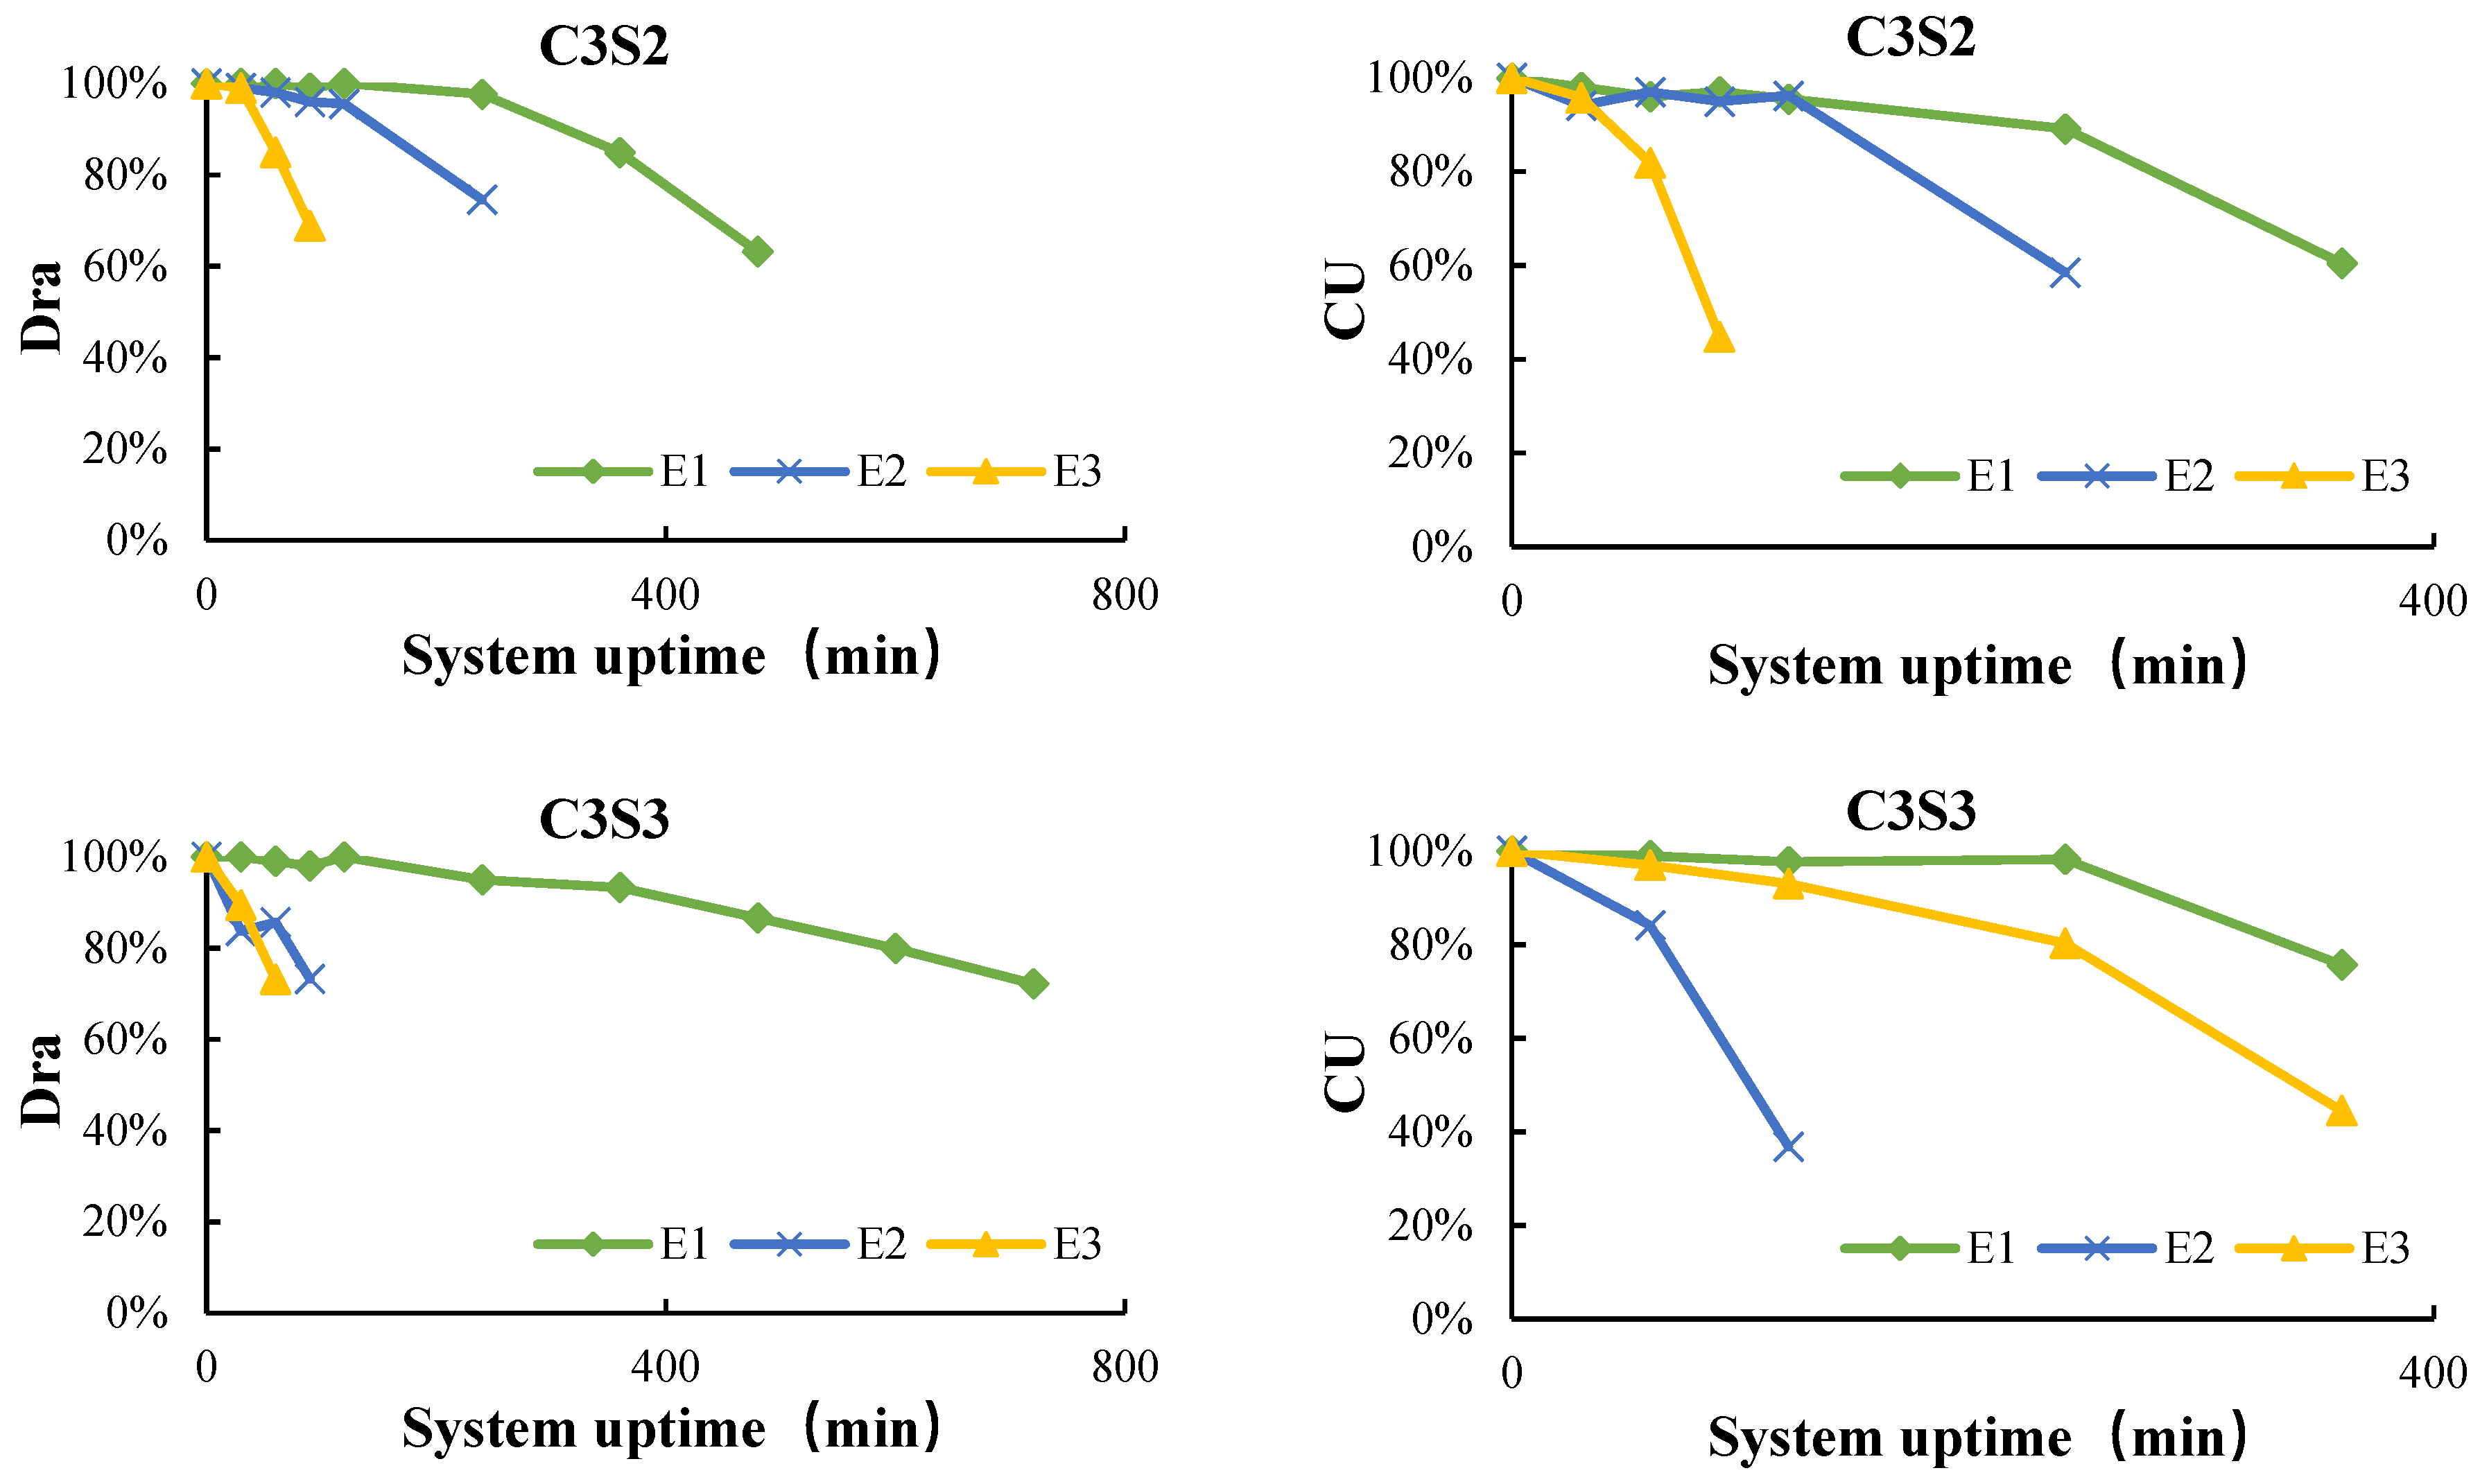
2.5.1. Relative Average Discharge

To reduce the error caused by pressure fluctuation in the test process, the percentage of the average flow to the rated flow was defined as the average relative flow (Dra) of the emitter.
Dra = i = 1 n q i n / q c
where Dra is the relative average flow of the emitter, %; qc is the rated flow calculated according to the pressure–flow relationship curve, and L/h; qi is the flow of each drip irrigation tape, L/h.

2.5.2. Christiansen Uniformity

Cu = 1 Δ q ¯ q ¯ Δ q ¯ = i = 1 n | q i q ¯ | n q ¯ = i = 1 n q i n
where, Δ q ¯ is the average deviation of flow, L/h; q ¯ is the average flow rate, and L/h; qi is the flow rate, L/h. In actual field irrigation, the irrigation uniformity coefficient Cu should not be less than 0.8 (GB/T 17187-2009).

3. Results and Analysis

3.1. Physical Blockage Occurrence

3.1.1. Whole Blockage Occurrence

Figure 3 shows the Dra and CU during the drip irrigation system operation. As can be seen from the figure, the clogging characteristics of emitters are related to their types, sand concentration, and particle size. The Dra and CU of E1, E2, and E3 decreased gradually during operation and had a worse trend with the increase of sand concentration and particle size. At the beginning of the system operation, the Dra of the emitters fluctuates around the rated flow and gradually decreases.
In the C1 treatments, the Dra and CU of the emitters showed a trend of slow decline, and the decline of CU was more obvious than that of Dra. The Dra of E1 decreased slowly with a small range, while that of E2 and E3 decreased rapidly with a large range. Under C1S3 treatment, the Dra of E2 and E3 decreased by 31% and 32%, and the CU decreased by 48% and 56%, respectively, until 400 min. However, the Dra of E1 was 98% and the CU was 93%, both of which remain in a safe state.
With the deterioration of the sand-water source, the blockage became more serious, and the service life of the emitters was shortened. Particularly, the blockage of E2 and E3 showed a short and sudden trend, which was more obvious under C3S3 treatment. The Dra of E2 and E3 reached 73% when the system ran 360 min and 240 min, respectively, which was lower than the drip irrigation system standard requirement. From the Dra and CU, the operation condition of E1 was better than the other two. In addition, the Dra of emitters fluctuated and decreased because of “the blockage recoverability”. After blockage was formed in the internal channel of the emitters, the channel section would be closed, which would lead to an increase in local water pressure and the flow rate. It was easy to destroy and erode the blockage structure that was formed. As the system ran, more sediment settled, and new clogs formed. Thus, the flow rate fluctuated up and down, which was especially obvious in the Dra change of E3. This phenomenon could also be observed in the clogging characteristics of a single emitter. Under C1S1 treatment, the head emitters were blocked, and then the flow sudden growth occurred in the middle emitters, which was also caused by the above reason.

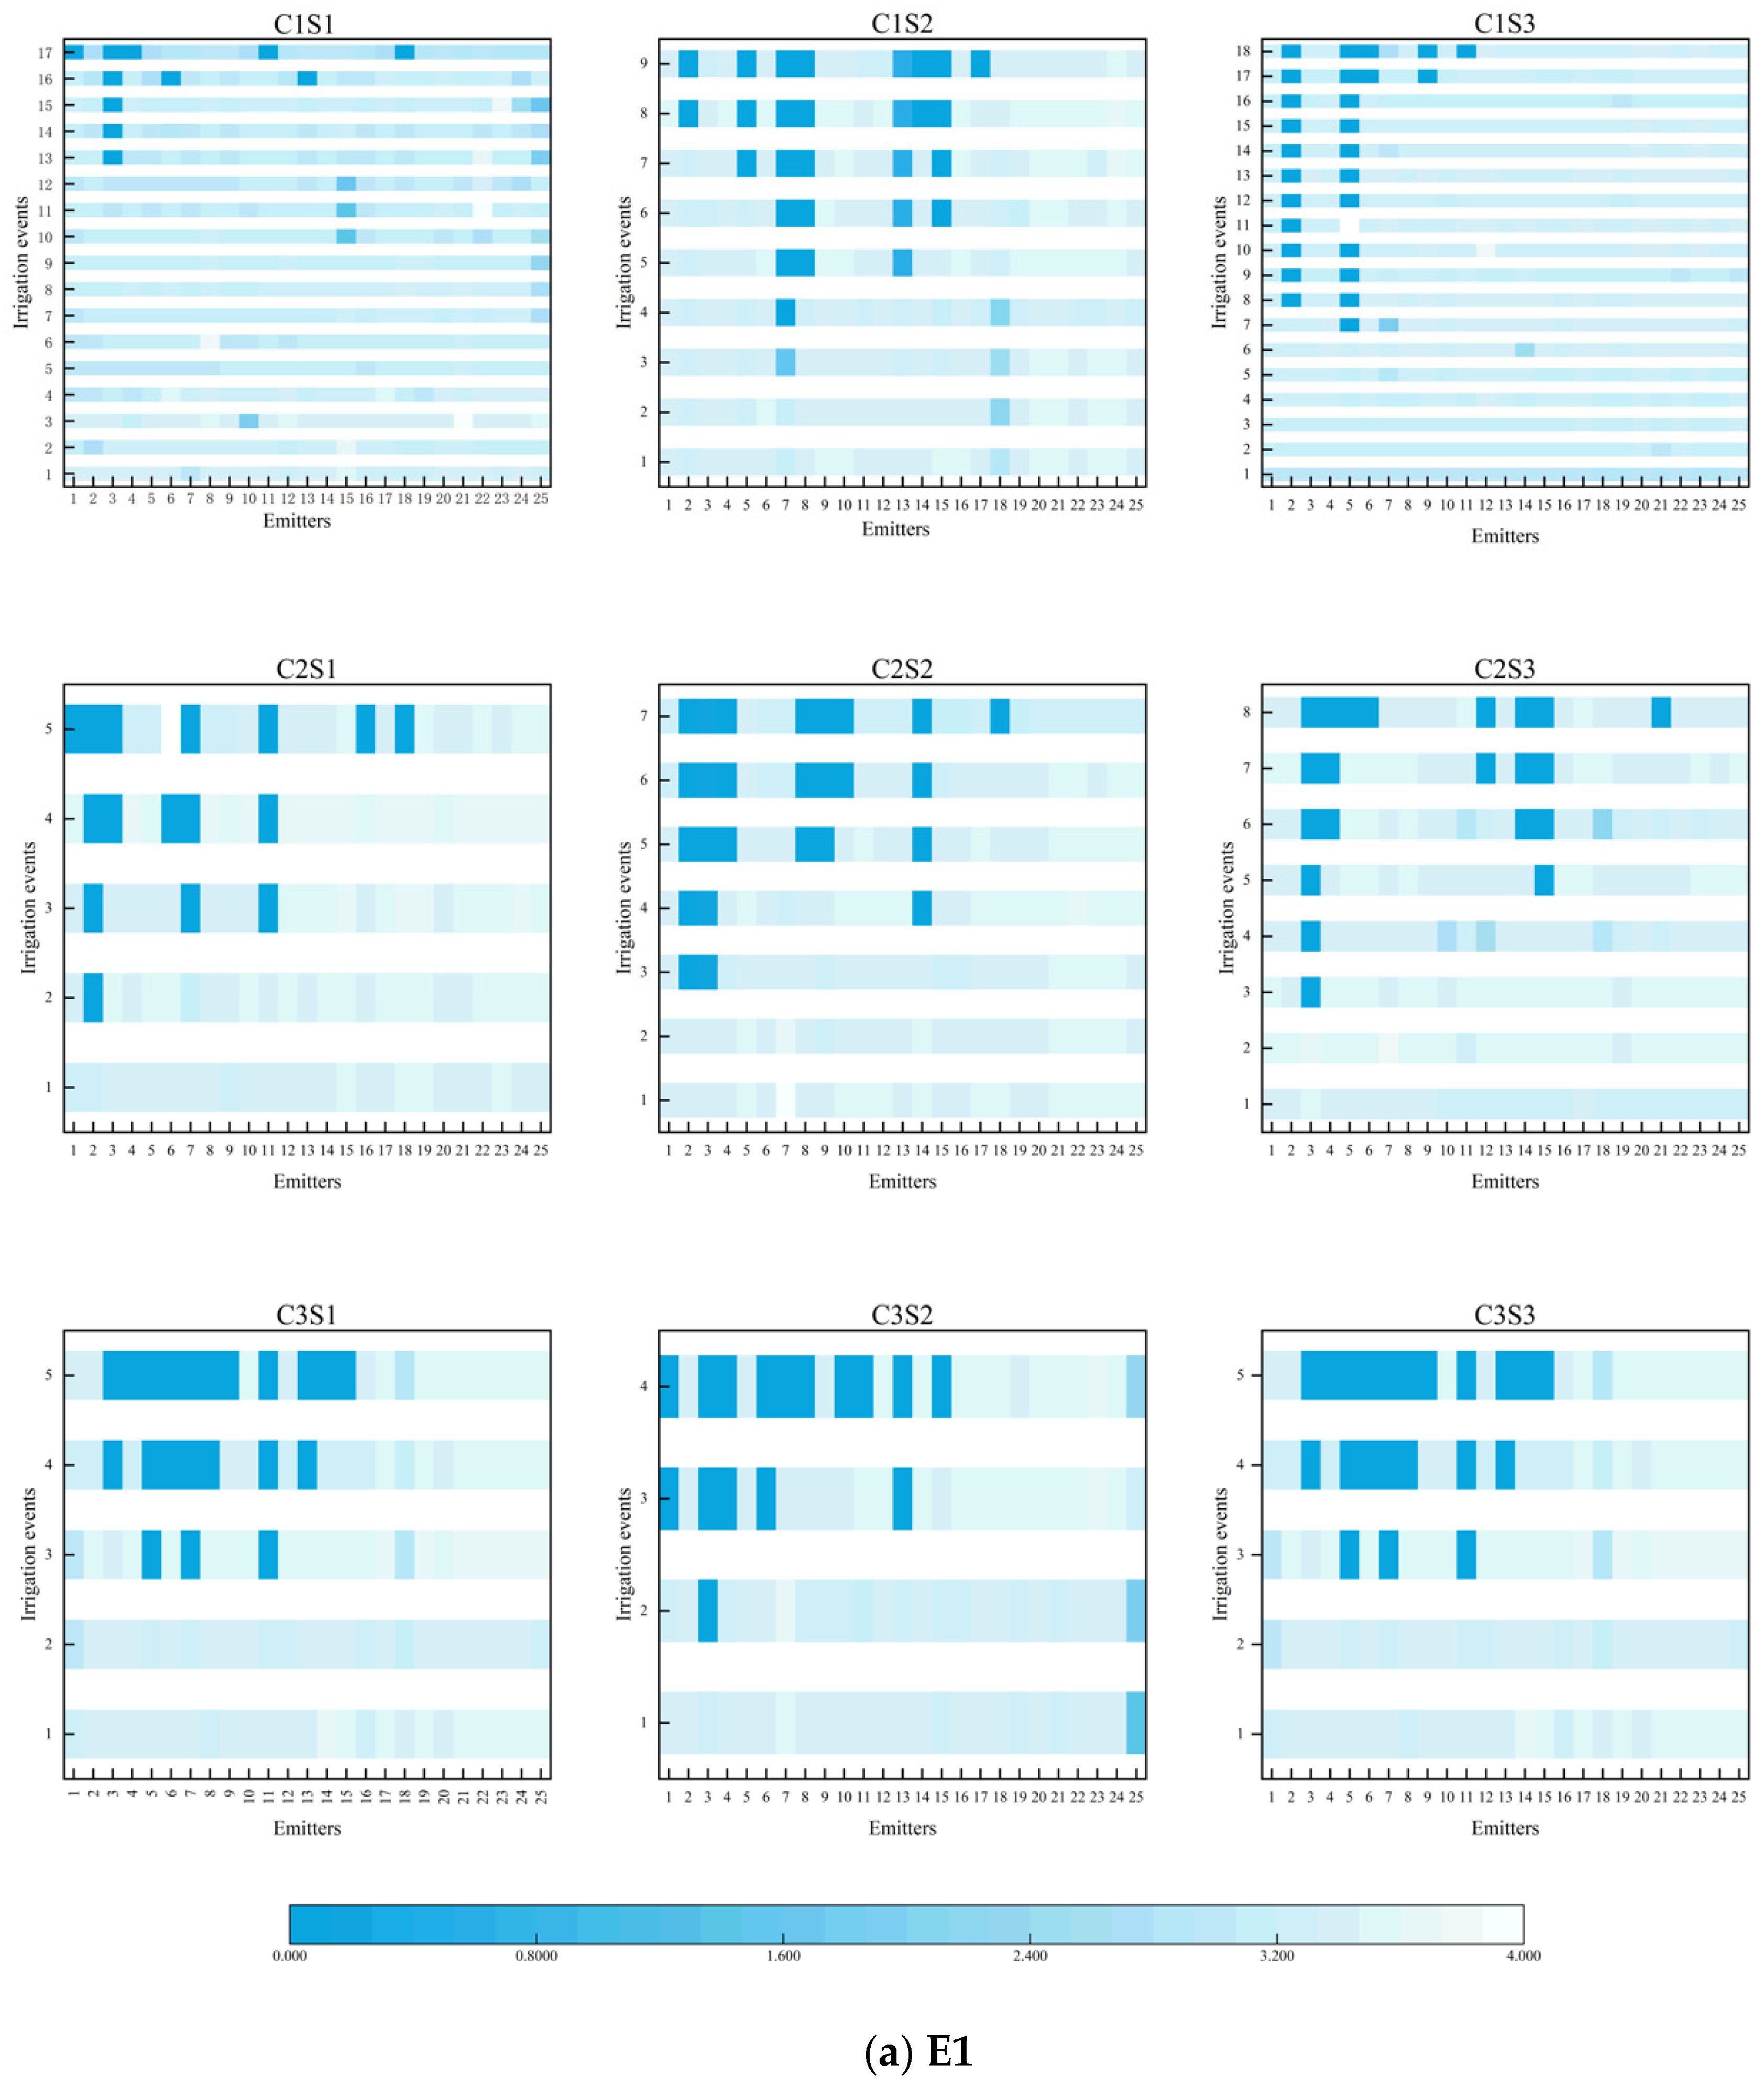
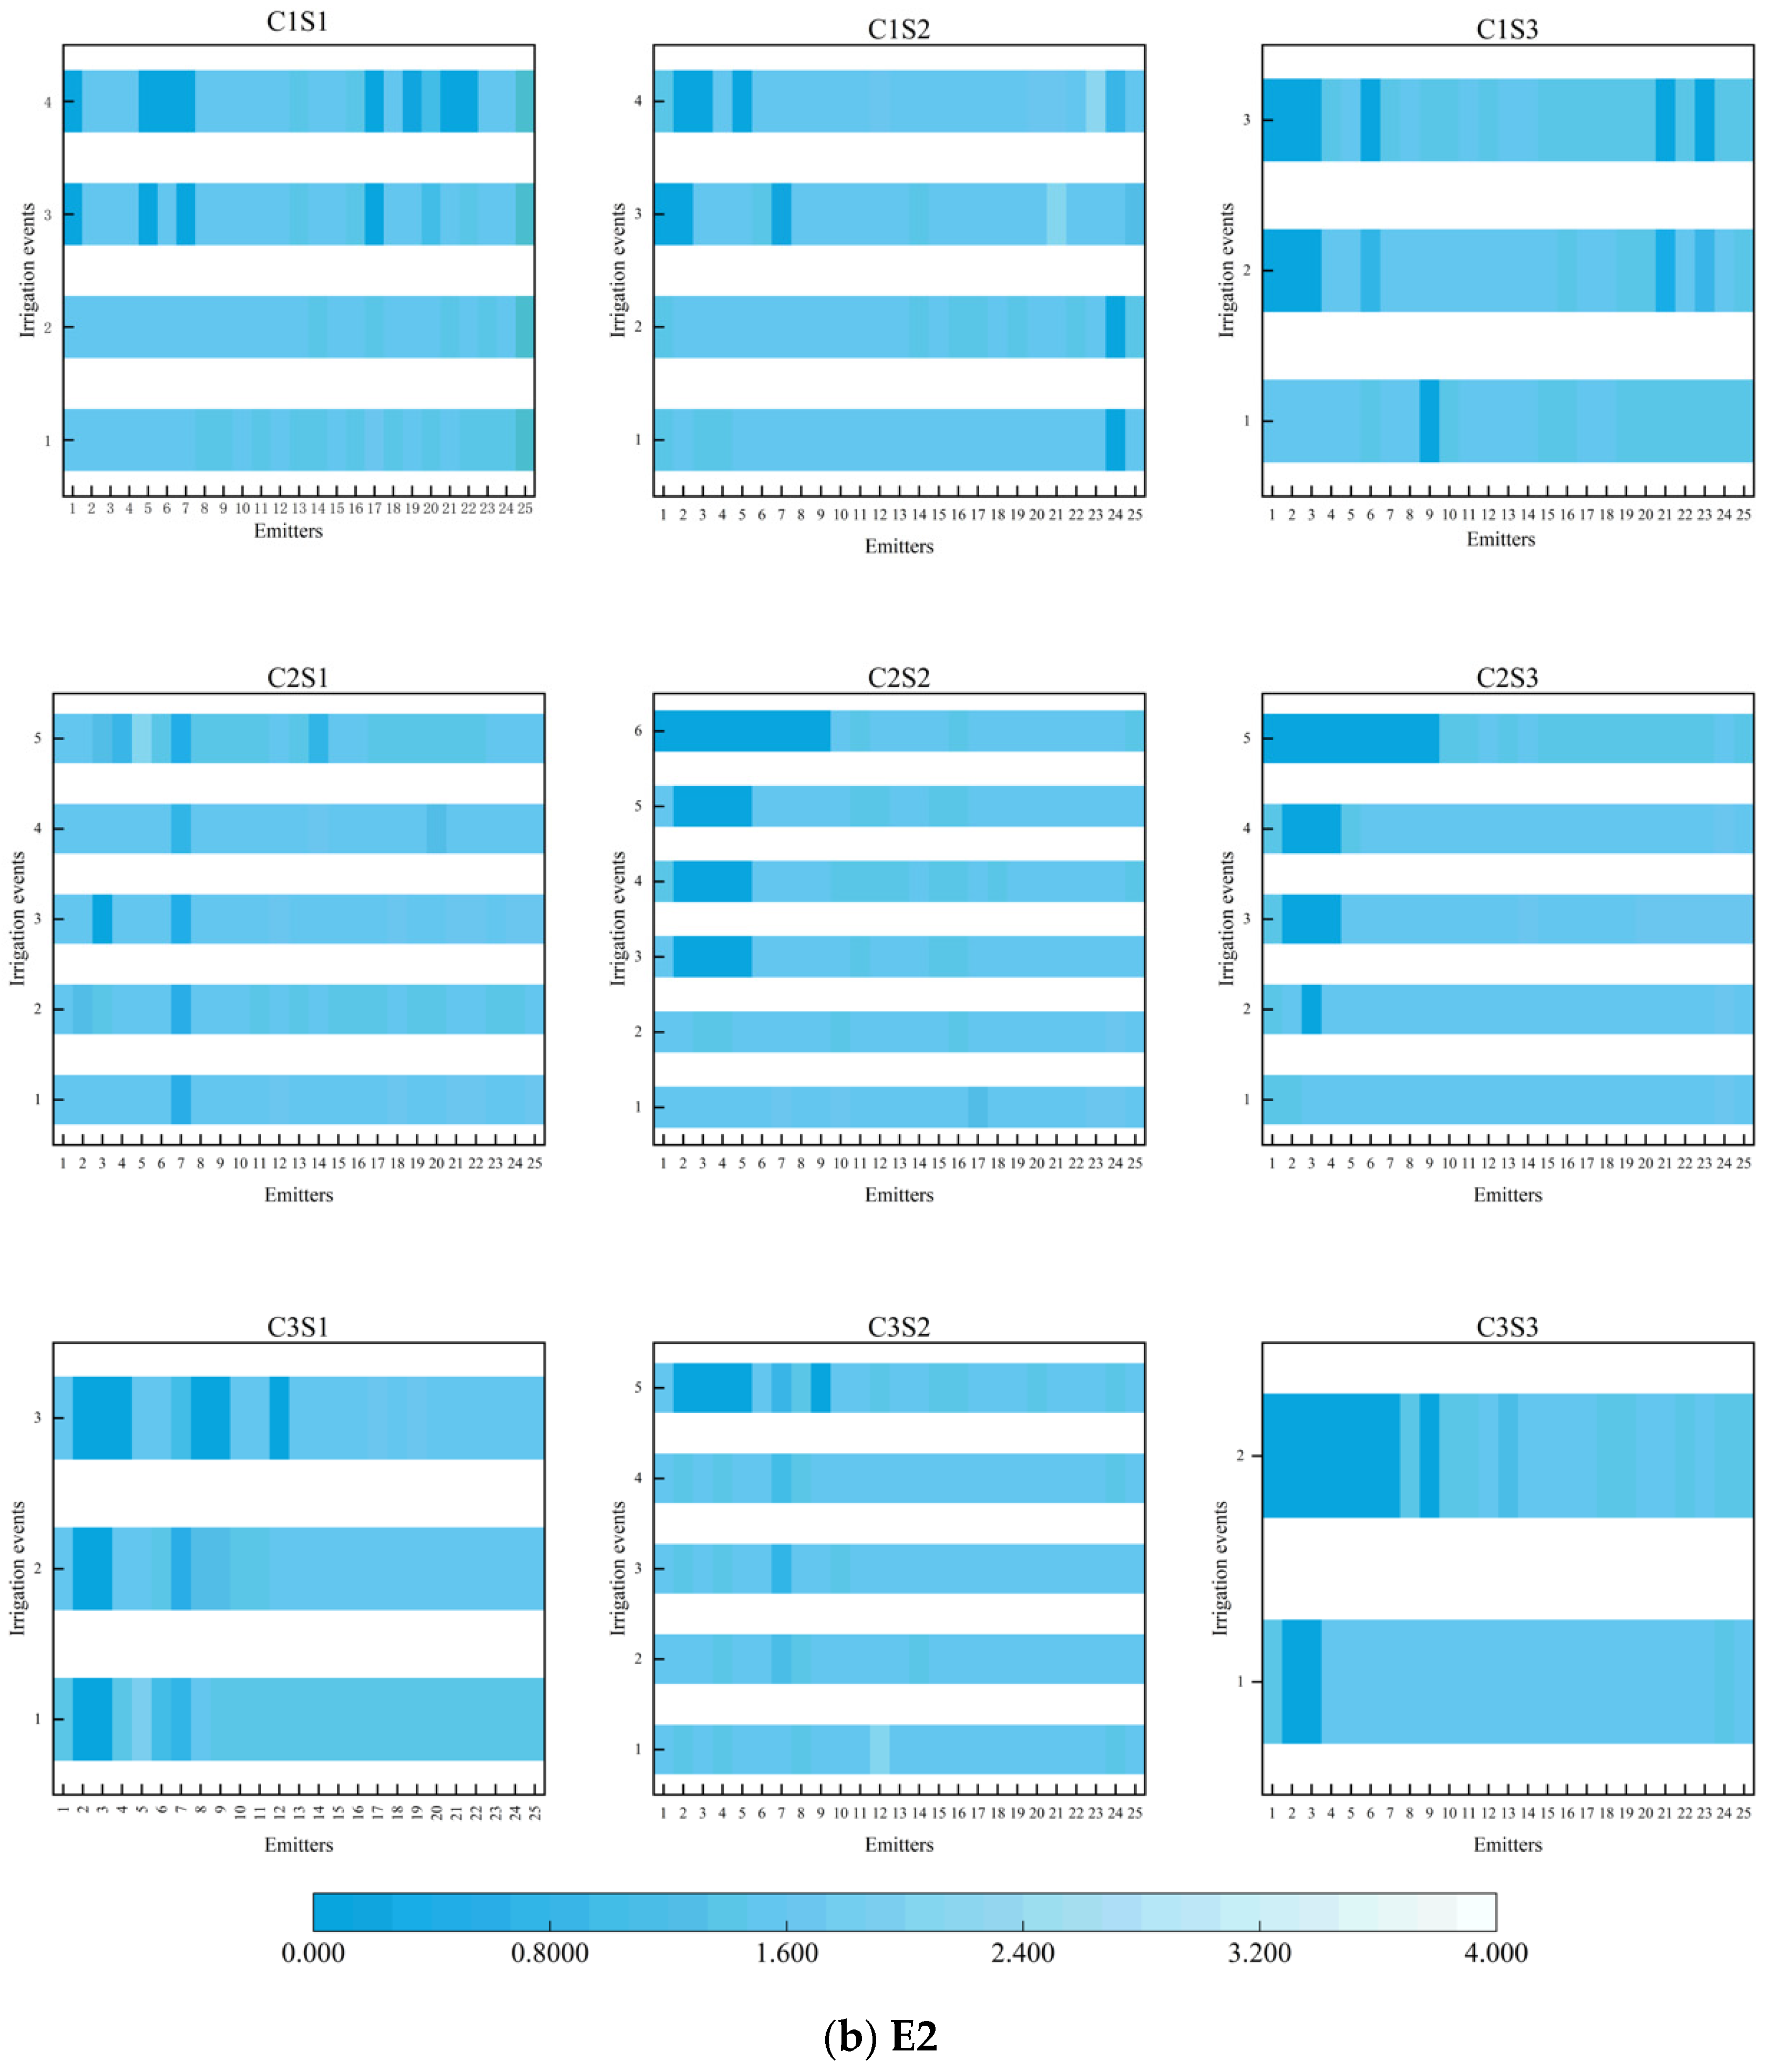
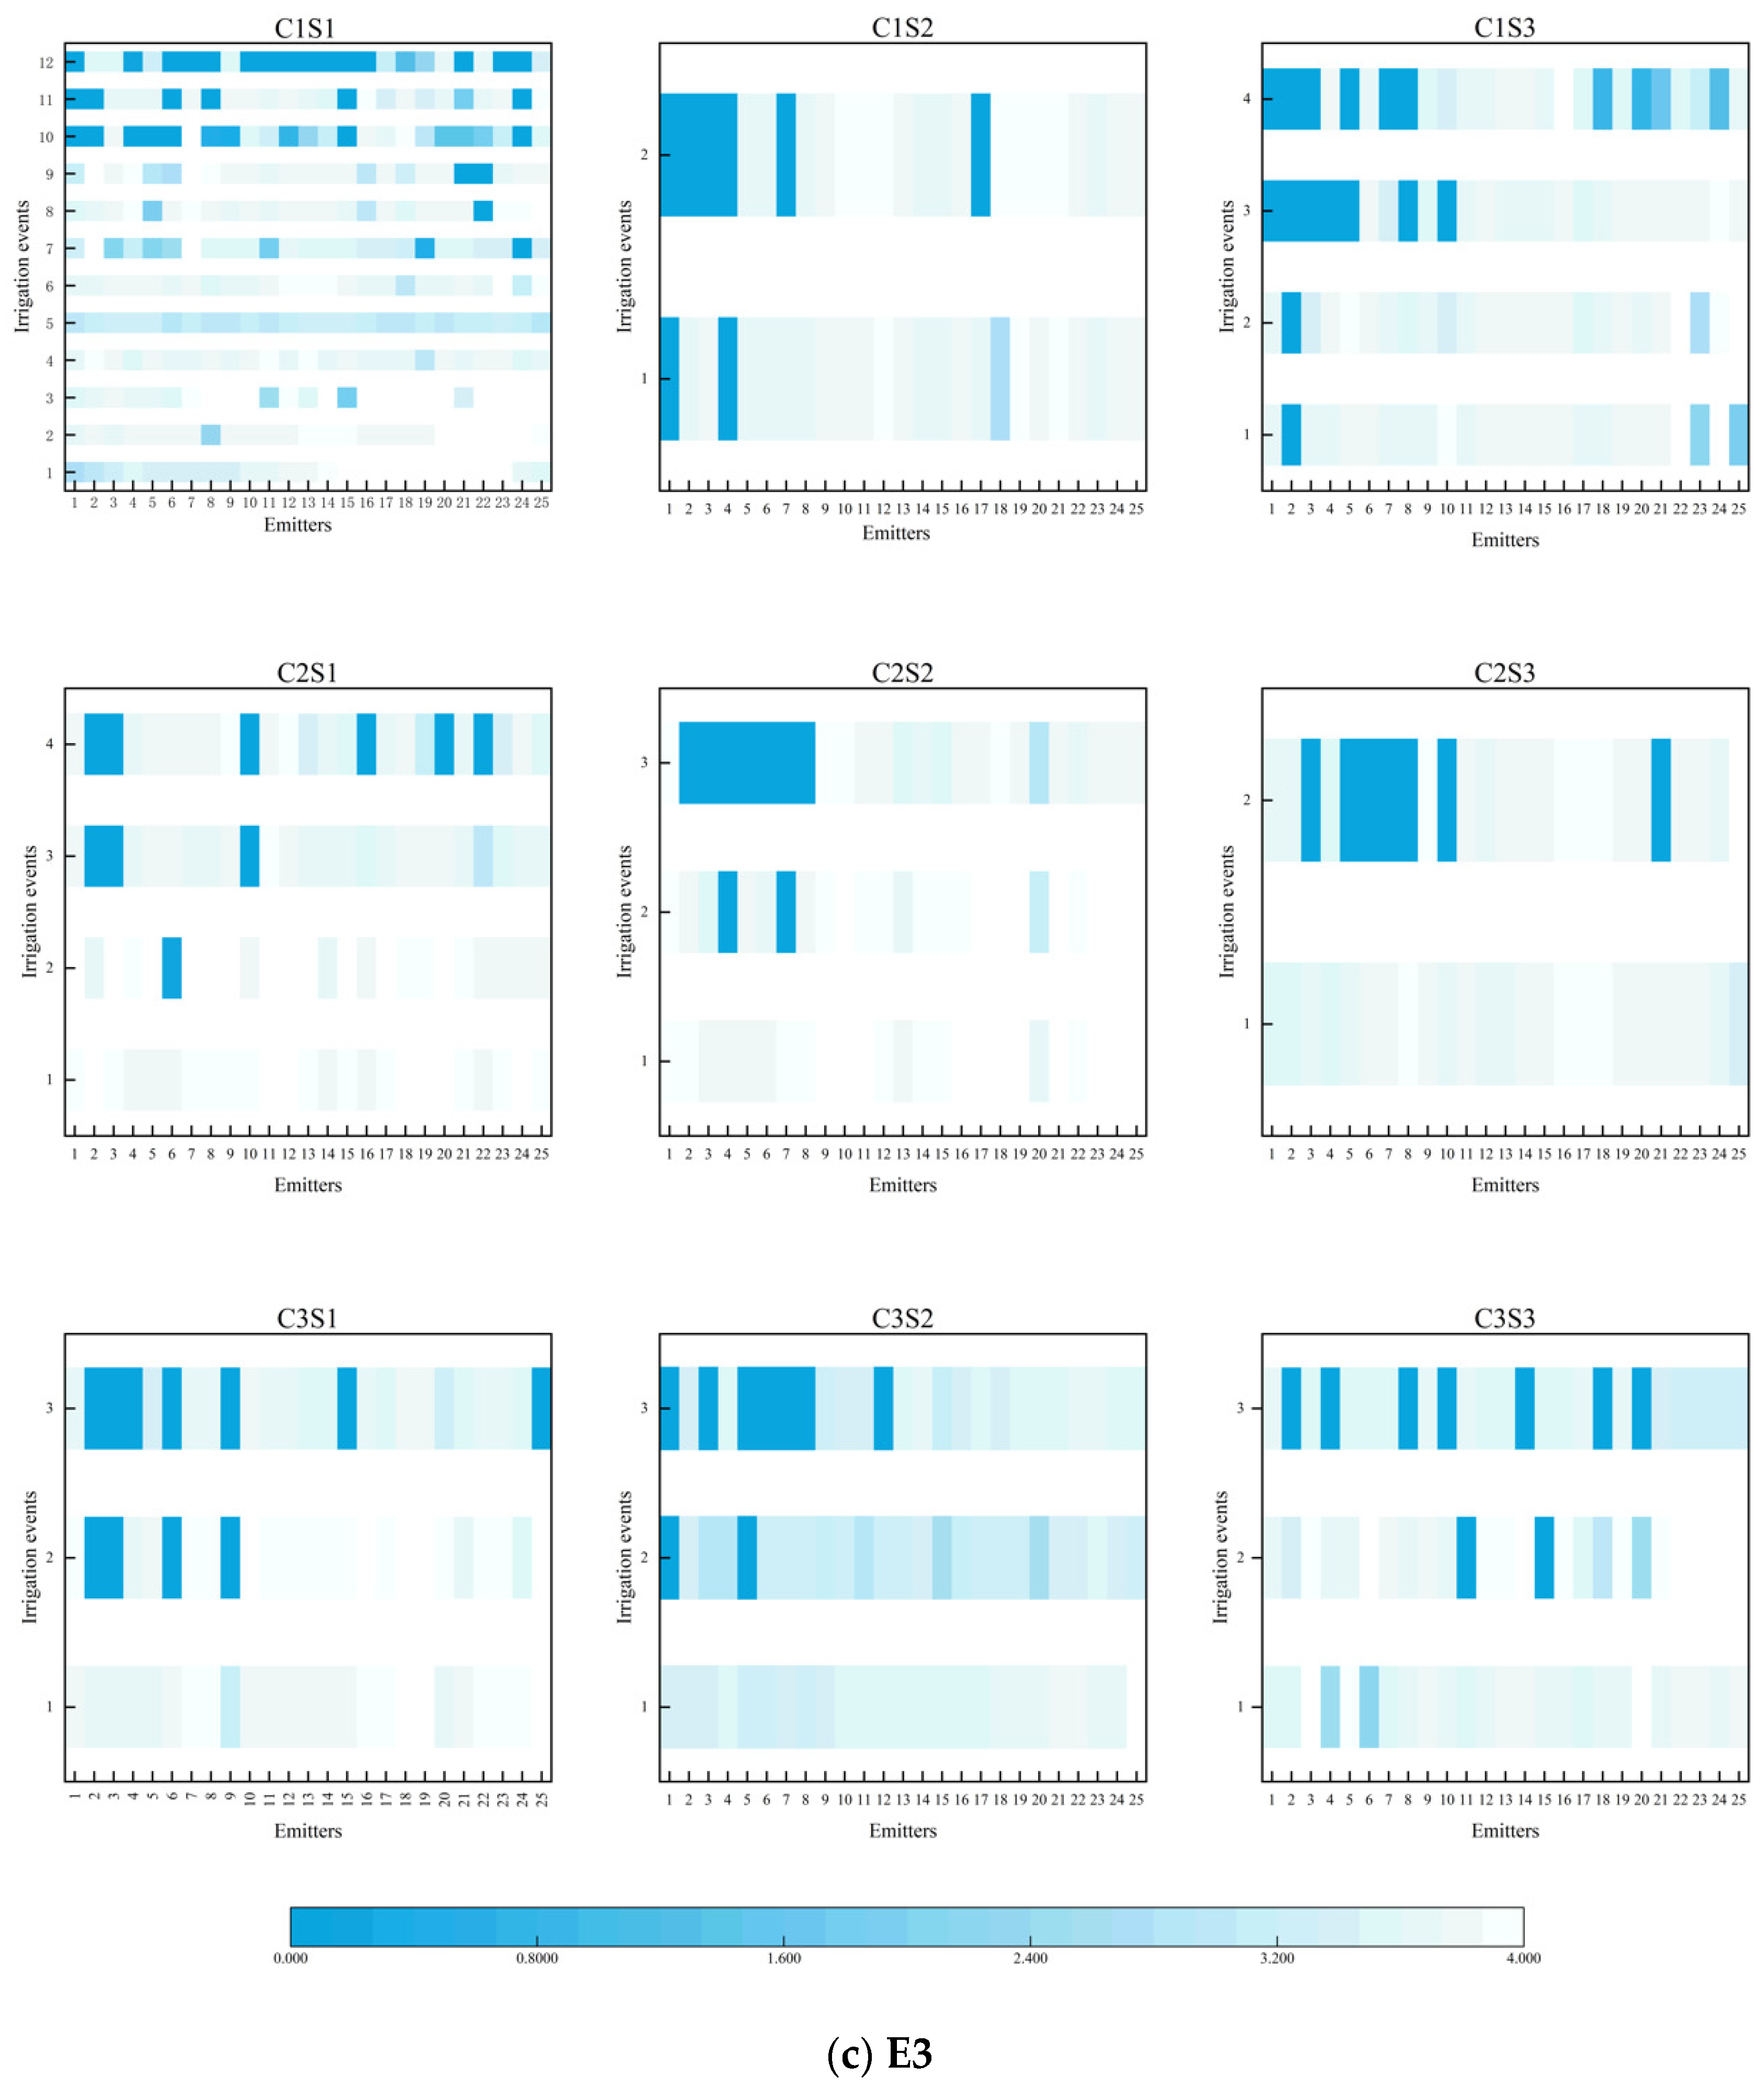
3.1.2. Local Blockage Occurrence

The occurrence of local blockage is similar to macroscopic blockage. With the increase of the system running time, the number of clogged emitters gradually increases. The number of blocked emitters under the smaller particle size treatment was less than that under the larger particle size treatment. The ratio of the clogged emitter to unclogged emitter was 2:5. Taking E1 as an example, when the sand concentration is 1.8 g/L, 2.8 g/L and 3.8 g/L, the total number of clogged emitters was 4, 6, and 6, respectively, which is lower than that of large sediment size (6, 8 and 10). As can be seen from Table 4, with the increase in sand concentration, the number of clogged emitters gradually increased. With the decrease of the sand concentration, the number of completely clogged emitters decreased, and the number of partially clogged emitters increased, so the clogging process was even and slow. While under the high sand concentration treatment, the number of completely clogged emitters was more, and the clogging characteristics tended to be rapid. It could be seen that the lower sand concentration usually leads to the stronger recoverability and less congestion probability. Therefore, considering the number of clogged emitters, it is beneficial to reduce the sediment in the water source by filtration and sedimentation.

3.2. Physical Blockage Distribution

3.2.1. Whole Blockage Distribution

The emitter blockage is mainly characterized by the cross-section area decrease of the channel and the settlement of solid particles in the channel. The analysis of the clogging characteristics at different positions in different periods is helpful to establish the dynamic process of particle accumulation effect in the flow passage. To analyze the clogging characteristics and the influence of each factor on the emitter clogging, the Dra of drip irrigation tapes was selected for analysis (Figure 4).
With the increase in irrigation times, the number of blocked emitters increased. The higher the sediment concentration is, the larger the sediment particle size is, and the more easily the tipper is blocked. When the emitter flow began to decrease significantly, the emitter blockage began to occur, and the blockage locations of different emitters were slightly different. E1 emitters are concentrated in the head and middle of the drip irrigation tape. The blocked parts of the E2 were concentrated at the head and end of the drip irrigation tape. The blockage of the E3 is mainly concentrated in the head.
Under the C3 treatments, the blockage usually occurred within the range of 10~40% tape length from the head. However, when the sediment concentration is low, the blockage usually occurred at the position of 10~60% pipe head. This is because the high sediment concentration promotes the blockage to occur quickly. When the blockage develops rapidly, the overall Dra of drip irrigation tape decreases relatively quickly, resulting in blockage, while the middle emitter has not formed blockage. At the same time, the sediment entered from the tape head and settled or discharged along with the drip irrigation tape, which also means that it is more likely to accumulate a large amount of sediment and form the blockage at the head. It can be seen from the figure that E2 and E3 were similar in their blocked locations, mostly appearing at the head of the drip irrigation tape, while there was a small amount at the end of the drip irrigation tape under E2 irrigation. The reason is that under the same particle size, sediment settlement in the flow passage is mainly determined by the flow velocity and sediment concentration. At the end of drip tape, the flow velocity is low, and the capacity of water-carrying sediment decreases, which increases the blockage probability. The internal flow channel size of E1 was larger, which enhanced sand discharge capacity. At the same time, due to the tubular structure of drip irrigation tape, there was no great gradient difference in the flow rate, and the sediment concentration in the water became the main factor affecting blockage. The sediment content in the head and middle was higher than that in the end, so the blocked parts were concentrated in the head and middle.
In terms of time scale, blockage of E1 occurred at the head initially, followed by the middle, and finally at the end. Meanwhile, blockage of E2 starts from the head, then the end, and finally the middle. Blockage of E3 first occurred at the head, and then a small amount occurred at the end, which also proved the above reasons indirectly.

3.2.2. Local Blockage Distribution

After the irrigation test, all the emitters were dissected, the internal blockage was observed and counted, and a camera (Canon PowerShot SX500IS, 16MP; Manufacturer: Canon Branch, Shaanxi, China) was used to take photos of typically blocked emitters (Figure 5). It can be seen from Figure 5 that there is sediment deposition and adhesion in the flow passage, and the adhesion layer formed by white material can be seen on the inner wall of the flow passage. E1 (Figure 5A) has a labyrinth flow channel as its main internal structure. The blockage occurred mostly at the inlet of the flow channel, accounting for 70–80% of all cases. Flow inlet structure with a certain length forms a narrow water channel, and the flow velocity near the wall is low and the turbulence is insufficient, which leads to solid adhesion in the inner surface. It can be seen that the flow velocity is high, the turbulence is violent, and the attachment layer is not suitable for development at the corner, so there is less congestion here.
For E2, the main internal structure includes two parts: an inlet fence and the labyrinth channel. The blocked parts were concentrated at the fence and the head, as shown in Figure 5b. Although the cross-section of the inlet fence did not form a long and narrow passage, it still led to serious blockage because of the small cross-section size (0.33 mm).
E3 also includes a water fence and labyrinth channel structure, but blockage can be seen at the head and corner of the flow passage after the inlet fence (Figure 5c). This is because there was a low-speed area. According to Wei (2005), particulate matter is easy to deposit and adhere in this area and causes flow channel blockage.
In conclusion, the blockages occurred in the smaller section and the low-speed area, such as the narrow flow passage structure and the sharp corner of the section. These are also the two problems that should be avoided in the design of the emitters.

3.3. Structure and Elemental Composition of Clogging Material
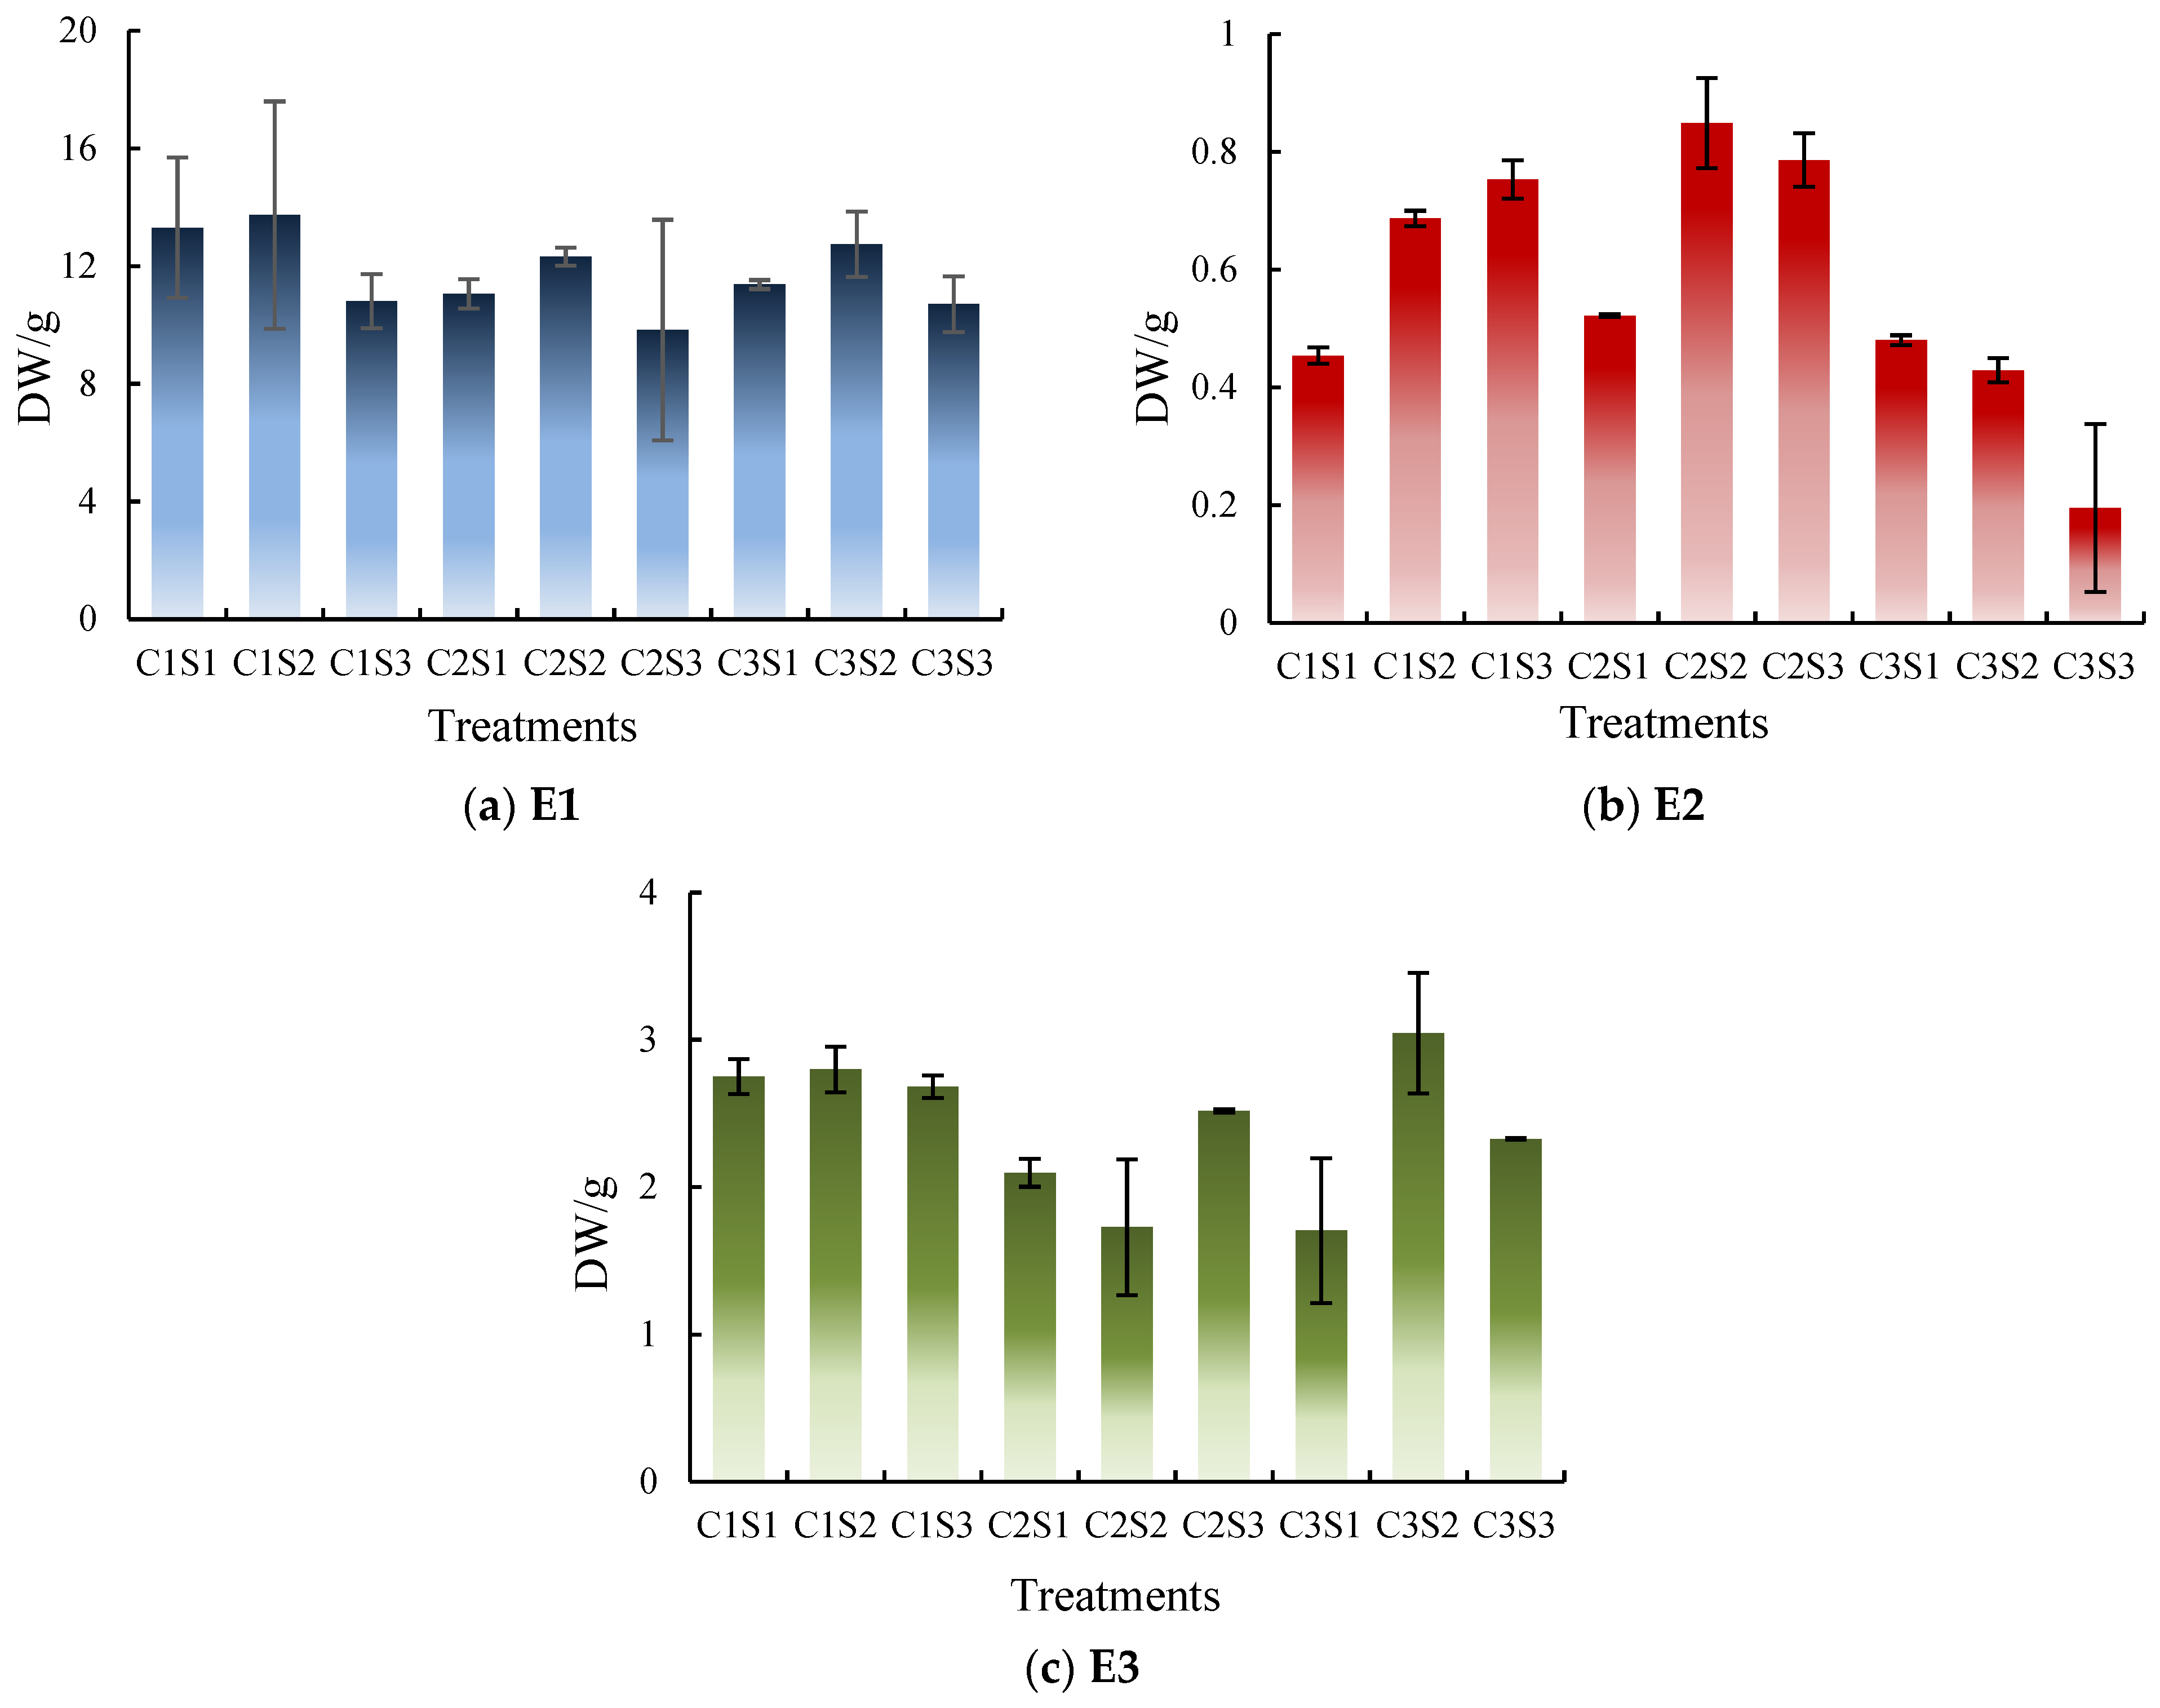
3.3.1. DW

Figure 6 shows the dry weight (DW) of blocked matter in the emitters when irrigation finished under different treatments (under the same emitter irrigation treatments, different water treatments had significant differences at α = 0.05). It can be seen from Figure 6 that DW changed differently with different emitters. The dry weight is mainly determined by the cross-sectional area of the channel, sand concentration, and gradation. The cross-sectional area determines the maximum amount of sediment stored, the sand concentration determines the clogging speed, and the gradation determines the clogging structure. Overall, the DW of emitters was slightly different with the change of concentration. Under C2 treatment, the DW was 0.522 g, 0.849 g, and 0.786 g, respectively. This is because the clogging speed is moderate under C2 treatment, which can not only quickly form the blockage, but also ensure that the emitter would not be blocked completely before the stable structure formation.
For E1, the DW of blocked matter under C1 treatment was the highest, which was 13.307 g, 13.731 g, and 10.809 g, respectively. This is due to the large cross-sectional area of E1, which slows down the clogging process, and the silt in the flow passage could form the blockage structure slowly and stably. For E3, which has a narrow cross-sectional area and a long flow passage, the treatment with higher dry weight was concentrated in lower concentration and higher concentration. This is because the clogging matter mainly consists of aggregates and large sand produced by flocculation at the faster clogging rate. In terms of gradation, the performance of the emitters was consistent, and the peak appeared in the S2 treatment. The reason is that only one particle size is shaped into a loosely homogeneous accumulation structure easily. However, S2 included both large particle sand (0.075–0.1 mm) and fine particle slit (0–0.054 mm), which were more inclined to form a stable skeleton structure.

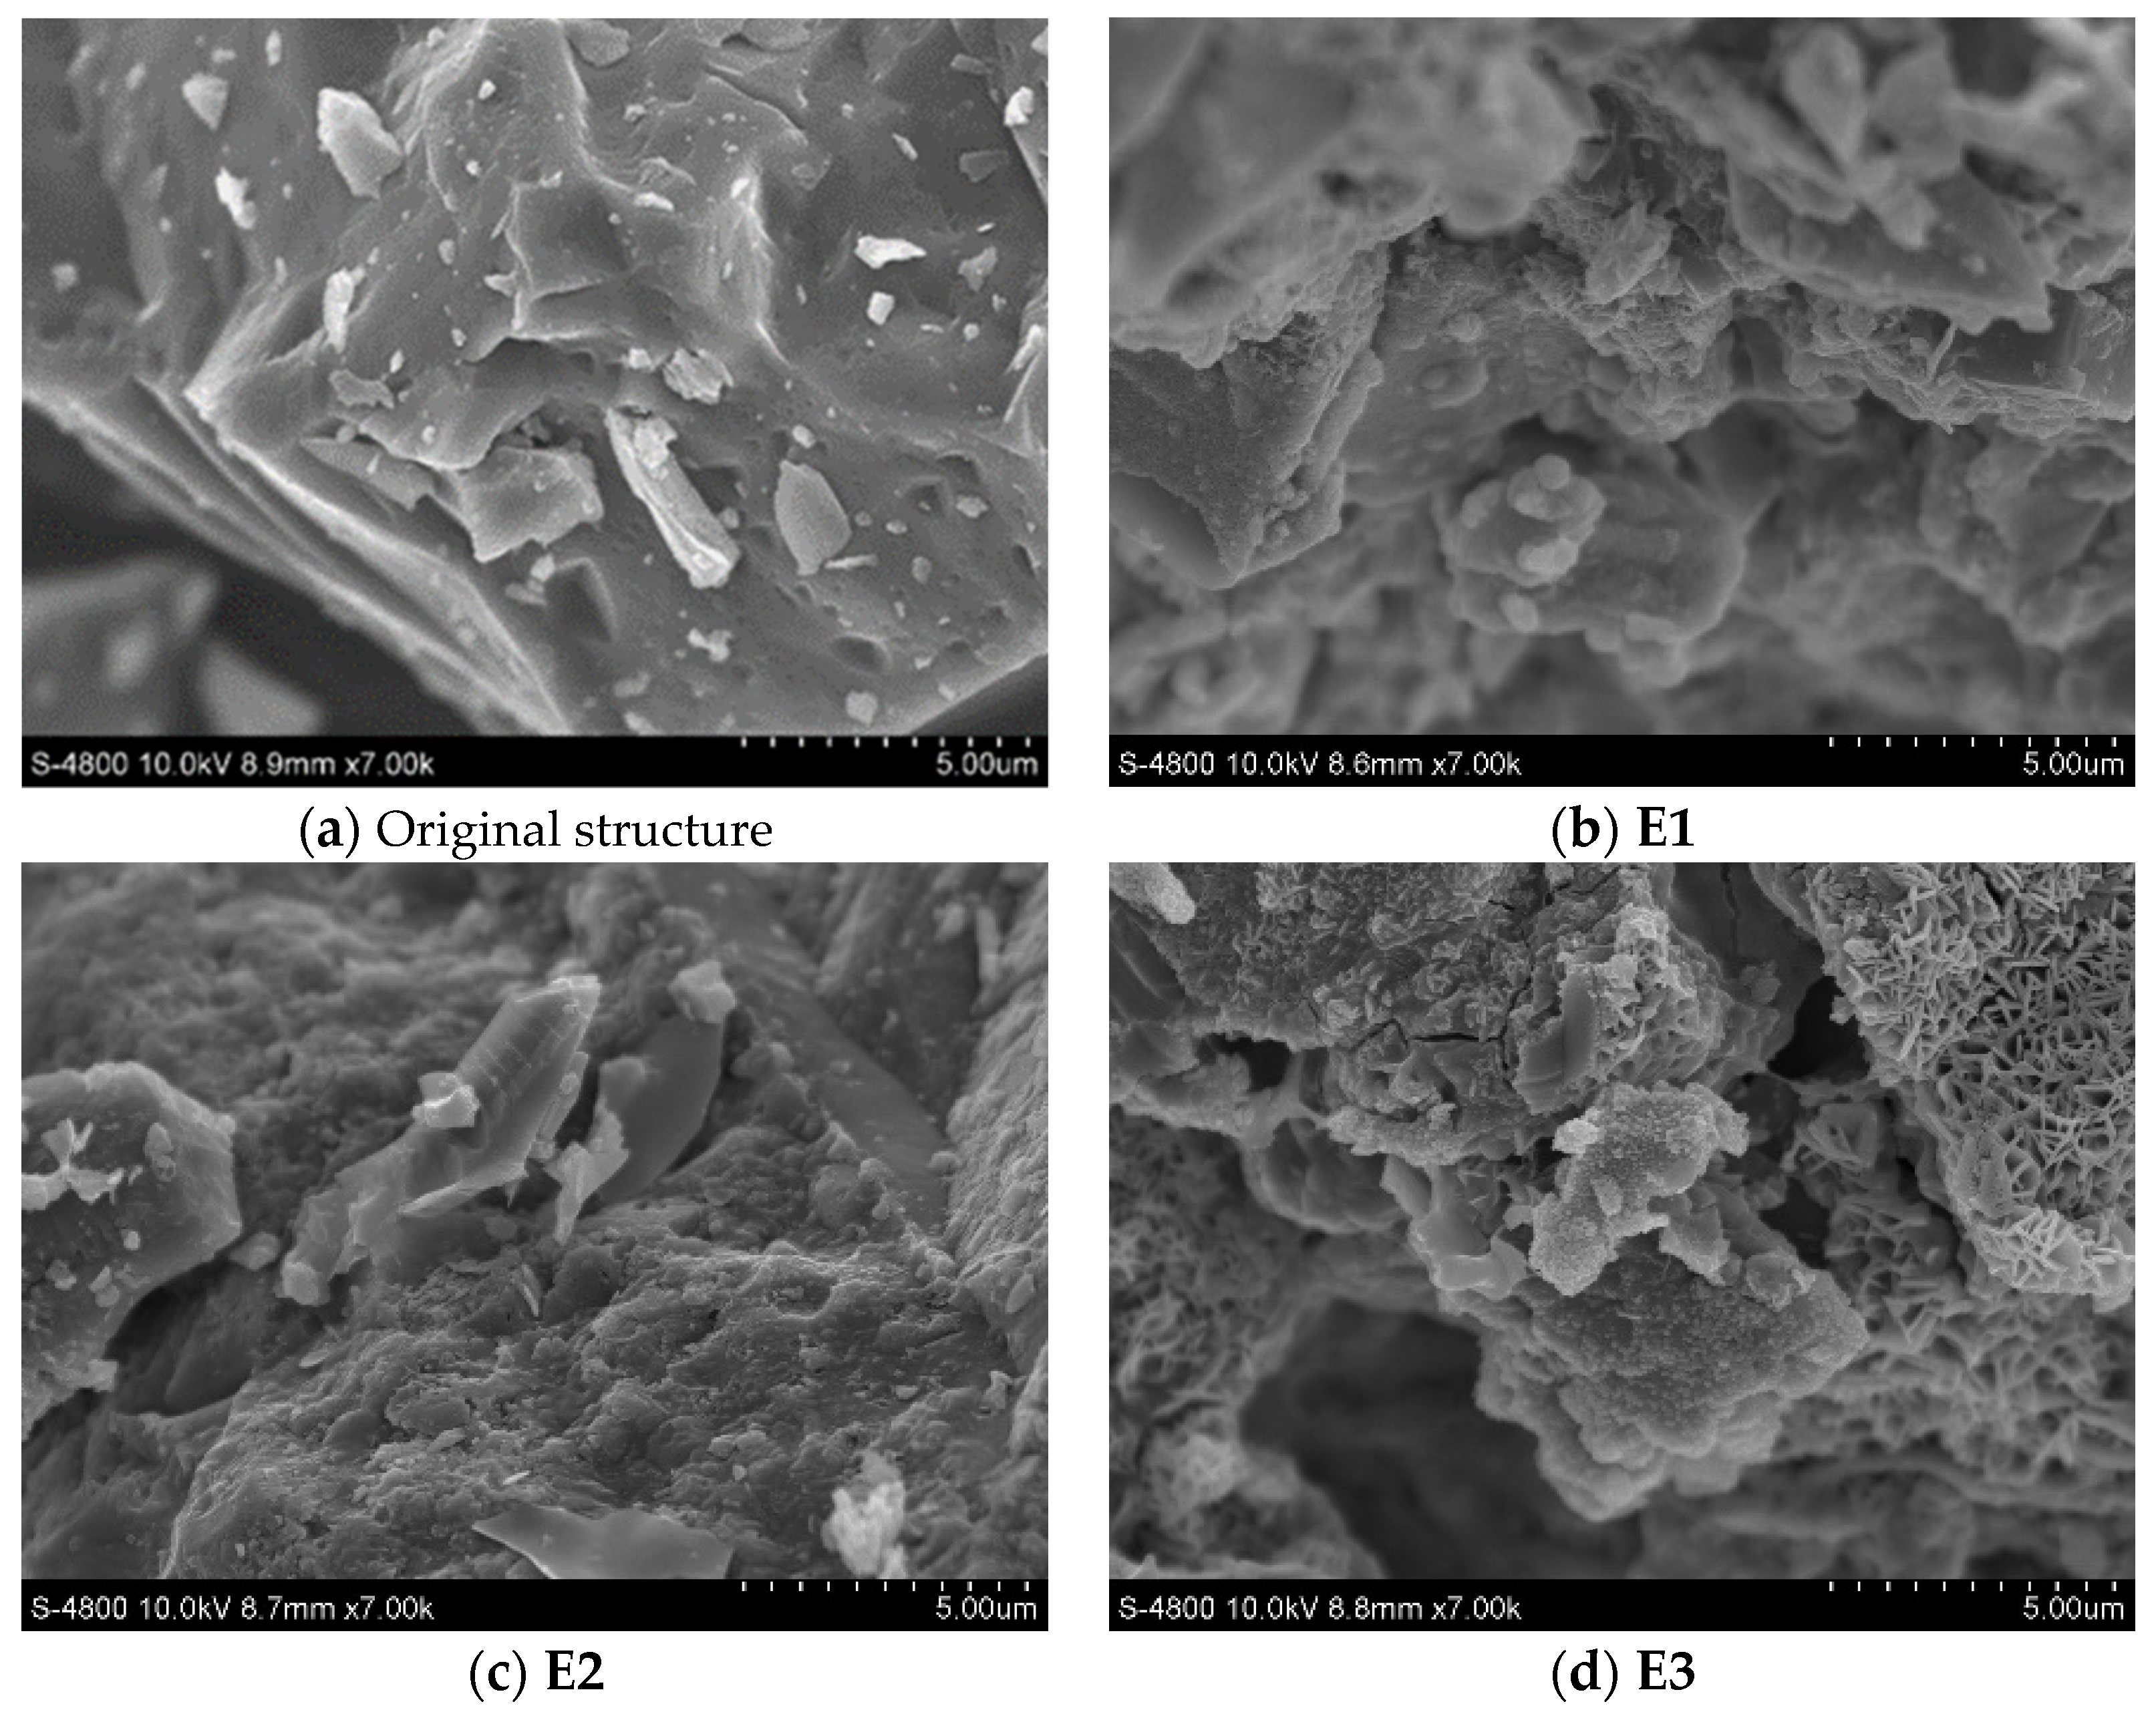
3.3.2. Surface Morphology
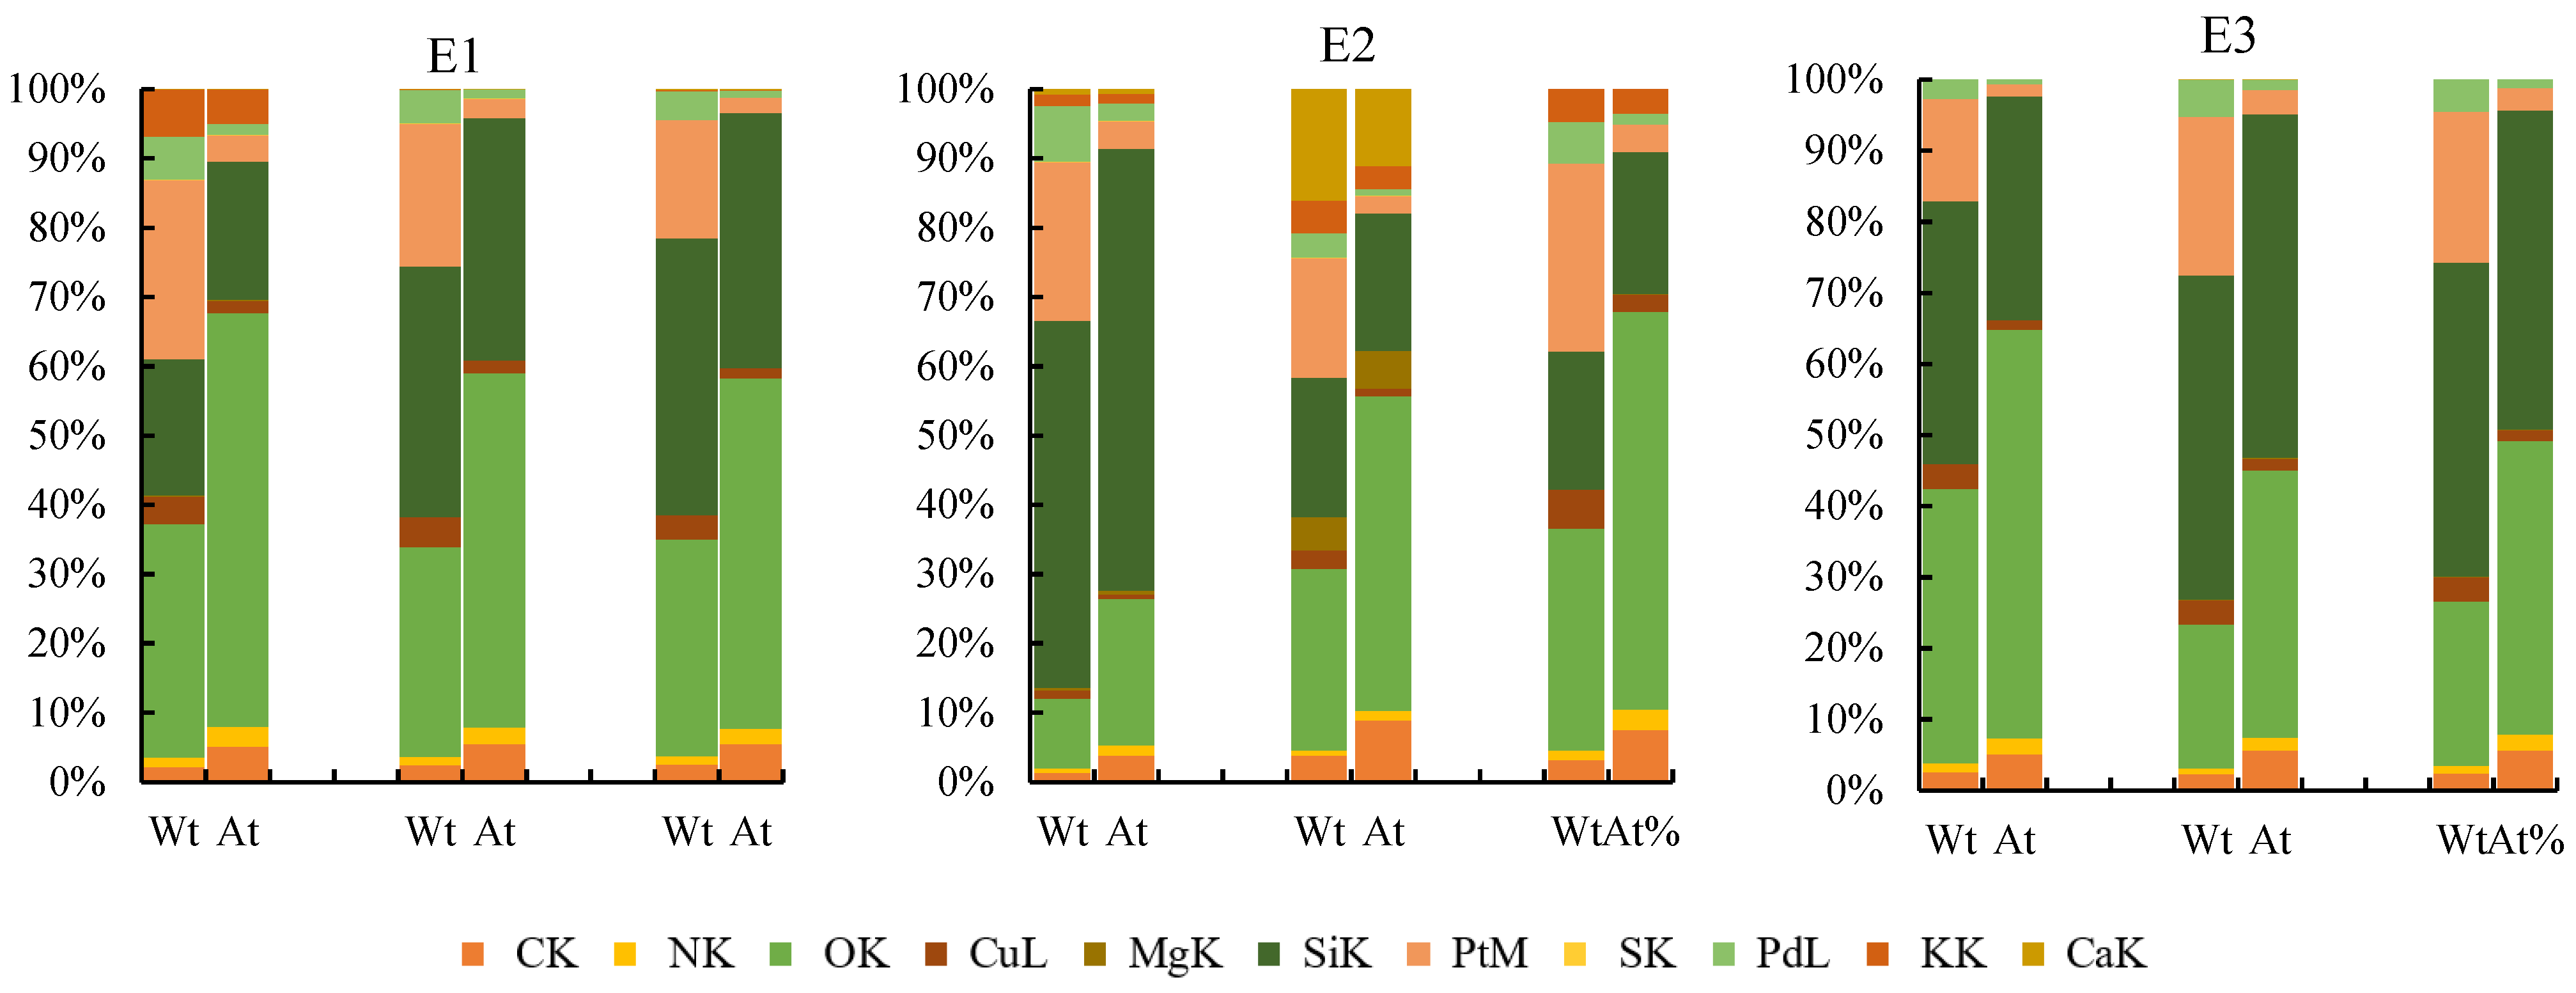
Figure 7 shows the surface morphology of clogging matter in the emitter obtained by field-emission scanning electronic microscopy (FSEM). It can be seen that the surface morphology of the blocked matter attached to the inner wall of the emitters was basically similar and the surface of the blocked matter was distributed in scales. It was obvious that irrigation events had a significant effect on the surface of the blocked matter. The surface of the original blocked material was smooth, and only a local bulge appeared. After the irrigation event, the local protrusion of the blocked material was higher than the original state, indicating that the initial content of sediment particles in the irrigation water source was high. The sediment was easy to precipitate, adsorb, and adhere to the medium using microorganisms. As a result, the surface of the blocked material became rougher, the bulge increased, and the surface structure of the blocked material became closer, with fewer voids and more gullies. Moreover, the average thickness is thicker than that before the irrigation event. Because the water contains nutrient salts, organic matter and a large number of ions and the cations and anions in the water react chemically to form insoluble precipitated materials.

3.3.3. Elements

To judge the composition of the clogging material reasonably, the elements in the clogging material were further analyzed. Figure 8 shows the elemental composition under different treatments obtained by EDS surface energy spectrum analysis. The water source was Yangling tap water, which mainly contains Ca2+, K+, Mg2+, CO32−, and HSO42−. The PH value is between 7.3 and 9.5, which is neutral and slightly alkaline. Clogging material elements were consistent under all treatments. The most abundant were O and Si because the main input elements were quartz sand (SiO2). However, O and Si atomic ratios were slightly larger than the quartz sand atomic ratio (2:1), and the silicate minerals that had a larger atomic ratio may be generated (Figure 7). In the samples, except for E2, there were more Ca, but P, Ca, and Mg in the other samples were less, which was speculated to be caused by calcium and magnesium precipitates (CaCO3-O, CaCO3-R, and CaMgCO3) and phosphate (Ca5(PO4)3(OH)) formed by the ions in tap water. More Ca in the sample of E2 came from calcium carbonate precipitation (CaCO3). The proportion of C element in the three types of emitters is small, mainly as the composition of other precipitation and salt minerals. A small number of other elements, such as N and C, were from tap water and were used to form nitrate (R-NO3) and copper salts (CuCO3). It is worth pointing out that Pd and Pt, which belong to noble metals, are used as developing coatings for field-emission scanning electron microscopy, and have no influence on the results.

4. Discussion

An experimental study was carried out on the emitter blockage in sand-water drip irrigation. According to the results, the clogging characteristics are the combined results of type, sand content, sand particle size, and gradation. The conclusion has been confirmed [31] that Dra fluctuates and decreases gradually around the rated flow. Among three kinds of emitters, the emitter with a larger flow channel performs better, which is also reflected in the study of Wu et al. [32], but with slight differences. They consider the year demand, system costs, and carbon footprint and state that E2 and E3 are more appropriate compared to E1. The reason is that using E1 would lead to excessive system investment for single-season crops. However, considering the anti-clogging performance and sand transport performance [33], emitters with larger flow channels may be more suitable for crops requiring long-term or rotational planting.
Zhang et al. [12] studied the influence of sediment particles on the blockage and the irrigation uniformity by continuous and intermittent irrigation and proved that the probability of sudden complete blockage was greater when the sediment content was within the sensitive range. This result is consistent with this study that with the deterioration of the water source, the emitters with the smaller cross-sectional areas are blocked quickly, and the trend is short and sudden. Congestion characteristics can also be indicated in the single emitter clogging. Low sediment concentration and large flow channel size would lead to a decrease in the completely blocked emitters and an increase in the partially blocked emitters [20]. Under the treatment of a water source with high sediment concentration, complete blockage is more likely to occur, which is consistent with the blockage characteristics of the smaller cross-sectional area.
For the large flow channel, the blockage position was usually distributed within 10~40% of the tape length from the tape head, and the decrease of the cross-sectional area or sand concentration would lead to the blockage extending to 60% of the tape length. The research results of Milstein and Feldlite [34] and Wu et al. [32] also show that according to the types and flow channel shapes of drip irrigation tapes, the clogging extended from the head or end to the middle gradually. The internal blockage mainly occurred in the section with a small cross-sectional area and the low-speed zone where solid particles were deposited and attached easily, such as the long and narrow channel [22] and the section with an acute angle shape.
The surface morphology of clogging material is the overall embodiment of multiple environmental factors. Multiple substances such as solid particles, organic matter, and chemical precipitation in water sources are attached to the surface of blocked substances through collision, flocculation, and biological adhesion (Paul et al., 2012) under hydrodynamic conditions [35]. The adsorption or capture of solid particles results in the formation and development of membrane structures [36]. On the one hand, the water flow in the flow passage transports substrate for the formation of the membrane structure. On the other hand, the formed membrane sheds because of constant hydraulic shear force [37]. At the same time, the chemical reaction occurs gradually, the deposition and flocculated aggregates attach to the inner wall of the flow channel, the roughness of the inner wall increases, the collision characteristics of solid and inner wall change, and the adhesion of particles and chemical precipitation intensify.

5. Conclusions

Based on the systematic study and observation of clogging characteristics, the structure and element composition of the clogging material were analyzed. The results showed that the clogging characteristics were related to the types, sand content, sand particle size, and other factors. With the increase in sand concentration and particle size, the Dra and CU decreased seriously during operation. With the increase of sand concentration, the number of blocked emitters increased gradually and was more inclined to complete blockage. However, at lower sand concentration, the ability to recover the fluctuation enhanced, the probability of complete blockage decreased, and the blockage process were uniform and slow. In addition, the blockage position of the three kinds of emitters was slightly different. The blockage position of E1 appeared at the head and middle, and the internal blockage usually occurred at the inlet. However, that of E2 and E3 concentrated on the head and end, and their internal blockage usually occurred in the low-speed zone. The large-flow emitters may be more suitable for crops requiring long-term or rotational planting. For quarterly crops, the relationship between clogging resistance and system input cost should be measured to determine the appropriate type of emitter. Finally, the internal clogging material was the accumulation of sediment particles and various chemical precipitation. The gradation treatment of mixing large and fine silt was more inclined to form a stable blocking skeleton structure, which is not conducive to the prevention and control of the blockage. It is suggested to take measures such as sedimentation and filtration to avoid this situation.

Author Contributions

Conceptualization, H.W.; methodology, H.W.; software, H.W.; validation, H.W., G.L., M.H., W.W. and X.H.; formal analysis, H.W. and G.L.; investigation, H.W.; resources, H.W. and M.H.; data curation, G.L.; writing—original draft preparation, H.W. and W.W.; writing—review and editing, H.W., G.L., M.H., W.W. and X.H.; visualization, W.W. and M.H.; supervision, W.W.; project administration, W.W. and X.H.; funding acquisition, W.W. and X.H. All authors have read and agreed to the published version of the manuscript.

Funding

This research was funded by the National Natural Science Foundation of China grant number (52079113) and the Natural Science Foundation of Shaanxi Province (2020JM-166).

Institutional Review Board Statement

Not applicable.

Informed Consent Statement

Not applicable.

Data Availability Statement

Not applicable.

Acknowledgments

We are grateful for the financial support from the National Natural Science Foundation of China (52079113) and the Natural Science Foundation of Shaanxi Province (2020JM-166).

Conflicts of Interest

The authors declared that they have no conflict of interest to this work.

References

  1. de Kreij, C.; van der Burg, A.M.M.; Runi, W.T. Drip irrigation emitter clogging in Dutch greenhouses as affected by methane and organic acids. Agric. Water Manag. 2003, 60, 73–85. [Google Scholar] [CrossRef]
  2. Bounoua, S.; Tomas, S.; Labille, J.M.; Molle, B.; Granier, J.; Haldenwang, P.; Izzati, S.N. Understanding physical clogging in drip irrigation: In situ, in-lab and numerical approaches. Irrig. Sci. 2016, 34, 327–342. [Google Scholar] [CrossRef]
  3. Li, J.; Li, Y.; Zhang, H. Tomato Yield and Quality and Emitter Clogging as Affected by Chlorination Schemes of Drip Irrigation Systems Applying Sewage Effluent. J. Integr. Agric. 2012, 11, 1744–1754. [Google Scholar] [CrossRef]
  4. Barragan, J.; Cots, L.; Monserrat, J.; Lopez, R.; Wu, I.P. Water distribution uniformity and scheduling in micro-irrigation systems for water saving and environmental protection. Biosyst. Eng. 2010, 107, 202–211. [Google Scholar] [CrossRef] [Green Version]
  5. Tao, R.; Hu, B.; Chu, G. Impacts of organic fertilization with a drip irrigation system on bacterial and fungal communities in cotton field. Agr. Syst. 2020, 182, 102820. [Google Scholar] [CrossRef]
  6. Gilbert, R.G.; Nakayama, F.S.; Bucks, D.A.; French, O.F.; Adamson, K.C. Trickle irrigation: Emitter clogging and other flow problems. Agric. Water Manag. 1981, 3, 159–178. [Google Scholar] [CrossRef]
  7. Jackson, R.C.; Kay, M.G. Use of pulse irrigation for reducing clogging problems in trickle emitters. J. Agric. Eng. Res. 1987, 37, 223–227. [Google Scholar] [CrossRef]
  8. Nakayama, F.S.; Bucks, D.A. Water quality in drip/trickle irrigation: A review. Irrig. Sci. 1991, 12, 187–192. [Google Scholar] [CrossRef]
  9. Juanico, M.; Azov, Y.; Teltsch, B.; Shelef, G. Effect of effluent addition to a freshwater reservoir on the filter clogging capacity of irrigation water. Water Res. 1995, 29, 1695–1702. [Google Scholar] [CrossRef]
  10. Leverenz, H.L.; Tchobanoglous, G.; Darby, J.L. Clogging in intermittently dosed sand filters used for wastewater treatment. Water Res. 2009, 43, 695–705. [Google Scholar] [CrossRef]
  11. Solé-Torres, C.; Puig-Bargués, J.; Duran-Ros, M.; Arbat, G.; Pujol, J.; Ramírez De Cartagena, F. Effect of different sand filter underdrain designs on emitter clogging using reclaimed effluents. Agric. Water Manag. 2019, 223, 105683. [Google Scholar] [CrossRef]
  12. Zhang, W.; Lv, C.; Zhao, X.; Dong, A.; Niu, W. The influence mechanism of the main suspended particles of Yellow River sand on the emitter clogging—An attempt to improve the irrigation water utilization efficiency in Yellow River basin. Agric. Water Manag. 2021, 258, 107202. [Google Scholar] [CrossRef]
  13. Zhou, B.; Li, Y.; Xue, S.; Feng, J. Variation of microorganisms in drip irrigation systems using high-sand surface water. Agric. Water Manag. 2019, 218, 37–47. [Google Scholar] [CrossRef]
  14. Zhou, B.; Zhou, H.; Puig-Bargués, J.; Li, Y. Using an anti-clogging relative index (CRI) to assess emitters rapidly for drip irrigation systems with multiple low-quality water sources. Agric. Water Manag. 2019, 221, 270–278. [Google Scholar] [CrossRef]
  15. Zhangzhong, L.; Yang, P.; Zhen, W.; Zhang, X.; Wang, C. A kinetic model for the chemical clogging of drip irrigation system using saline water. Agric. Water Manag. 2019, 223, 105696. [Google Scholar] [CrossRef]
  16. Zhou, H.; Li, Y.; Wang, Y.; Zhou, B.; Bhattarai, R. Composite fouling of drip emitters applying surface water with high sand concentration: Dynamic variation and formation mechanism. Agric. Water Manag. 2019, 215, 25–43. [Google Scholar] [CrossRef]
  17. Cai, Y.; Zhao, X.; Wu, P.; Zhang, L.; Zhu, D.; Chen, J.; Lin, L. Ceramic patch type subsurface drip irrigation line: Construction and hydraulic properties. Biosyst. Eng. 2019, 182, 29–37. [Google Scholar] [CrossRef]
  18. Çolak, Y.B.; Yazar, A.; Gönen, E.; Eroğlu, E.Ç. Yield and quality response of surface and subsurface drip-irrigated eggplant and comparison of net returns. Agric. Water Manag. 2018, 206, 165–175. [Google Scholar] [CrossRef]
  19. Capra, A.; Scicolone, B. Recycling of poor quality urban wastewater by drip irrigation systems. J. Clean. Prod. 2007, 15, 1529–1534. [Google Scholar] [CrossRef]
  20. Ravina, I.; Paz, E.; Sofer, Z.; Marm, A.; Schischa, A.; Sagi, G.; Yechialy, Z.; Lev, Y. Control of clogging in drip irrigation with stored treated municipal sewage effluent. Agric. Water Manag. 1997, 33, 127–137. [Google Scholar] [CrossRef]
  21. Taylor, H.D.; Bastos, R.K.X.; Pearson, H.W.; Mara, D.D. Drip irrigation with waste stabilisation pond effluents: Solving the problem of emitter fouling. Water Sci. Technol. 1995, 31, 417–424. [Google Scholar] [CrossRef]
  22. Pei, Y.T.; Li, Y.; Liu, Y.; Zhou, B.; Shi, Z.; Jiang, Y. Eight emitters clogging characteristics and its suitability under on-site reclaimed water drip irrigation. Irrig. Sci. 2014, 32, 141–157. [Google Scholar] [CrossRef]
  23. Zhou, B.; Wang, T.; Li, Y.; Bralts, V. Effects of microbial community variation on bio-clogging in drip irrigation emitters using reclaimed water. Agric. Water Manag. 2017, 194, 139–149. [Google Scholar] [CrossRef]
  24. Chen, M.; Kang, Y.; Wan, S.; Liu, S. Drip irrigation with saline water for oleic sunflower (Helianthus annuus L.). Agric. Water Manag. 2009, 96, 1766–1772. [Google Scholar] [CrossRef]
  25. Chamba, D.; Zubelzu, S.; Juana, L. Determining hydraulic characteristics in laterals and drip irrigation systems. Agric. Water Manag. 2019, 226, 200–218. [Google Scholar] [CrossRef]
  26. Wang, Z.; Li, W.; Zhang, K.; Agrawal, Y.C.; Huang, H. Observations of the distribution and flocculation of suspended particulate matter in the North Yellow Sea cold water mass. Cont. Shelf Res. 2020, 204, 104187. [Google Scholar] [CrossRef]
  27. Pendergast, L.; Bhattarai, S.P.; Midmore, D.J. Evaluation of aerated subsurface drip irrigation on yield, dry weight partitioning and water use efficiency of a broad-acre chickpea (Cicer arietinum, L.) in a vertosol. Agr. Water Manag. 2019, 217, 38–46. [Google Scholar] [CrossRef]
  28. Puig-Bargués, J.; Arbat, G.; Elbana, M.; Duran-Ros, M.; Barragán, J.; de Cartagena, F.R.; Lamm, F.R. Effect of flushing frequency on emitter clogging in microirrigation with effluents. Agr. Water Manag. 2010, 97, 883–891. [Google Scholar] [CrossRef] [Green Version]
  29. Song, P.; Li, Y.; Zhou, B.; Zhou, C.; Zhang, Z.; Li, J. Controlling mechanism of chlorination on emitter bio-clogging for drip irrigation using reclaimed water. Agr. Water Manag. 2017, 184, 36–45. [Google Scholar] [CrossRef]
  30. Ait-Mouheb, N.; Schillings, J.; Al-Muhammad, J.; Bendoula, R.; Tomas, S.; Amielh, M.; Anselmet, F. Impact of hydrodynamics on clay particle deposition and biofilm development in a labyrinth-channel dripper. Irrig. Sci. 2019, 37, 1–10. [Google Scholar] [CrossRef]
  31. Li, G.B.; Li, Y.K.; Xu, T.W.; Liu, Y.Z.; Jin, H.; Yang, P.L.; Yan, D.Z.; Ren, S.M.; Tian, Z.F. Effects of average velocity on the growth and surface topography of biofilms attached to the reclaimed wastewater drip irrigation system laterals. Irrig. Sci. 2012, 30, 103–113. [Google Scholar] [CrossRef]
  32. Wu, D.; Li, Y.; Liu, H.; Yang, P.; Sun, H.; Liu, Y. Simulation of the flow characteristics of a drip irrigation emitter with large eddy methods. Math. Comput. Model. 2013, 58, 497–506. [Google Scholar] [CrossRef]
  33. Du, H.; Ma, T.; Yu, J.; Wang, L.; Lu, J.; Zhao, L. Experimental study on the clogging of drip irrigation system for Yellow River diversion. Yellow River 2019, 41, 149–151. [Google Scholar]
  34. Milstein, A.; Feldlite, M. Particle circulation in irrigation reservoirs: The role of filter backwash reject on filter clogging. Agric. Water Manag. 2015, 158, 139–144. [Google Scholar] [CrossRef]
  35. Bakke, R.; Trulear, M.G.; Robinson, J.A.; Characklis, W.G. Activity of Pseudomonas aeruginosa in biofilms: Steady state. Biotechnol. Bioeng. 1984, 26, 1418–1424. [Google Scholar] [CrossRef]
  36. Tay, J.H.; Liu, Q.S.; Liu, Y. The effects of shear force on the formation, structure and metabolism of aerobic granules. Appl. Microbiol. Biotechnol. 2001, 57, 227–233. [Google Scholar]
  37. Paul, E.; Ochoa, J.C.; Pechaud, Y.; Liu, Y.; Liné, A. Effect of shear stress and growth conditions on detachment and physical properties of biofilms. Water Res. 2012, 46, 5499–5508. [Google Scholar] [CrossRef]
Figure 1. Emitters. (a) The internal channel structure of the E1; (b) The internal channel structure of the E2. (c) The internal channel structure of the E3.
Agronomy 12 01615 g001
Figure 2. Test system layout. Note: (1). Water supply tank; (2) mixer; (3) water pump; (4) filter; (5) water inlet valve; (6) water source drain valve; (7) pressure sensor; (8) water outlet valve; (9) emitters; (10) measuring cup. Description: 1. The filter (4) is used to avoid accidental larger particles entering the system, which would affect the test results. 2. After the sand is added, the water supply system is thoroughly stirred to ensure the uniform distribution of quartz sand particles in the water. 3. After each treatment, the tested emitters were removed. 4. During flushing, the inlet valves (5) were opened to clean the lateral, then the inlet valves were closed, and the drain valve was opened (6) to clean the water supply tank (1).
Agronomy 12 01615 g002
Figure 3. Flow and evenness of emitters during the system operation period.
Agronomy 12 01615 g003aAgronomy 12 01615 g003bAgronomy 12 01615 g003c
Figure 4. Clogging distribution of drip irrigation tapes. (a) The distribution is the flow along the drip irrigation tape 1. (b) The distribution is the flow along the drip irrigation tape 2. (c) The distribution is the flow along the drip irrigation tape 3.
Agronomy 12 01615 g004aAgronomy 12 01615 g004bAgronomy 12 01615 g004c
Figure 5. Clogging distribution of emitters. (a) The clogging distribution E1. (b) The clogging distribution E2. (c) The clogging distribution E3.
Agronomy 12 01615 g005
Figure 6. Dry weight of clogging in emitters under different treatments. (a) Dry weight of clogging in E1. (b) Dry weight of clogging in E2. (c) Dry weight of clogging in E3.
Agronomy 12 01615 g006
Figure 7. Surface morphologies of the clogging matter. (a) Surface morphologies of the sand that has not been irrigated. (b) Surface morphologies of the clogging matter in E1. (c) Surface morphologies of the clogging matter in E2. (d) Surface morphologies of the clogging matter in E3.
Agronomy 12 01615 g007
Figure 8. Elemental composition of clogging. The bars in the figure represent three repeated samples. Wt (%) is the mass ratio of each element, and At (%) is the atomic ratio of each element.
Agronomy 12 01615 g008
Table 1. Types and fundamental dimensions of the emitters.
TypesRated Pressure
(kpa)
Rated Flow (L/h)Length × Width × Depth
(mm)
Flow Index/xDischarge Coefficient/kManufacturing Deviation
(%)
E11003224 × 0.63 × 10.52450.29094.07
E21001.5100 × 0.68 × 0.330.48420.16874.63
E31003.5170 × 1.2 × 0.50.59950.24333.21
Table 2. Levels and factors.
LevelsSediment Grain SizeSediment Concentration (g·L−1)
CombinationsLabelsCombinationsLabels
135% b–65% aS11.8C1
235% c–65% aS22.8C2
335% c–65% bS33.8C3
Table 3. Water quality parameters of Yangling tap water.
ParameterValueParameterValueParameterValueParameterValueParameterValue
pH7.89NH4+
(mg/L)
0.22CO32−
(mg/L)
60.82K+
(mg/L)
1.09Cl
(mg/L)
11
Conductivity (uS/cm)243Mg2+
(mg/L)
2.89PO43−
(mg/L)
0.02Na+
(mg/L)
5.70Ca2+
(mg/L)
28.80
Cu2+
(mg/L)
0.03Zn+
(mg/L)
0.03Total N
(mg/L)
1.33Fe2+
(mg/L)
0.25Mn+
(mg/L)
0.04
Table 4. Number of blockages in each treatment.
TreatmentsClogged Emitter Number
C1S1E100100000011100014
E20047
E30000014239613
C1S2E1000000222222222223
E21133
E31168
C1S3E1011234566
E2033
E3013
C2S1E101336
E21225
E30024
C2S2E10011345
E2203336
E3025
C2S3E100001438
E201339
E307
C3S1E100366
E22(0.25)8(0.5)
E3147
C3S2E102510
E20(0.25)1(0.5)1(0.75)16(1.25)
E30(0.25)4(0.5)7(0.75)
C3S3E1003710
E22(0.5)8
E3237
Note: 1. Items 3 to 20 in the table are the number of plugged emitters under different irrigation times under the treatment; from left to right, from the first irrigation to the 19th irrigation; 2. The parentheses indicate that the irrigation time is not in the order of the above. Because the high concentration of sediment causes the fast blockage, which causes the blockage to occur within 2 h, and the irrigation times (2 h) cannot scientifically indicate the rules. The values in the brackets are the values of irrigation times corresponding to the system running time within 2 h. For example, 0 (0.25) indicates that the number of the clogged emitters is 0 at 30 min.
Publisher’s Note: MDPI stays neutral with regard to jurisdictional claims in published maps and institutional affiliations.

