Article

Alkaline Salt Tolerance of the Biomass Plant Arundo donax

1
Department of Plant Physiology and Molecular Plant Biology, ELTE Eötvös Loránd University, Pázmány Péter Lane 1/c, 1117 Budapest, Hungary
2
Doctoral School of Environmental Sciences, ELTE Eötvös Loránd University, Pázmány Péter Lane 1/a, 1117 Budapest, Hungary
3
Botanical Gardens, ELTE Eötvös Loránd University, Illés Street 25, 1083 Budapest, Hungary
4
Institute of Materials and Environmental Chemistry, Research Centre for Natural Sciences, Eötvös Loránd Research Network, Magyar Tudósok Blvd. 2, 1117 Budapest, Hungary
5
Research Group of Ornamental Horticulture and Green System, Institute of Landscape Architecture, Urban Planning and Garden Art, Hungarian University of Agriculture and Life Sciences, Villányi Street 29-43, 1118 Budapest, Hungary
6
Institute of Agronomy, Hungarian University of Agriculture and Life Sciences, Páter Károly Street 1, 2100 Gödöllő, Hungary
7
Centre for Agricultural Research, Eötvös Loránd Research Network, Brunszvik Street 2, 2462 Martonvásár, Hungary
*
Author to whom correspondence should be addressed.
Agronomy 2022, 12(7), 1589; https://doi.org/10.3390/agronomy12071589
Submission received: 4 June 2022 / Revised: 24 June 2022 / Accepted: 28 June 2022 / Published: 30 June 2022

Abstract

:
Soil alkalinization and salinization have increased worldwide due to extreme and/or prolonged drought periods as well as insufficient irrigation. Since crops generally react to soil salinity and high pH with decreased yield, the cultivation of tolerant biomass plants represents a reasonable alternative. Thus, we aimed to characterize the tolerance of the biomass plant Arundo donax to alkaline salt stress, induced by irrigation water containing NaHCO3 and Na2CO3 mixture (1:1) at 80 mM and 200 mM of final concentration and pH 10. In terms of physiological parameters such as transpiration, chlorophyll content, photosystem II quantum efficiency, relative water content, and water saturation, the plants were resistant to the stress treatment. The negative impact on the water regime was only measured at 200 mM salt. The K/Na ratio decreased in parallel with Na accumulation. Plants also accumulated Zn, whereas a decrease in the concentration of most other elements (Ca, Cu, K, Mg, Ni, S, Si, and Sr) was detected. Antioxidative defence directed by multiple symplastic enzymes contributed to the high physiological tolerance to the applied stress. In conclusion, the cultivation of Arundo donax as a biomass crop appears to be a feasible alternative in areas affected by salinity or alkaline salt accumulation.

1. Introduction

Salt stress of land plants can arise upon exposure to an excessive salt accumulation in the soil, which is well-above the concentrations required for optimal growth and development [1]. Soil salinity is usually associated with high sodium chloride (NaCl) content, but in a non-marine environment (e.g., agroecosystems), it is caused by the combination of sodium, calcium, potassium, magnesium, chlorides, nitrates, sulphates, bicarbonates, and carbonates. Combined with an extreme water regime, sodium-rich deposits often cause an elevated sodium concentration in the upper soil layers. Therefore, in a temperate climate, sodium salinity (sodicity) is one of the most serious factors that limit crop productivity, with adverse effects on seed germination, plant vigour, and crop yield [2,3,4]. Nearly 1 billion hectares are affected worldwide by high salinity [5] causing reduced soil porosity and water permeability [6]. Salinity lowers the water potential in the soil as well as in plants thereby reducing their turgor [7]. An elevated salt accumulation in the rhizosphere also induces physiological drought by reduced water uptake and a decline in the plant’s osmotic potential. Sodium ions accumulate in plant tissues as opposed to suppressed potassium and calcium uptake, resulting in ionic imbalance [8,9].
Alkali stress results mainly from high levels of sodium salts with bicarbonate (HCO3) and carbonate (CO32−) ions. Alkaline soils are particularly detrimental to plants [10] by the introduction of combined ionic, osmotic, oxidative, and high-pH stress [11,12]. Oxidative stress results in the formation of reactive oxygen species (ROSs) that induce lipid peroxidation as well as DNA and protein damage [13]. ROS accumulation was observed in the photosynthetically active mesophyll tissues both in halophytes and glycophytes [14] with the chloroplasts as the main targets for the ROS-induced damages [15]. Under sodium stress, a decrease in the photosynthetic performance correlated with thylakoid swelling and the associated H2O2 production [16]. High salinity also resulted in decreased chlorophyll (Chl) and carotenoid contents, disturbances in Chl biosynthesis [17], reduced stomatal conductance and, as a consequence, limited gas exchange and CO2 fixation rate [18]. The activity of the Calvin cycle enzymes was also reduced [19]. High pH had an additional negative effect on Chl biosynthesis by the insufficient magnesium and iron uptake [12].
Uncontrolled irrigation, drought, and climate change all impact the increasing abundance of alkaline and saline soils that has become a crucial limiting factor for crop production. As a reasonable alternative for salt-sensitive cereals, there has been an increasing interest in the cultivation of energy crops on the affected lands. These fast-growing, high-yielding perennials can be also used in animal husbandry and for the phytoremediation of contaminated soils [20,21]. Arundo donax (common names: giant reed, Spanish cane, Arundo) is a good candidate for this complex application [22,23]. It is native to dunes, wetlands, and riparian habitats and as a rhizomatous C3 grass, its root system can reach more than 5 m depth. The annual–biennial stems grow to 8–10 m in height and 3–4 cm in diameter [24]. It is characterized by an unusually high photosynthetic potential and a relatively high transpiration rate [25,26]. The high biomass productivity of Arundo donax can be achieved under low input conditions [27]. In addition, due to its high hemicellulose, cellulose, and lignin contents, this crop can be used to generate heat and electricity by direct combustion or the production of biogas and second-generation bioethanol, making this crop a promising source for biomass production [28].
In this study, we characterized the tolerance of Arundo donax to combined alkali and salinity stress in terms of photosynthetic performance, antioxidative defence and ionomic balance. To this end, we performed a comprehensive physiological evaluation of alkaline salt-stressed Arundo plants through the analysis of several traits related to the water regime, photosynthetic activity, and tolerance to ROS. It was concluded that Arundo donax, natively distributed in habitats that are affected by salinity, has good tolerance to this combined stress, which makes it a potential alternative for biomass production in continental climates under alkaline–saline conditions.

2. Materials and Methods

2.1. Soil Characteristics

Experiments were conducted on a slightly calcareous sandy soil collected as a 30 cm topsoil fraction at Őrbottyán, Hungary (47.672844900004726 N, 19.246605226196177 E). Basic characteristics of soil were the following: pH (KCl) 7.41, sand texture with <10% (m/m) clay + silt content, total salt < 0.02% (m/m), CaCO3 1.9% (m/m), and humus 1.07% (m/m). The soluble (1:10 deionized water extractable) fraction contained (mg kg−1) NO2 + NO3 7.17, P2O5 51.7, K2O 70.9, SO42− 5.9, and Na+ 23.5. The total (HNO3-H2O2-extractable) concentration of macro, micro, and trace elements is shown in Supplementary Table S1. All soil parameters were determined according to the relevant national standards by the authorized Soil Conservation Laboratory of Velence, Food Chain Security Center Ltd., Velence, Hungary.

2.2. Plant Material and Alkaline Salt Treatments

Micropropagated Arundo donax (ecotype ‘Blossom’) plants were planted in wet soil and grown at high humidity for a week, then transferred to 9 × 9 × 25 cm elongated pots of 2 L volume. The soil was moistened with deionized water (<2 µS cm−1) up to 70% field capacity three times a week (Monday, Wednesday and Friday). After 2 weeks, plants were rogued to leave three uniform individuals in each pot. (It is noteworthy to mention that despite thorough selection the longitudinal growth versus tiller development introduced heterogeneity in the plant cultures.) Experiments were conducted in glasshouse conditions under mixed illumination of natural sunlight and Master HPI-T Plus 400 W/645 E40 metal-halogen lamps (Philips Amsterdam, Netherlands) set to 14 h photoperiod. Daily maximum light intensity was approx. 600 µmol photons m−2 s−1 of photosynthetic photon flux radiation (PPFD) measured by an LI-189 photometer (LI-COR Biosciences, Lincoln, NE, USA).
Untreated plants, referred to as the control group, were irrigated with deionized water as previously mentioned. For combined stress treatment, the plants received NaHCO3 and Na2CO3 mixture in the irrigation water at a molar ratio of 1:1 at 80 mM (pH 10.28, 9.1 mS cm−1) and 200 mM (pH 10.22, 19.3 mS cm−1). The treatments occurred twice a week (Monday and Friday). The growth (shoot length, diameter at shoot base, and leaf surface) and physiological parameters were measured and plants were harvested after 1 month of treatment.

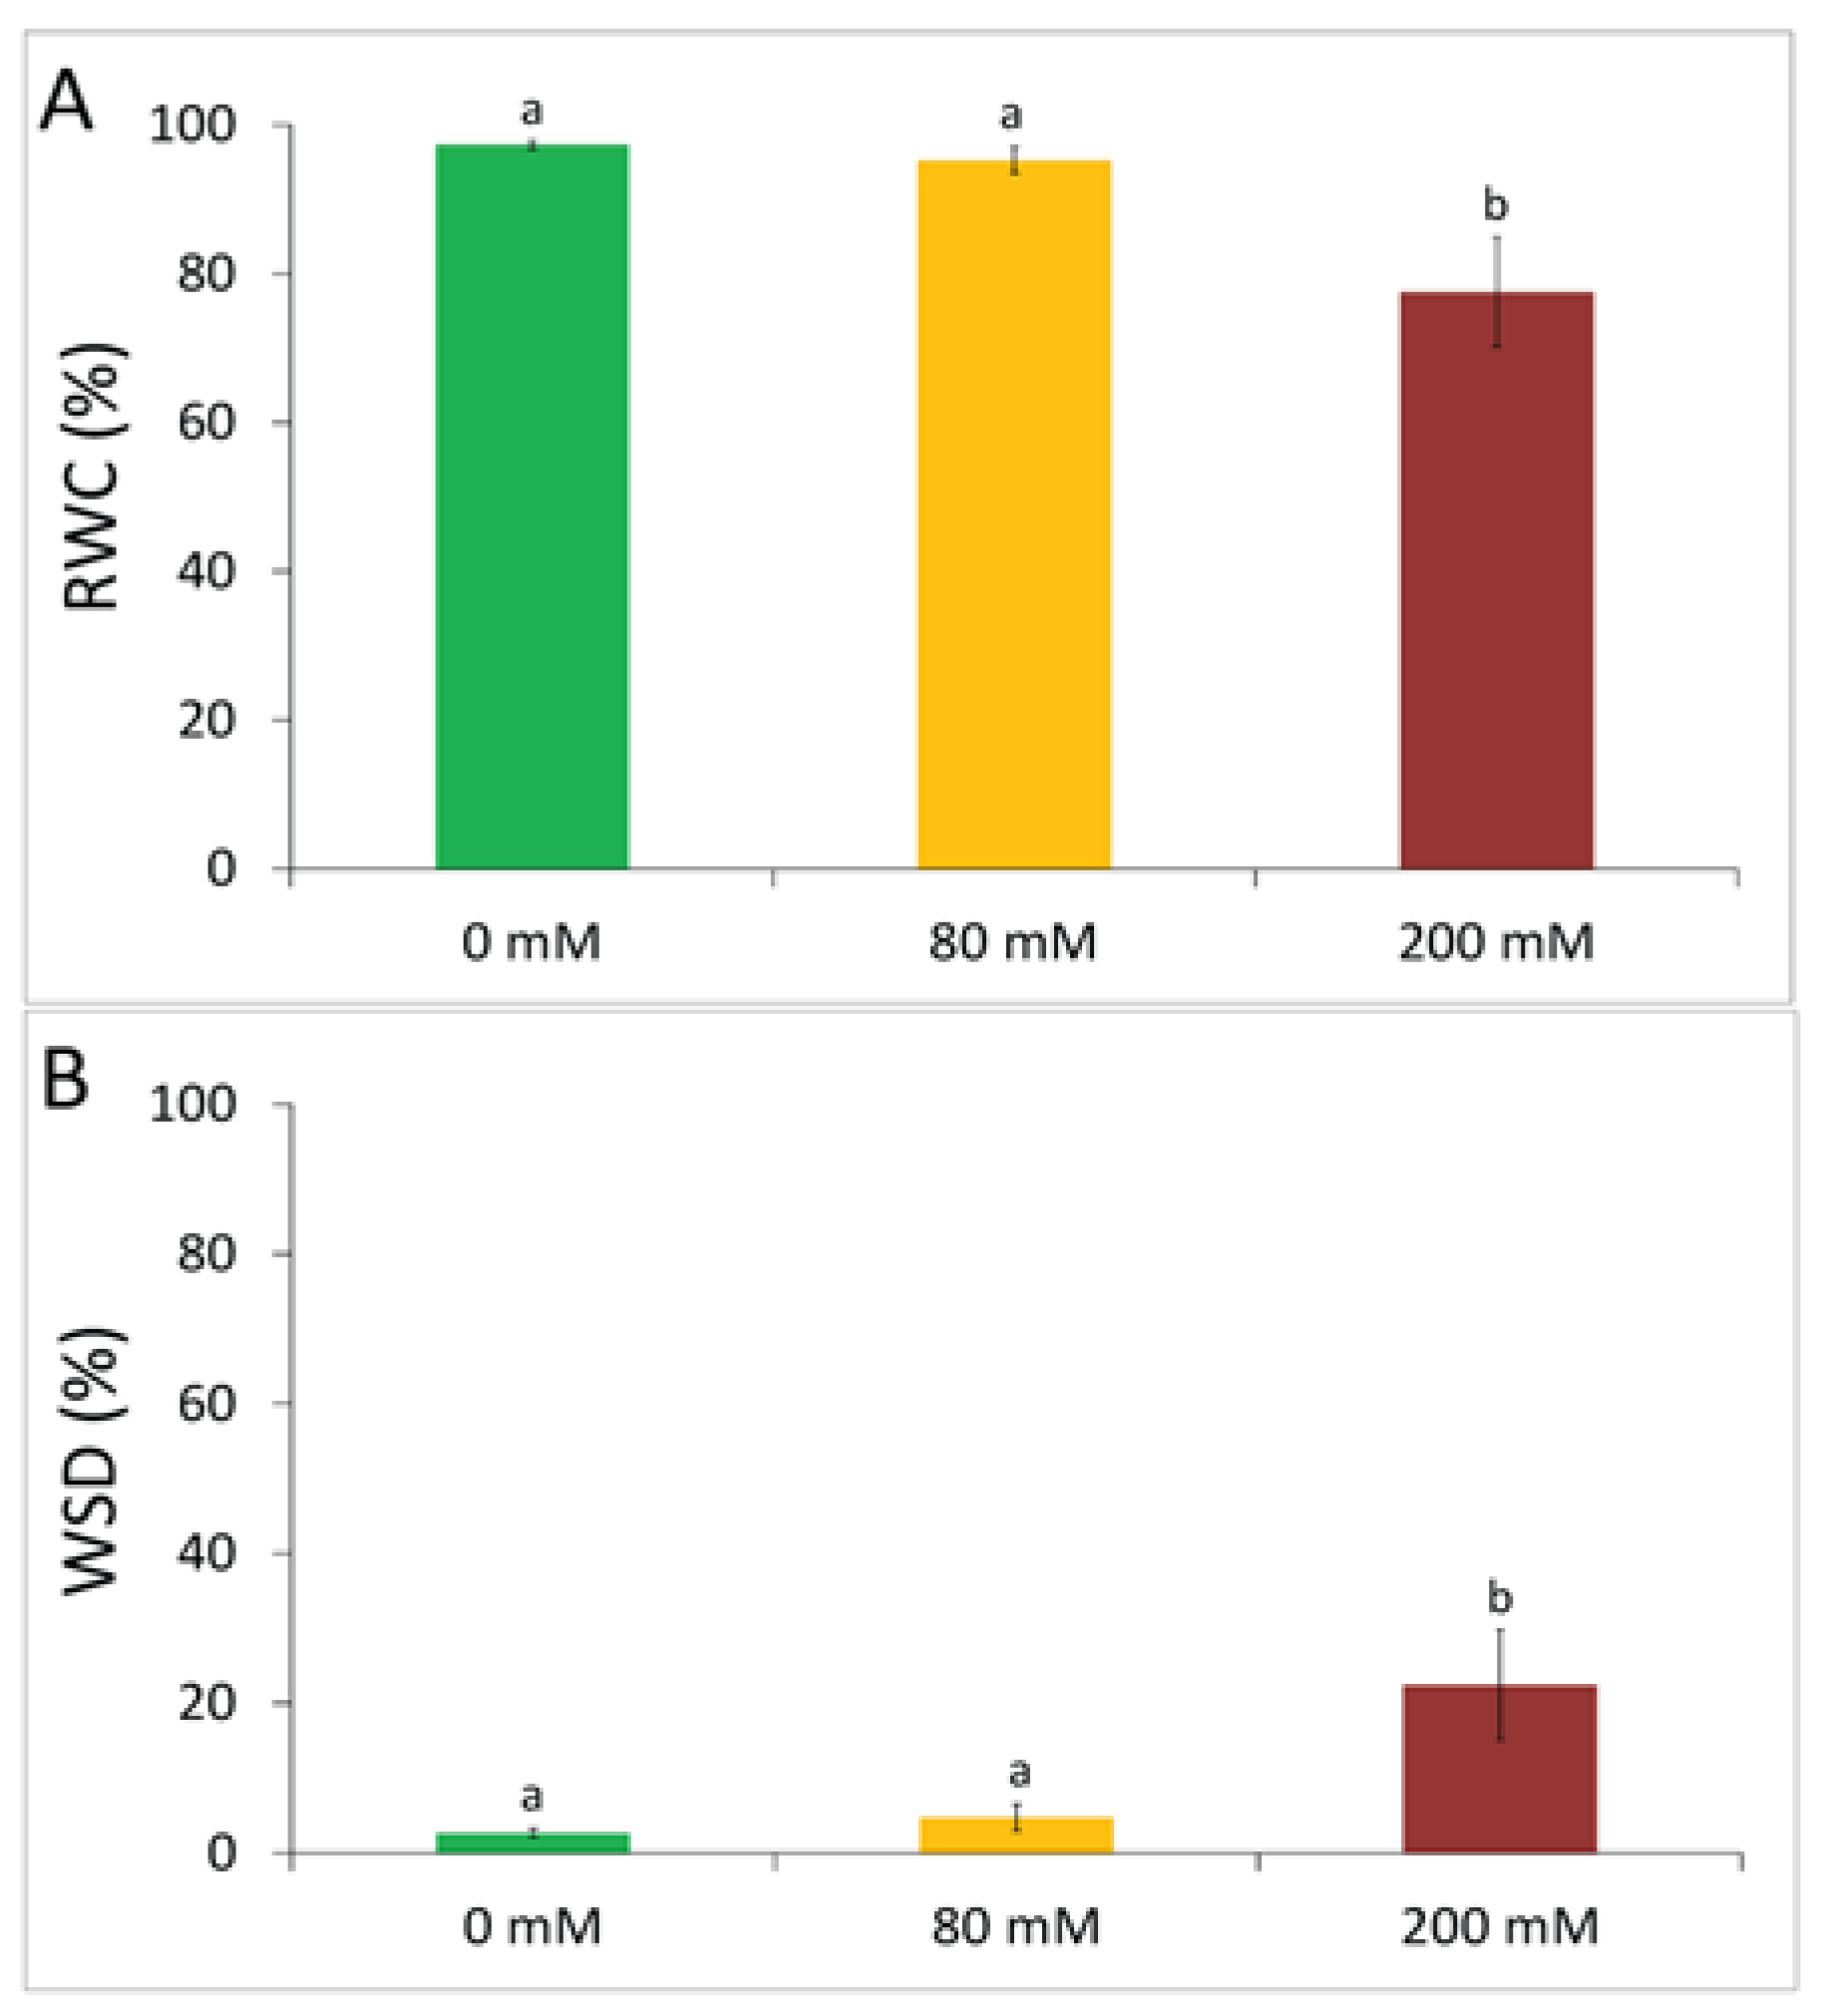
2.3. Determination of Relative Water Content and Water Saturation Deficit

For relative water content (RWC) measurements, samples were collected from the first fully developed leaves. The fresh weight (FW) of the leaf disks (d = 8 mm) was determined, and the disks were incubated on a wet filter paper in Petri dishes to reach full hydration in 4 h. The turgid weight (TW) was then recorded, and the leaf tissue was dried to a constant weight (DW) at 85 °C overnight. RWC was calculated as:
RWC   ( % ) = ( FW DW ) ( TW DW ) × 100
Water saturation deficit (WSD) was calculated as:
WSD   ( % ) = 100 RWC

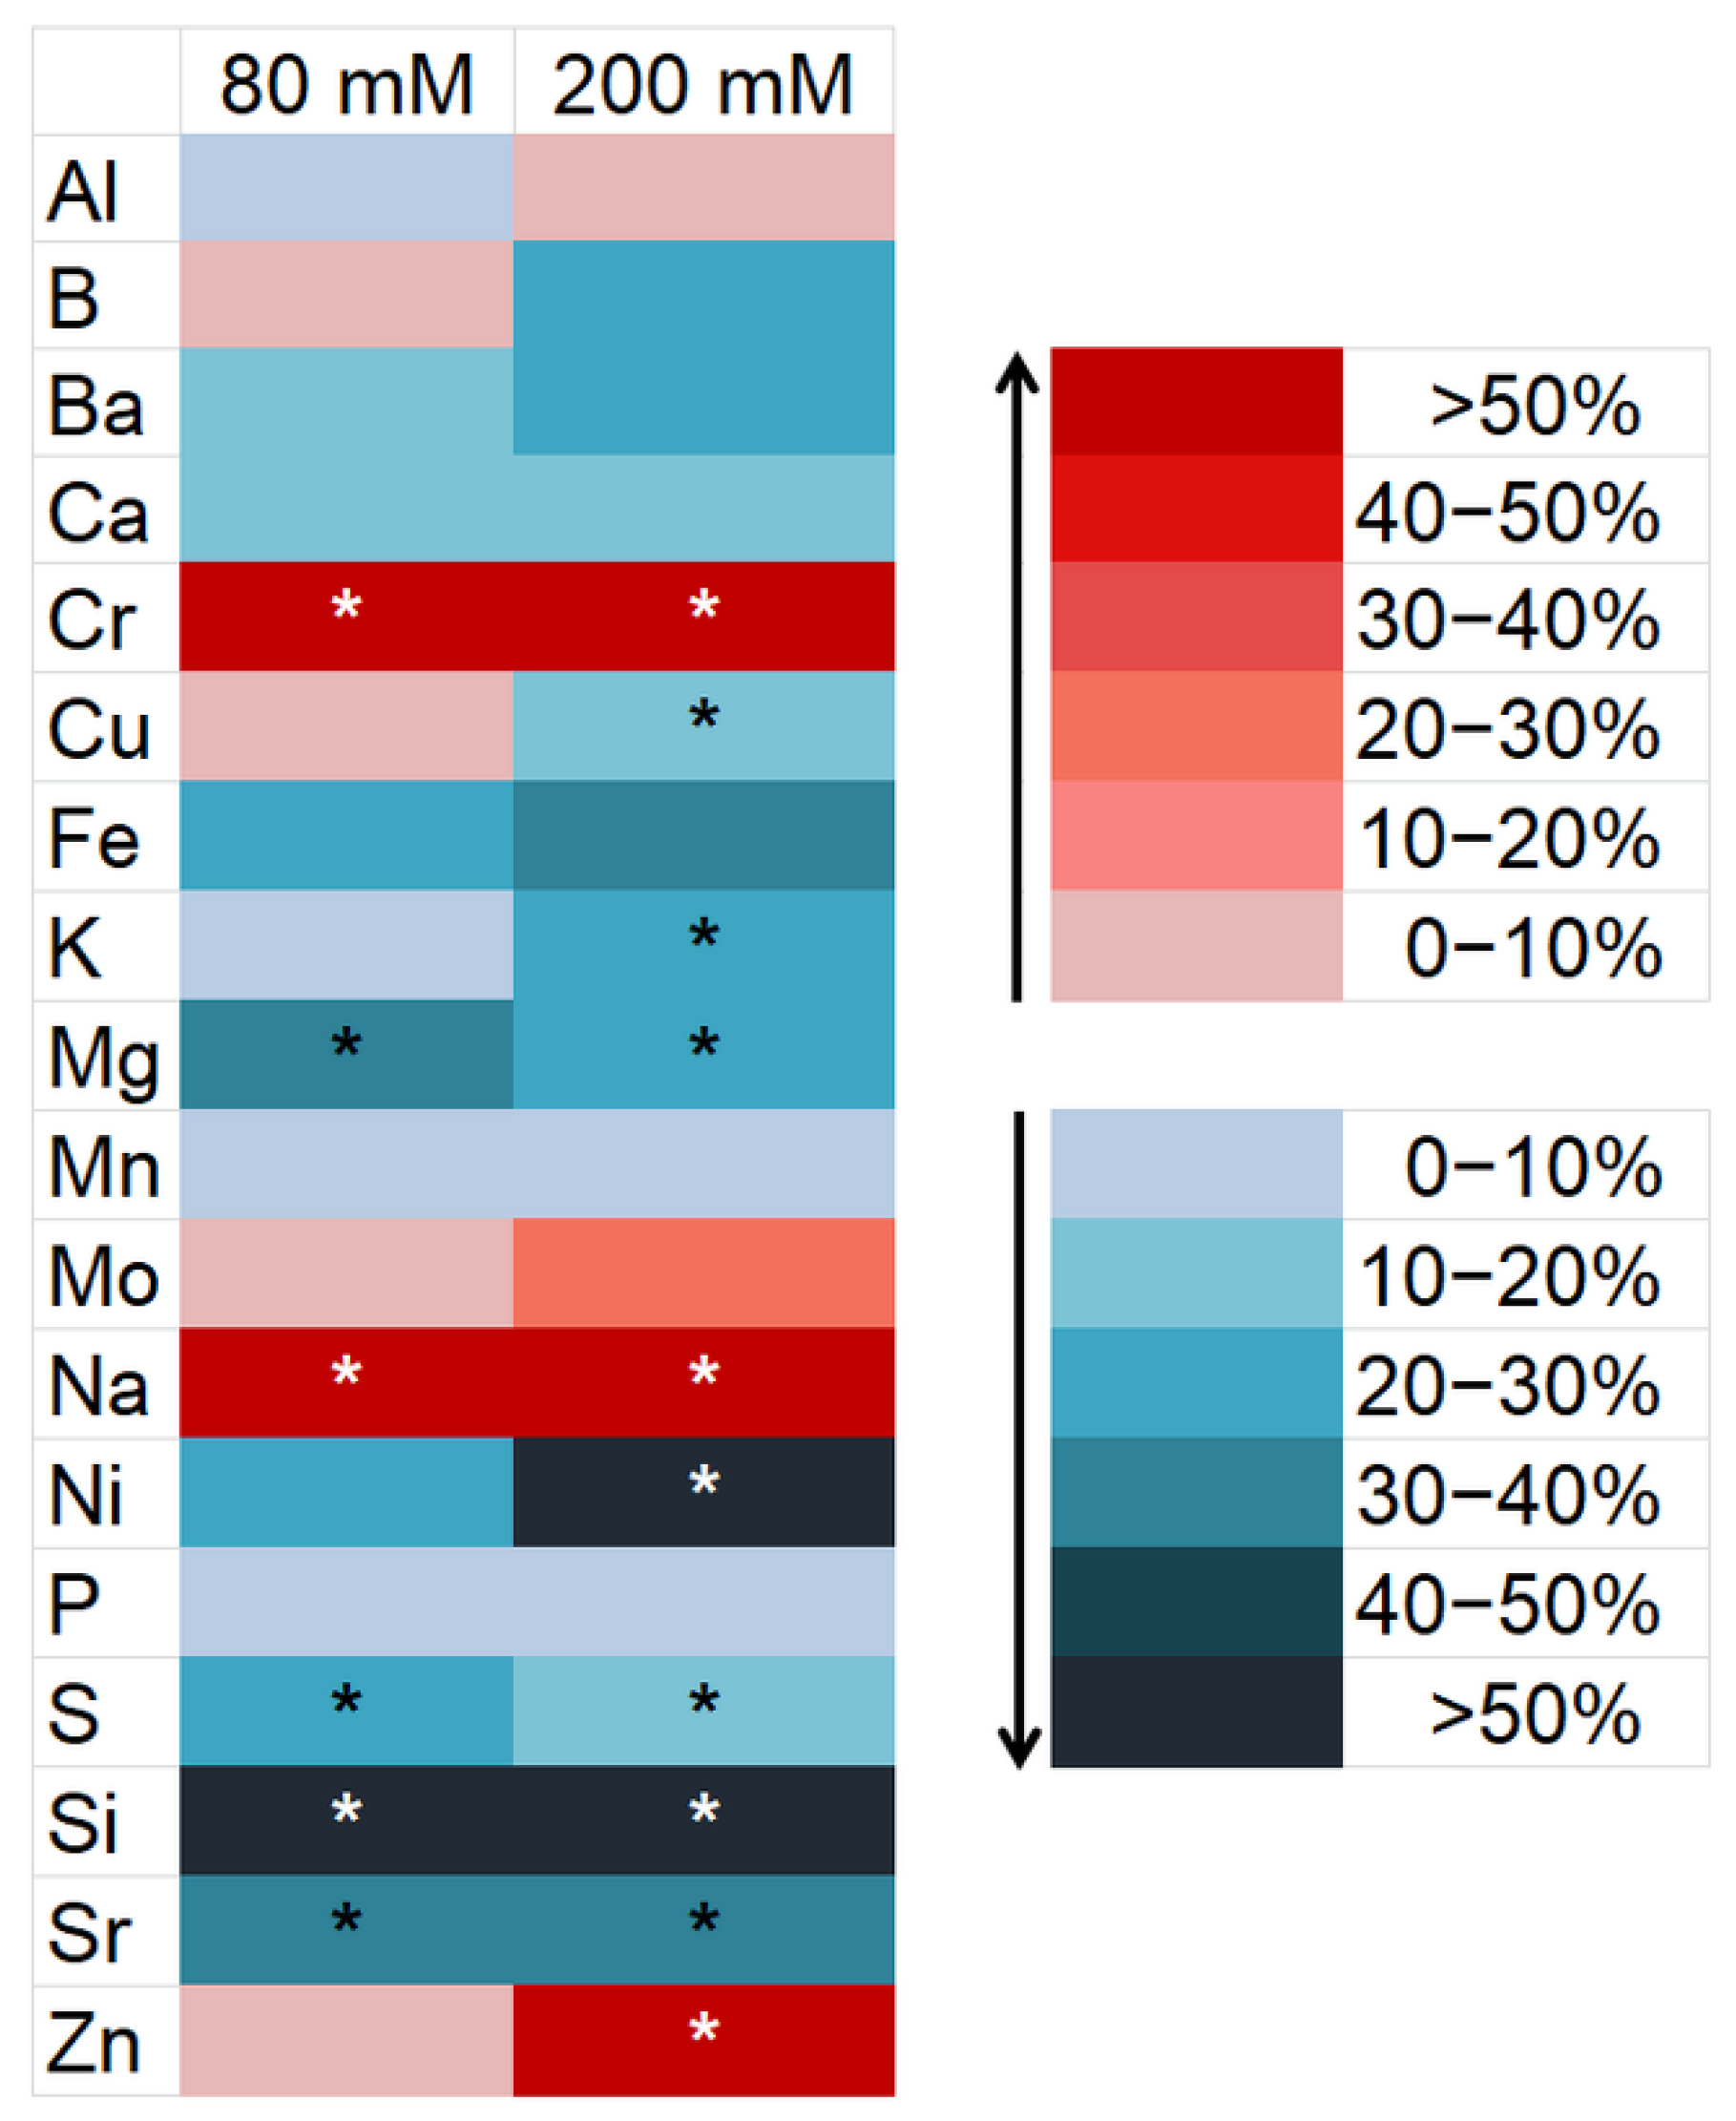
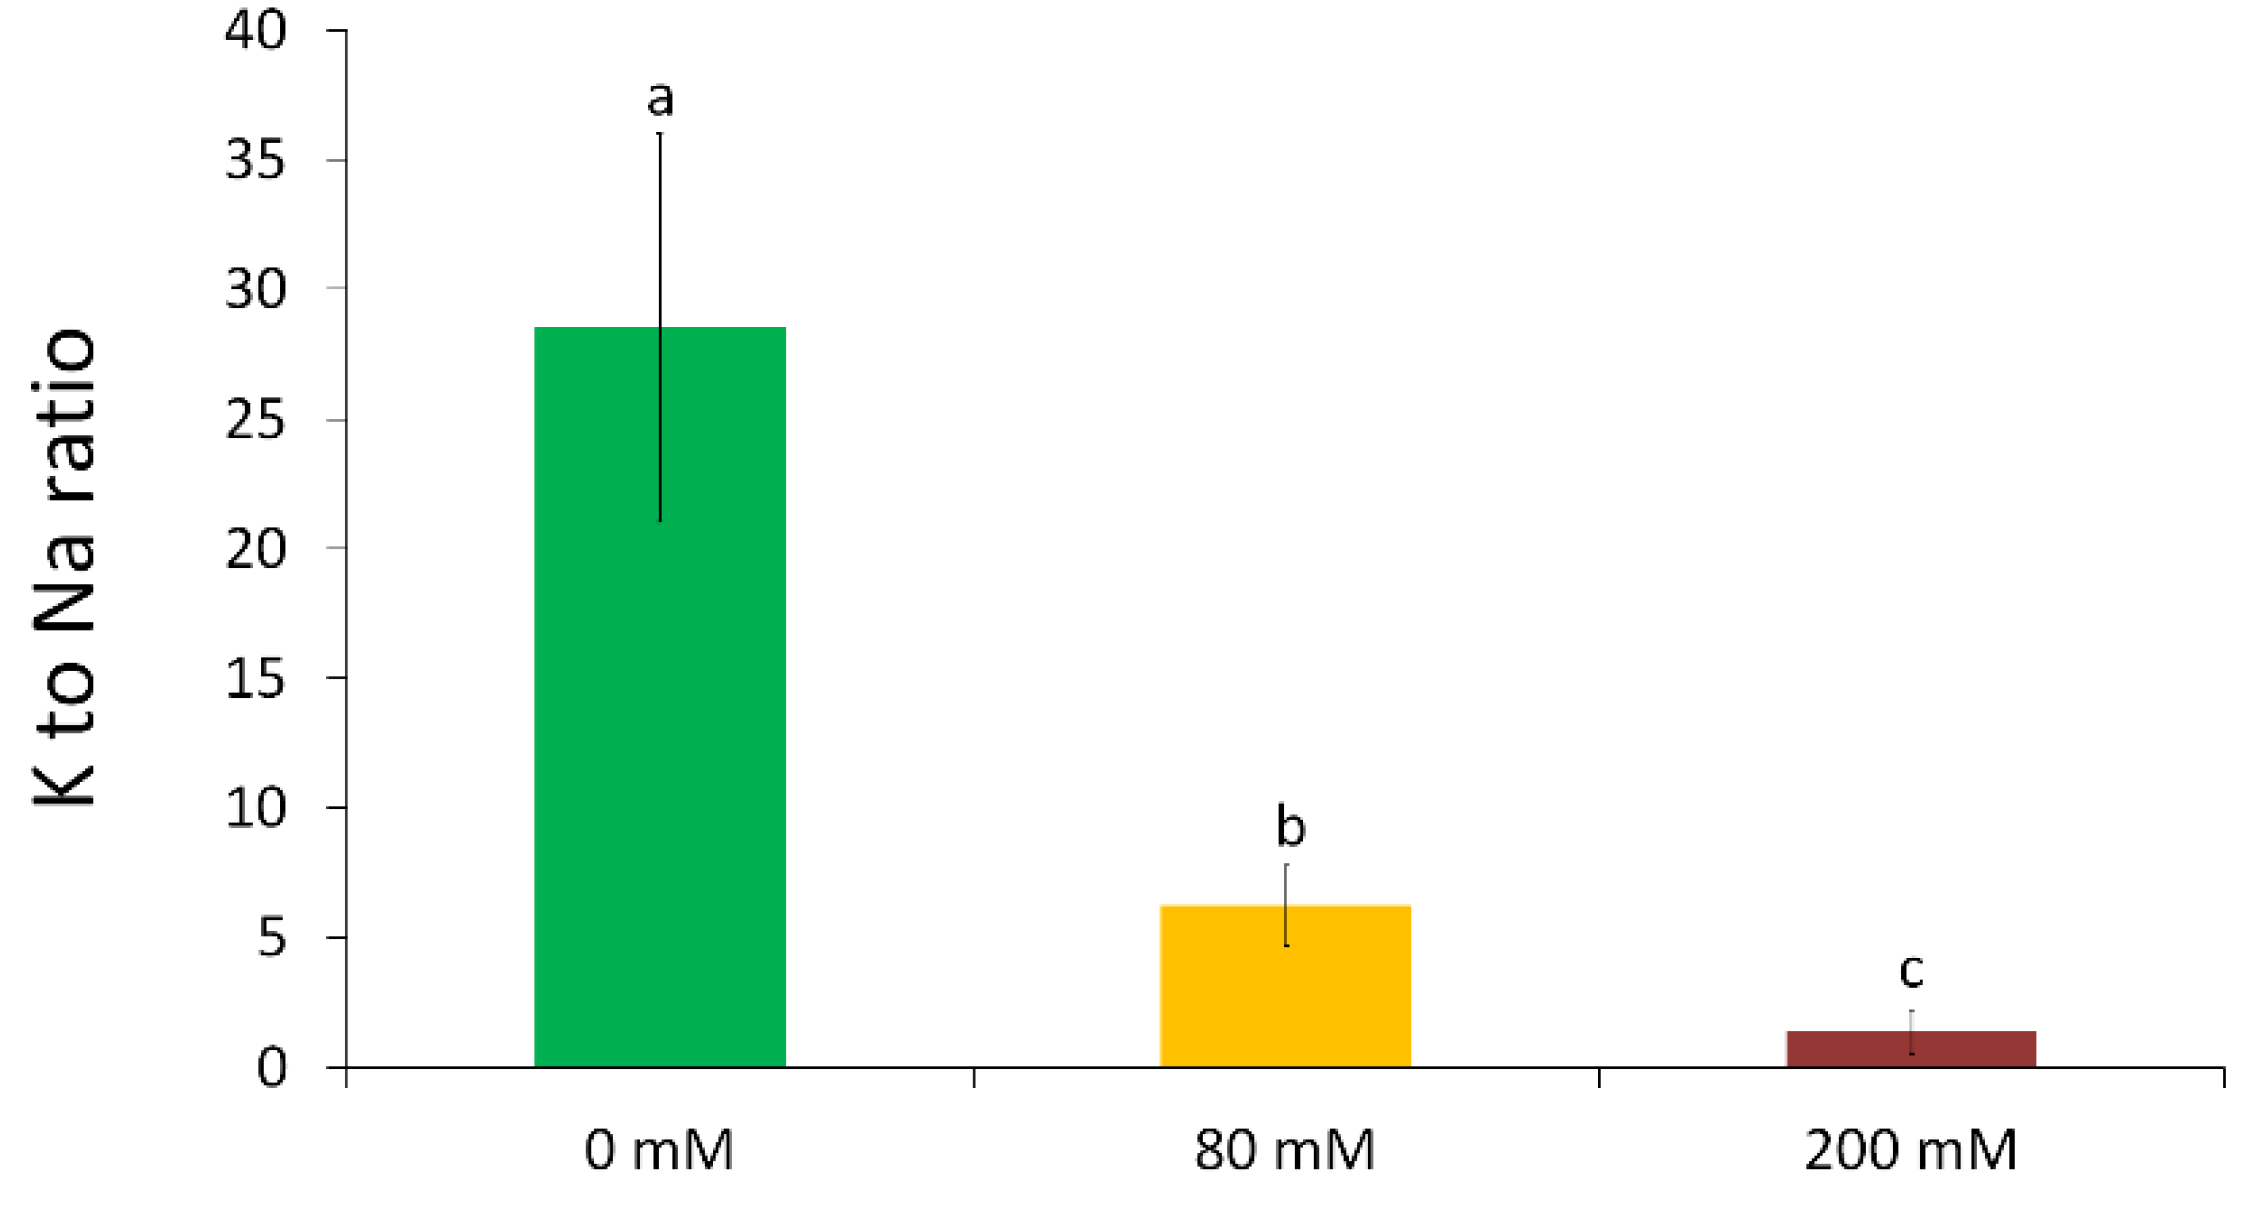
2.4. Determination of Element Concentration

The first fully developed leaves were harvested after 1 month of the alkaline salt treatment. Dried (2 days at 85 °C) samples were digested in ccH2O2 for 1 h, then in ccHNO3 for 15 min at 60 °C and 45 min at 120 °C. After filtration through MN 640 W paper (Macherey-Nagel, Düren, Germany), ion contents were measured by an ICP-OES (Inductively Coupled Plasma Optical Emission Spectrometer, Spectro Genesis, SPECTRO, Freital, Germany) simultaneous spectrometer with axial plasma viewing.

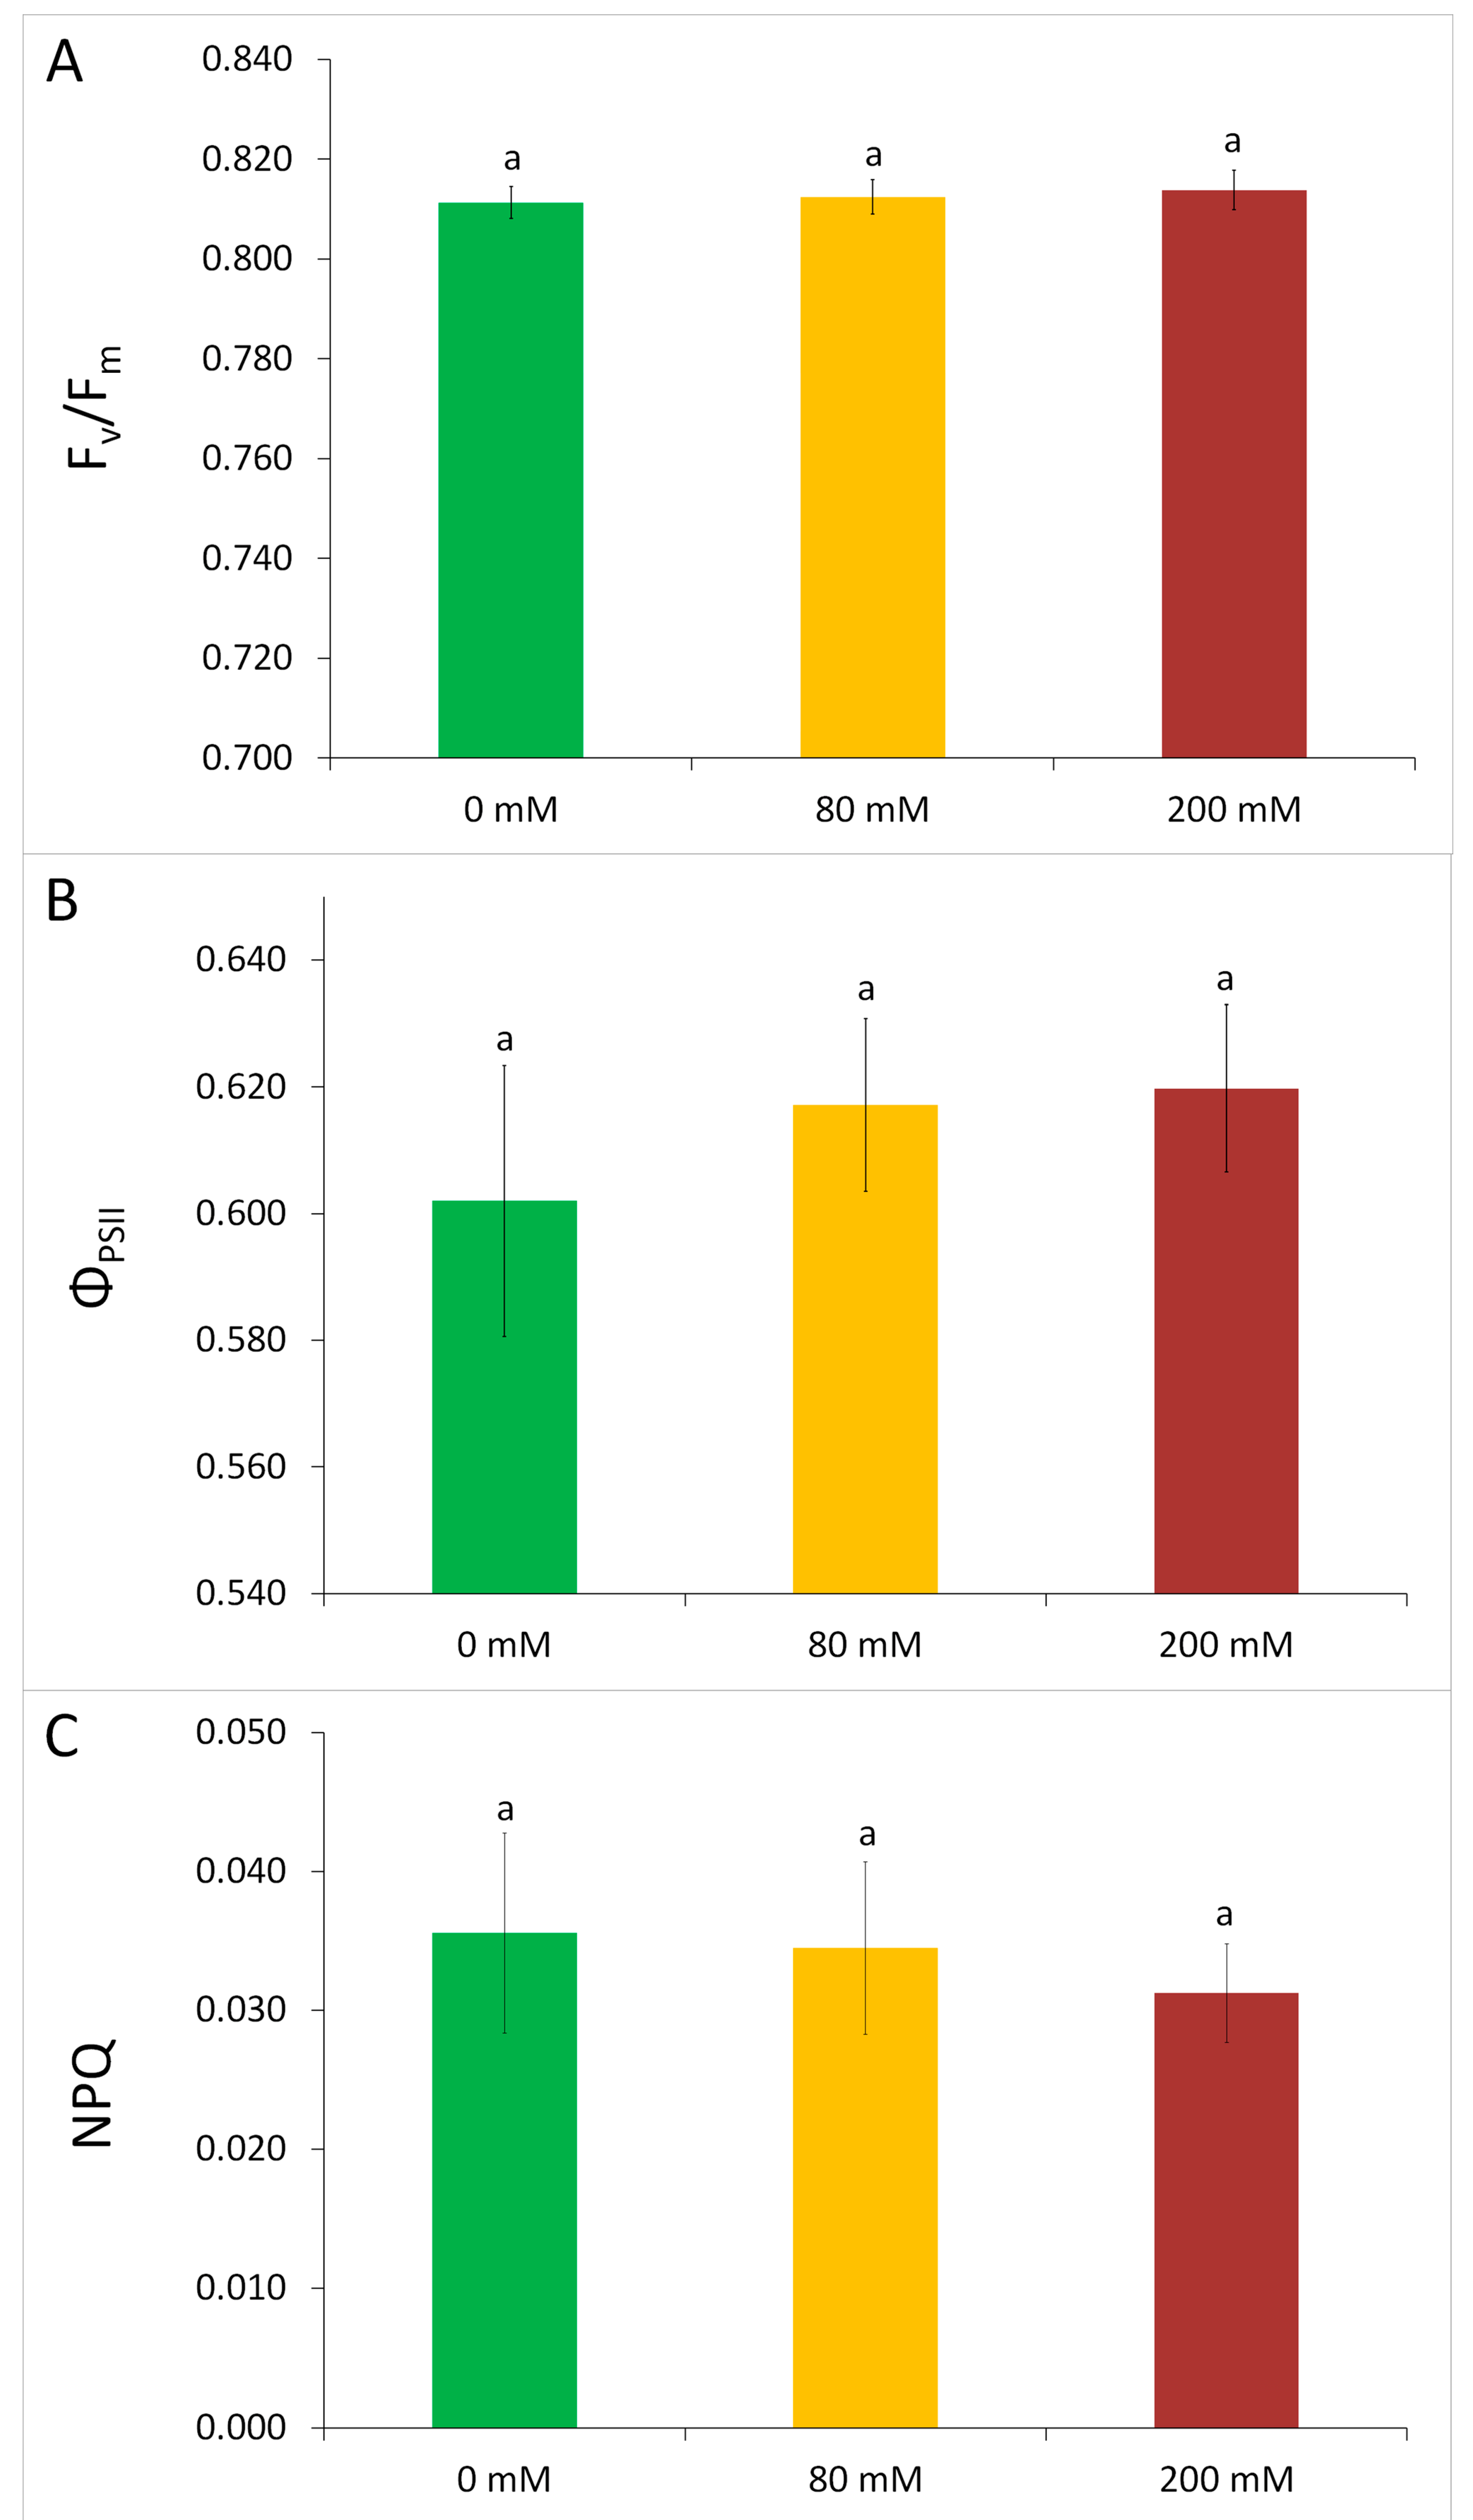
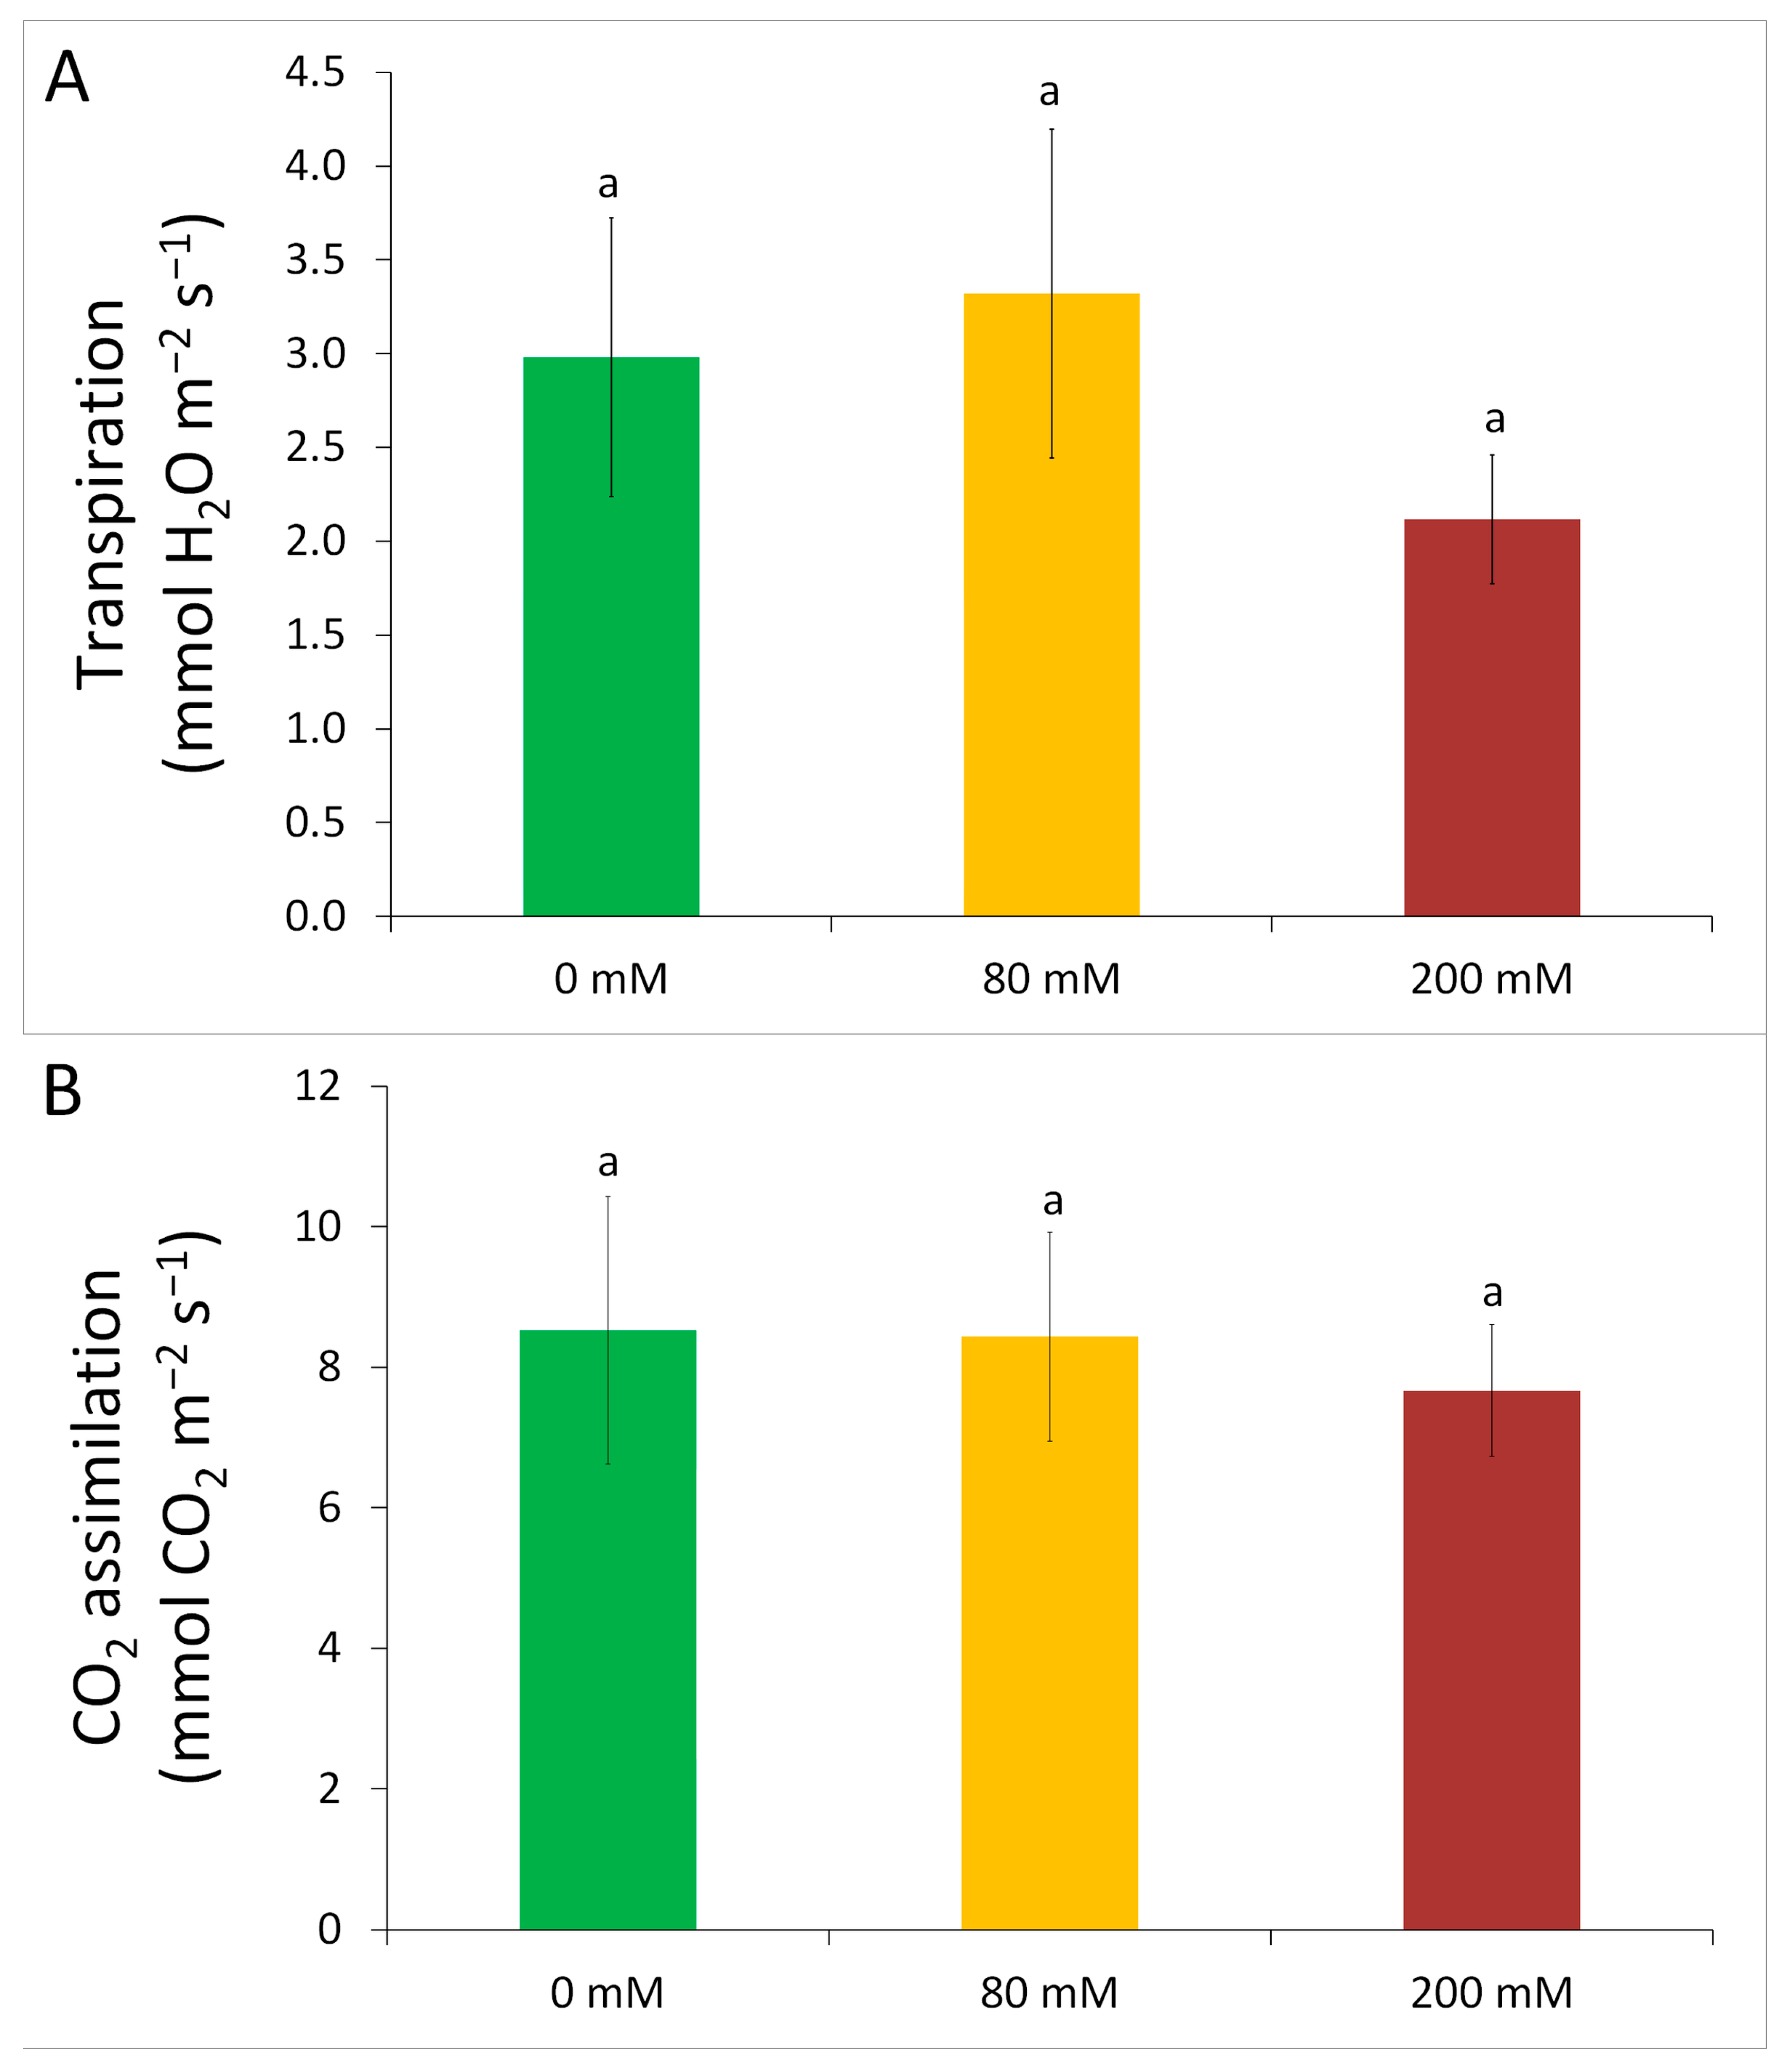
2.5. Measurements of Transpiration and Photosynthetic Performance

To measure photosynthetic activity, an LI-6800F portable photosynthesis system (LI-COR Biosciences, Lincoln, NE, USA) was applied using a 2 cm2 aperture for leaf samples. For environmental parameters, CO2 concentrations of 400 µmol mol−1 air and relative humidity of 60% with a flow rate of approximately 600 µmol s−1 were applied. To induce Chl a fluorescence, leaves were dark-adapted in the leaf chamber of the device until reaching a stable fluorescence signal and CO2 exchange rate in approx. 10 min. For actinic radiation, 600 µmol photons m−2 s−1 PPFD was set. Measurements of transpiration, CO2 fixation, and Chl a fluorescence were performed between 9 a.m. and 5 p.m. at random time points.

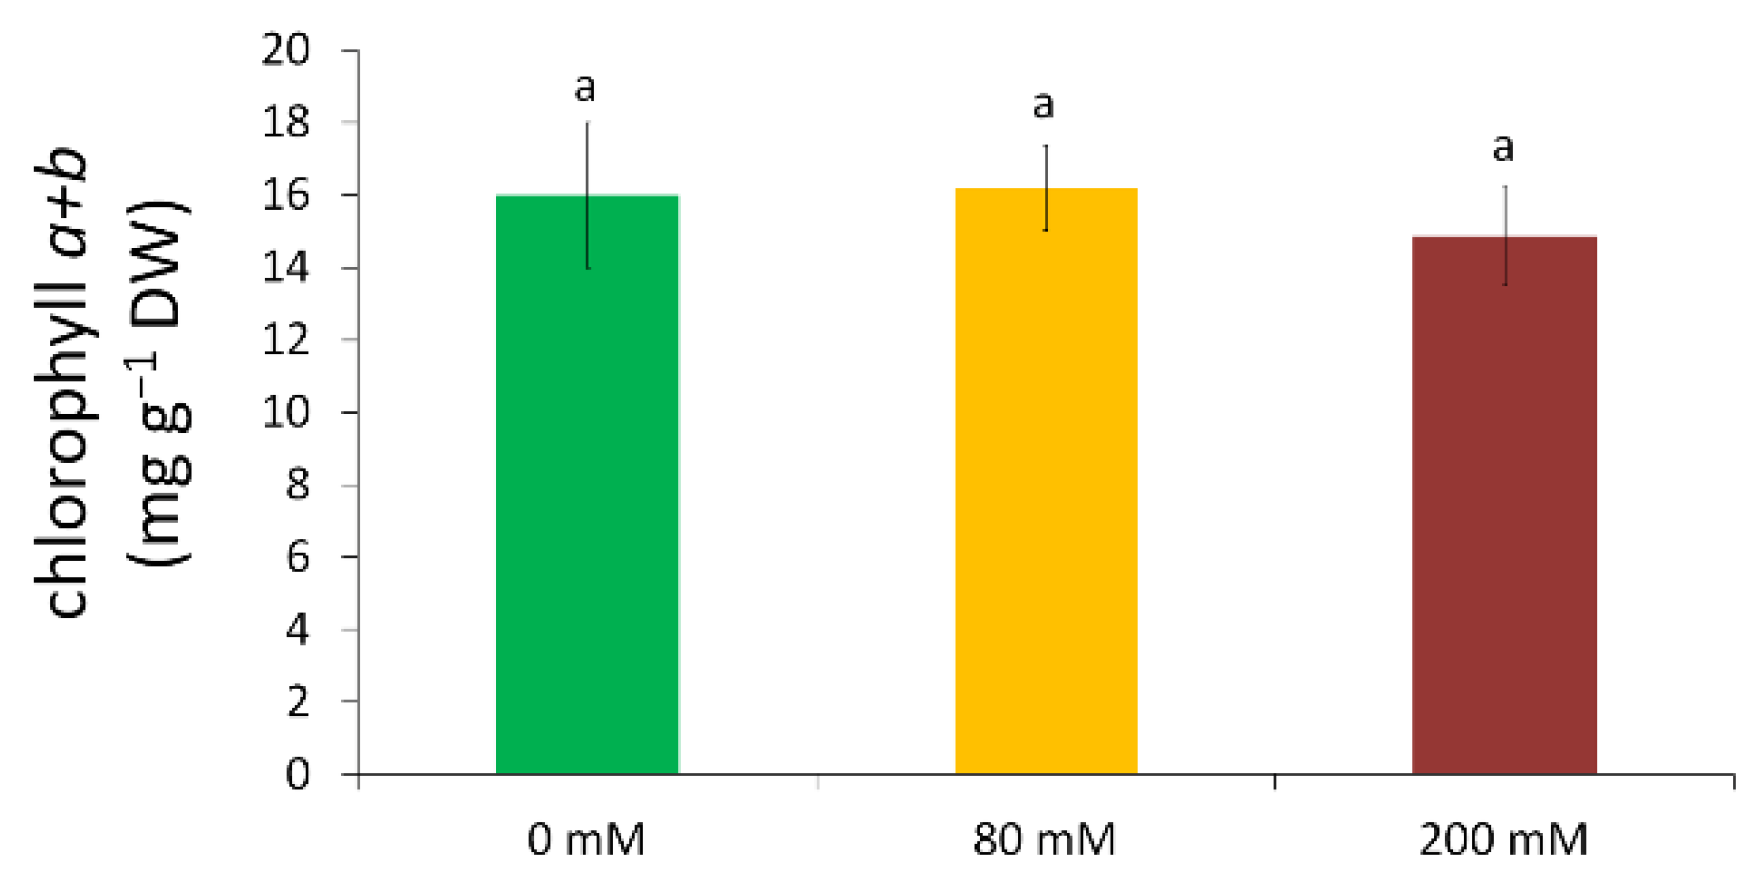
2.6. Determination of Chlorophyll Content

To measure the chlorophyll (Chl) concentration, samples taken from the youngest fully developed leaves were homogenized in 80% (v/v) acetone. After 5 min centrifugation at 10,000× g, the Chl content was determined spectrophotometrically (UV-2101PC, Shimadzu, Japan) according to [29]. Chl concentrations were calculated on a dry weight basis according to the water content measurements (Section 2.3).

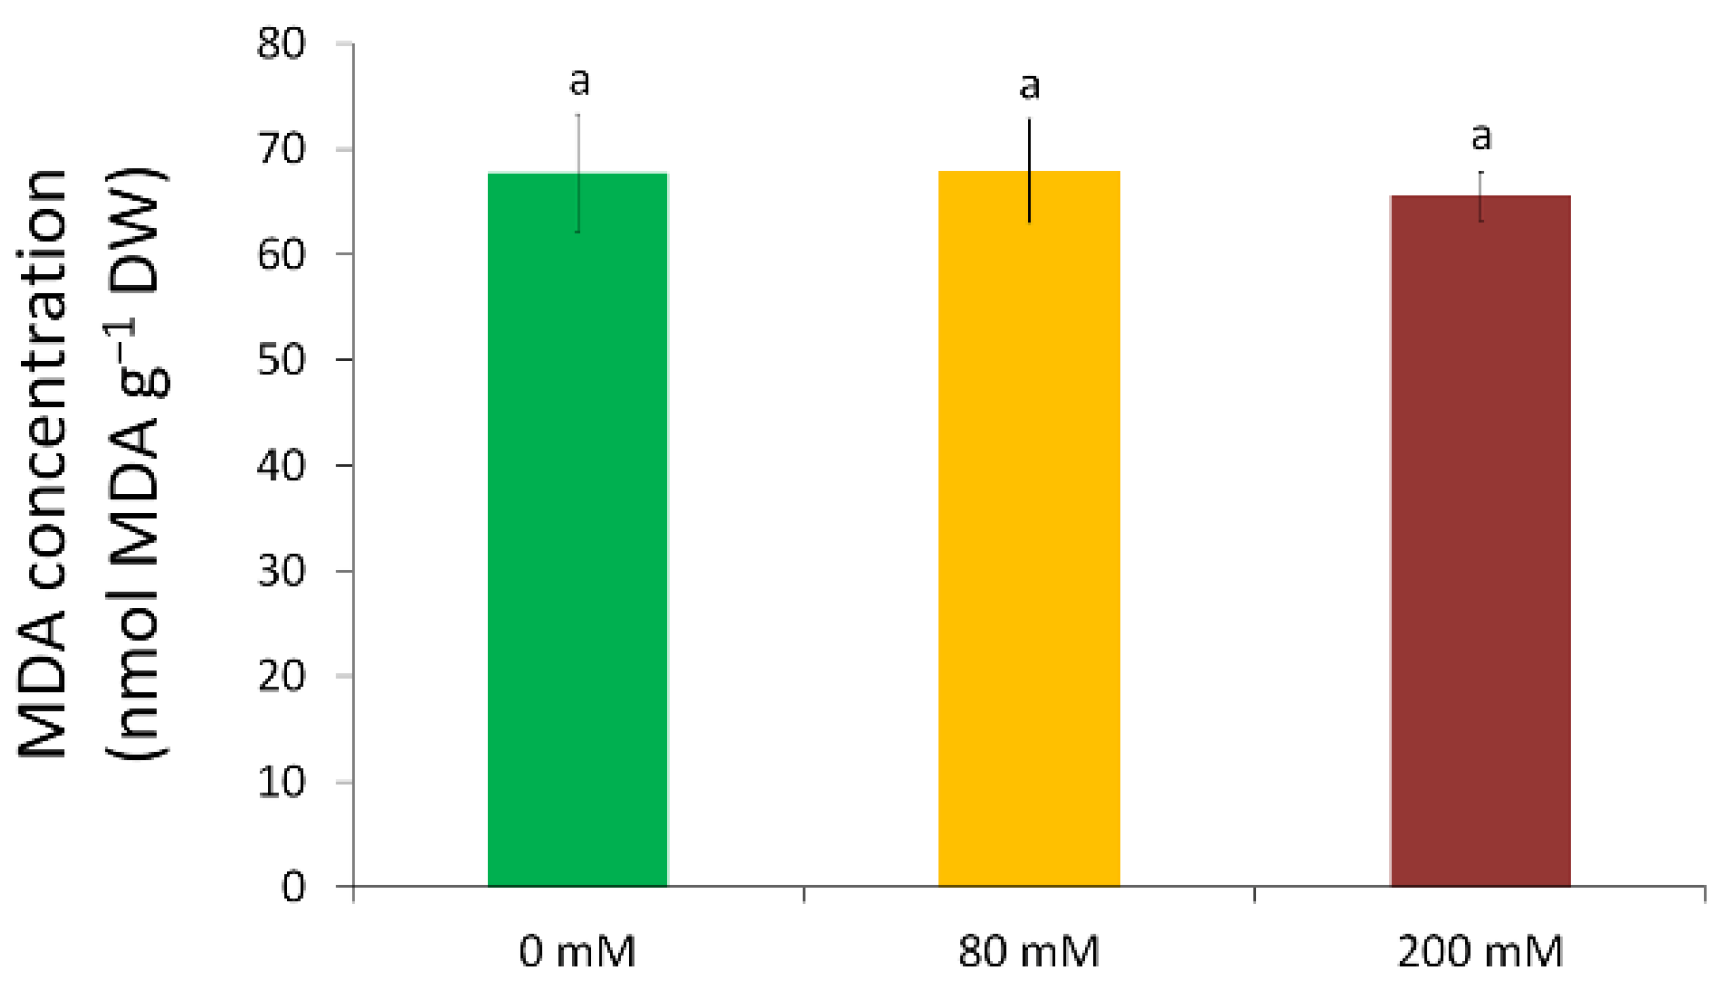
2.7. Malondialdehyde Content

The degree of lipid peroxidation was estimated by the concentration of its by-product, malondialdehyde (MDA). The assay was performed according to [30] with slight modifications. A total of 100 mg of leaf material was homogenized at 4 °C in 1.25 mL of 0.1% (m/v) trichloroacetic acid (TCA) and centrifuged at 15,000× g for 15 min. After centrifugation, 1 mL of 20% (m/v) TCA and 1% (m/v) thiobarbituric acid was added to 250 µL of the supernatant. This solution was incubated at 90 °C in a water bath for 1 h and was placed on ice to stop the reaction. Absorbance was recorded at 532 nm (ε = 155 mM−1 cm−1). MDA concentrations were calculated on a dry weight basis according to the water content measurements (Section 2.3).

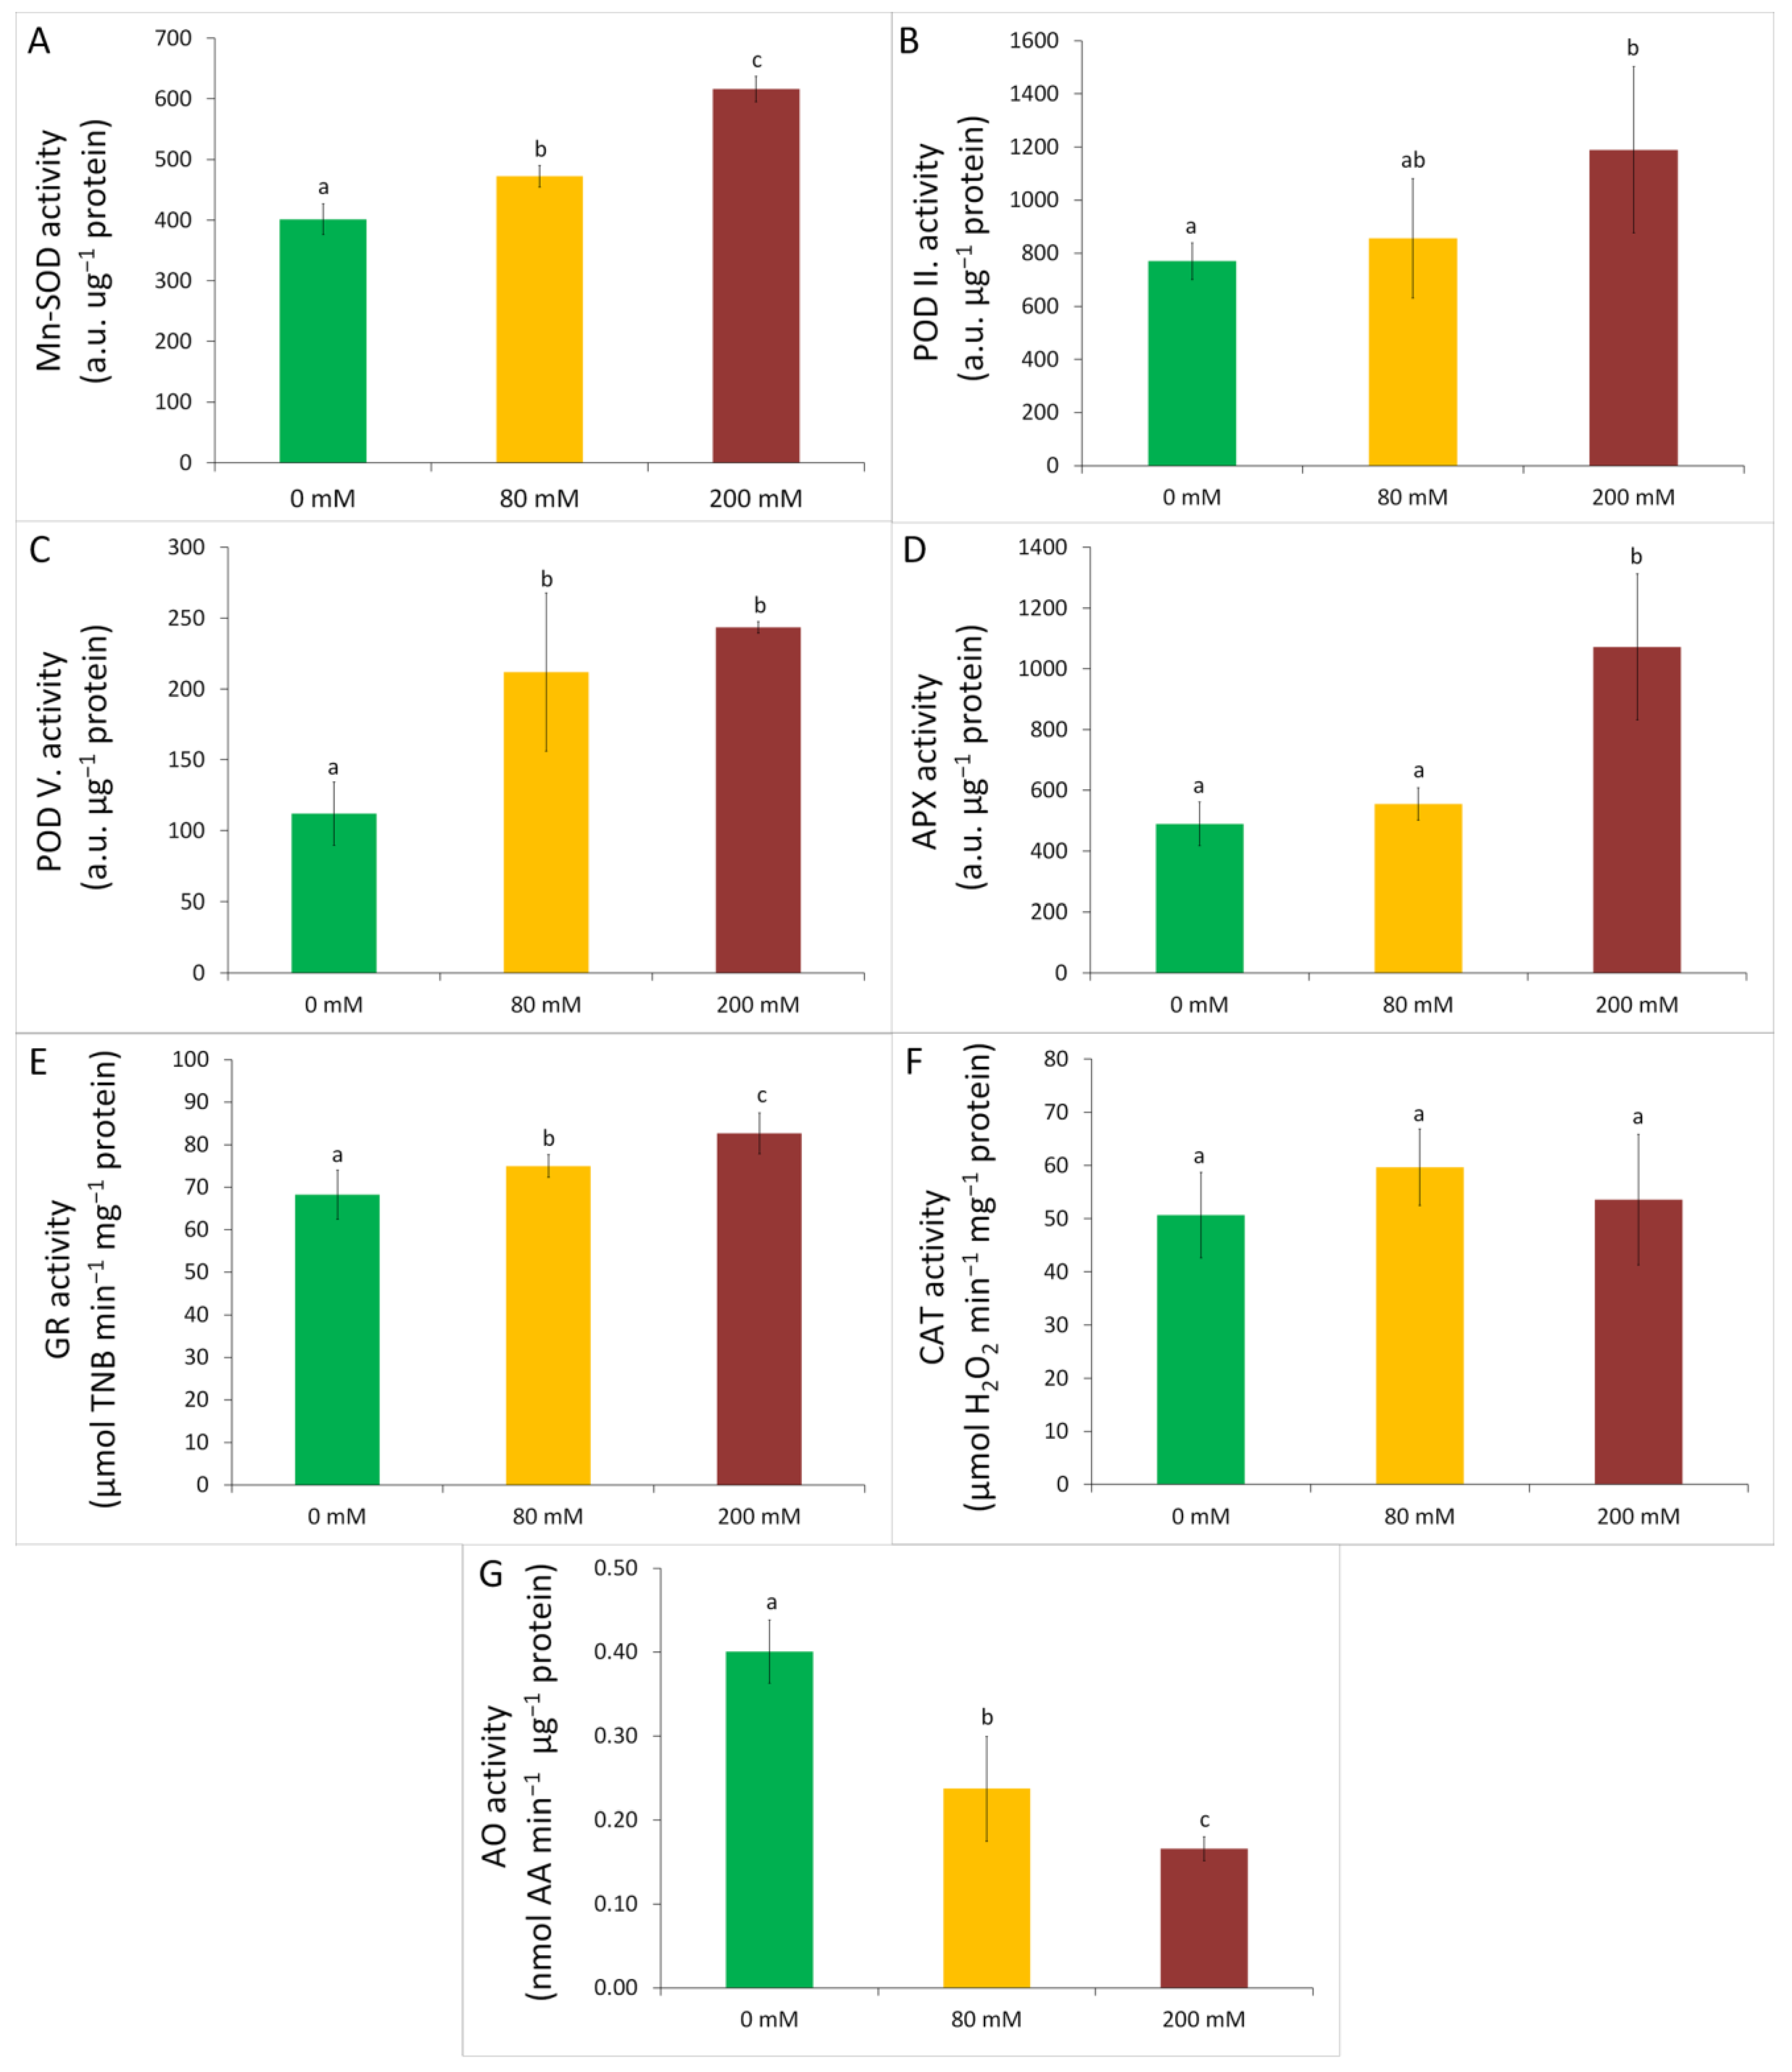
2.8. Determination of Superoxide Dismutase, Class III and Ascorbate Peroxidase Activity

Around 100 mg of fresh plant material was homogenized in 1 mL of extraction buffer (50 mM Na-K-phosphate buffer (pH 7.8), containing 0.1 mM ethylene diamine tetraacetic acid (EDTA), 5 mM cysteine, 0.1% (v/v) Triton X-100, and 0.1 mM phenylmethylsulfonyl fluoride (PMSF)) and the slurry was cleared by centrifugation at 20,000× g for 20 min. The samples were slightly solubilized (5 mM Tris-HCl (pH 6.8), 0.01% (m/v) sodium dodecyl sulphate (SDS), 0.1% (m/v) DTT, 10% (v/v) glycerol, and 0.001% (m/v) bromophenol blue)) before the separation. Protein complexes were resolved by polyacrylamide gel electrophoresis (PAGE) using 10–18% (m/v) gradient gels according to Laemmli [31] but only with 0.01% (m/v) SDS.
The enzymatic activities were normalized by the total soluble protein content which was calculated by comparing the total density of Coomassie-stained protein lanes to that of the protein standard lane (Fermentas PageRuler Plus Prestained Protein Ladder, lot: 00813689, Thermo-Fisher Scientific, Waltham, MA, USA). For densitometry, the gels were scanned with a Perfection V750 PRO flatbed colour scanner (Epson, Suwa, Japan) and evaluated using the Phoretix 4.01 gel analysis software (Phoretix International Ltd., Newcastle upon-Tyne, UK). All enzyme isoforms were detected based on the retardation factors.
The activity of superoxide dismutase (SOD; EC 1.15.1.1) was measured following [32] with some modifications. After the separation of native enzymes, the gel was incubated in a 50 mM Na-K-phosphate buffer (pH 7.8) containing 0.1 mM EDTA, 13 mM methionine, 60 μM riboflavin, and 2.25 mM nitro-blue tetrazolium (NBT) chloride for 20 min in darkness, then under the light until the colour reaction appeared in the gel. To stop the reaction, the gel was washed with deionized water and the bands were detected directly after staining. To identify the Fe-SOD isoforms, Cu/Zn-SOD isoenzymes were inhibited specifically by adding 1% (v/v) mercaptoethanol to the solubilization buffer, while the Mn-SOD isoforms were identified by incubating the gel in a staining buffer containing 5 mM H2O2 for 30 min, which inactivated both the Fe-SOD and Cu/Zn-SOD isoforms.
The activity of class III peroxidases (POD; EC 1.11.1.7) was determined according to Solórzano et al. [33] with modifications. After the separation of native enzymes, the gel was incubated in a staining solution containing 50 mM K-acetate buffer (pH 4.5), 3 mM H2O2, and 2 mM benzidine.
Ascorbate peroxidase (APX; EC 1.11.1.11) activity was assayed by the method of Mittler and Zilinkas [34] with slight modifications. The extraction buffer additionally contained 5 mM ascorbate. After the separation of native enzymes, the gel was incubated in 50 mM Na-K-phosphate buffer (pH 7.0), and 2 mM ascorbic acid (AA) solution for 30 min. Subsequently, the gel was incubated in 50 mM Na-K-phosphate buffer (pH 7.0), 4 mM AA, and 2 mM H2O2 for 20 min, then washed with 50 mM Na-K-phosphate buffer (pH 7.0). The APX activity was developed by placing the gel in 50 mM Na-K-phosphate buffer (pH 7.8), 28 mM TEMED, and 2.45 mM NBT. To stop the reaction, the gel was transferred into 10% (v/v) acetic acid.

2.9. Glutathione Reductase and Catalase Activity

The enzyme extracts were prepared by homogenizing around 100 mg of fresh leaf samples in 0.5 mM Tris buffer (pH 7.4) containing 3 mM MgCl2, and 1 mM EDTA and pelleted at 20,000× g for 20 min. The supernatant was used as the crude enzyme solution. For normalization, the protein content was determined by the method of Bradford [35] using bovine serum albumin as the standard. Absorbances were measured in the UV-VIS spectrophotometer.
Glutathione reductase (GR; EC 1.8.1.7) activity was determined by monitoring the reduction of 5,5’-dithio bis(2-nitrobenzoic) acid (DTNB) according to Smith et al. [36]. The reaction mixture (1 mL) contained 75 mM potassium phosphate buffer (pH 7.5), 0.75 mM DTNB, 0.15 mM diethylenetriaminepentaacetic acid (DTPA), 0.1 mM NADPH, and 100 μL of the enzyme extract. The reaction was initiated by adding 1 mM GSSG (oxidized glutathione). The increase in the absorbance at 412 nm, induced by the reduction of DTNB by GSH, was recorded at 25 °C for 3 min. An extinction coefficient for DTNB of 14.15 mM−1 cm−1 at 412 nm was used in calculations.
The activity of catalase (CAT; EC 1.11.1.6) was determined according to Aebi [37] by monitoring the rate of H2O2 decomposition at 240 nm in the reaction mixture (1 mL) consisting of 50 mM potassium phosphate buffer (pH 7.38), 20 mM H2O2, and the crude enzyme solution (25 µL). An extinction coefficient for H2O2 of 40 mM−1 cm−1 at 240 nm was used in calculations.

2.10. Ascorbate Oxidase Activity

Ascorbate oxidase (AO; EC 1.10.3.3) activity was determined according to Diallinas et al. [38] and Mosery and Kanellis [39] with a few modifications. Leaf samples were homogenized in buffer A (100 mM sodium phosphate (pH 6.5), 10% (v/v) glycerol, 0.5 mM PMSF, and 1.5% (m/v) polyvinylpolypyrrolidone (PVPP)) and allowed to stand on ice for 20 min with brief vortexing every 2 min. After centrifugation at 15,000× g for 15 min at 4 °C, the supernatant (soluble fraction) was filtered through Miracloth (Calbiochem) and assayed directly for AO activity by following spectrophotometrically the oxidation of AA at 265 nm.
The pellet (containing particles of cell wall, organelles, and membranes) was washed twice in buffer A and dissolved in buffer B (100 mM potassium phosphate (pH 6.5), 1 M CaCl2, and 0.5 mM PMSF) and vortexed for 20 min at 4 °C. The mixture was centrifuged again at 15,000× g for 15 min at 4 °C, and the supernatant containing cell wall proteins was assayed directly for AO activity. The AO activity was determined from the decrease in A265 at 25 °C in a reaction mixture (1 mL) containing 100 mM sodium phosphate buffer (pH 5.3), 0.5 mM EDTA, and 150 mM AA, 100× diluted in the enzyme extract. An extinction coefficient for AA of 14 mM−1 cm−1 at 265 nm was used in calculations. Normalization was performed as described above for GR and CAT.

2.11. Statistical Analysis

Three plants were grown in each of five the independent pots, i.e., 15 plants per treatment. Random samples were taken individually for all measurements except for the element composition for which pooled leaf material was taken. All the measurements were repeated three times with three to five biological and three technical replicates; the data presented are means and standard deviation. Statistical analysis was performed using the software package R (v2021.09.0 R Studio Boston, MA, USA). For the comparison of the data, the analysis of normality using the Shapiro–Wilk test (at 99% level of confidence) was performed and followed by Levene’s test for the homogeneity of variance (95% confidence level). When normality and homogeneity of variance assumptions were verified, the data were evaluated by analysis of variance (ANOVA) followed post-hoc by the Tukey’s range test. Statistically different groups (p < 0.05) are indicated by lowercase letters.

3. Results

3.1. Physiological Tolerance to Alkaline Salt Treatment in Arundo donax

The growth traits of the plants (shoot length, diameter at shoot base, and leaf surface) were not affected significantly by the applied salt treatments (Supplementary Table S2). Nevertheless, some alterations in the water regime of the plants were recorded after 1 month of treatment, primarily affecting the water content. Although RWC was unchanged at 80 mM salt concentration, a significant 22.3% decrease was observed at 200 mM in leaves (Figure 1A). Consequently, alterations in WSD resulted in an opposite trend (Figure 1B): 200 mM treatment induced a 19.8% increase compared with control plants.
Although the water content was affected in the leaves, the impact of the treatment was not significant on the transpiration intensity (Figure 2A), nor the CO2 assimilation (Figure 2B). Since carbon assimilation in the C3 species Arundo donax is primarily dependent on the stomatal conductivity, the stability of the above two parameters indicates that slight alterations in the water regime did not impact stomatal movements.
Carbon assimilation is also determined by the operation of the photosynthetic apparatus. The maximum quantum efficiency of photosystem II (PSII) reaction centres showed no alterations in response to the applied treatment (Figure 3A). Similarly, no alteration was found in the light-adapted actual quantum efficiency of PSII reaction centres, nor the non-photochemical quenching of the photosynthetic apparatus (Figure 3B,C). Furthermore, a tendency to increase PSII quantum efficiencies was recorded in response to the elevated salt concentration treatments together with a tendency to decrease in the non-photochemical quenching (the differences were not significant).
In line with the above observations on the stable operation of the photosynthetic apparatus, total Chl concentration proved to be highly resilient to the alkaline salt treatments (Figure 4).

3.2. Changes in the Element Composition

The applied alkaline salt stress led to a remarkable accumulation of Na in Arundo donax leaves. Interestingly, the K content in the leaves remained unchanged at 80 mM but decreased significantly upon 200 mM alkaline salt stress (Figure 5). The balance of the reduced leaf K and a pronounced increase in Na content resulted in a highly decreased K to Na ratio at 200 mM alkaline salt stress (Figure 6). The concentration of Zn also significantly increased especially at 200 mM while the uptake or translocation was significantly decreased or at least showed a decreasing trend for many of the investigated elements such as Ba, Ca, Cu, Fe, Mg, Ni, S, Si, and Sr (Figure 5).

3.3. Oxidative Stress and Antioxidative Defence

The concentration of the lipid peroxidation by-product MDA is a well-known indicator of oxidative stress. In our experiments, no significant difference was observed in the MDA content indicating the action of an enhanced defence mechanism against oxidative stress (Figure 7). The significantly increased activity of Mn-SOD, POD, and APX isoforms and GR (Figure 8A–E) at higher salt concentrations also supports the efficient induction of the components of the antioxidant system.
SOD enzymatic activities were determined by in-gel activity staining after separating the isoforms via native PAGE. SOD isoform groups were identified by the selective inhibition of the activity of Fe-SOD and Cu/Zn-SOD isoforms (Supplementary Figure S1). Of the 11 separated SOD isoforms (Figure S2), Rf1 = 0.19 ± 0.01, Rf2 = 0.22 ± 0.01, and Rf3 = 0.26 ± 0.01 were identified as Mn-SOD isoforms (Supplementary Figure S1). While the activity of the Mn-SOD isoforms increased, none of the Fe-SOD and Cu/Zn-SOD isoforms changed significantly by the applied treatments (Figure 8A, Supplementary Figures S2 and S3). Similar to the SOD isoforms, the activity of APX was also determined by in-gel staining after separating native leaf proteins. Using the applied solubilization protocol, as in previous reports [34], a single APX activity band was detected (Rf1 = 0.76 ± 0.02; Supplementary Figure S4). The APX activity increased significantly only at 200 mM alkaline salt stress (Figure 8D). Among the triggered enzyme activities, the enhancement in APX activity was the highest (approx. two-fold increase) compared with the untreated control. Alkaline salt stress also triggered the GR activity, leading to a 9.9% and 21.1% increase in leaves of plants treated with 80 mM and 200 mM alkaline salt concentrations, respectively, compared with the control (Figure 8E). In contrast to the activities of Mn-SODs, APX, GR, PODII, and PODV (see below) the applied treatment induced no alteration in the CAT activity of leaves, thus the effect of the treatments remained not significant (Figure 8F).
Regarding the antioxidative enzymes in the apoplast, the activity of 10 POD isoforms was also determined after separation by native PAGE and using in-gel detection (Supplementary Figure S5). Among these isoforms, salinity stress activated PODII (Rf2 = 0.032 ± 0.003) and PODV (Rf5 = 0.158 ± 0.009) isoforms while no other POD isoforms were either induced or suppressed by the applied treatments (Figure 8B,C; Supplementary Figure S6). In contrast to PODs, the activity of the cell-wall AO was significantly decreased by alkaline salt treatments (Figure 8G). The trend of the decrease was linear and proved to be significant even at 80 mM alkaline salt stress.

4. Discussion

Under salinity stress conditions, plants also suffer from osmotic stress due to the high difference between the water potential in the soil and the plant tissues [40,41]. Based on our results, 80 mM salt concentration was well-tolerated by Arundo donax while a significant but not serious drop was observed in the water balance at more severe salinity stress (Figure 1A). The treatments did not even appear in the shoot growth parameters referring to a very efficient tolerance mechanism (Supplementary Table S2).
Salt tolerant plants usually exhibit lower values of water saturation deficit (WSD) compared with susceptible ones [42,43]. WSD in Arundo donax was substantially increased with increasing salt levels; however, it was significant only under extremely high salt stress (Figure 1B). Our data reflect that salt tolerance of Arundo donax enables them to maintain the osmotic potential in the leaf cells by ion uptake adjustment at 80 mM salt treatment. At this treatment, a moderate level of Na accumulation was counterbalanced by a well-conserved K uptake (Figure 5 and Figure 6). Transporters identified in grasses such as high-affinity K+ transporters (HKT) mediate high-affinity K+ uptake during salt stress against an electrochemical gradient and consequently help the plants to maintain their K+/Na+ balance [44]. However, the prevailing ion composition in the extracellular medium affects the transport abilities of various HKT channels by changing their selectivity or ion transport rates. At high Na+ concentration and in the absence of K+, OsHKT2;2 facilitates the entry of Na+ and competitively inhibits the uptake of K+ ions which is an essential element for growth and development [45]. Although the main contributing factor to salt stress is sodium, halophytes actively accumulate Na+ in the leaves and use it as an osmotically active agent as well as an alternative strategy to protect their cells against the toxic effects of excess sodium [46]. Arundo donax maintained a high K to Na ratio in the leaves at 80 mM salt treatment but at 200 mM the ratio declined to almost one (Figure 6). At the 200 mM salt treatment, the normal level of K+ uptake could not be maintained against Na+ and the cellular osmotic balance was probably preserved by the synthesis of different metabolites such as amino acids and soluble sugars [47].
Besides the decrease in shoot K concentration, other macronutrients such as Ca, Mg, and S were found to decrease (Figure 5). The transport of other micronutrients and trace elements also showed a general decreasing tendency except for Zn and Cr. Similar characteristic changes were found in barley seedlings exposed to elevated Na concentration. In tolerant and sensitive genotypes these elemental patterns together with metabolite patterns were tendentiously changing and suggested to contribute to the development of salt tolerance mechanism [48].
The photosynthetic activity proved to be resistant to high salinity and alkaline soil conditions. Although CO2 assimilation and transpiration were slightly reduced at 200 mM salt treatment, medium salt concentration did not affect these parameters or even slightly increase the transpiration. Decreased CO2 uptake can be explained by the stomatal closure and inhibited CO2 inflow related to the reduction in water absorption under salt stress [49]. The stable gas exchange and especially CO2 uptake show that neither the stomatal regulation nor the CO2 assimilation was significantly corrupted in a wide range of alkaline salt treatments. This may enable Arundo donax plants to support the defence mechanisms with a stable supply of metabolites and energy. The proposed decrease in the stomatal conductance did not affect the activity of the photosynthetic electron transport chain (Figure 3). Both maximal and actual quantum efficiencies of PSII remained intact under the applied salt levels. The unstressed status of the photosynthetic apparatus is also indicated by the unchanged NPQ among the treatments. In comparison, [50] reported that under similar conditions ΦPSII was decreased while non-photochemical quenching was increased, slightly reducing the overall photosynthetic efficiency in maize. In Arundo donax, high stability of the photosynthetic electron transport was found which together with the unaffected Chl content of leaves (Figure 4) underlines the high physiological tolerance of this plant to alkaline salt stress.
Salt stress generally increases the formation of reactive oxygen species (ROSs) in non-tolerant plant species [51,52]. To counterbalance the toxicity of ROS, a defence mechanism involving enzymatic antioxidants and non-enzymatic components exists in plant cells [53,54,55]. Since in our experiment only a moderate increase and only at 200 mM treatment was found in the MDA content (Figure 7), results indicate that plants tolerated the conditions effectively and only high saline-alkaline stress had any effect on their oxidative stress status. To reveal the background of this defence, we involved both symplastic and apoplastic antioxidative enzymes in the analysis. The applied stress conditions led either to triggered or unaffected enzyme activities, but none of the investigated defence enzymes indicated a suppressed activity. In consequence, Mn-SOD, APX, and GR proved to be positively affected by the stress conditions. Although APX and GR are both present in plastids and mitochondria, the unaffected plastidial Cu/Zn-SOD and Fe-SOD activities suggest that mitochondrial enzyme activities might be responsible for the increased APX and GR activities [56]. In accordance, the activity of CAT that is primarily associated with glyoxysomes also remained constant. In wheat and barley, increased GR activity was also associated with salt stress [57]. Since Na transport mechanisms require ATP, an increased mitochondrial ATP generation may be involved in the tolerance. Thus, increased enzyme activities are suggested to be associated with enhanced mitochondrial activities. Since neither chloroplast functions were found to be affected, nor were plastidial SOD isoforms triggered, this proposed enhanced mitochondrial activity may supply the energy required for the defence.
Under stress conditions, ROSs are also generated and accumulate in the apoplast, thus extracellular antioxidative capacity is also involved in the defence. Among the apoplastic enzymes, class III PODs are involved in the peroxidation-based polymerization of phenolic compounds thus contributing to the formation of lignified secondary cell walls [58]. As POD enzymes utilize H2O2, their enhanced activity also contributes to the regulation of apoplast H2O2 levels. Since among POD isoenzymes, the applied stress triggered the activity of two isoforms, the enhanced synthesis of polyphenolic compounds contributed to both biomass production and antioxidative defence. Along with PODs, AO also utilizes apoplastic H2O2 to oxidize AA into monodehydroascorbate (MDHA). Nevertheless, AO activity also contributes to the depolymerization of the plasma membrane and thus induces ion uptake. Dehydroascorbate produced by disproportionation of MDHA promotes cell wall loosening and cell enlargement [59]. Since excess Na uptake into the cytoplasm is a significant problem under salinity stress, suppression of AO seems to be related to defence mechanisms against Na uptake. Moreover, AO activity was previously indicated to be sensitive to the presence of salicylic acid (SA). In rice seedlings, SA accumulation inhibited AO activity under salt stress [60], but SA also suppresses the transcript amount of AO encoding genes [61]. Taken together, suppressed AO activity is a result of enhanced SA productions. Thus, AO does not contribute to regulating apoplast H2O2 under salt stress, but its low activity is an important defence mechanism against facilitated Na uptake into the cytoplasm.

5. Conclusions

In this study, two levels of alkaline salt treatment triggered a well-characterized antioxidative response in Arundo donax ‘Blossom’ plants which were able to defend leaf cells against oxidative stress. Our data suggest enhanced mitochondrial but unaffected plastidial activity. Survival under saline conditions depends not only on the activation of the antioxidative defence system but the tolerant plants synthesize low molecular mass compounds and have also evolved essential strategies to control the transport and accumulation of toxic ions in parallel with the rearrangements of nutrient and metabolite transport. Our study proves that biomass production with Arundo donax plants may be a good alternative to sensitive crops in areas affected by salinity or alkaline salt accumulation.

Supplementary Materials

The following supporting information can be downloaded at: https://www.mdpi.com/article/10.3390/agronomy12071589/s1, Figure S1: The determination of SOD isoform groups by in-gel activity staining of PAGE-separated native leaf proteins; Figure S2: In-gel SOD activity staining of PAGE-separated native leaf proteins extracted from Arundo donax plants after 1 month of alkaline salt treatment; Figure S3: The combined activity of different SOD isoform groups in total leaf proteins extracted from Arundo donax plants after 1 month of alkaline salt treatment; Figure S4: In-gel APX activity staining of PAGE-separated native leaf proteins extracted from Arundo donax plants after 1 month of alkaline salt treatment; Figure S5: In-gel POD activity staining of PAGE-separated native leaf proteins extracted from Arundo donax plants after 1 month of alkaline salt treatment; Figure S6: The activity of the separated ten POD isoforms in total leaf proteins extracted from Arundo donax plants after 1 month of alkaline salt treatment; Table S1: Total HNO3-H2O2-extractable concentration of macro and micro and trace elements in the soil applied in the experiments; Table S2: Growth and development parameters of Arundo donax plants; Table S3: The element content of Arundo donax leaves.

Author Contributions

Conceptualization, Á.S. and F.F.; Methodology, Á.S. and B.M.; Formal Analysis, B.M., L.P., V.A.C.S., Z.M., Á.S. and F.F.; Data Curation, B.M.; Writing—Original Draft Preparation, B.M.; Writing—Review and Editing, F.F., Á.S., L.S., L.O. and C.G.; Visualization, B.M.; Supervision, C.G.; Project Administration, F.F. All authors have read and agreed to the published version of the manuscript.

Funding

This work was supported by grants from the National Research, Development, and Innovation Office of Hungary (NKFIH K-132241, GINOP 2.2.1-15 2017-00042) and by the European Structural and Investment Funds (VEKOP-2.3.3-15-2016-00008).

Institutional Review Board Statement

Not applicable.

Informed Consent Statement

Not applicable.

Data Availability Statement

Not applicable.

Acknowledgments

Arundo donax plant material was supplied by Melinda Tóth-Szabó and Sándor Pákozdi sr. (Arundo BioEnergy Ltd., Budapest, Hungary). The authors would like to thank Györgyi Balogh for the technical assistance.

Conflicts of Interest

The authors declare no conflict of interest.

References

  1. Srivastava, P.; Wu, Q.S.; Giri, B. Salinity: An overview. In Soil Biology, Volume 56: Microorganisms in Saline Environments: Strategies and Functions; Giri, B., Varma, A., Eds.; Springer: Cham, Switzerland, 2019; Volume 56, pp. 3–18. [Google Scholar]
  2. Munns, R.; Tester, M. Mechanisms of salinity tolerance. Annu. Rev. Plant Biol. 2008, 59, 651–681. [Google Scholar] [CrossRef] [PubMed] [Green Version]
  3. Parihar, P.; Singh, S.; Singh, R.; Singh, V.P.; Prasad, S.M. Effect of salinity stress on plants and its tolerance strategies: A review. Environ. Sci. Pollut. Res. Int. 2015, 22, 4056–4075. [Google Scholar] [CrossRef] [PubMed]
  4. Negrão, S.; Schmöckel, S.M.; Tester, M. Evaluating physiological responses of plants to salinity stress. Ann. Bot. 2017, 119, 1–11. [Google Scholar] [CrossRef] [Green Version]
  5. Velmurugan, A.; Swarnam, P.; Subramani, T.; Meena, B.; Kaledhonkar, M.J. Water demand and salinity. In Desalination—Challenges and Opportunities; Farahani, M.H.D.A., Vatanpour, V., Taheri, A.H., Eds.; IntechOpen: Vienna, Austria, 2020; pp. 45–53. [Google Scholar]
  6. Arif, Y.; Singh, P.; Siddiqui, H.; Bajguz, A.; Hayat, S. Salinity induced physiological and biochemical changes in plants: An omic approach towards salt stress tolerance. Plant Physiol. Biochem. 2020, 156, 64–77. [Google Scholar] [CrossRef]
  7. Calone, R.; Sanoubar, R.; Lambertini, C.; Speranza, M.; Vittori Antisari, L.; Vianello, G.; Barbanti, L. Salt tolerance and Na allocation in Sorghum bicolor under variable soil and water salinity. Plants 2020, 9, 561. [Google Scholar] [CrossRef] [PubMed]
  8. Isayenkov, S.V.; Maathuis, F.J. Plant salinity stress: Many unanswered questions remain. Front. Plant Sci. 2019, 10, 80. [Google Scholar] [CrossRef] [Green Version]
  9. Abdel-Farid, I.B.; Marghany, M.R.; Rowezek, M.M.; Sheded, M.G. Effect of salinity stress on growth and metabolomic profiling of Cucumis sativus and Solanum lycopersicum. Plants 2020, 9, 1626. [Google Scholar] [CrossRef]
  10. Song, T.; Xu, H.; Sun, N.; Jiang, L.; Tian, P.; Yong, Y.; Yang, W.; Cai, H.; Cui, G. Metabolomic analysis of alfalfa (Medicago sativa L.) root-symbiotic rhizobia responses under alkali stress. Front. Plant Sci. 2017, 8, 1208. [Google Scholar] [CrossRef]
  11. Guo, R.; Shi, L.; Yang, Y. Germination, growth, osmotic adjustment and ionic balance of wheat in response to saline and alkaline stresses. Soil Sci. Plant Nutr. 2009, 55, 667–679. [Google Scholar] [CrossRef]
  12. Guo, R.; Yang, Z.; Li, F.; Yan, C.; Zhong, X.; Liu, Q.; Xia, X.; Li, H.; Zhao, L. Comparative metabolic responses and adaptive strategies of wheat (Triticum aestivum) to salt and alkali stress. BMC Plant Biol. 2015, 15, 170. [Google Scholar] [CrossRef] [Green Version]
  13. El Ghazali, G.E. Suaeda vermiculata Forssk. ex JF Gmel.: Structural characteristics and adaptations to salinity and drought: A review. Int. J. Sci. 2020, 9, 28–33. [Google Scholar]
  14. Percey, W.J.; McMinn, A.; Bose, J.; Breadmore, M.C.; Guijt, R.M.; Shabala, S. Salinity effects on chloroplast PSII performance in glycophytes and halophytes. Funct. Plant Biol. 2016, 43, 1003–1015. [Google Scholar] [CrossRef] [PubMed] [Green Version]
  15. Pottosin, I.; Shabala, S. Transport across chloroplast membranes: Optimizing photosynthesis for adverse environmental conditions. Mol. Plant 2016, 9, 356–370. [Google Scholar] [CrossRef] [PubMed] [Green Version]
  16. Yamane, K.; Taniguchi, M.; Miyake, H. Salinity-induced subcellular accumulation of H2O2 in leaves of rice. Protoplasma 2012, 249, 301–308. [Google Scholar] [CrossRef] [PubMed]
  17. Wu, H.; Zhang, X.; Giraldo, J.P.; Shabala, S. It is not all about sodium: Revealing tissue specificity and signalling roles of potassium in plant responses to salt stress. Plant Soil 2018, 431, 1–17. [Google Scholar] [CrossRef]
  18. Pan, T.; Liu, M.; Kreslavski, V.D.; Zharmukhamedov, S.K.; Nie, C.; Yu, M.; Kuznetsov, V.V.; Allakhverdiev, S.I.; Shabala, S. Non-stomatal limitation of photosynthesis by soil salinity. Crit. Rev. Environ. Sci. Technol. 2021, 51, 791–825. [Google Scholar] [CrossRef]
  19. Bai, J.; Qin, Y.; Liu, J.; Wang, Y.; Sa, R.; Zhang, N.; Jia, R. Proteomic response of oat leaves to long-term salinity stress. Environ. Sci. Pollut. Res. 2017, 24, 3387–3399. [Google Scholar] [CrossRef]
  20. Fooladvand, Z.; Fazelinasab, B. Evaluate the potential halophyte plants to produce biofuels. Eur. J. Biotechnol. Biosci. 2014, 2, 1–3. [Google Scholar]
  21. Joshi, A.; Kanthaliya, B.; Arora, J. Halophytes: The nonconventional crops as source of biofuel production. In Handbook of Halophytes: From Molecules to Ecosystems towards Biosaline Agriculture; Grigore, M.-N., Ed.; Springer: Cham, Switzerland, 2020; pp. 2451–2477. [Google Scholar]
  22. Pilu, R.; Badone, F.C.; Michela, L. Giant reed (Arundo donax L.): A weed plant or a promising energy crop? Afr. J. Biotechnol. 2012, 11, 9163–9174. [Google Scholar]
  23. Cristaldi, A.; Conti, G.O.; Cosentino, S.L.; Mauromicale, G.; Copat, C.; Grasso, A.; Zuccarello, P.; Fiore, M.; Restuccia, C.; Ferrante, M. Phytoremediation potential of Arundo donax (Giant Reed) in contaminated soil by heavy metals. Environ. Res. 2020, 185, 109427. [Google Scholar] [CrossRef]
  24. Danelli, T.; Laura, M.; Savona, M.; Landoni, M.; Adani, F.; Pilu, R. Genetic improvement of Arundo donax L.: Opportunities and challenges. Plants 2020, 9, 1584. [Google Scholar] [CrossRef] [PubMed]
  25. Rossa, B.; Tüffers, A.V.; Naidoo, G.; Von Willert, D.J. Arundo donax L. (Poaceae)—A C3 species with unusually high photosynthetic capacity. Bot. Acta 1998, 111, 216–221. [Google Scholar] [CrossRef]
  26. Triana, F.; Nassi o Di Nasso, N.; Ragaglini, G.; Roncucci, N.; Bonari, E. Evapotranspiration, crop coefficient and water use efficiency of giant reed (Arundo donax L.) and miscanthus (Miscanthus × giganteus Greef et Deu.) in a Mediterranean environment. GCB Bioenergy 2015, 7, 811–819. [Google Scholar] [CrossRef]
  27. Sánchez, E.; Scordia, D.; Lino, G.; Arias, C.; Cosentino, S.L.; Nogués, S. Salinity and water stress effects on biomass production in different Arundo donax L. clones. Bioenergy Res. 2015, 8, 1461–1479. [Google Scholar] [CrossRef] [Green Version]
  28. Yang, B.; Wyman, C.E. Pretreatment: The key to unlocking low-cost cellulosic ethanol. Biofuel Bioprod. Biorefin. 2008, 2, 26–40. [Google Scholar] [CrossRef]
  29. Porra, R.J.; Thompson, W.A.; Kriedemann, P.E. Determination of accurate extinction coefficients and simultaneous equations for assaying chlorophylls a and b extracted with four different solvents: Verification of the concentration of chlorophyll standards by atomic absorption spectroscopy. Biochim. Biophys. Acta—Bioenerg. 1989, 975, 384–394. [Google Scholar] [CrossRef]
  30. Heath, R.L.; Packer, L. Photoperoxidation in isolated chloroplasts: I. Kinetics and stoichiometry of fatty acid peroxidation. Arch. Biochem. Biophys. 1968, 125, 189–198. [Google Scholar] [CrossRef]
  31. Laemmli, U.K. Cleavage of structural proteins during the assembly of the head of bacteriophage T4. Nature 1970, 227, 680–685. [Google Scholar] [CrossRef]
  32. Giannopolitis, C.N.; Ries, S.K. Superoxide dismutases: I. Occurrence in higher plants. Plant Physiol. 1977, 59, 309–314. [Google Scholar] [CrossRef]
  33. Solórzano, E.; Corpas, F.J.; González-Gordo, S.; Palma, J.M. Reactive oxygen species (ROS) metabolism and nitric oxide (NO) content in roots and shoots of rice (Oryza sativa L.) plants under arsenic-induced stress. Agronomy 2020, 10, 1014. [Google Scholar] [CrossRef]
  34. Mittler, R.; Zilinskas, B.A. Detection of ascorbate peroxidase activity in native gels by inhibition of the ascorbate-dependent reduction of nitroblue tetrazolium. Anal. Biochem. 1993, 212, 540–546. [Google Scholar] [CrossRef] [PubMed]
  35. Bradford, M. A rapid and sensitive method for the quantitation of microgram quantities of protein utilizing the principle of protein–dye binding. Anal. Biochem. 1976, 72, 248–254. [Google Scholar] [CrossRef]
  36. Smith, I.K.; Vierheller, T.L.; Thorne, C.A. Assay of glutathione reductase in crude tissue homogenates using 5,5′-dithiobis(2-nitrobenzoic acid). Anal. Biochem. 1988, 175, 408–413. [Google Scholar] [CrossRef]
  37. Aebi, H. Catalase in vitro. Meth. Enzymol. 1984, 105, 121–126. [Google Scholar]
  38. Diallinas, G.; Pateraki, I.; Sanmartin, M.; Scossa, A.; Stilianou, E.; Panopoulos, N.J.; Kanellis, A.K. Melon ascorbate oxidase: Cloning of a multigene family, induction during fruit development and repression by wounding. Plant Mol. Biol. 1997, 34, 759–770. [Google Scholar] [CrossRef]
  39. Mosery, O.; Kanellis, A.K. Ascorbate oxidase of Cucumis melo L. var. reticulatus: Purification, characterization and antibody production. J. Exp. Bot. 1994, 45, 717–724. [Google Scholar] [CrossRef] [Green Version]
  40. Greenway, H.; Munns, R. Mechanism of salt tolerance in non-halophytes. Annu. Rev. Plant Physiol. 1980, 31, 139–168. [Google Scholar] [CrossRef]
  41. Orcutt, D.M.; Nilsen, E.T. The Physiology of Plants under Stress; John Wiley and Sons, Inc.: New York, NY, USA, 2000. [Google Scholar]
  42. Basel, S. Water status and protein pattern changes towards salt stress in cotton. J. Stress Physiol. Biochem. 2013, 9, 113–123. [Google Scholar]
  43. Singh, P.; Singh, N.; Sharma, K.D.; Kuhad, M.S. Plant water relations and osmotic adjustment in Brassica species under salinity stress. J. Am. Sci. 2010, 6, 1–4. [Google Scholar]
  44. Ali, A.; Raddatz, N.; Pardo, J.M.; Yun, D.J. HKT sodium and potassium transporters in Arabidopsis thaliana and related halophyte species. Physiol. Plant. 2021, 171, 546–558. [Google Scholar] [CrossRef]
  45. Riedelsberger, J.; Vergara-Jaque, A.; Piñeros, M.; Dreyer, I.; González, W. An extracellular cation coordination site influences ion conduction of OsHKT2;2. BMC Plant Biol. 2019, 19, 316. [Google Scholar] [CrossRef] [PubMed] [Green Version]
  46. Flowers, T.J.; Munns, R.; Colmer, T.D. Sodium chloride toxicity and the cellular basis of salt tolerance in halophytes. Ann. Bot. 2015, 115, 419–431. [Google Scholar] [CrossRef] [PubMed] [Green Version]
  47. De Oliveira, D.F.; de Sousa Lopes, L.; Gomes-Filho, E. Metabolic changes associated with differential salt tolerance in sorghum genotypes. Planta 2020, 252, 34. [Google Scholar] [CrossRef] [PubMed]
  48. Wu, D.; Shen, Q.; Cai, S.; Chen, Z.H.; Dai, F.; Zhang, G. Ionomic responses and correlations between elements and metabolites under salt stress in wild and cultivated barley. Plant Cell Physiol. 2013, 54, 1976–1988. [Google Scholar] [CrossRef] [PubMed] [Green Version]
  49. Seemann, J.R.; Critchley, C. Effects of salt stress on the growth, ion content, stomatal behaviour and photosynthetic capacity of a salt-sensitive species, Phaseolus vulgaris L. Planta 1985, 164, 151–162. [Google Scholar] [CrossRef]
  50. Wang, R.; Chen, S.; Deng, L.; Fritz, E.; Huttermann, A.; Polle, A. Leaf photosynthesis, fluorescence response to salinity and the relevance to chloroplast salt compartmentation and anti-oxidative stress in two poplars. Trees 2007, 21, 581–591. [Google Scholar] [CrossRef]
  51. Mittler, R. Oxidative stress, antioxidants and stress tolerance. Trends Plant Sci. 2002, 7, 405–410. [Google Scholar] [CrossRef]
  52. Miller, G.; Shulaev, V.; Mittler, R. Reactive oxygen signaling and abiotic stress. Physiol. Plant. 2008, 133, 481–489. [Google Scholar] [CrossRef]
  53. Sofo, A.; Scopa, A.; Nuzzaci, M.; Vitti, A. Ascorbate peroxidase and catalase activities and their genetic regulation in plants subjected to drought and salinity stresses. Int. J. Mol. Sci. 2015, 16, 13561–13578. [Google Scholar] [CrossRef] [Green Version]
  54. Choudhury, F.K.; Rivero, R.M.; Blumwald, E.; Mittler, R. Reactive oxygen species, abiotic stress and stress combination. Plant J. 2017, 90, 856–867. [Google Scholar] [CrossRef]
  55. Tanveer, M.; Shabala, S. Targeting redox regulatory mechanisms for salinity stress tolerance in crops. In Salinity Responses and Tolerance in Plants, Volume 1; Kumar, V., Wani, S.H., Suprasanna, P., Tran, L.-S.P., Eds.; Springer: Cham, Switzerland, 2018; pp. 213–234. [Google Scholar]
  56. Bannister, J.V.; Bannister, W.H.; Rotilio, G. Aspects of the structure, function and applications of superoxide dismutase. CRC Crit. Rev. Biochem. 1987, 22, 111–180. [Google Scholar] [CrossRef] [PubMed]
  57. Zeeshan, M.; Lu, M.; Sehar, S.; Holford, P.; Wu, F. Comparison of biochemical, anatomical, morphological, and physiological responses to salinity stress in wheat and barley genotypes deferring in salinity tolerance. Agronomy 2020, 10, 127. [Google Scholar] [CrossRef] [Green Version]
  58. Marjamaa, K.; Kukkola, E.M.; Fagerstedt, K.V. The role of xylem class III peroxidases in lignification. J. Exp. Bot. 2009, 60, 367–376. [Google Scholar] [CrossRef] [PubMed]
  59. Li, R.; Xin, S.; Tao, C.; Jin, X.; Li, H. Cotton ascorbate oxidase promotes cell growth in cultured tobacco bright yellow-2 cells through generation of apoplast oxidation. Int. J. Mol. Sci. 2017, 18, 1346. [Google Scholar] [CrossRef] [PubMed] [Green Version]
  60. Sawada, H.; Shim, I.S.; Usui, K. Induction of benzoic acid 2- hydroxylase and salicylic acid biosynthesis Modulation by salt stress in rice seedlings. Plant Sci. 2006, 171, 263–270. [Google Scholar] [CrossRef]
  61. Pignocchi, C.; Fletcher, J.M.; Wilkinson, J.E.; Barnes, J.D.; Foyer, C.H. The function of ascorbate oxidase in tobacco. Plant Physiol. 2003, 132, 1631–1641. [Google Scholar] [CrossRef] [Green Version]
Figure 1. Relative water content (RWC: A) and water saturation deficit (WSD: B) recorded in Arundo donax leaves after 1 month of alkaline salt treatment. Error bars represent SD values. To compare the differences, one-way ANOVA was performed on each dataset combined with Tukey’s post-hoc test on the treatments (p < 0.05). Different lowercase letters indicate significantly different groups.
Agronomy 12 01589 g001
Figure 2. Transpiration rate (A) and CO2 assimilation (B) recorded in Arundo donax leaves after 1 month of alkaline salt treatment. Error bars represent SD values. To compare the differences, one-way ANOVA was performed on each dataset with Tukey’s post-hoc test on the treatments (p < 0.05). Same lowercase letters indicate there are no significantly different groups.
Agronomy 12 01589 g002
Figure 3. Status of the photosynthetic apparatus, modelled by the maximal (Fv/Fm: A) and the actual (ΦPSII: B) quantum efficiencies of photosystem II reaction centres and the value of non-photochemical quenching (NPQ: C). Error bars represent SD values. To compare the differences, one-way ANOVA was performed on each dataset with Tukey’s post-hoc test on the treatments (p < 0.05). Same lowercase letters indicate there are no significantly different groups.
Agronomy 12 01589 g003
Figure 4. Total chlorophyll content of Arundo donax leaves expressed on a dry weight (DW) basis. Error bars represent SD values. To compare the differences, one-way ANOVA was performed with Tukey’s post-hoc test on the treatments (p < 0.05). Same lowercase letters indicate there are no significantly different groups.
Agronomy 12 01589 g004
Figure 5. Heat map of the element content in the youngest fully developed leaves of Arundo donax after 1 month of alkaline salt treatment. The increase and decrease in the element content are labelled with red and blue colours, respectively, and the rate of the change in the element content is indicated by darker and lighter shades of colours. Asterisks (*) indicate a significant difference at p < 0.05 compared with the control. Statistical analysis was performed on the raw data (Supplementary Table S3). Alterations in the element content of the leaves of treated plants are based on the corresponding element content in the leaves of control plants (Supplementary Table S3).
Agronomy 12 01589 g005
Figure 6. The K to Na ratio in the first fully developed leaves of Arundo donax after 1 month of alkaline salt treatment. Error bars represent SD values. To compare the differences, one-way ANOVA was performed on each dataset with Tukey’s post-hoc test on the treatments (p < 0.05). Different lowercase letters indicate significantly different groups.
Agronomy 12 01589 g006
Figure 7. The MDA content of Arundo donax leaves expressed on a dry weight (DW) basis. Error bars represent SD values. To compare the differences, one-way ANOVA was performed on each dataset with Tukey’s post-hoc test on the treatments (p < 0.05). Same lowercase letters indicate there are no significantly different groups.
Agronomy 12 01589 g007
Figure 8. Mn-superoxide dismutase (SOD: A), class III peroxidases (PODII: B; PODV: C), ascorbate peroxidase (APX: D), glutathione reductase (GR: E), catalase (CAT: F), and ascorbate oxidase (AO: G) activities in Arundo donax leaves after 1 month of alkaline salt treatment. Error bars represent SD values. To compare the differences, one-way ANOVA was performed on each dataset with Tukey’s post-hoc test on the treatments (p < 0.05). Different lowercase letters indicate significantly different groups.
Agronomy 12 01589 g008
Publisher’s Note: MDPI stays neutral with regard to jurisdictional claims in published maps and institutional affiliations.

