Article

Row Spacing and the Use of Plant-Available Water in Sugarcane Cultivation in Water-Abundant Louisiana

by
Patrick Z. Ellsworth
* and
Paul M. White, Jr.
Sugarcane Research Unit, United States Department of Agriculture, Agricultural Research Service, Houma, LA 70360, USA
*
Author to whom correspondence should be addressed.
Agronomy 2022, 12(7), 1586; https://doi.org/10.3390/agronomy12071586
Submission received: 9 June 2022 / Revised: 25 June 2022 / Accepted: 28 June 2022 / Published: 30 June 2022
(This article belongs to the Section Water Use and Irrigation)

Abstract

:
Optimizing row spacing can potentially improve yields when resources such as light and water are limited. Sugarcane in Louisiana is principally grown on rows spaced 1.8 m apart, but interest in planting on 2.4 m rows is increasing. In this study, we hypothesized that wider row spacing would have greater water availability. Soil moisture sensors were placed at 15, 30, and 45 cm depths in treatments: 1.8 and 2.4 m row spacings, two varieties (L 01-299 and HoCP 04-838), and two planting dates. Soil moisture was monitored in 15-min intervals from 2017 to 2020. Mean volumetric water content was slightly greater in 2.4 m than 1.8 m row spacing at 15 and 45 cm, but the biggest difference was observed when soil water content reached its lowest levels where 2.4 m rows had 1.1, 3.1, and 9.8 times more water available at 15, 30, and 45 cm, respectively, compared to 1.8 m row spacing. However, in both row spacings, plant-available water was always present in the top 45 cm, even during periods of low rainfall. Potentially, high water availability provides an opportunity to increase photosynthesis in sugarcane varieties by selecting for greater photosynthetic capacity and CO2 uptake through increasesd stomatal conductance.

1. Introduction

Sugarcane (Saccharum spp.) is a highly productive C4 grass crop, yielding an average of more than 75 metric tons ha−1 y−1 in the nine-month growing season of wet, temperate south Louisiana [1]. The need for adequate drainage in Louisiana’s wet climate and the accommodation of the wheel spacing of tractors and other machinery led to a specific row configuration of 1.8 m wide and 0.25–0.3 m tall rows [2]. Presently, this row configuration is the standard in approximately 95% of all commercial sugarcane in Louisiana. Nonetheless, there has been interest in increasing row spacing to 2.4 m because of potential yield increases, less soil compaction, and lower operating costs [3]. In the only study to compare yields between plots with 1.8 and 2.4 m row spacing, 2.4 m row spacing had greater yields in the first year harvest (plant cane) but not in second and third year harvests (first and second ratoons) [4]. Plant cane is the first year of sugarcane to be harvested, and ratoons are the subsequent years of shoot regrowth after the previous year’s stalks had been harvested. Increasing row spacing to 2.4 m reduces the number of rows per field, which means less row traffic compacting soil, especially beneficial during harvest in wet soils [5,6]. However, the impact of row spacing on soil water content and water availability in this water-abundant agroecosystem has not been studied.
Row spacing optimization can increase yield because yield typically increases as row spacing decreases until maximum light interception and canopy closure are achieved, so that further decreasing row spacing increases the density-dependent competition of resources and yield declines [7,8,9]. Optimization of row spacing in sugarcane often has reached the highest yields at 1.8 m row spacing [10,11,12]. Often the objective of row spacing optimization is to maintain yields while reducing ET, especially in water-limited agroecosystems [8,13,14]. In contrast, reducing ET in water-abundant, rainfed agroecosystems, such as south Louisiana, is not an agricultural priority, but rather reducing the soil water content to acceptable levels for sugarcane growth using drains and improving yields relative to the available water pool is the principal objective with respect to water use. According to Passioura [15], yield relative to water resources is a function of total plant-available water (PAW), the ratio of transpiration to ET, the ratio of carbon fixation and water use, which is WUE, and the harvest index (HI). Theoretically, increasing any one of these variables can increase yield, and using all water available for transpiration is the most effective use of available water [16,17]. In the case of sugarcane, the HI is closely related to aboveground biomass and is a major focus of the sugarcane breeding program [1,18,19]. In contrast, no direct efforts have been made to increase WUE or sugarcane water use, which, too, can increase yields with respect to water resources, even though sugarcane is grown in a water-abundant agroecosystem that should be able to support an increase in water uptake. Row spacing optimization can better match water resources with sugarcane water use [20].
One potential problem with matching sugarcane water use to the PAW pool is that precipitation, being the sole water input in rainfed agroecosystems, is variable, so the size of the PAW pool during each growing season is difficult to predict [21]. Increasing plant water use may lead to water limitation in periods or years of low rainfall that can erase any advantages that increased water use and the resulting greater production may provide. Therefore, it is necessary to understand the dynamics of the soil water pool available for sugarcane uptake and determine the stability of the PAW pool, and if it could be over-extended in dry periods or years [21]. Monitoring soil volumetric water content (VWC) provides necessary data to be able to assess soil water dynamics with respect to row spacing, water uptake, and variability in precipitation. Time-domain reflectometry (TDR) soil moisture probes provide a means to monitor water content through the root zone over the course of multiple growing seasons of a sugarcane crop cycle [22,23]. Adequate evaluation of soil water resources is critical to determining the size of the PAW pool and the role of management practices such as row spacing on the crop water budget.
The purpose of this research is to determine the role that row spacing in sugarcane cultivation plays on the plant-available water pool size in a water-abundant agroecosystem. Soil water content was monitored in 1.8-m versus 2.4-m spaced rows over multiple growing seasons from 2017 to 2020. We hypothesized that wider row spacing would have greater water availability than 1.8 m rows.

2. Materials and Methods

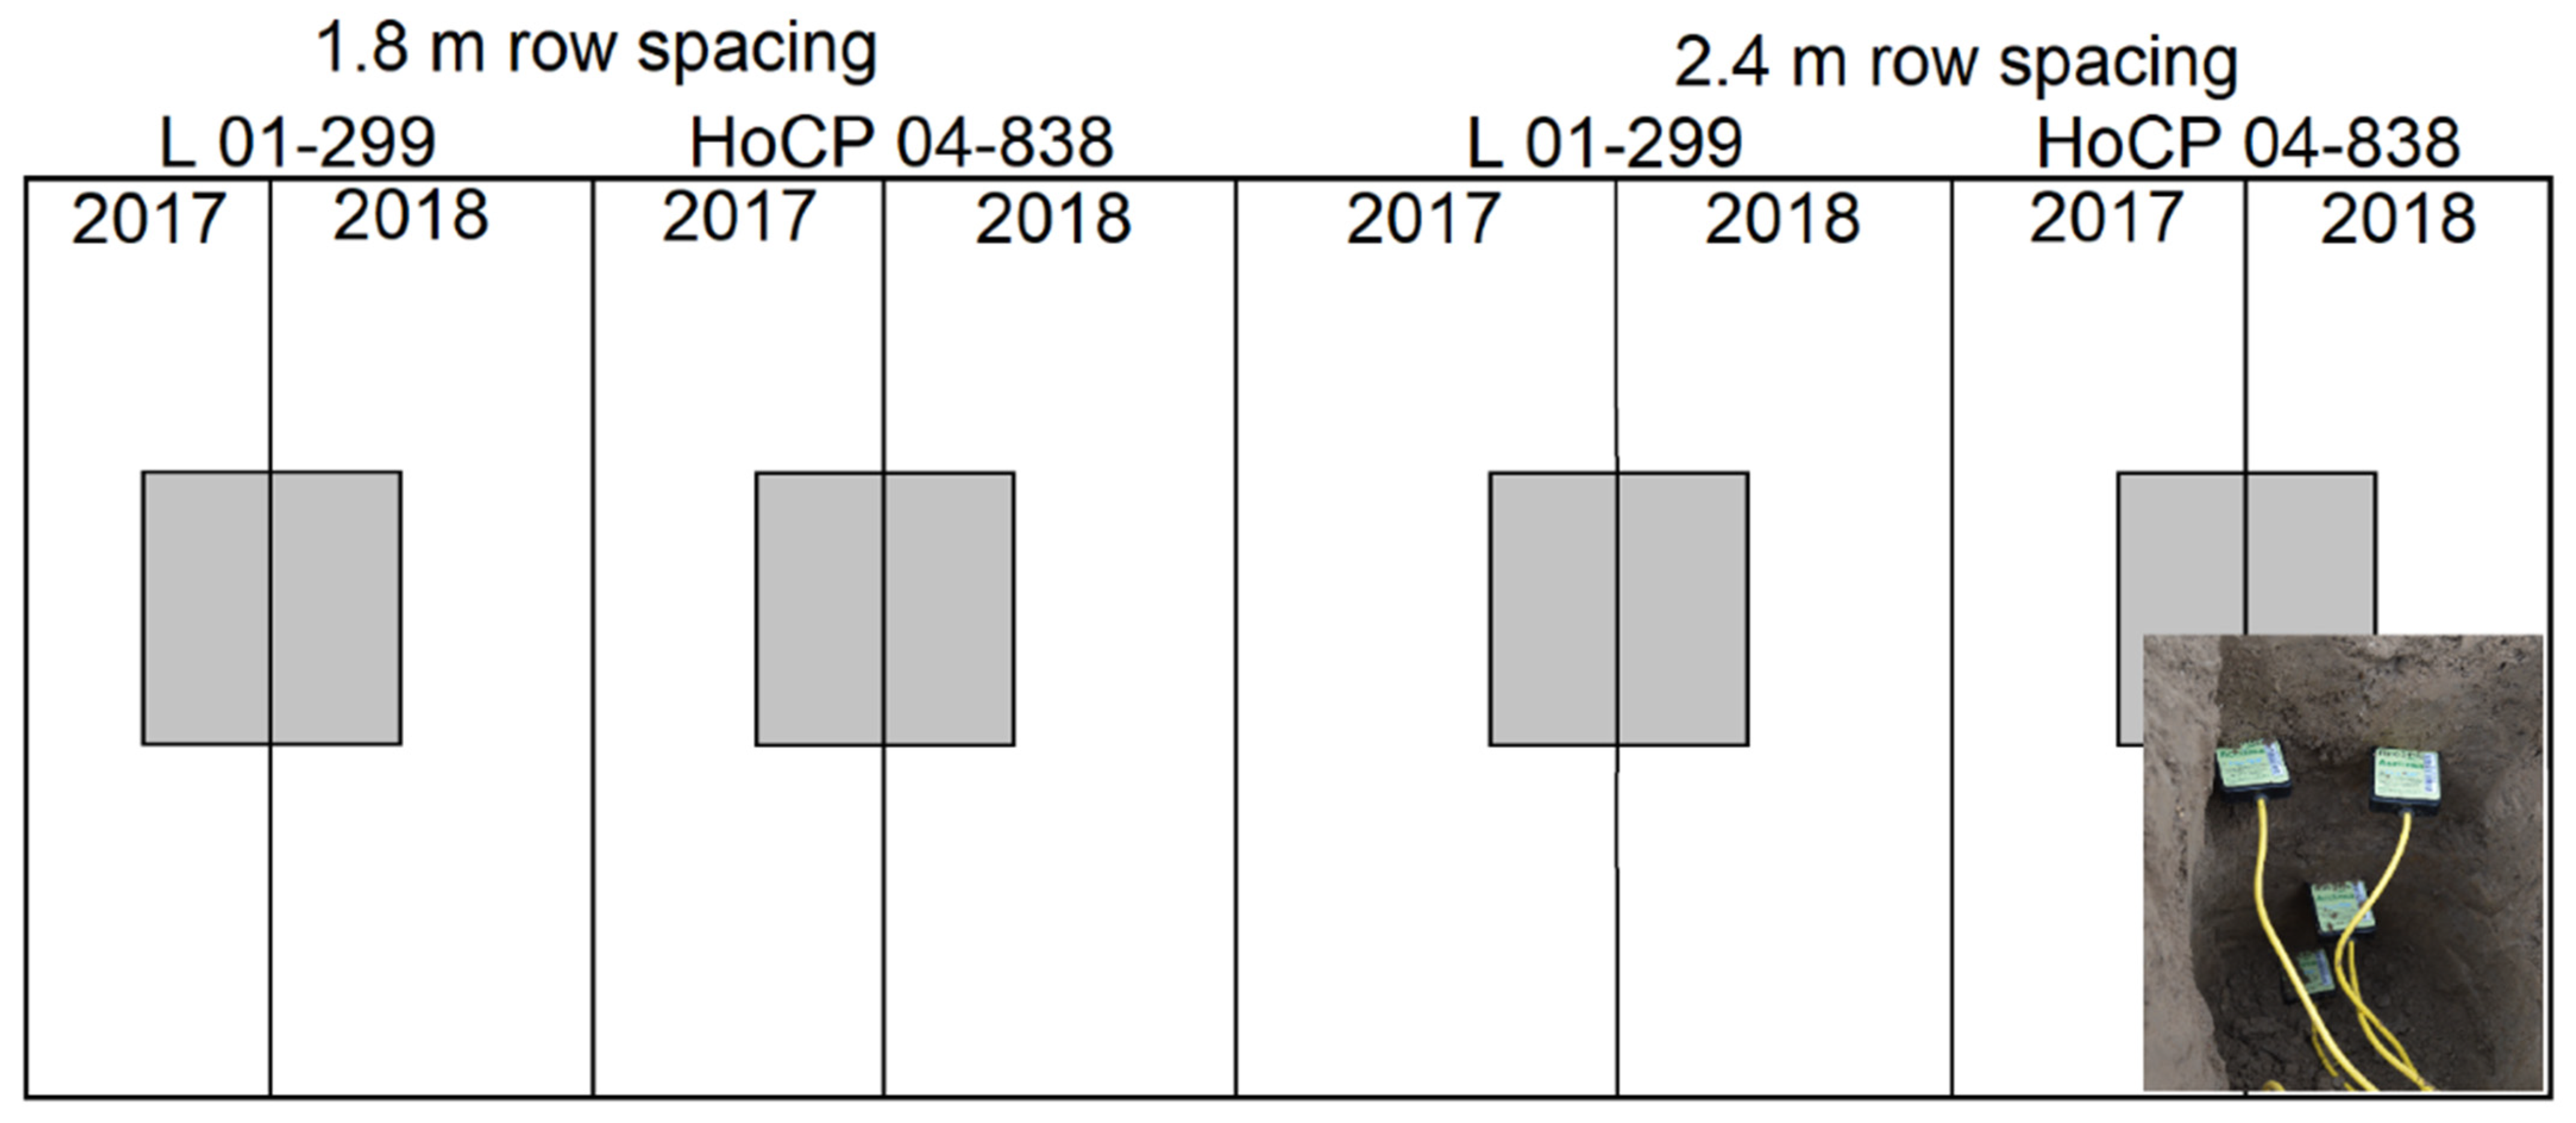
2.1. Site Description

The USDA Ardoyne Farm in Schriever, LA (29.634030° N, 90.834957° W) where the study was conducted had Cancienne silty clay loam soil. Study description and methods can also be found in White, Callahan Jr, Webber III and Ellsworth [4]. The soil texture in the plots was 10–17% clay, 66–72% silt, and 12–24% sand. Soil samples (0–15 cm depth) from an adjacent plot were analyzed for pH in 1:1 soil: water (6.0). Soil organic matter in the top 15 cm was 1.56% by weight as measured by loss on ignition at 360 °C. Meteorological data were collected from a weather station adjacent to the experimental fields. Rainfall was measured using a Hyquest Solutions (Lake Worth, FL, USA) TB4 tipping bucket rain gauge and was read using Campbell Scientific (Logan, UT, USA) dataloggers: CR3000 (2017–2019) or CR6 (2020). Data were recorded as daily rainfall. Monthly averages for each year were computed from this higher frequency data.
In August 2017, 1.8 m and 2.4 m spaced rows were established in the same field adjacent to each other (Figure 1). Both fields were cultivated, and planting furrows were formed using an opening tool. In the 1.8 m-spaced rows, a single, 60-cm wide furrow was created to plant a single row of sugarcane stalks. For the wide-spaced, 2.4 m rows, a custom-made dual opening tool was used to create two 25-cm wide furrows, spaced about 60 cm apart, into each row, so that two rows of stalks were planted on each row. Each plot consisted of three 1.8 or 2.4-m spaced rows, 30.5-m long, so each of the two 1.8 and 2.4 m row spacing tests was 0.134 or 0.178 ha, respectively. The commercial cultivars, L 01-299 and HoCP 04-838, were chosen for the study because L 01-299 was the most common variety grown in Louisiana, and HoCP 04-838 was a cold-tolerant and high-yielding cultivar available in Louisiana [24,25].
Planting was accomplished by using mature sugarcane stalks of approximately 1.8-m length. The seedcane source for this study was plant cane (2017) and first ratoon (2018) of disease-free, clean seed from field run, tissue-cultured sugarcane seed planted in 2016. The stalks were laid end to end with a 10% overlap in the planting furrow. To maintain the same planting density per hectare for the 1.8 and 2.4 rows, the planting rate was three stalks laid side by side for 1.8 m rows, and two stalks laid side by side were planted in each of the two planting furrows in the 2.4 m rows. After placing the stalks in furrows, the stalks were covered with 7–8 cm of packed soil. Planting whole stalks took place in August, and the buds sprouted quickly to produce short seedcane before the cold temperatures of winter killed the aboveground tissue. The cane then regrew in late winter to early spring but remained small until the ‘grand growth’ phase in May when sugarcane grew at its most rapid rate. Green sugarcane was billet harvested every fall for three years, and sugarcane resprouted but remained small until late spring. The first and second time that the sugarcane resprouted after harvest is called first and second ratoon, respectively. Fertilizer was injected in bands on each side of every row each April using UAN 32%, muriate of potash, and diammonium sulfate to supply 135 kg nitrogen, 68 kg potash, and 22 kg sulfur ha−1, respectively.

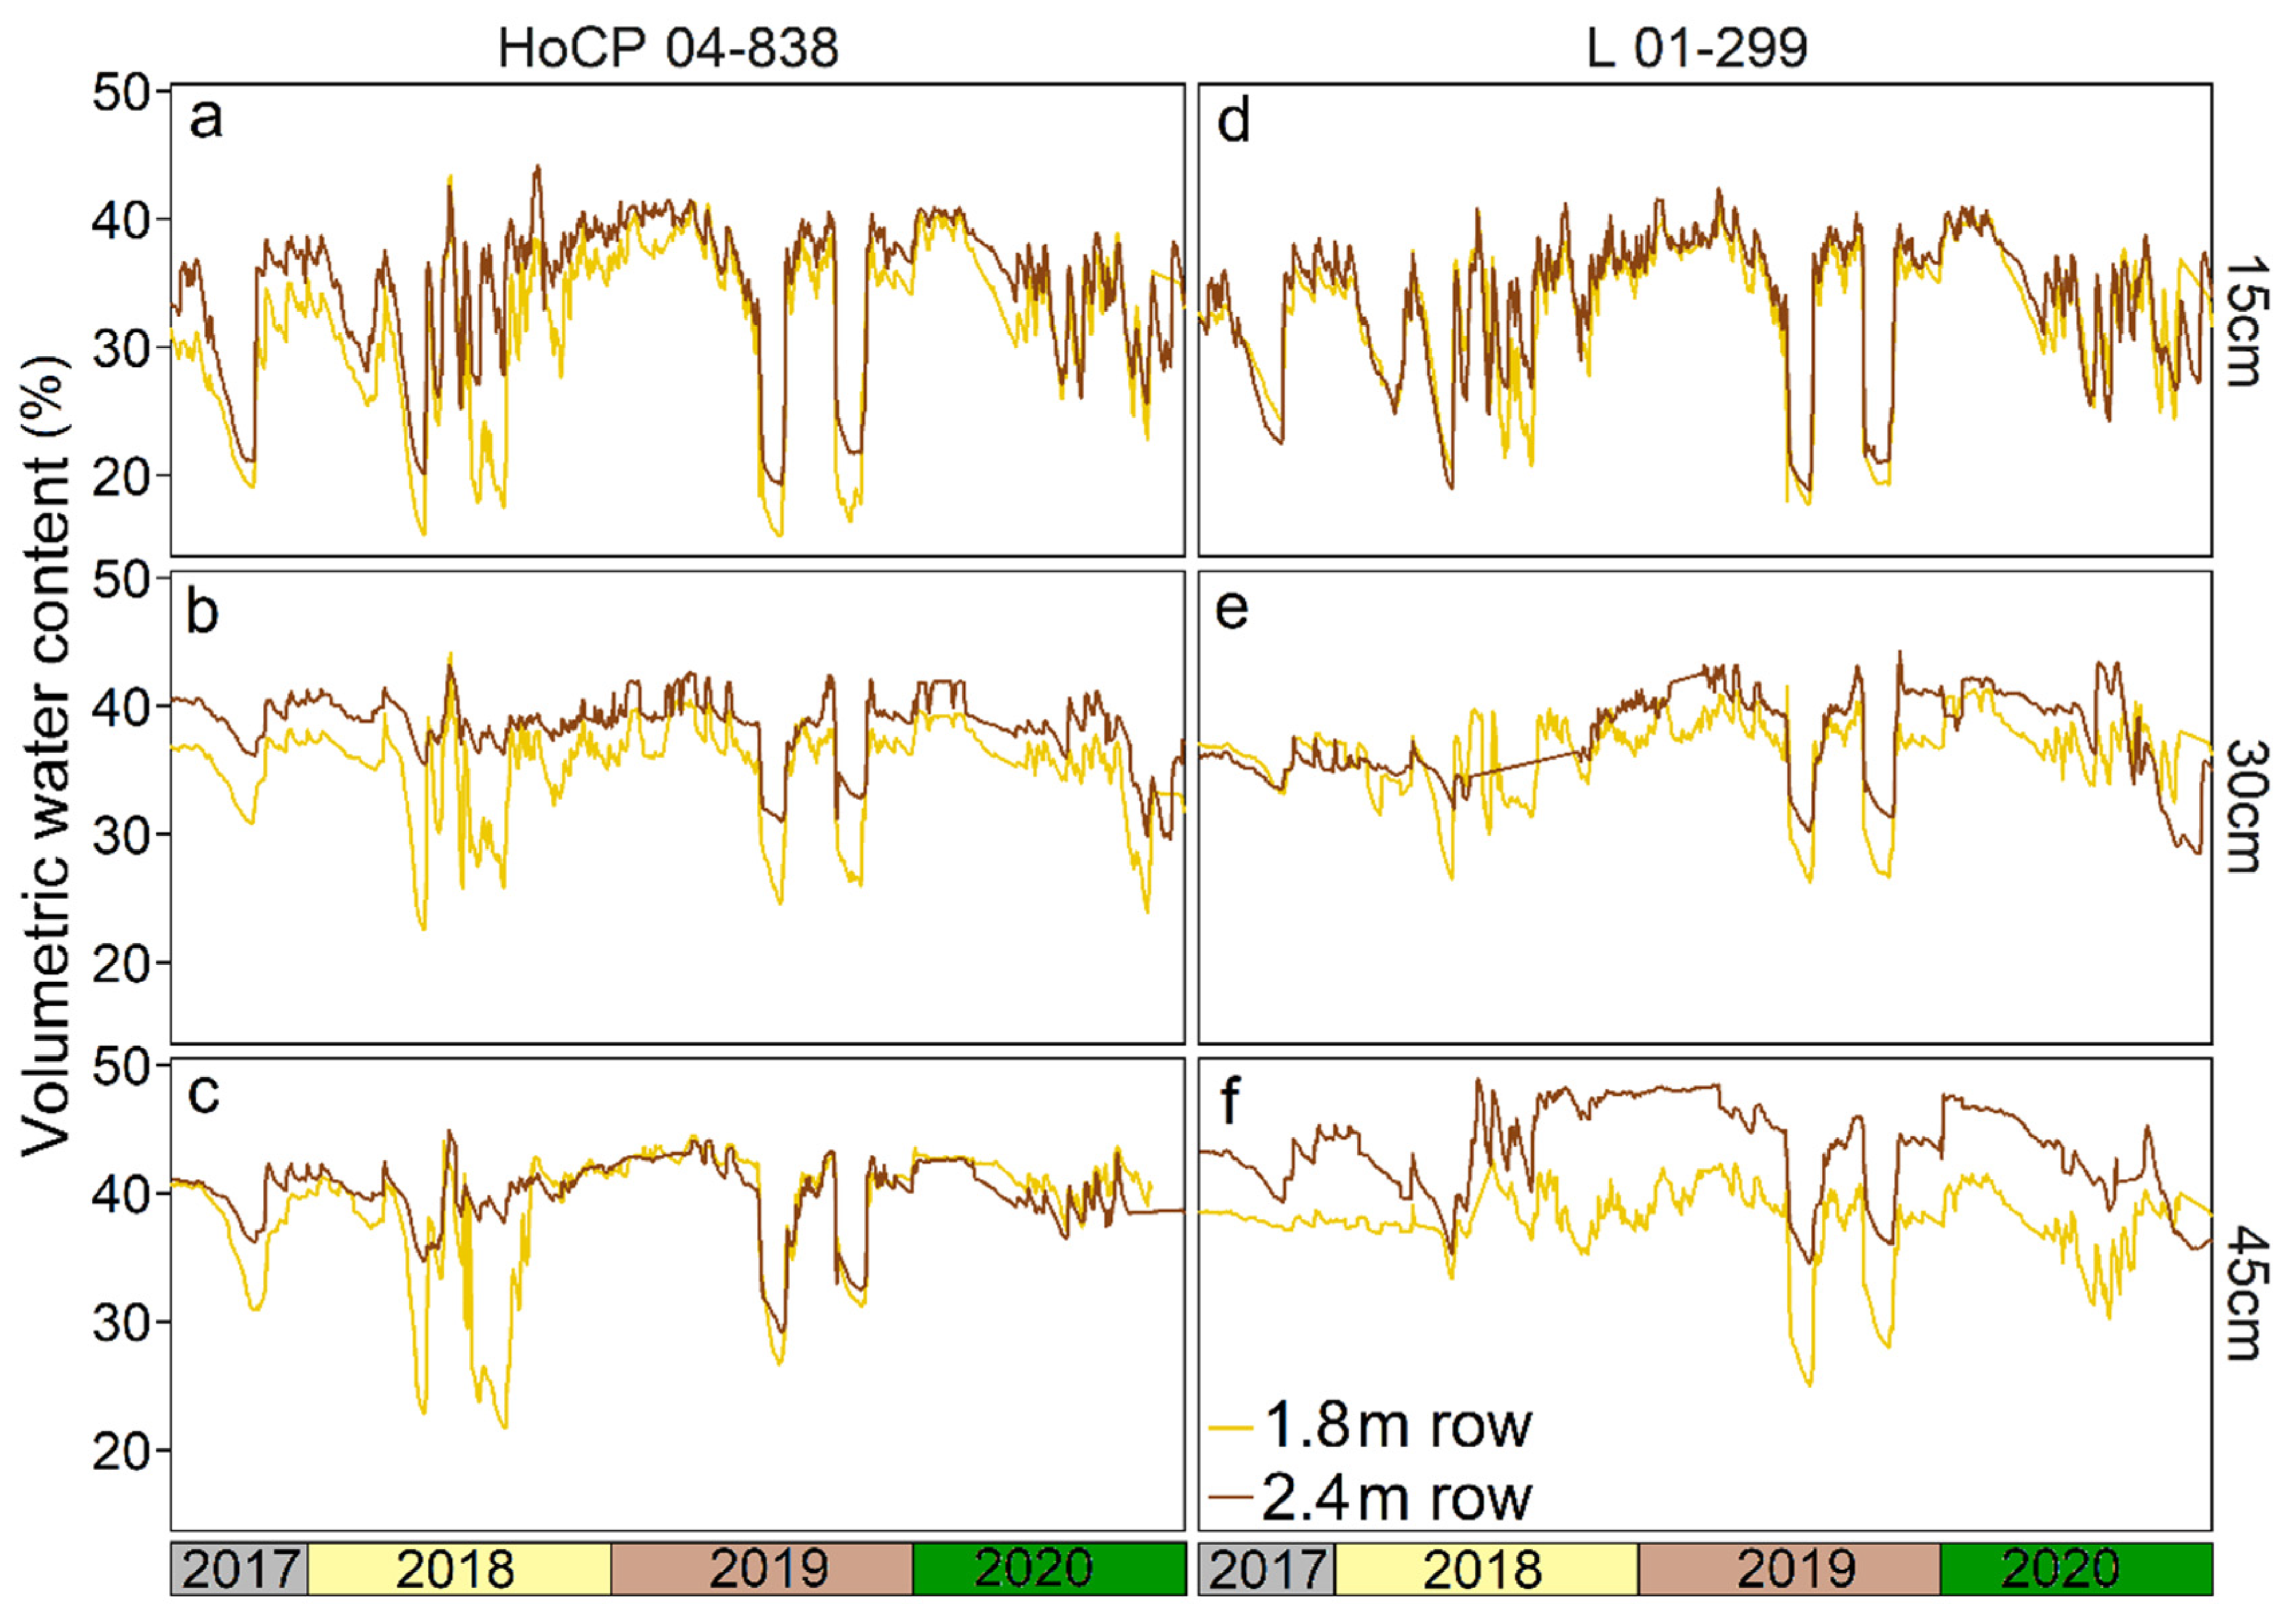
2.2. Volumetric Water Content and the Determination of Plant-Available Water (PAW)

Prior to planting in August 2017, soil moisture TDR probes (TDR-315, Acclima, Meridian, ID, USA) were installed in the wall of small holes which were dug in the plots—two probes at 15 cm and one each at 30 and 45 cm (Figure 1). Probes were installed in two sets of four plots for each sugarcane variety and row spacing. The first set of probes was added to the plots prior to the sugarcane being planted in 2017 and when the experiment was duplicated in 2018. A total of 128 probes were installed in this experiment. Once the probes were installed in the trench wall, the hole was back filled with the same soil that was removed from the hole. Volumetric water content was measured every 15 min for the duration of the experiment.
Plant-available soil water (PAW) was calculated as the millimeters of soil water per area that was available for plant uptake. First VWC below which point water was no longer considered available for uptake was calculated using the Soil-Plant-Atmosphere-Water (SPAW) model using soil texture, VWC, and organic matter content [26]. This critical VWC was the water content of the soil when the soil had a matric potential of −1.5 MPa. Soil texture was measured in each plot and was very similar across plots. PAW was calculated for each measurement of VWC by subtracting the VWC at −1.5 MPa from the soil VWC.

2.3. Soil Compaction

Soil compaction was measured in each row spacing in each field using an electronic soil compaction meter (PenetroLOG (PLG2040) Penetrolog, Rio Grande do Sol, Brazil). The probe was inserted into the planted row and adjacent wheel furrow to a depth of approximately 60 cm. Measurements of penetration resistance (kPa) were taken automatically every 1 cm of depth in plots of each variety, row spacing, and experiment (2017, 2018). Data were downloaded from the probe and analyzed in R.

2.4. Statistical Analysis

The experiment was a split plot design with four replications where row spacing was the whole plot and cultivar was the split plot. All statistics were performed using R software using packages Agricolae, nlme, multcomp, and ggplot2 [27,28,29,30,31]. Three-way repeated-measures analyses of variance (ANOVA) at each soil depth (15, 30, 45 cm) were used to determine the role of variety and row spacing on daily VWC, PAW, and temperature (T) where the factors were date, variety, and row spacing, and the repeated measure was the individual sensors. Interactions were also measured. The planting year made no significant difference in the VWC of the soil with depth, variety, or row spacing, so planting years were combined (F = 0.0151,7; p = 0.90). The interaction row spacing x variety was not significant for daily VWC, PAW, or soil T, so two-way repeated-measures ANOVAs at each soil depth were used to determine the significance of variety and row spacing throughout the experiment on daily VWC, PAW, and temperature where the factors were date and either variety or row spacing, and the repeated measure was the individual sensors.

3. Results

Precipitation ranged from 1477 to 1875 mm between 2017 and 2020 (Figure 2). The years 2017 and 2019 had above-average rainfall, which was 1525 to 1650 mm. The year 2018 was within the average rainfall range, while 2020 was slightly below average (Figure 2). Rainfall was not significantly different across months because monthly rainfall was considerably variable across years (F = 0.84411,26; p = 0.60; Figure 2). The entire growing period between April and October, however, was rather consistent in supplying 74% of annual precipitation (range of 61–81%). During the four months of ‘grand growth’, the vegetative stage of sugarcane, a mean of 48% of rainfall fell (range of 27–65%; Figure 2). High precipitation resulted in high VWC at all depths, even though dry periods reduced water content significantly. There were only five dry periods from 15 to 44 days long where PAW dropped below 10 mm in at least one soil depth, yet at least one soil layer had low water content in 14% of the days in the study. PAW was below 10 mm at 30 and 45 cm on 73% of the days with low water content, meaning that low water content was not merely in the superficial soil layer. Nevertheless, the average PAW in the top 45 cm seldom dropped to 50 mm on any day, so overall soil water content was mostly adequate to abundant even in periods of low rainfall including in 2020, when rainfall was slightly below average. Volumetric water content was very high on average at all soil depths (Table 1 and Table S1). Not surprisingly, PAW was not correlated with daily or monthly precipitation. Nevertheless, periods of low rainfall during grand growth stage in the 2018 and 2019 corresponded to periods of slightly lower monthly PAW, showing the effect of transpiration when rainfall is not sufficient to replenish soil water (Figure 2).
VWC was significantly higher in the wider row spacing at 15 and 45 cm (p < 0.05). Overall, wider row spacing (2.44 m) increased VWC by 3.7, 5.2, and 7.6% at depths of 15, 30, and 45 cm, respectively. This increase in VWC resulted in modest increases of 5.3, 7.5, and 11.3% in PAW at a soil depths of 15, 30, and 45 cm, respectively. These increases in water content with row spacing were most significant when water availability was at minimum levels. Minimum VWC values were 8, 54, and 85% greater in wider row spacing than 1.8 m rows at depths 15, 30, and 45 cm, respectively. These differences when water was the most limiting translated into only slightly higher PAW at a depth of 15 cm in the 2.4 m rows, but substantial increases at 30 and 45 cm where the wide row spacing was 3.1 and 9.8 times greater, respectively (Table 1; Figure 3). This was most evident during dry periods in 2018 and 2019, but overall PAW was high in both 1.8 and 2.4 m row spacing (Figure 4). Consistent differences in VWC or PAW were not detected between varieties L 01-299 and HoCP 04-838, experiments, and crop cycle (Table 1). Row spacing increased soil temperature in that 2.44 m rows were slightly warmer than 1.83 m rows.
The plow pan in the soil was at the same depth in both 1.8 and 2.4 m row spacing plots, but the mean pressure required to insert the probe was greater in the plots with 1.8 m rows (Figure 5). The plow pan was at a mean depth of 22.5 ± 0.98 and 23.5 ± 1.5 cm below the bottom of the furrow (49.4 ± 0.46 and 38.2 ± 0.56 cm from the top of the row) in the 1.8 and 2.4 m rows, respectively. The mean pressure required to insert the probe was 4321 ± 170 and 3032 ± 152 kPa for the 1.8 and 2.4 m rows spacing plots, respectively. Otherwise, the shape of the pressure curve relative to soil depth was similar between row spacings. The relationship between depth and insertion pressure of the maximum compacted layer was not related to VWC and PAW in any layer or the sum of the soil layers. The compacted layer was not related to variety or plot.

4. Discussion

Wider rows increased soil water availability that could be used for sugarcane transpiration. Increasing row spacing from 1.8 to 2.4 m reduced row length per hectare by 25% but increased row surface area by 8% at the expense of fewer furrow drains. Less furrow drains reduced drainage from the field and contributed to greater PAW in the 2.4 m rows. It is expected that a greater row surface area provides more space for sugarcane growth and theoretically should increase sugarcane stalk density per hectare and, therefore, yield, but that only proved true in plant cane [4]. It appears that by the first ratoon, stalk density per hectare, like yield, was similar between row spacing treatments [4]. Potentially cane population density continued to increase through tillering until maximal light interception relative to field surface area was reached, and further tillering did not increase yield because they did not have sufficient space and light to grow to maturation [8]. If so, water loss through transpiration also reached its maximum based on canopy area and ambient conditions. So, similar to sugarcane yield, the crop does not take advantage of the additional available water for transpiration in the 2.4 m rows. Similarly, altering row spacing did not affect ET or water use in other crop species such as maize and soybeans when water was not limited [8,13,14,32]. From a water availability perspective, increasing row spacing from 1.8 to 2.4 m is not necessary for water-abundant sugarcane-growing regions, but it highlights the potential advantage of better-utilizing PAW in sugarcane production.
Plant-available water was always present in the top 45 cm independent of row spacing. Even during dry periods in the summer of 2019 and below-average rainfall in 2020, PAW never dropped below an average 50 mm in either row spacing. Realistically PAW accessible to sugarcane in Louisiana could be much higher if their roots extend below 45 cm, which is probable. Sugarcane roots have been documented to extend to 6 m in other sugarcane-growing regions in Brazil, Côte d’Ivoire, Réunion, China, and Australia [33,34,35]. The presence of a compacted soil layer at 45–50 cm below the row surface, however, likely reduced root penetration below that layer [5]. Nonetheless, even a few deep roots can contribute significantly to water uptake when shallow soil water becomes depleted [36]. It is not known if the compaction layer played a role in PAW pool size and access by roots, and further research on the effect of compaction on sugarcane cultivation is warranted. In all, it would be expected that the minimum PAW accessible to sugarcane roots is the top 45 cm of soil. Therefore, in water-abundant, rainfed agroecosystems such as sugarcane in south Louisiana, a large PAW pool is available for transpiration. According to Passioura [15], maximizing the proportion of PAW transpired would maximize yield relative to the water resource [15,37].
In abundant, rainfed agroecosystems, excess PAW can reduce yields but potentially serves as a resource for increased yields. Multiple methods are used to remove excess water from the field such as furrow and tile drains [38]. In the case of sugarcane in south Louisiana, heavy rainfall, flat topography, and lack of tile drains complicate the removal of excess water [39,40,41]. Tile drains have been adopted because they are expensive, and most sugarcane producers rent cropland and must overcome this large capital expense with high yields [40,42]. Nevertheless, this abundant water resource can be an asset to sugarcane production if it is utilized by sugarcane. In contrast to irrigated cropping systems where multiple users compete for access to water, sugarcane and other crops in water-abundant regions do not compete for water with other users; therefore, ideally passing this abundant water through the transpiration stream would maximize yields relative to the PAW pool [15,37]. The efforts to improve plant WUE by reducing water loss relative to photosynthesis and plant biomass production have focused appropriately on crops grown in water-limited agroecosystems where yields need to be maximized relative to a limited water resource [43]. Similarly, in water-abundant agroecosystems crop improvement should focus on maximizing yield relative to their large PAW pool. Even though the resulting crop would not be water-use efficient, it would instead effectively use the PAW pool. Methods of increasing the effective use of water (EUW) would be more advantageous than maximizing WUE or even draining excess water [37,44].
The effective use of the PAW pool can potentially be accomplished by maximizing CO2 uptake in photosynthesis through increased stomatal conductance [45,46,47]. The drawback to greater stomatal conductance is greater water loss from increased transpiration rates. For this reason, efforts are being made to improve the sensitivity of stomates, so that they rapidly open and close in response to temporary changes in environmental conditions that impact photosynthesis such as shading and sun flecks, reducing water loss with little reduction in photosynthesis [46,47,48]. Where PAW is in excess such as in sugarcane growing areas of Louisiana, it may be better if stomates are less sensitive and more readily remain open to maximize photosynthesis at the expense of greater water loss. Under ambient CO2 concentrations, C4 sugarcane maintains optimal intercellular CO2 concentrations at relatively low stomatal conductance, so insensitive stomates and their greater stomatal conductance would only slightly increase photosynthetic rates [49,50]. Nevertheless, slight increases in photosynthetic rate and a more constant CO2 supply for photosynthesis can lead to increases in growth and yield [51,52]. If insensitive stomates are coupled with greater photosynthetic capacity, improvements in photosynthetic rate and subsequently yield would greatly increase because of the positive relationship between photosynthetic rates and yield in sugarcane [50,51,53,54].

5. Conclusions

Wider row spacing increased soil water content, especially in periods of low rainfall, increasing the PAW pool available for transpiration. Notwithstanding, in either row spacing configuration PAW was high and seldom dropped below 50% of field capacity. Consistently high plant-available moisture content indicates that transpiration can increase considerably without limiting sugarcane growth through limited water availability. Therefore, maximizing yield relative to available water resources in water-abundant Louisiana would be more appropriately conducted by maximizing transpiration than increasing yield through higher WUE. In this way, the method that cropping systems maximize yields with respect to water resources depends on if PAW is limiting or abundant. Wider row spacing would be the more appropriate row spacing with respect to water resources if sugarcane water use increased with efforts to maximize yields relative to water resources. Consequently, breeding sugarcane for insensitive stomates and greater photosynthetic capacity has the potential to develop varieties that can produce greater yields by taking advantage of this large PAW pool.

Supplementary Materials

The following are available online at https://www.mdpi.com/article/10.3390/agronomy12071586/s1, Table S1. Soil characteristics across row spacing, varieties, and width depth. Table S2. ANOVA table for three-way repeated measures. Table S3. Two-way repeated measured ANOVA table where the factors were day of year and row spacing and repeated measure was individual sen-sors. Table S4. Two-way repeated measured ANOVA table where the factors were day of year and sugarcane variety, and repeated measure was individual sensors.

Author Contributions

Conceptualization, P.M.W.J.; Data curation, P.M.W.J.; Formal analysis, P.Z.E.; Investigation, P.M.W.J.; Methodology, P.M.W.J.; Project administration, P.M.W.J.; Writing—original draft, P.Z.E.; Writing—review & editing, P.Z.E. All authors have read and agreed to the published version of the manuscript.

Funding

The research was partially funded by the American Sugar Cane League, Inc., of the Thibodaux, LA, USA.

Institutional Review Board Statement

Not applicable.

Informed Consent Statement

Not applicable.

Data Availability Statement

The datasets generated during this study and presented in this manuscript are available from the corresponding author on reasonable request.

Acknowledgments

The authors would like to thank Deise da Silva for reviewing and improving a previous version of the manuscript. The research was partially funded by the American Sugar Cane League, Inc., of the Thibodaux, LA, USA. Mention of trade names or commercial products in this publication is solely for the purpose of providing specific information and does not imply recommendation or endorsement by the U.S. Department of Agriculture. The USDA is an equal opportunity provider and employer.

Conflicts of Interest

The authors declare no conflict of interest.

References

  1. Hale, A.L.; Todd, J.R.; Gravois, K.A.; Mollov, D.; Malapi-Wight, M.; Momotaz, A.; Laborde, C.; Goenaga, R.; Kimbeng, C.; Solis, A. Sugarcane breeding programs in the USA. Sugar Tech 2022, 24, 97–111. [Google Scholar] [CrossRef]
  2. Richard, E., Jr.; Dunckelman, J.; Carter, C. Productivity of sugarcane on narrow rows, as affected by mechanical harvestinbg. Field Crops Res. 1991, 26, 375–386. [Google Scholar] [CrossRef]
  3. Deliberto, M.; Hilbun, B.; Gravois, K.; Waguespack, H. Evaluating the investment, fuel, and labor cost structure of wide-row sugarcane production in Louisiana. J. Am. Soc. Sugar Cane Technol. 2020, 40, 56–61. [Google Scholar]
  4. White, P.M.; Callahan, H.J., Jr.; Webber, C.L., III; Ellsworth, P.Z. The effect of row spacing on L 01-299 and HoCP 04-838 sugarcane yields in Louisiana. J. Am. Soc. Sugar Cane Technol. 2021, 41, 18–25. [Google Scholar]
  5. Souza, G.S.d.; Souza, Z.M.d.; Silva, R.B.d.; Barbosa, R.S.; Araújo, F.S. Effects of traffic control on the soil physical quality and the cultivation of sugarcane. Rev. Bras. Ciência Solo 2014, 38, 135–146. [Google Scholar] [CrossRef] [Green Version]
  6. Kingwell, R.; Fuchsbichler, A. The whole-farm benefits of controlled traffic farming: An Australian appraisal. Agric. Syst. 2011, 104, 513–521. [Google Scholar] [CrossRef]
  7. Ehsanullah, K.J.; Jamil, M.; Ghafar, A. Optimizing the row spacing and seeding density to improve yield and quality of sugarcane. Crop Environ. 2011, 2, 1–5. [Google Scholar]
  8. Barbieri, P.; Echarte, L.; Della Maggiora, A.; Sadras, V.; Echeverria, H.; Andrade, F. Maize evapotranspiration and water-use efficiency in response to row spacing. Agron. J. 2012, 104, 939–944. [Google Scholar] [CrossRef]
  9. Acreche, M.M. Nitrogen-, water-and radiation-use efficiencies affected by sugarcane breeding in Argentina. Plant Breed. 2017, 136, 174–181. [Google Scholar] [CrossRef]
  10. Olivier, F.; Lecler, N.; Singels, A. Increasing water use efficiency of irrigated sugarcane by means of specific agronomic practices. Water Res. Comm. Rep. 2009, document number 1577/1/09. [Google Scholar]
  11. Olivier, F.; Singels, A. Water use efficiency of irrigated sugarcane as affected by row spacing and variety. Proc. S. Afr. Sugarcane Technol. Assoc. 2003, 77, 347–351. [Google Scholar]
  12. Ullah, S.; Anjum, S.A.; Raza, M.M.; Riaz, A.; Abbas, A.; Yousif, M.M.; Ma, J.; Liu, Y.; Zhang, J.; Cheng, D. Optimizing row spacing to ameliorate the productivity of spring sugarcane (Saccharum officinarum L.). Agric. Sci. 2016, 7, 531. [Google Scholar]
  13. Chen, S.; Zhang, X.; Sun, H.; Ren, T.; Wang, Y. Effects of winter wheat row spacing on evapotranpsiration, grain yield and water use efficiency. Agric. Water Manag. 2010, 97, 1126–1132. [Google Scholar] [CrossRef]
  14. Timmons, D.; Holt, R.; Thompson, R. Effect of plant population and row spacing on evapotranspiration and water-use efficiency by soybeans. Agron. J. 1967, 59, 262–265. [Google Scholar] [CrossRef]
  15. Passioura, J. Roots and drought resistance. Agric. Water Manag. 1983, 7, 265–280. [Google Scholar] [CrossRef]
  16. Polania, J.A.; Poschenrieder, C.; Beebe, S.; Rao, I.M. Effective use of water and increased dry matter partitioned to grain contribute to yield of common bean improved for drought resistance. Front. Plant Sci. 2016, 7, 660. [Google Scholar] [CrossRef] [Green Version]
  17. Araus, J.L.; Slafer, G.A.; Reynolds, M.P.; Royo, C. Plant breeding and drought in C3 cereals: What should we breed for? Ann. Bot. 2002, 89, 925–940. [Google Scholar] [CrossRef]
  18. Breaux, R. Breeding to enhance sucrose content of sugarcane varieties in Louisiana. Field Crops Res. 1984, 9, 59–67. [Google Scholar] [CrossRef]
  19. Bischoff, K.P.; Gravois, K.A. The development of new sugarcane varieties at the LSU AgCenter. J. Am. Soc. Sugar Cane Technol. 2004, 24, 142–164. [Google Scholar]
  20. Singels, A.; Smit, M. The effect of row spacing on an irrigated plant crop of sugarcane variety NCo376. Proc. Proc. S. Afr. Sugarcane Technol. Assoc. 2002, 76, 94–105. [Google Scholar]
  21. Jones, H.G. Monitoring plant and soil water status: Established and novel methods revisited and their relevance to studies of drought tolerance. J. Exp. Bot. 2007, 58, 119–130. [Google Scholar] [CrossRef] [PubMed] [Green Version]
  22. Noborio, K. Measurement of soil water content and electrical conductivity by time domain reflectometry: A review. Comput. Electron. Agric. 2001, 31, 213–237. [Google Scholar] [CrossRef]
  23. Topp, G.C. State of the art of measuring soil water content. Hydrol. Processes 2003, 17, 2993–2996. [Google Scholar] [CrossRef]
  24. Gravois, K.; Bischoff, K.; Pontif, M.; LaBorde, C.; Hoy, J.; Reagan, T.; Kimbeng, C.; Legendre, B.; Hawkins, G.; Sexton, D. Registration of ‘L 01–299’ sugarcane. J. Plant Regist. 2011, 5, 191–195. [Google Scholar] [CrossRef]
  25. Todd, J.; White, W.; Dufrene, E.; Tew, T.; Pan, Y.-B.; Duet, M.; Verdun, D.; Hale, A.; Dalley, C.; Grisham, M. Registration of ‘HoCP 04-838’ sugarcane. J. Plant Regist. 2018, 12, 324–332. [Google Scholar] [CrossRef]
  26. Saxton, K.E.; Rawls, W.J. Soil water characteristic estimates by texture and organic matter for hydrologic solutions. Soil Sci. Soc. Am. J. 2006, 70, 1569–1578. [Google Scholar] [CrossRef] [Green Version]
  27. R_Core_Team. R: A Language and Environment for Statistical Computing; R Foundation for Statistical Computing: Vienna, Austria, 2021. [Google Scholar]
  28. de Mendiburu, F.; Taseen, M. Agricolae: Statistical Procedures for Agricultural Research, 2020; R package version 1:3-5.
  29. Hothorn, T.; Bretz, F.; Westfall, P. Simultaneous inference in general parametric models. Biom. J. 2008, 50, 346–363. [Google Scholar] [CrossRef] [Green Version]
  30. Wickham, H. ggplot2: Elegant Graphics for Data Analysis, 2nd ed.; Springer International Publishing: Cham, Switzerland, 2016. [Google Scholar] [CrossRef]
  31. Pinheiro, J.; Bates, D.; DebRoy, S.; Sarkar, D.; Team, R.C. nlme: Linear and Nonlinear Mixed Effects Models, 2021; R package version 3:1-153.
  32. Alessi, J.; Power, J. Effects of plant and row spacing on dryland soybean yield and water-use efficiency. Agron. J. 1982, 74, 851–854. [Google Scholar] [CrossRef] [Green Version]
  33. Chopart, J.-L.; Azevedo, M.; Le Mezo, L.; Marion, D. Sugarcane Root System Depth in Three Different Countries. In Proceedings of the 27th Congress of the International Society of Sugar Cane Technologists Congress(ISSCT), Veracruz, Mexico, 7–11 March 2010; Volume 27, pp. 1–8. [Google Scholar]
  34. Smith, D.; Inman-Bamber, N.; Thorburn, P. Growth and function of the sugarcane root system. Field Crops Res. 2005, 92, 169–183. [Google Scholar] [CrossRef]
  35. Zhao, L.; Yang, K.; Zhao, P.; Qin, W.; Zhao, Y.; Zhu, J.; Zan, F.; Zhao, J.; Lu, X.; Wu, C. Sugarcane root distribution and growth as affected by genotype and crop cycle. Bragantia 2020, 79, 192–202. [Google Scholar] [CrossRef]
  36. Jackson, R.B.; Pockman, W.T.; Hoffmann, W.A. The structure and function of root systems. In Handbook of Functional Plant Ecology; Pugnaire, F.I., Valladares, F., Eds.; Marcel Dekker: New York, NY, USA, 1999; pp. 195–220. [Google Scholar]
  37. Sinclair, T.R. Effective water use required for improving crop growth rather than transpiration efficiency. Front. Plant Sci. 2018, 9, 1442. [Google Scholar] [CrossRef] [PubMed]
  38. Skaggs, R.W.; Breve, M.; Gilliam, J. Hydrologic and water quality impacts of agricultural drainage. Crit. Rev. Environ. Sci. Technol. 1994, 24, 1–32. [Google Scholar] [CrossRef]
  39. Camp, C.; Carter, C. Sugarcane yield response to subsurface drainage for an alluvial soil. Trans. Am. Soc. Agric. Eng. 1983, 26, 1112–1116. [Google Scholar] [CrossRef]
  40. Carter, C.E.; Camp, C.R. Subsurface drainage of an alluvial soil increased sugarcane yields. Trans. Am. Soc. Agric. Eng. 1983, 26, 426–429. [Google Scholar] [CrossRef]
  41. Gayle, G.; Skaggs, R.; Carter, C. Effects of excessive soil water conditions on sugarcane yields. Trans. Am. Soc. Agric. Eng. 1987, 30, 993–997. [Google Scholar] [CrossRef]
  42. Carter, C.E.; Irvine, J.; McDaniel, V.; Dunckelman, J. Yield response of sugarcane to stalk density and subsurface drainage treatments. Trans. Am. Soc. Agric. Eng. 1985, 28, 172–178. [Google Scholar] [CrossRef]
  43. Condon, A.G.; Richards, R.A.; Rebetzke, G.J.; Farquhar, G.D. Breeding for high water-use efficiency. J. Exp. Bot. 2004, 55, 2447–2460. [Google Scholar] [CrossRef] [Green Version]
  44. Blum, A. Effective use of water (EUW) and not water-use efficiency (WUE) is the target of crop yield improvement under drought stress. Field Crops Res. 2009, 112, 119–123. [Google Scholar] [CrossRef]
  45. Zhu, X.-G.; Long, S.P.; Ort, D.R. Improving photosynthetic efficiency for greater yield. Annu. Rev. Plant Biol. 2010, 61, 235–261. [Google Scholar] [CrossRef] [Green Version]
  46. Eyland, D.; van Wesemael, J.; Lawson, T.; Carpentier, S. The impact of slow stomatal kinetics on photosynthesis and water use efficiency under fluctuating light. Plant Physiol. 2021, 186, 998–1012. [Google Scholar] [CrossRef]
  47. Lawson, T.; Blatt, M.R. Stomatal size, speed, and responsiveness impact on photosynthesis and water use efficiency. Plant Physiol. 2014, 164, 1556–1570. [Google Scholar] [CrossRef] [PubMed] [Green Version]
  48. Lawson, T. Guard cell photosynthesis and stomatal function. New Phytol 2009, 181, 13–34. [Google Scholar] [CrossRef] [PubMed]
  49. Von Caemmerer, S.; Furbank, R.T. Modeling C4 photosynthesis. In C4 Plant Biology; Sage, R.F., Monson, R.K., Eds.; Academic Press: San Diego, CA, USA, 1999; pp. 173–211. [Google Scholar]
  50. Jackson, P.; Basnayake, J.; Inman-Bamber, G.; Lakshmanan, P.; Natarajan, S.; Stokes, C. Genetic variation in transpiration efficiency and relationships between whole plant and leaf gas exchange measurements in Saccharum spp. and related germplasm. J. Exp. Bot. 2015, 67, 861–871. [Google Scholar] [CrossRef] [PubMed] [Green Version]
  51. Ghannoum, O. How can we breed for more water use-efficient sugarcane? J. Exp. Bot. 2016, 67, 557–559. [Google Scholar] [CrossRef] [Green Version]
  52. Long, S.P.; Zhu, X.-G.; Naidu, S.L.; Ort, D.R. Can improvement in photosynthesis increase crop yields? Plant Cell Environ. 2006, 29, 315–330. [Google Scholar] [CrossRef]
  53. Li, C.; Jackson, P.; Lu, X.; Xu, C.; Cai, Q.; Basnayake, J.; Lakshmanan, P.; Ghannoum, O.; Fan, Y. Genotypic variation in transpiration efficiency due to differences in photosynthetic capacity among sugarcane-related clones. J. Exp. Bot. 2017, 68, 2377–2385. [Google Scholar] [CrossRef] [Green Version]
  54. Evans, J.R. Improving photosynthesis. Plant Physiol. 2013, 162, 1780–1793. [Google Scholar] [CrossRef] [Green Version]
Figure 1. Schematic of the study area, sowing the plots with row spacing, varieties, and plant years included on the top of the plots. The shaded square in the middle of the plots represents the location of the TDR sensors. The location and orientation of the sensors within each trench were added as an inset.
Agronomy 12 01586 g001
Figure 2. Precipitation (mm) and plant-available water (mm; PAW) monthly through the experiment from 2017 to 2020. Precipitation is the sum of rain monthly, and PAW is the sum of average daily PAW for the three depths (15, 30, 45 cm). Total annual precipitation for 2017–2020 was 1875, 1614, 1720, and 1477 mm, respectively.
Agronomy 12 01586 g002
Figure 3. Volumetric water content (%) from September 2017 through September 2020. Row spacings of 1.8 and 2.4 m were represented by brown and yellow lines, respectively. Varieties included are HoCP 04-838 (ac) and L 01-299 (df). Soil moisture sensors were placed at three depths: 15 cm (a,d), 30 cm (b,e), and 45 cm (c,f). Row spacing of 2.44 m had more water than 1.83 m row spacing. The standard deviation of the mean VWC values was less than ±1% in 94.4% of the cases and less than 2% in 99.1% of the cases.
Agronomy 12 01586 g003
Figure 4. Plant−available water between 1.8 and 2.4−foot row spacing from September 2017 through September 2020. Plant−available water is soil moisture above a matric potential of −1.5 MPa. The total water available in the top 45 cm of soil is represented by the green light. The available water in each soil layer is represented by the shaded area between the lines.
Agronomy 12 01586 g004
Figure 5. Depth of compaction in the soil relative to the pressure necessary to insert the probe. Measurements were made in 2020 in the furrow (dashed line) and row (solid line). The soil depth is relative to the height of the row. Plant year is the year in which the plots were planted. There was no difference in the relationship between soil depth and pressure of compaction between varieties (L01−299 and HoCP 04−838).
Agronomy 12 01586 g005
Table 1. Soil characteristics with depth in plots separated by row spacing and sugarcane varieties. Volumetric water content (VWC), plant-available water (PAW; mm), and soil temperature were measured at soil depths of 15, 30, and 45 cm in 15-min intervals from September 2017 until September 2020. Daily means were calculated for VWC, PAW, and T, and the values here represent the mean daily value over the study. Table S1 separates data across the years 2017 to 2020 to show yearly trends. Tables S2–S4 give the ANOVA F-values and degrees of freedom for these tests.
DepthRow SpacingVarietyVWC †,‡Min. VWCMax. VWCPAW (mm) Min. PAWMax. PAWT (°C) †,*Min. TMax. T
15 cm1.8 mL 01-29933.0 ± 12.512.544.835.3 ± 9.64.652.920.5 ± 55.529.9
1.8 mHoCP 04-83832.1 ± 12.012.045.934.0 ± 10.73.954.620.4 ± 54.929.7
2.4 mL 01-29933.4 ± 13.413.445.536.0 ± 9.45.954.020.7 ± 5.14.330.6
2.4 mHoCP 04-83834.1 ± 13.113.146.436.9 ± 9.75.555.420.9 ± 55.430.5
30 cm1.8 mL 01-29936.7 ± 12.112.144.038.2 ± 7.41.449.320.5 ± 4.77.529.1
1.8 mHoCP 04-83835.4 ± 18.118.145.736.4 ± 6.410.351.820.5 ± 4.77.129.1
2.4 mL 01-29937.2 ± 23.423.447.539.0 ± 6.618.354.520.9 ± 4.66.029.7
2.4 mHoCP 04-83838.6 ± 23.123.147.141.1 ± 4.817.853.920.7 ± 4.87.429.6
45 cm1.8 mL 01-29937.5 ± 12.4 b12.448.837.4 ± 7.7 b0.054.320.4 ± 4.58.628.7
1.8 mHoCP 04-83839.3 ± 15.1 ab15.147.640.2 ± 8.8 ab3.952.620.6 ± 4.48.528.6
2.4 mL 01-29942.8 ± 29.6 a29.650.145.4 ± 6.7 a25.656.320.8 ± 4.57.529.1
2.4 mHoCP 04-83839.7 ± 21.0 ab21.049.240.7 ± 5.2 ab12.754.920.6 ± 4.58.629.1
At depths 15 and 45 cm, VWC and PAW were greater in 2.4 m rows than in 1.8 m (p < 0.05 for both depths). Rows of 2.4 m were greater than 1.8 m rows in all depths for T (p < 0.0001 for all depths). VWC, PAW, or T were not significantly different with variety at each depth (p > 0.05). At depth 45 cm, VWC and PAW followed by the same letter are not significantly different. * T was slightly greater in L01-299 than HoCP 04-838 at 30 cm soil depth.
Publisher’s Note: MDPI stays neutral with regard to jurisdictional claims in published maps and institutional affiliations.

