Article

Humic Acids Incorporated into Urea at Different Proportions Increased Winter Wheat Yield and Optimized Fertilizer-Nitrogen Fate

1
Key Laboratory of Plant Nutrition and Fertilizer, Ministry of Agriculture and Rural Affairs, Institute of Agricultural Resources and Regional Planning, Chinese Academy of Agricultural Sciences, Beijing 100081, China
2
College of Resources and Environmental Sciences, China Agricultural University, Beijing 100193, China
*
Author to whom correspondence should be addressed.
These authors contributed equally to this work.
Agronomy 2022, 12(7), 1526; https://doi.org/10.3390/agronomy12071526
Submission received: 16 May 2022 / Revised: 11 June 2022 / Accepted: 22 June 2022 / Published: 25 June 2022
(This article belongs to the Section Soil and Plant Nutrition)

Abstract

:
Humic acids (HAs) incorporated into urea fertilizers are highly effective at increasing yield and decreasing fertilizer-derived nitrogen (N) loss from soil, but reports of the optimal proportion in fertilizers remain widely inconsistent. In this study, we examined the effects of urea enhanced with 0.2–5.0% HAs (UHAs) on the yield, biomass production, N uptake, and N residue in fluvo-aquic soil in winter wheat cultivated over two growing seasons from 2018 to 2020 in the North China Plain. UHAs application significantly enhanced wheat grain yield, aboveground dry biomass, total and fertilizer-derived N uptake by wheat, and residue in soil, while reducing the loss of fertilizer-derived N. Additionally, UHAs treatments increased fertilizer-N residues in soil, especially in the top 30 cm soil layer, which increased with the proportion of added HAs. These positive effects were attributed to a higher spike number under UHAs treatments compared to conventional urea. Clustering analysis of the different treatments showed that 0.2% HAs were more similar to conventional urea, while 0.5% had similar effects to HAs at higher proportions. UHAs application significantly enhanced wheat grain yield, mainly via increasing spike number, and optimized the fertilizer-N fate. Among UHAs treatments, 0.5% HAs showed the highest increase in economic benefit.

1. Introduction

Nitrogen (N) fertilizer is an essential factor for higher yield wheat production [1,2], but can be rapidly depleted through ammonia volatilization and runoff during transformation in soil, resulting in low use efficiency [3]. The N use efficiency (NUE) of urea, the most important N fertilizer, is commonly estimated to be around 40%, indicating a vast loss and waste of applied N, in addition to the accompanying resource waste and the risk of environmental pollution [4]. Thus, mitigating the loss of fertilizer-derived N (fertilizer-N) and/or improving NUE has become the focus of considerable agronomic research attention. Subsequently, the development of high-efficiency N fertilizer has emerged as one of the most effective approaches [5,6]. For example, the modification of urea fertilizer with nutrient enhancers has gained popularity among fertilizer researchers and manufacturers because it requires relatively low inputs to induce high increases in NUE [7,8].
Among these candidate nutrient enhancers, humic acids (HAs) in particular have become widely used as an additive to modify urea fertilizers, due to their effects on plant growth and urea conversion. HAs perform a biostimulant effect in promoting plant growth and increasing crop yield [9,10,11]. HAs characteristically carry an abundance of carboxyl and other oxygen-containing functional groups that facilitate their complex formation with N in urea or NH4+, which ultimately slows the release of urea-N and retains NH4+ in soil [12,13,14]. Additionally, HAs show a high capacity for inhibiting and stabilizing urease (an enzyme tightly linked to the transformation of urea-N) activity at early and later periods of urea conversion, respectively [15], and strongly affect soil microbiota population size and structure related to N conversion [16]. These attributes of HAs, in addition to their wide availability, support their use as a nutrient enhancer for modifying urea to generate products, such as urea enhanced with humic acids (UHAs), that increase fertilizer efficiency and crop productivity [8].
Field experiments assessing the efficacy of UHAs have shown that the addition of 0.5% HAs can significantly increase both yields and NUE rates by 5.58–18.67% and 3.70–12.00 percentage points, respectively, in maize and wheat [17,18]. Other studies have verified these positive effects with 15% HAs in UHAs [19] and with an organic-inorganic fertilizer formulation containing 65% HAs, which led to 8–28% higher yields than with conventional urea [20]. Despite the support for the use of HAs provided by these studies, the optimal proportion of HAs in UHAs remains unclear, with extremely wide variation in proposed levels. Additionally, HAs exhibit stimulatory effects on plant growth at 50–500 mg kg−1, but inhibitory effects at 1000–4000 mg kg−1 [21], similar to results verified by Arancon et al. [22]. However, when used as a urease inhibitor, the urease activity inhibition rate was positively correlated with the proportion of added HAs [23]. This trend was replicated by a field study that showed that urea blended with brown coal, which contains abundant HAs, could reduce the amount of mineral N lost through leaching, ammonia volatilization, and N2O emission by increasing the proportion of brown coal [24]. Conversely, work by Zhao and colleagues [8] suggested that trace amounts of HAs, i.e., less than 0.5%, in urea fertilizer was enough to lead to strong positive effects on plant growth.
In order to resolve these inconsistencies in the reported effects of HAs in UHAs and also verify the optimal additive proportion of HAs incorporated into UHAs, we investigated whether and how different ratios of HAs to urea in UHAs affected yield, biomass production, and N uptake in winter wheat, as well as the fate of fertilizer-N in soil, over two consecutive growing seasons in the North China Plain. The results provided by this work can serve as a direct reference for guiding the development of optimal UHAs fertilizers for winter wheat.

2. Materials and Methods

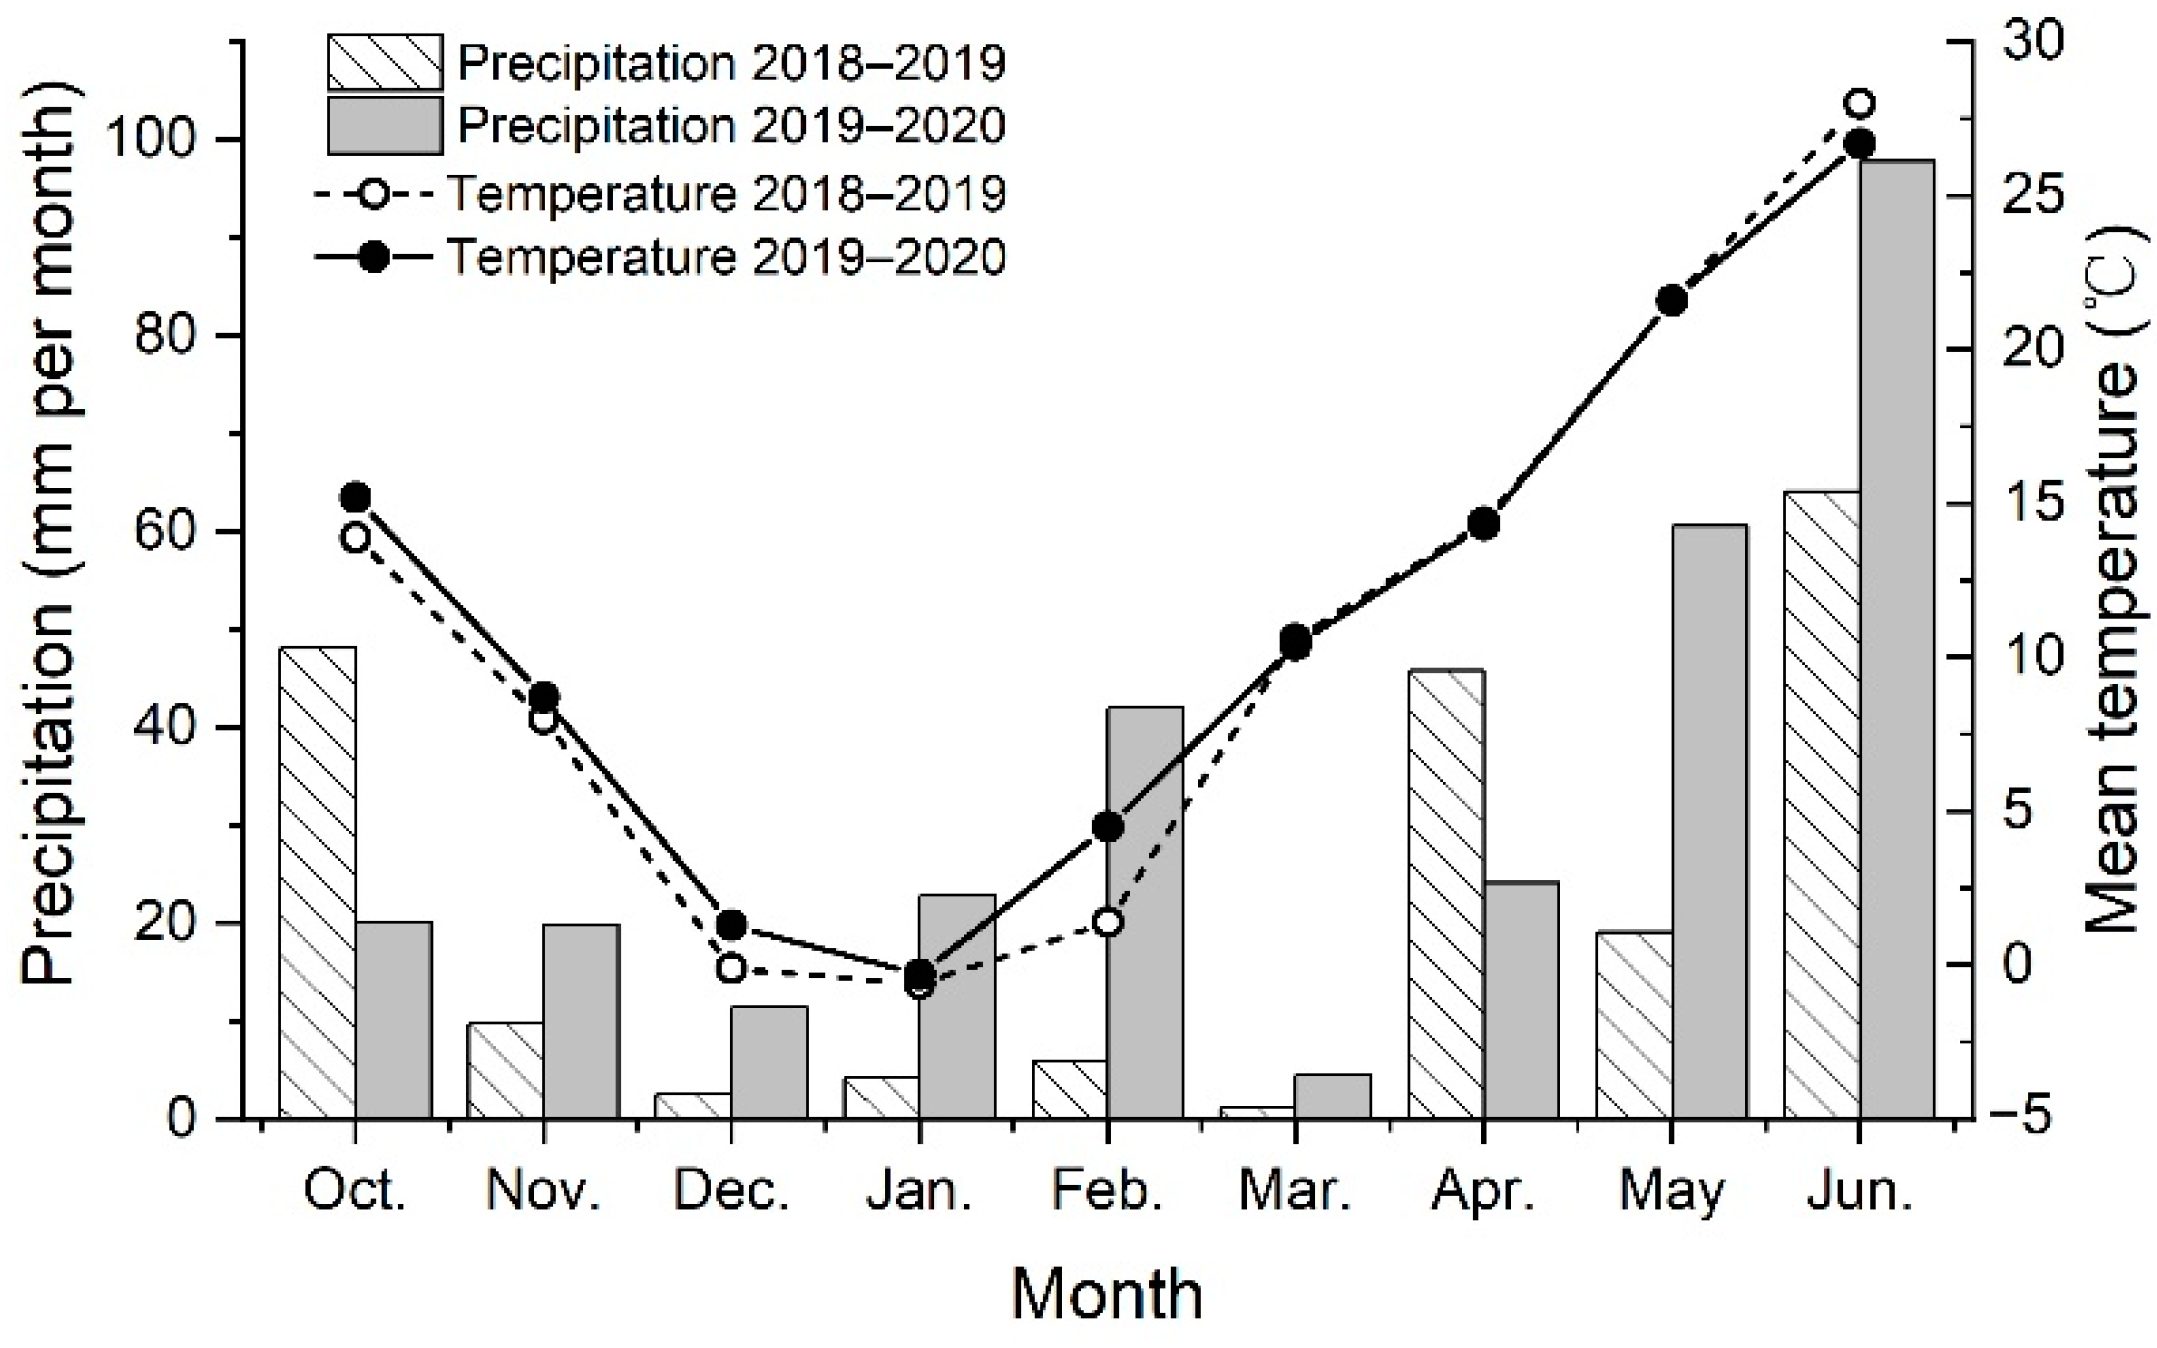
2.1. Experimental Site

An outdoor soil column experiment was conducted at the Saline-Alkaline Soil Improvement Experiment Station in Dezhou of Chinese Academy of Agricultural Sciences, located at Yucheng, in Dezhou, Shandong Province, China (116°34′ E, 36°50′ N, elevation 21.2 m above sea level) during two consecutive winter wheat growing seasons (2018–2019 and 2019–2020). The station lies in the North China Plain, with a warm temperate zone continental monsoon climate. Monthly air temperature (°C) and precipitation (mm) during wheat growing seasons were obtained from a local meteorological bureau and shown in Figure 1.
According to the installation method from Zhang et al. [18], the soil columns with open ended polyvinyl chloride pipes (30 cm diameter, 1 m deep) used in this experiment were arranged as in Figure 2A. The 0–30 and 30–90 cm soil layers in the columns were packed with 0–20 cm and 20–90 cm, respectively, of fluvo-aquic soil collected from a nearby site. The soil was compacted to keep the same bulk density as that of the original site.

2.2. Experimental Materials

HAs were extracted from weathered coal (Holinhe, Tongliao, Inner Mongolia), following the method described in our previous study [25], and its structural and compositional characteristics were also consistent with our reported results [18,25]. 15N labelled urea was purchased from Shanghai Research Institute of Chemical Industry Co. Ltd. (Shanghai, China) with 10.20% of 15N abundance. Urea enhanced with humic acids (UHAs) and conventional urea (U) used in this study were prepared as described by Zhang et al. [18]. Within, UHAs fertilizers with 0.2%, 0.5%, 1.0%, 2.0%, and 5.0% of HAs in weight addition were labelled as UHAs0.2, UHAs0.5, UHAs1.0, UHAs2.0, and UHAs5.0, respectively, and conventional urea (U) was prepared in the same manner as the UHAs, but without the addition of HAs. The basic properties of the UHAs and U were determined using the methods described in “urea containing humic acid” (HG/T 5045-2016), published by the Ministry of Industry and Information Technology of the Peoples’ Republic of China (Table 1). In addition, monopotassium phosphate (AR, produced by Sinopharm Chemical Reagent Co., Ltd., Shanghai, China) and potassium chloride (AR, produced by Sinopharm Chemical Reagent Co., Ltd.) were used as sources of phosphorus (P) and potassium (K).
Fluvo-aquic soil that had received no fertilizer input for three years was collected from the field around the experimental site. The soil from the 0–20 cm and 20–90 cm layers was separately collected, air-dried, ground, and passed through a 1 cm sieve. The physical and chemical parameters of the soil were determined according to the methods from Lu [26] and the pH value was assessed with the ratios of soil to deionized water at 1:2.5 (w/v). The results were listed in Table 2. The total N content was 0.63–0.71 g kg−1, indicating that the soil used for the research was poor in total nitrogen.
The wheat cultivar used in this study was ‘Jimai 22′, a variety widely cultivated in the North China Plain.

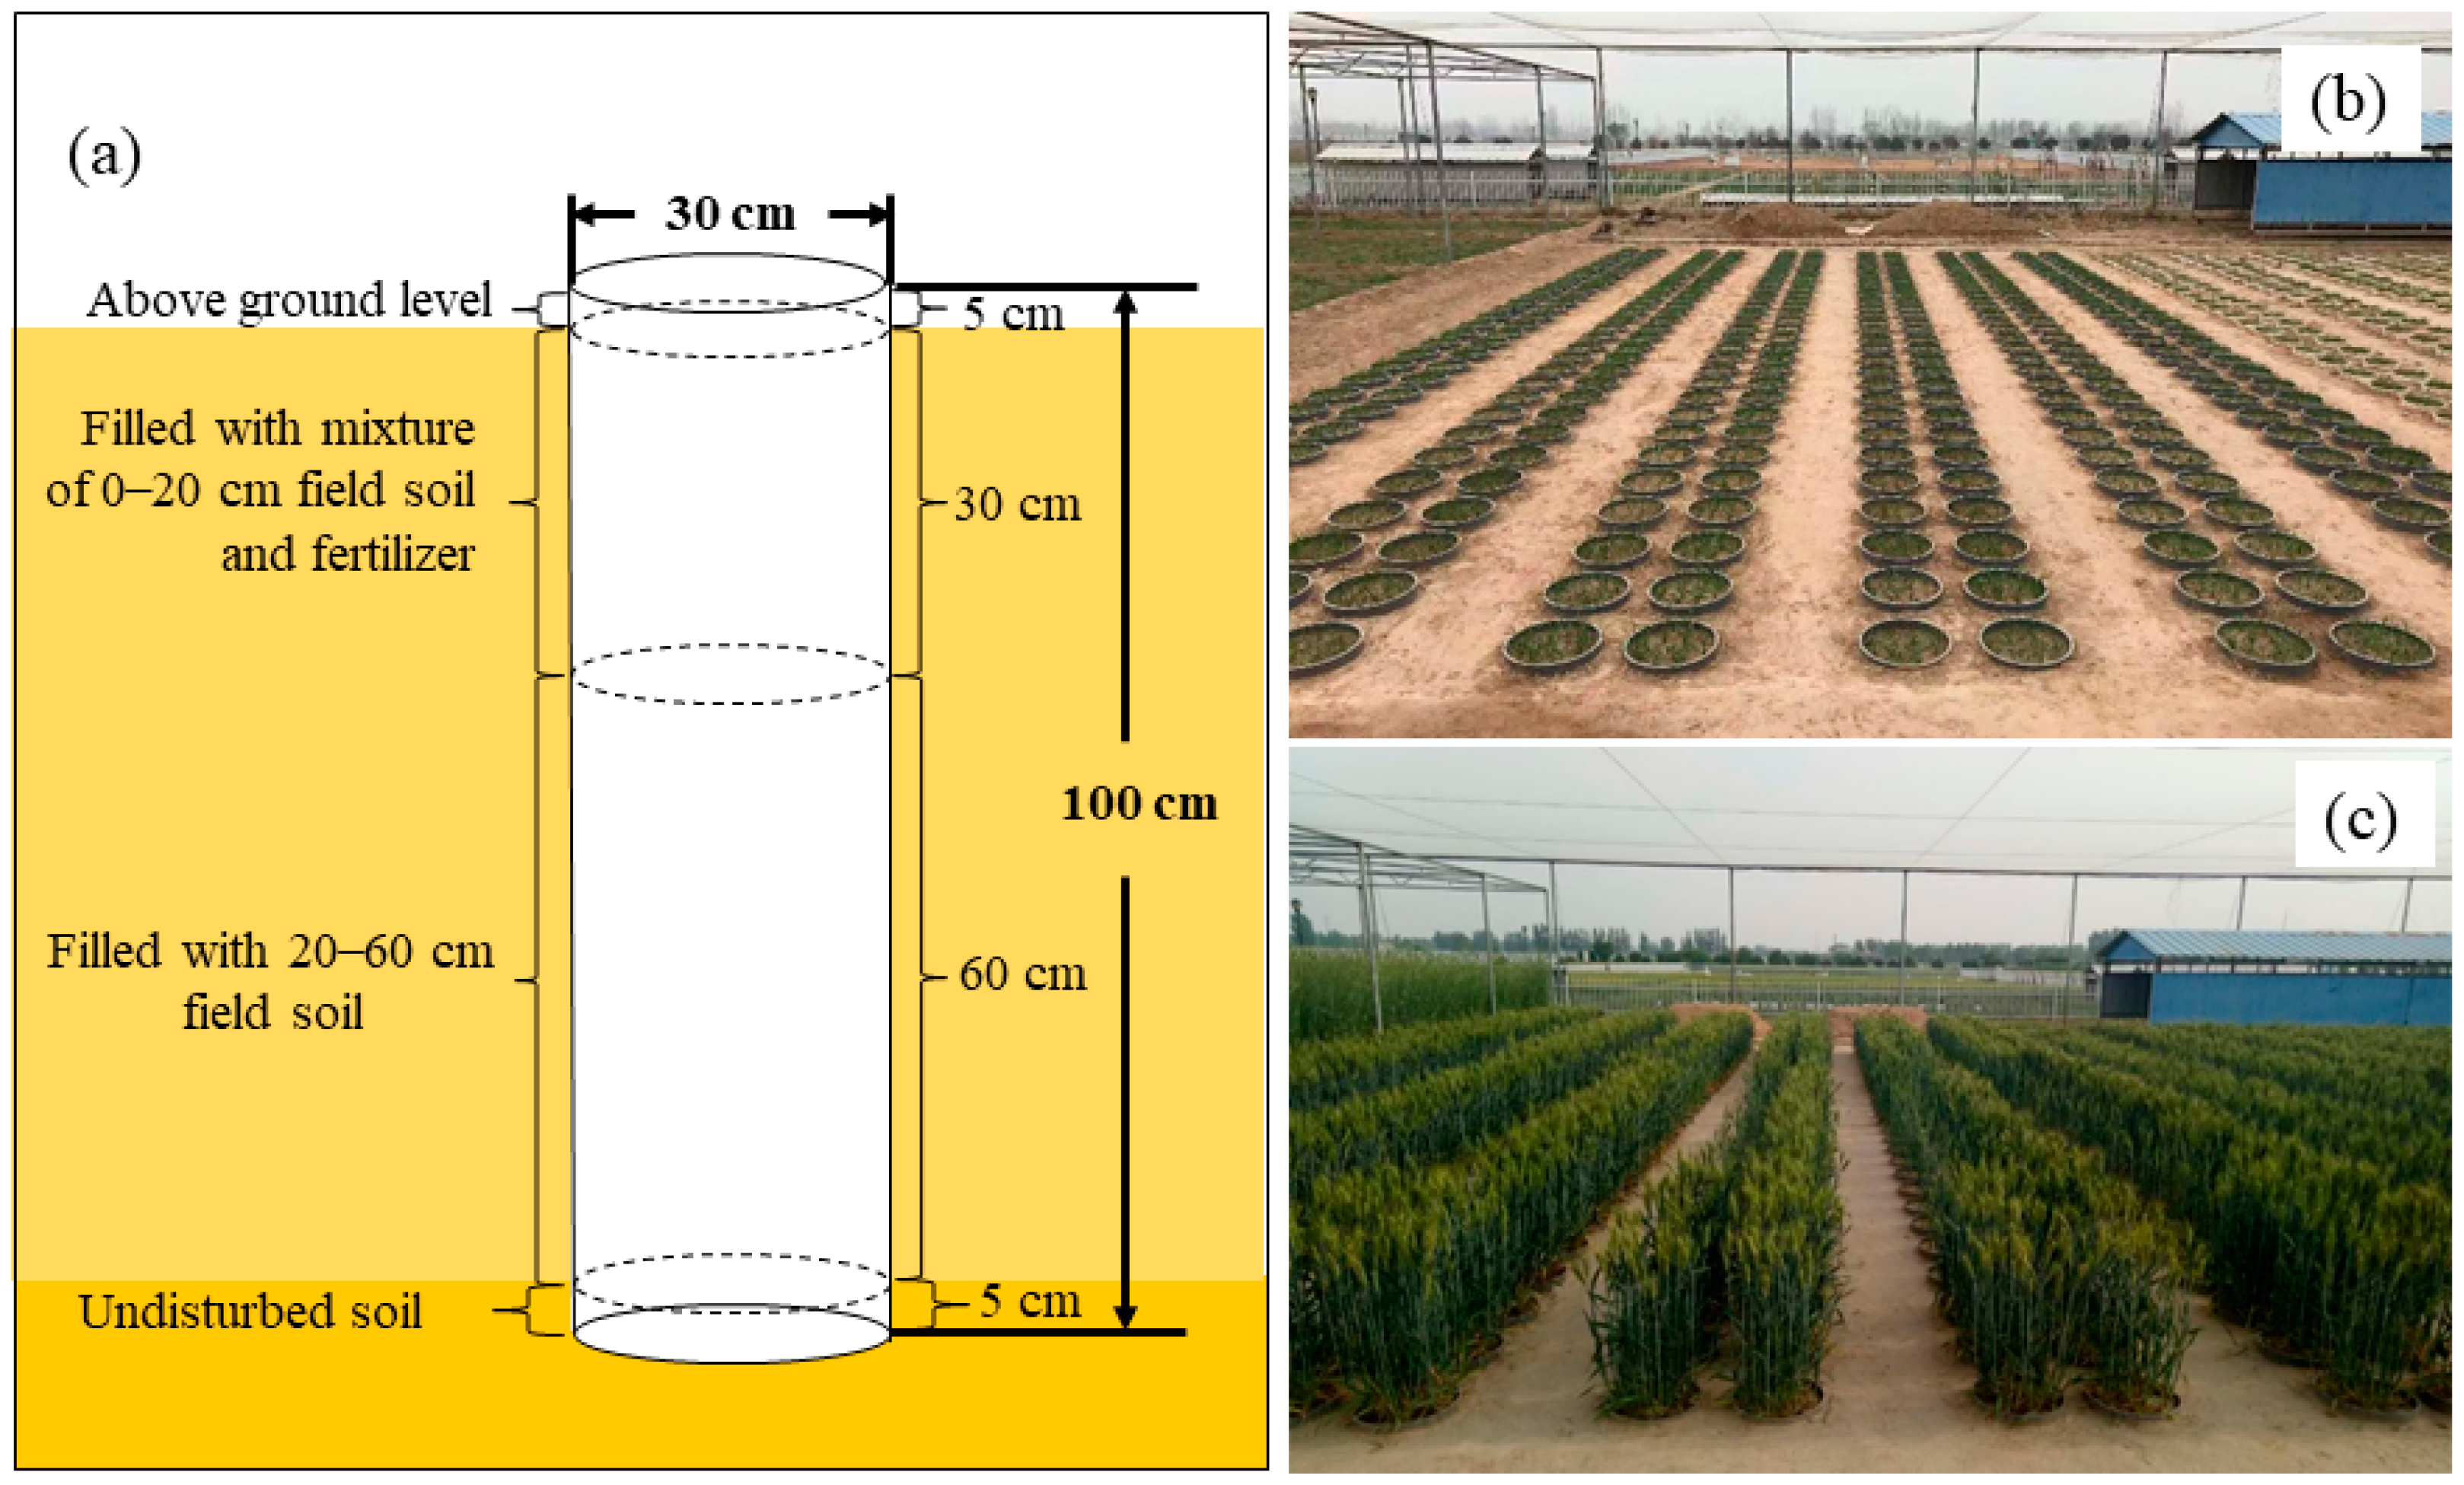
2.3. Experimental Design and Field Management

In this study, we arranged seven treatments in a completely randomized design with four replicates. Briefly, the treatments included the above six U or UHAs formulations in Table 1 and a non N fertilizer input as control (CK). The fertilizer application rate in all N-fertilizer treatments was set at 0.15 g N kg−1 soil (approximately 225 kg N ha−1), 0.2 g P2O5 kg−1 soil (approximately 300 kg P2O5 ha−1), and 0.2 g K2O kg−1 soil (approximately 300 kg K2O ha−1). N was set at the local optimal application rate, while P and K were higher than conventional to ensure their abundant supplies. The application amount for each soil column was calculated according to the soil weight in 0–30 cm soil layers and all the fertilizers were mixed thoroughly before packing. CK received the same rate of P and K as the N-fertilizer treatments, except no N input. The filling of soil columns was conducted as described by Zhang et al. [18] and the 0–30 cm soil was filled with all fertilizers thoroughly mixed as base fertilizer on 23 October 2018 and 11 October 2019.
The wheat seeds were sown at a 3–5 cm depth from the soil surface on 26 October 2018 and 14 October 2019 and harvested on 8 June 2019 and 6 June 2020, respectively. There were 36 seeds sown per pot and seedlings were thinned to 12 at the trefoil stage. Field management was carried out in accordance with the practices of local farmers.

2.4. Sampling and Analysis

At maturity, the spike number per soil column was counted. Subsequently, the aboveground parts from each treatment were cut at the soil-surface level and separated into straw and grains. Fresh samples were heated in an oven for 30 min at 105 °C to deactivate enzymes and then oven-dried at 70 °C to a constant mass and weighed. The 1000-grain weight was recorded. The dried samples were ground and sieved through a 0.25-mm mesh for total N, δ15N, and 15N abundance analysis with elemental analyzer-isotope ratio mass spectrometry (Elementar Analysensysteme GmbH (Langenselbold, Germany), Vario MAX CN Carlo Erba NA1500).
After harvesting the wheat, soil was sampled from the central area of each soil column using a cylindrical auger (38 mm inner diameter). The samples to a depth of 90 cm were taken and separated into three layers of 30 cm each. The soil from each layer was mixed thoroughly, air-dried, ground, and sieved through a 0.25-mm mesh for subsequent total N, δ15N and 15N abundance analysis with elemental analyzer-isotope ratio mass spectrometry (Elementar Analysensysteme GmbH, Vario MAX CN Carlo Erba NA1500).

2.5. Statistical Calculation and Analysis

The fertilizer-N fate was calculated according to the formula listed in Zhang et al. [27] and the income and cost was calculated as follows:
UHAs   application   amount   ( kg   ha 1 ) = Local   farmer   accustomed   N   input   amount N   content   in   UHAs
where, the local farmer accustomed N input amount was 225 kg ha−1.
Fertilizer   cos t   increase   ( USD   ha 1 ) = HAs   proportions   in   UHAs × HAs   price   per   unit + other   cost 1000 × UHAs   application   amount
where HAs price per unit was 725 USD t−1 and other cost for urea per ton was 0.45 USD t−1.
Yield   increase   rate   of   UHAs   ( % ) = Grain   yield   of   UHAs Grain   yield   of   conventional   U Grain   yield   of   conventional   U × 100 %
Wheat   output   value   increase   ( USD   ha 1 ) = Conventional   yield × Wheat   price   per   unit × Yield   increase   rate   of   UHAs
where local conventional yield was 7200 kg ha−1 and wheat price per unit was 0.36 USD kg−1.
Final   economic   benefit   increase   ( USD   ha 1 ) = Wheat   output   value   increase Fertilizer   cos t   increase
Most statistical analysis in this study was performed using SAS software (SAS 8.0, Cary, NC, USA). The differences (p < 0.05) between treatments were analyzed by least significant difference (LSD) following the standard analysis of variance (ANOVA) procedure. Pearson correlation analysis was performed to clarify the relationships among aboveground dry biomass, total N uptake, and fertilizer-N uptake, as well as the relationship between the additive amount of HAs and fertilizer-N fate. All treatments with N input were clustered with the single linkage method using wheat yield, aboveground dry biomass, and fertilizer-N fate as investigation indices. In addition, path analysis was conducted with SPSS 19.0 software to evaluate the relationship between the yield and its components.

3. Results

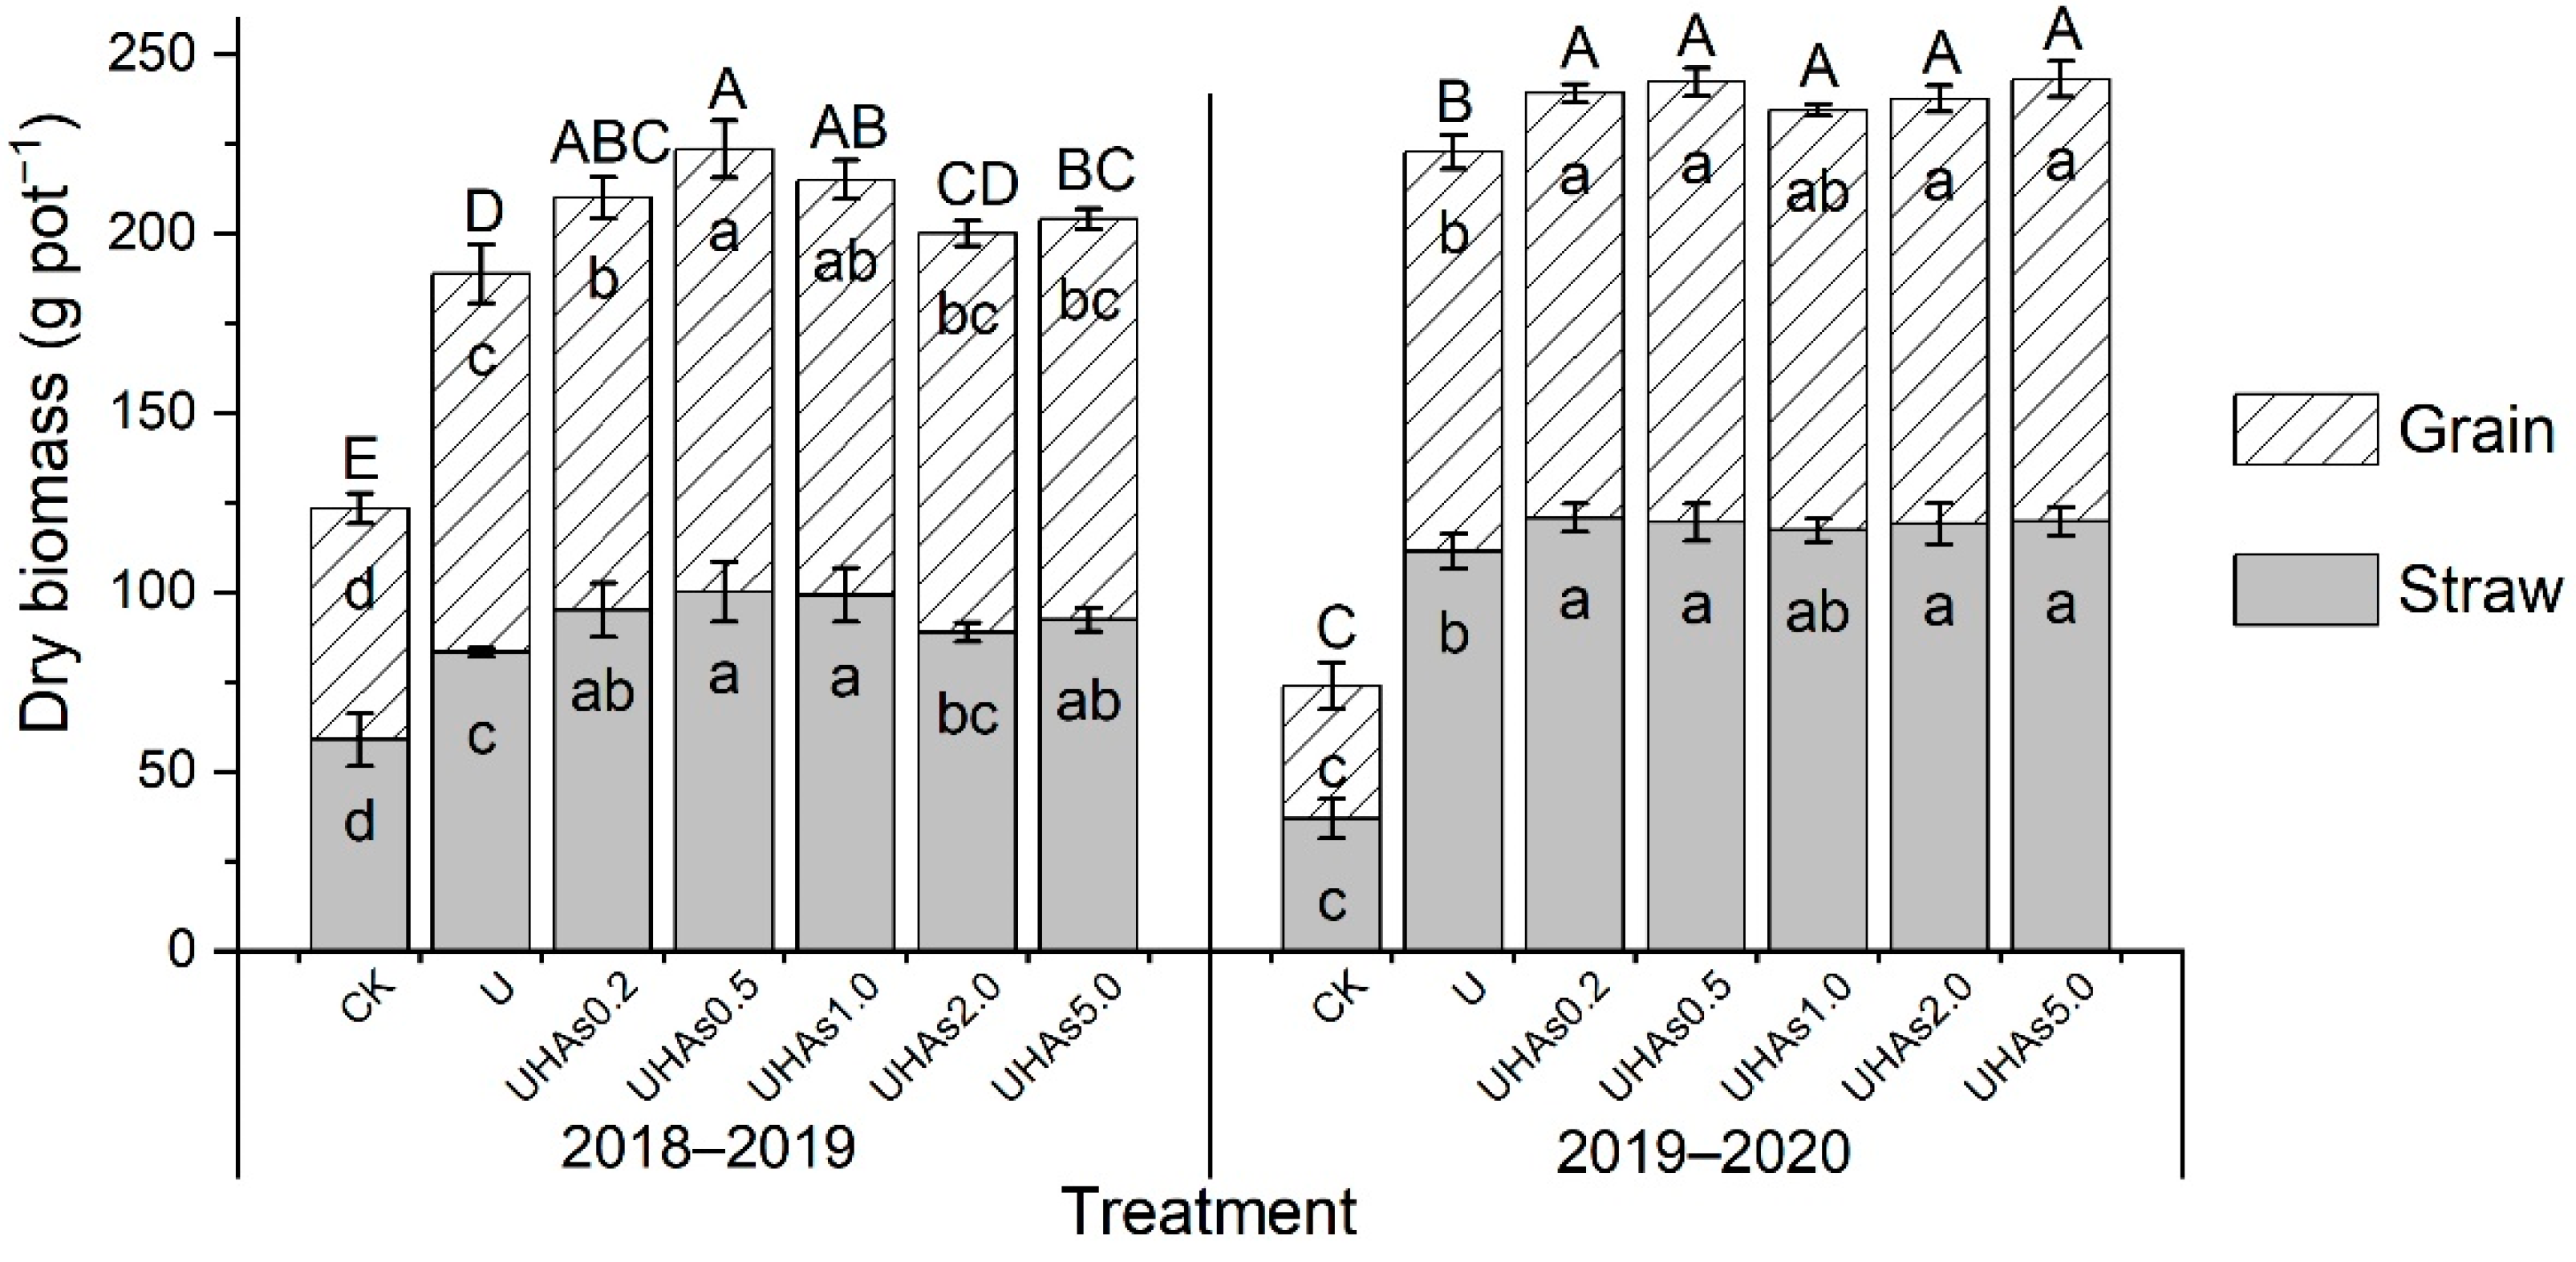
3.1. Wheat Yield and Yield Components

Quantitative assessment of aboveground dry biomass and yield-related traits of winter wheat under different proportions of HAs in UHAs fertilizer during the 2018–2019 and 2019–2020 growing seasons are shown in Figure 3. The results showed that grain, straw, and total aboveground dry biomass of mature wheat significantly increased under UHAs fertilization treatments over that of U by 5.15–16.93%, 5.32–20.23%, and 5.23–18.38%, respectively (p < 0.05). Among different UHAs applications, significant differences in grain, straw, and total dry biomass related to HAs proportions were only observed in the 2018–2019 growing season. During the 2018–2019 and 2019–2020 growing seasons, the grain yields of wheat treated with UHAs0.5 were 123.42 g pot−1 and 122.77 g pot−1, respectively, which were higher than those observed under most other UHAs fertilizer formulations. By contrast, in the 2018–2019 growing season, the grain yields of wheat treated with UHAs0.2 and UHAs2.0 were 115.00 g pot−1 and 111.30 g pot−1, respectively, which were lower than those observed under other UHAs fertilizer formulations and thus UHAs0.2 and UHAs2.0 showed weaker positive effects on grain yield than other UHAs.
In addition, UHAs application led to a significantly increased spike number per pot and 1000-grain weight compared to treatment with conventional U, although grain number per spike did not significantly differ between UHAs and U treatments (Table S1). We also conducted path analysis to identify potential relationships between crop yield and yield components (details listed in Table 3). During both growing seasons, spike number per pot and 1000-grain weight were positively correlated with grain yield, with the former index consistently showing a higher correlation coefficient than the latter. The direct path coefficient between yield and the individual components ranged from 1.045 to 0.350, in descending order, with spike number per pot > grain number per spike >1000-grain weight. The values of the decision coefficients were generally low, but much larger than the indirect path coefficients. The positive decision coefficients were highest for yield and spike number per pot, followed by those of yield and 1000-grain weight, with yield and grain number per spike showing no definitive relationship. Taken together, these results indicated that, compared with conventional U, UHAs application significantly enhanced yield of winter wheat by increasing spike number.

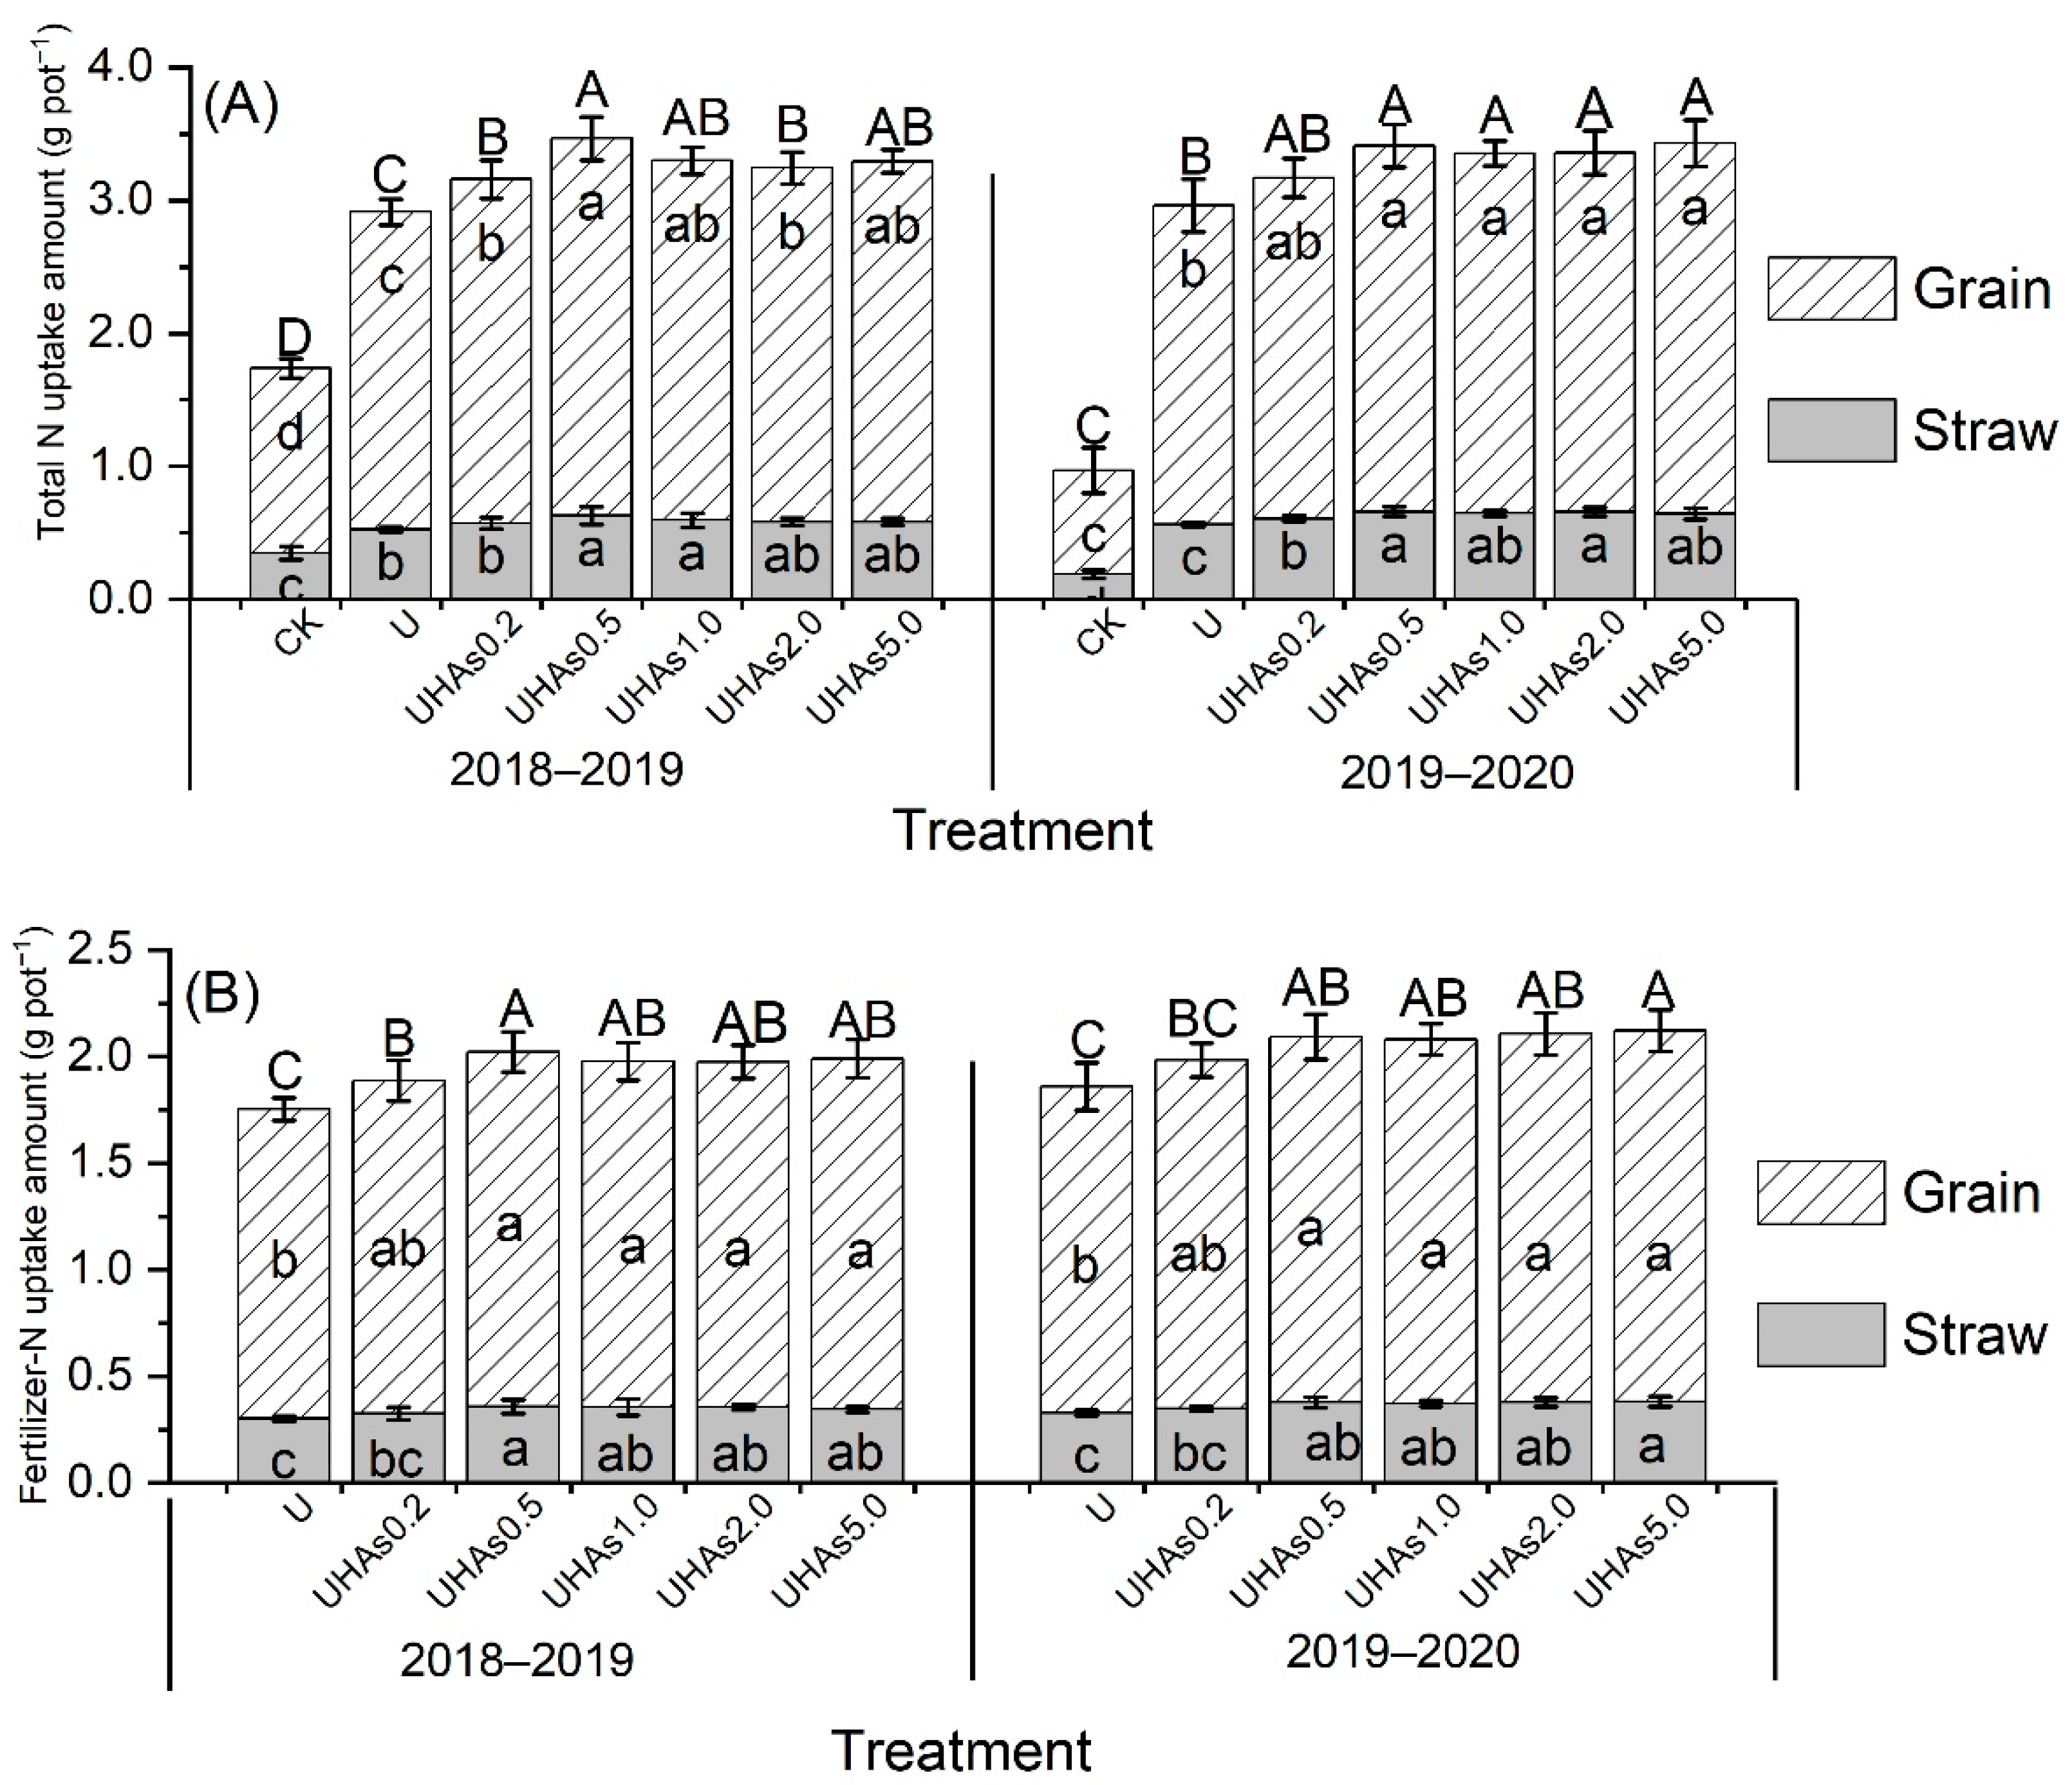
3.2. N Uptake in Mature Winter Wheat

We then examined whether, and how, the different formulations of UHAs affected N uptake in wheat and found that total N uptake in aboveground biomass under all N fertilizer treatments was significantly higher than that under the untreated controls (Figure 4A). In grains, N uptake ranged from 2.562 to 2.836 g pot−1 in UHAs treatments, significantly higher than that in U by 8.25–18.81% in 2018–2019 and by 6.95–16.25% in 2019–2020. Although N uptake in straw and total aboveground biomass trended lower under the U treatment, the difference was not strongly significant to that of the UHAs treatments. Among UHAs treatment groups, UHAs0.2 application resulted in the lowest N uptake, while UHAs0.5 resulted in the highest uptake in total biomass measurements in growing seasons. Additionally, no significant differences in N uptake were found among the UHAs1.0, UHAs2.0, and UHAs5.0 treatment group.
We then detected the uptake of N specifically obtained from fertilizer and found that the incorporation of 0.5–5.0% HAs resulted in significantly higher fertilizer-N uptake into the aboveground biomass, while the fertilizer-N uptake under UHAs0.2 treatments consistently trended non-significantly higher than uptake under conventional U (Figure 4B). While fertilizer-N uptake in straw was significantly lower under UHAs0.2 application than all other UHAs treatments, UHAs0.5 led to the highest fertilizer-N uptake in 2018–2019 and the third highest in the 2019–2020 growing season. However, no significant differences in fertilizer uptake were observed among UHAs treatments, except that UHAs0.2 was significantly lower than UHAs5.0 in the 2019–2020 growing season. Cumulatively, these results suggested that the addition of HAs to urea fertilizers could enhance total N and fertilizer-N uptake in mature winter wheat and that 0.5% HAs provided the strongest effects among these treatments.

3.3. Fertilizer-N Distribution in Soil at Wheat Maturity

In light of our findings around N-uptake under different UHAs formulations, we next examined the distribution of residual fertilizer-N in soil (Table 4). In general, the higher the proportion of HAs incorporated into the fertilizer, the greater the residual fertilizer-N amounts detected in the top 90 cm soil layer. In addition, the total residual fertilizer-N under 1.0–5.0% HAs incorporated into urea treatments was significantly higher than conventional U. We found that approximately 47.69–55.65% of residual fertilizer-N was concentrated in the top 30 cm of soil, where UHAs showed the greatest difference (10.16–21.71% higher) to U treatments in residual N. In the 2019–2020 growing season, UHAs2.0 and UHAs5.0 treatments had significantly more residual N (by 0.022 g pot−1 and 0.030 g pot−1) than UHAs0.2 in the 0–30 cm soil layer. However, no significant differences in residual fertilizer-N were detected in the 2018–2019 growing season.

3.4. Fertilizer-N Fate in the Plant-Soil System at Wheat Maturity

To better understand the effects of HAs on the fate of fertilizer-N, we calculated the NUE and loss rates for fertilizer-N in the plant-soil system at wheat maturity (Table 5). The results showed that the largest percentage of total applied N (44.64–54.05%) was taken up by the winter wheat. Notably NUE was significantly higher in plants treated with UHAs, by 3.13–6.88 percentage points, compared to that in plants given conventional U. In agreement with our above experiments, UHAs0.2 was accompanied by the lowest NUE among UHAs treatments. The calculation of the residual rate showed that UHAs1.0, UHAs2.0, and UHAs5.0 treatments had significantly higher residual fertilizer-N than U by 1.59–2.13 percentage points, although differences in residual N were largely non-significant among UHAs treatments. Finally, we determined the rate of N loss among treatment groups and found that this value was significantly lower by 3.85–8.79 percentage points in UHAs formulations than for conventional U, while the loss rate under UHAs0.2 application was significantly higher than for other UHAs treatments. Collectively, these results suggest that 0.5% HAs incorporated into urea fertilizer provides the highest use efficiency and the lowest loss of N with the least HAs inputs.

4. Discussion

4.1. Higher Wheat Yields under UHAs Treatment Correlated with Increased Spike Number

In this work, we examined the effects of different proportions of HAs in urea fertilizer on yield, N uptake, and the fate of fertilizer-N in winter wheat over two growing seasons from 2018 to 2020. The results confirmed that the application of UHAs enhances wheat yield, in agreement with other previous reports [17,28] and the thesis from Li [29] and Zhang [30]. This enhancement appeared to be supported by the stimulatory effects of HAs on wheat seedling growth [31] and was also attributed to the slow-release and long-acting fertilizer-N in UHAs, due to the incorporation of HAs and urea to form amide-N [13,14,25]. As for different UHAs fertilizer formulations, the wheat fed with UHAs0.5 showed a higher grain yield than that treated with other UHAs, while UHAs0.2 and UHAs2.0 showed weaker positive effects (Figure 3), indicating that the response of wheat grain yield to HAs proportions in UHAs accorded with a parabolic function in this study. This trend is more similar with the concentration-dependent stimulatory effects of HAs on plant growth than the binding amount of nitrogen varied with HAs addition [32,33]. Thus, it seems that the enhanced wheat yield treated with UHAs was more attributed to the stimulation of HAs in UHAs on wheat growth, rather than the retention and slow release of fertilizer-N, while the accurate mechanism could be clarified by intensive study.
In previous work we found that 1000-grain weight was the main factor contributing to elevated yield in response to UHAs [29], while other studies have suggested that the available spike number has more influence over yield [17] or that increased yield under UHAs application is attributable to increases in all yield components [28]. Thus, the component that contributes most to enhancing yield remains unclear. Path analysis has been used to clarify relationships between crop yield and individual yield components [34] (shown in Table 3). Our analysis showed that spike number in particular had a higher simple correlation coefficient, direct path coefficient, and decision coefficient with winter wheat yield in both growing seasons (p < 0.05). In comparison, 1000-grain weight had lower correlation coefficients, while those of grains per spike were inconsistent, suggesting it was not a major determining factor. We therefore concluded that increasing spike number is critical for increasing wheat yield by UHAs application, indicating that different effects between UHAs and U were generated before wheat anthesis [35], indicating that the enhanced efficiency occurred at the early stage of wheat growth.

4.2. Higher N Uptake and NUE under UHAs Applications with Lower Loss Rates

The fates of fertilizer-N fate shown in Table 5 are consistent with previous studies that reported higher use efficiency and residual N, with lower N loss rates accompanying UHAs application compared to fertilization with conventional U [8,17]. Correlation analysis exploring the relationship between UHAs and fertilizer-N fate (Tables S2 and S3) identified a significant correlation between aboveground dry biomass and N uptake (both total and fertilizer-N), indicating that the increase in wheat biomass following UHAs application likely drives the observed increase in N uptake. This verified our above speculation that the stimulation of HAs in UHAs on wheat growth played a vital role in the excellent performance of UHAs. In addition, we checked for relationships between the proportion of HAs and fertilizer-N fate (Table S3) and found that residual fertilizer-N levels were positively associated with the percentage of HAs in the formulations, verifying that the incorporation of HAs with urea results in higher amounts of N residue in soil. This effect could be partially explained by other reports that show more nitrogen is complexed into slow-release forms and more NH4+ is retained in the soil with increasing proportions of HAs in UHAs [12]. Notably, the significantly negative correlation between fertilizer-N loss rates and residual N or N taken up by plants suggests that the increase in fertilizer-N uptake and soil residues under UHAs treatments resulted in the reduction in the fertilizer-N loss rate [8]. Our results also showed that N loss was more strongly correlated with fertilizer-N uptake, which is attributed to fertilizer-N uptake accounting for a higher proportion of fertilizer-N fate and showing a greater variation among treatments, compared to N residues in soil (Table 5), similar to trends reported by Zhang et al. [18]. Thus, these results showed that enhanced wheat growth following UHAs application is beneficial to N utilization, which contributes to reducing fertilizer-N loss. Additionally, since HAs may increase fertilizer-N residues in soil, UHAs application can be used to optimize fertilizer-N fate.

4.3. Use of 0.5% HAs in UHAs Optimally Enhances Yield and Fertilizer-N Fate of Winter Wheat

Given the overlap and complexity in our observed trends, as well as the interconnected nature of the indices assessing growth and fertilizer-N fate, we carried out cluster analysis to identify potential similarities in the effects of various N fertilizer formulations (Figure S1). The results showed that UHAs0.2 occupied a cluster with conventional U, forming a more distant group from other UHAs treatments, which suggested that 0.2% HAs was insufficient to obviously improve urea fertilizer. By contrast, the remaining UHAs treatments were clustered together, indicating that differences in the effects of these treatments are limited. Furthermore, cost-benefit analysis for UHAs treatments (Table 6) indicated that the increase in fertilizer cost due to the addition of 0.2–5.0% HAs, relative to the increase in wheat output value, could increase profits by 111–437 USD ha−1. In particular, UHAs0.5 (0.5% HAs) provided a higher economic benefit than other UHAs formulations over both growing seasons. Taken together, this study indicated that 0.5% HAs is the optimal amount for incorporation into urea fertilizer for winter wheat production.

5. Conclusions

Compared with conventional U, UHAs application significantly enhanced aboveground dry biomass and yield in winter wheat by increasing spike number. The increase in aboveground biomass production contributed to observed increases in total N and fertilizer-N uptake, while decreasing the loss rate of fertilizer-N. Moreover, UHAs treatments increased fertilizer-N residues in soil, especially in the top 30 cm soil layer, which increased with the proportion of added HAs. Among UHAs formulations, 0.5% HAs showed the highest increase in economic benefit while providing similar or better efficacy to treatments with higher proportions of HAs, suggesting that 0.5% is the optimal amount of HAs for fertilization of winter wheat.

Supplementary Materials

The following supporting information can be downloaded at: https://www.mdpi.com/article/10.3390/agronomy12071526/s1, Table S1: Yield components of mature winter wheat under different proportions of HAs in urea fertilizer formulations; Table S2: Correlation between N uptake amount and aboveground dry biomass; Table S3. Correlation between proportions of HAs in urea fertilizer formulation and fertilizer-N fate; Figure S1. Cluster of urea fertilizer formulations incorporated with different proportions of HAs during the 2018–2019 (A) and 2019–2020 (B) growing seasons.

Author Contributions

Conceptualization and methodology, B.Z.; software, validation, formal analysis, investigation, S.G. and S.Z.; resources, data curation, L.Y. and Y.L.; writing—original draft preparation, S.Z. and S.G.; writing—review and editing, B.Z.; visualization, S.G., S.Z., L.Y., Y.L. and S.H.; supervision, Y.W. and J.X.; project administration, Y.L.; funding acquisition, B.Z. and L.Y. All authors have read and agreed to the published version of the manuscript.

Funding

This research was funded by China Agriculture Research System (CARS-03) and National Key Research and Development Program of China (2016YFD0200402).

Data Availability Statement

Not applicable.

Acknowledgments

We acknowledged Yan’ge Yan and Yuan Liu for the assistance during the sample pretreatments.

Conflicts of Interest

The authors declare no conflict of interest.

References

  1. Makino, A. Photosynthesis, Grain yield, and nitrogen utilization in rice and wheat. Plant Physiol. 2010, 155, 125–129. [Google Scholar] [CrossRef] [PubMed] [Green Version]
  2. Liu, B.; Zhao, X.; Li, S.; Zhang, X.; Virk, A.L.; Qi, J.; Kan, Z.; Wang, X.; Ma, S.; Zhang, H. Meta-analysis of management-induced changes in nitrogen use efficiency of winter wheat in the North China Plain. J. Clean. Prod. 2020, 251, 119632. [Google Scholar] [CrossRef]
  3. Zhang, X.; Davidson, E.A.; Mauzerall, D.L.; Searchinger, T.D.; Dumas, P.; Shen, Y. Managing nitrogen for sustainable development. Nature 2015, 528, 51–59. [Google Scholar] [CrossRef] [PubMed] [Green Version]
  4. Ju, X.; Xing, G.; Chen, X.; Zhang, S.; Zhang, L.; Liu, X.; Cui, Z.; Yin, B.; Christie, P.; Zhu, Z. Reducing environmental risk by improving N management in intensive Chinese agricultural systems. Proc. Natl. Acad. Sci. USA 2009, 106, 3041–3046. [Google Scholar] [CrossRef] [PubMed] [Green Version]
  5. Zhao, B. Developing value-added urea technology to promote technology upgrade of urea. Phosphate Compd. Fertil. 2013, 28, 6–7. [Google Scholar]
  6. Martinez, C.; Clarke, D.; Dang, Y.P.; Janke, C.; Bell, M.J. Integrated field assessment of nitrogen release dynamics and crop recovery of band-applied controlled-release fertilisers. Plant Soil 2021, 466, 257–273. [Google Scholar] [CrossRef]
  7. Deng, F.; Wang, L.; Ren, W.-J.; Mei, X.-F. Enhancing nitrogen utilization and soil nitrogen balance in paddy fields by optimizing nitrogen management and using polyaspartic acid urea. Field Crops Res. 2014, 169, 30–38. [Google Scholar] [CrossRef]
  8. Zhao, B.; Yuan, L.; Li, Y.; Zhang, S. Overview of Value-Added Fertilizer; China Agricultural Sciences and Technology Press: Beijing, China, 2020. [Google Scholar]
  9. Calvo, P.; Nelson, L.; Kloepper, J.W. Agricultural uses of plant biostimulants. Plant Soil 2014, 383, 3–41. [Google Scholar] [CrossRef] [Green Version]
  10. Vujinovic, T.; Zanin, L.; Venuti, S.; Contin, M.; Ceccon, P.; Tomasi, N.; Pinton, R.; Cesco, S.; De Nobili, M. Biostimulant action of dissolved humic substances from a conventionally and an organically managed soil on nitrate acquisition in maize plants. Front. Plant Sci. 2019, 10, 1652. [Google Scholar] [CrossRef]
  11. Sądej, W.; Żołnowski, A.C. Comparison of the effect of various long-term fertilization systems on the content and fractional composition of humic compounds in Lessive soil. Plant Soil Environ. 2019, 65, 172–180. [Google Scholar] [CrossRef] [Green Version]
  12. Saha, B.K.; Rose, M.T.; Wong, V.; Cavagnaro, T.R.; Patti, A.F. Hybrid brown coal-urea fertiliser reduces nitrogen loss compared to urea alone. Sci. Total Environ. 2017, 601–602, 1496–1504. [Google Scholar] [CrossRef] [PubMed]
  13. Saha, B.K.; Rose, M.T.; Wong, V.N.L.; Cavagnaro, T.R.; Patti, A.F. A slow release brown coal-urea fertiliser reduced gaseous N loss from soil and increased silver beet yield and N uptake. Sci. Total Environ. 2019, 649, 793–800. [Google Scholar] [CrossRef] [PubMed]
  14. Shen, Y.; Lin, H.; Gao, W.; Li, M. The effects of humic acid urea and polyaspartic acid urea on reducing nitrogen loss compared with urea. J. Sci. Food Agric. 2020, 100, 4425–4432. [Google Scholar] [CrossRef] [PubMed]
  15. Li, Y.; Tan, W.; Koopal, L.K.; Wang, M.; Liu, F.; Norde, W. Influence of soil humic and fulvic acid on the activity and stability of lysozyme and urease. Environ. Sci. Technol. 2013, 47, 5050–5056. [Google Scholar] [CrossRef]
  16. Dong, L.; Córdova-Kreylos, A.L.; Yang, J.; Yuan, H.; Scow, K.M. Humic acids buffer the effects of urea on soil ammonia oxidizers and potential nitrification. Soil Biol. Biochem. 2009, 41, 1612–1621. [Google Scholar] [CrossRef] [Green Version]
  17. Yuan, L.; Zhao, B.; Lin, Z.; Wen, Y.; Li, Y. Effects of value-added urea on wheat yield and N use efficiency and the distribution of residual N in soil profiles. J. Plant Nutr. Fertil. 2014, 20, 620–628. [Google Scholar]
  18. Zhang, S.; Yuan, L.; Li, W.; Lin, Z.; Li, Y.; Hu, S.; Zhao, B. Effects of urea enhanced with different weathered coal-derived humic acid components on maize yield and fate of fertilizer nitrogen. J. Integr. Agric. 2019, 18, 656–666. [Google Scholar] [CrossRef]
  19. Zhuang, Z.; Li, X. Effects of humic acid nitrogen fertilization on corn yield, nitrogen utilization and nitrogen loss. J. Plant Nutr. Fertil. 2016, 22, 1232–1239. [Google Scholar]
  20. Liu, Y.; Ding, F.; Zhang, J.; Qi, X.; Gu, R.; Wu, Q.; Li, C. Effects of activated humic acid-urea on nitrogen use efficiency and its driving factors under wheat-maize rotation system. Chin. J. Eco-Agric. 2016, 24, 1310–1319. [Google Scholar]
  21. Atiyeh, R.M.; Lee, S.; Edwards, C.A.; Arancon, N.Q.; Metzger, J.D. The influence of humic acids derived from earthworm-processed organic wastes on plant growth. Bioresour. Technol. 2002, 84, 7–14. [Google Scholar] [CrossRef]
  22. Arancon, N.Q.; Edwards, C.A.; Lee, S.; Byrne, R. Effects of humic acids from vermicomposts on plant growth. Eur. J. Soil Biol. 2006, 42, S65–S69. [Google Scholar] [CrossRef]
  23. Liu, X.; Zhang, M.; Li, Z.; Zhang, C.; Wan, C.; Zhang, Y.; Lee, D.-J. Inhibition of urease activity by humic acid extracted from sludge fermentation liquid. Bioresour. Technol. 2019, 290, 121767. [Google Scholar] [CrossRef] [PubMed]
  24. Saha, B.K.; Rose, M.T.; Wong, V.N.L.; Cavagnaro, T.R.; Patti, A.F. Nitrogen dynamics in soil fertilized with slow release brown coal-urea fertilizers. Sci. Rep. 2018, 8, 14577. [Google Scholar] [CrossRef] [PubMed]
  25. Jing, J.; Zhang, S.; Yuan, L.; Li, Y.; Zhang, Y.; Wen, Y.; Zhao, B. Humic acid complex formation with urea alters its structure and enhances biomass production in hydroponic maize. J. Sci. Food Agric. 2022, 102, 3636–3643. [Google Scholar] [CrossRef] [PubMed]
  26. Lu, R. Analytical Methods of Soil and Agro-Chemistry; China Agricultural Science and Technology Press: Beijing, China, 1999. [Google Scholar]
  27. Zhang, S.; Yuan, L.; Li, W.; Lin, Z.; Li, Y.; Hu, S.; Zhao, B.; Li, J. Effects of humic acid urea on maize yield and the fate of fertilizer nitrogen. J. Plant Nutr. Fertil. 2017, 23, 1207–1214. [Google Scholar]
  28. Liu, H.; Zhang, S.; Liu, S.; Li, J.; Feng, M.; Zhao, J.; Sun, G.; Nie, Z.; Wang, W. Effect of humic acid urea on grain yield, nutrient uptake and utilization and soil nutrient of winter wheat. Acta Agric. Boreali-Occident. Sin. 2018, 27, 944–952. [Google Scholar]
  29. Li, J. The Study of Humic Acid on Raising N and P Fertilizer Efficiency and Reducing Application Rates. Master’s Thesis, Chinese Academy of Agricultural Sciences, Beijing, China, 2017. [Google Scholar]
  30. Zhang, S. Structural Characteristics of Different Humic Acid Fractions and Their Regulation on Urea. Ph.D. Thesis, China Agricultural University, Beijing, China, 2018. [Google Scholar]
  31. Canellas, L.P.; Olivares, F.L.; Aguiar, N.O.; Jones, D.L.; Nebbioso, A.; Mazzei, P.; Piccolo, A. Humic and fulvic acids as biostimulants in horticulture. Sci. Hortic. 2015, 196, 15–27. [Google Scholar] [CrossRef]
  32. Rose, M.T.; Patti, A.F.; Little, K.R.; Brown, A.L.; Jackson, W.R.; Cavagnaro, T.R. A meta-analysis and review of plant-growth response to humic substances: Practical implications for agriculture. Adv. Agron. 2014, 124, 37–89. [Google Scholar]
  33. Cao, Y.; Bai, M.; Han, B.; Impraim, R.; Butterly, C.; Hu, H.; He, J.; Chen, D. Enhanced nitrogen retention by lignite during poultry litter composting. J. Clean. Prod. 2020, 277, 122422. [Google Scholar] [CrossRef]
  34. Liu, Z.; Hu, C.; Wang, Y.; Sha, Y.; Hao, Z.; Chen, F.; Yuan, L.; Mi, G. Nitrogen allocation and remobilization contributing to low-nitrogen tolerance in stay-green maize. Field Crops Res. 2021, 263, 108087. [Google Scholar] [CrossRef]
  35. Demotes-Mainard, S.; Jeuffroy, M.-H.; Robin, S. Spike dry matter and nitrogen accumulation before anthesis in wheat as affected by nitrogen fertilizer: Relationship to kernels per spike. Field Crops Res. 1999, 64, 249–259. [Google Scholar] [CrossRef]
Figure 1. Monthly mean temperatures and total precipitation during 2018–2019 and 2019–2020 winter wheat growing seasons.
Agronomy 12 01526 g001
Figure 2. Schematic diagrams of soil columns used for winter wheat cultivation and the experi-mental plot (a). A diagram showing how columns were filled with soil (b). Image showing wheat cultivation at pustulation period (c).
Agronomy 12 01526 g002
Figure 3. Aboveground dry biomass of mature winter wheat under different proportions of HAs in urea fertilizer formulations. Treatments with no letter in common were significantly different at p < 0.05, as indicated by LSD test. Capital letter above columns resulted from the differences of total aboveground parts of mature winter wheat among treatments.
Agronomy 12 01526 g003
Figure 4. N accumulation in mature winter wheat under different proportions of HAs in urea fertilizer formulations. (A) Total N; (B) Fertilizer-N. Treatments with no letter in common were significantly different at p < 0.05, as indicated by LSD test. The capital letter above columns resulted from the differences of total aboveground parts of mature winter wheat among treatments.
Agronomy 12 01526 g004
Table 1. N content and 15N abundance of prepared U and UHAs in this study.
AbbreviationHAs Proportion (%)2018–2019 Growing Season2019–2020 Growing Season
Total N Content (%)15N Abundance (%)Total N Content (%)15N Abundance (%)
U045.7810.2245.8110.22
UHAs0.20.245.6310.2145.6910.21
UHAs0.50.545.3710.2245.3610.23
UHAs1.01.045.0210.2045.0810.20
UHAs2.02.044.6310.1944.6910.17
UHAs5.05.043.3910.1543.4510.16
Table 2. Basic physicochemical properties of experimental soil.
Growing SeasonSoil Depth
(cm)
pHOrganic Matter
(g kg−1)
Total N
(g kg−1)
Available P
(mg kg−1)
Available K
(mg kg−1)
2018–20190–208.4710.730.716.75119.80
20–608.4310.360.636.3797.52
2019–20200–208.4510.610.706.52115.35
20–608.4210.170.656.3098.27
Table 3. Simple correlation coefficient decomposition between yield and yield components.
Growing SeasonIndependent VariableSimple Correlation Coefficient with YieldDirect Path CoefficientIndirect Path CoefficientDecision Coefficient
Spike No. per PotGrain No. per Spike1000-Grain WeightTotal
2018–2019Spike no. per pot0.595 **0.763−0.159−0.081−0.2400.326
Grain no. per spike0.592 **0.625−0.1310.2260.0950.349
1000-grain weight0.494 **0.350−0.0370.1260.0890.223
2019–2020Spike no. per pot0.810 **1.045−0.6070.440−0.1670.601
Grain no. per spike−0.0780.664−0.386−0.250−0.636−0.544
1000-grain weight0.549 **0.3600.152−0.1360.0160.266
** means extremely significant correlation at p < 0.01, as indicated by Pearson correlation.
Table 4. Residual fertilizer-N after winter harvest under different proportions of HAs in urea fertilizer formulations.
Growing SeasonTreatmentFertilizer-N Residual Amount (g pot−1)
0–30 cm30–60 cm60–90 cmTotal
2018–2019U0.513 b0.329 a0.154 a0.996 b
UHAs0.20.566 a0.304 a0.148 a1.018 ab
UHAs0.50.581 a0.320 a0.155 a1.055 ab
UHAs1.00.582 a0.322 a0.154 a1.058 a
UHAs2.00.588 a0.318 a0.157 a1.063 a
UHAs5.00.596 a0.322 a0.153 a1.071 a
2019–2020U0.433 d0.312 ab0.164 a0.908 c
UHAs0.20.477 c0.299 b0.161 a0.937 bc
UHAs0.50.501 abc0.301 b0.155 a0.957 abc
UHAs1.00.496 bc0.329 a0.157 a0.982 ab
UHAs2.00.510 ab0.313 ab0.158 a0.980 ab
UHAs5.00.527 a0.308 ab0.157 a0.992 a
CK means non N fertilized; other abbreviations for the treatment are as in Table 2. Data represent the means of four replicates; treatments with no letter in common were significantly different at p < 0.05, as indicated by LSD test.
Table 5. Fate of fertilizer-N under different proportions of HAs in urea fertilizer formulations.
Growing SeasonTreatmentUse Efficiency (%)Residual Rate (%)Lost Rate (%)
2018–2019U44.64 c25.38 b29.98 a
UHAs0.248.07 b25.93 ab26.00 b
UHAs0.551.52 a26.89 ab21.59 c
UHAs1.050.40 ab26.97 a22.64 c
UHAs2.050.33 ab27.10 a22.58 c
UHAs5.050.72 ab27.30 a21.98 c
2019–2020U47.39 c23.15 c29.46 a
UHAs0.250.52 bc23.87 bc25.61 b
UHAs0.553.31 ab24.39 abc22.31 c
UHAs1.053.04 ab25.03 ab21.93 c
UHAs2.053.67 ab24.98 ab21.35 c
UHAs5.054.05 a25.28 a20.67 c
Abbreviations for the treatment are as in Table 2. Data represent the means of four replicates; treatments with no letter in common were significantly different at p < 0.05, as indicated by LSD test.
Table 6. Cost-benefit analysis for different HAU formulations.
Growing SeasonTreatmentFertilizer Cost Increase
(USD ha−1)
Wheat Output Value Increase
(USD ha−1)
Final Economic Benefit Increase
(USD ha−1)
2018–2019UHAs0.21112111
UHAs0.52439437
UHAs1.04253249
UHAs2.08141133
UHAs5.019151132
2019–2020UHAs0.21231230
UHAs0.52264262
UHAs1.04133129
UHAs2.08164156
UHAs5.019277258
Abbreviations for the treatments are as in Table 2.
Publisher’s Note: MDPI stays neutral with regard to jurisdictional claims in published maps and institutional affiliations.

