Article

Genome-Wide Comparative Analysis of Transposable Elements by Matrix-TE Method Revealed Indica and Japonica Rice Evolution

1
College of Life Sciences, Wuhan University, Wuhan 430072, China
2
Institute for Advanced Studies, Wuhan University, Wuhan 430072, China
*
Author to whom correspondence should be addressed.
Agronomy 2022, 12(7), 1490; https://doi.org/10.3390/agronomy12071490
Submission received: 22 May 2022 / Revised: 10 June 2022 / Accepted: 18 June 2022 / Published: 22 June 2022
(This article belongs to the Special Issue A Themed Issue in Memory of Academician Zhu Yingguo (1939–2017))

Abstract

:
Transposons (TEs) are known to change the gene expression and function, and subsequently cause plant speciation and evolution. Nevertheless, efficient and new approaches are required to investigate the role of TEs in the plant genome structural variations. Here, we reported the method named matrix-TE to investigate the differentiation of intact and truncated LTR/TEs comprehensively in Indica and Japonica rice throughout whole genomes with a special eye on centromeric regions. Six LTR/TE super-families were identified in both Indica and Japonica rice genomes, and the TE ORF references were extracted by phylogenetic analysis. Indica rice specific TE peak P-Gypsy and Japonica rice specific TE peak P-Copia were observed, and were further analyzed by Gaussian probability density function (GPDF) fit. The individual TE peak P-Gypsy was observed in centromeric regions of the Indica genome. By the matrix-TE method, the divergence of Indica and Japonica genomes, especially their centromeric regions, mainly resulted from the Ty3/Gypsy insertion events at 0.77 Mya. Our data indicate that the optimized matrix-TE approach may be used to specifically analyze the TE content, family evolution, and time of the TE insertions.

1. Introduction

TEs show an importance in both monocotyledonous and dicotyledonous plants, since TEs probably lead to the alterations of plant gene expression and function by introducing mutations both in the coding regions and the regulatory regions [1]. Recent great advances in genomics has gradually made it a reality to systematically investigate the roles of TEs during the evolution of plant genomic structures [2,3,4,5]. Long terminal repeat transposable elements (LTR/TEs) are retrotransposons and usually constitute a major part of most plant genomes [6].
Indica and Japonica rice are the most widely cultivated subspecies and the genome sequences were successfully assembled and polished in the past two decades, with their genome structure variations studied to interpret the origin and evolution for the Oryza genus [7,8,9,10,11,12]. The rice genomes are known to contain high levels of Ty1/Copia and Ty3/Gypsy super-family LTR/TEs [4,5]. To date, the Oryza species have been evolved for ~15 million years. However, the divergence time between Indica and Japonica rice was estimated at 0.55 million years ago (Mya) [11,12]. Molecular phylogenetic studies suggested that Indica and Japonica rice originated independently [11]. Recently, gap-free rice genomes have been assembled and provide a new view of the structure and function of full-length centromeres with LTR/TEs being a major component [4,5]. These advances provide a firm basis on which to study the essential roles that LTR/TEs play during the origin and evolution of rice genomes.
LTR/TEs are found everywhere in many plant genomes, especially in wheat and maize, as more than half of their entire genome sequences are constituted by Ty1/Copia and Ty3/Gypsy super-families [13,14,15,16,17]. A large number of intact and truncated LTR/TEs were identified in both the wheat D and A subgenomes. Sequential insertion followed by silencing events of TEs over the past three million years were thought to play a significant role during evolution of the hexoploid wheat genome [13,14]. Furthermore, comparative studies of TEs in three maize genomes interpreted the existence of high level variations, even among very related subspecies [15,16,17], and TE-mediated gene silencing was proposed to be involved in epigenetic regulations during different developmental stages [18].
Most plant TEs cumulate a large amount of nucleotide substitution and truncation events over their evolution time courses [19,20,21,22,23,24,25]. The high repetitive nature with a high mutation rate makes it a challenge to accurately analyze TEs during genome assembly and related studies. Previously, a software entitled TRACK-POSON was published to detect TE insertion polymorphisms in rice genomes [26]. Here, we reported a matrix-TE approach to quantitatively and systematically study the intact and truncated LTR/TEs in the genomes of Indica and Japonica rice. All of the LTR/TE super-families were restricted in one super matrix by their ORFs and sequence identities, then classified and phylogenetically clustered. Individual TE insertion peaks of P-Gypsy and P-Copia were detected in Indica and Japonica rice, respectively. The TE peaks were further resolved by Gaussian probability density function (GPDF), as the GPDF model was matched with stochastic nucleotide substitution events, and the time point of the individual TE peak was calculated by the nucleotide substitution ratio Ks [3]. We suggest that this is the first characterization of the insertion events for all rice LTR/TE super-families in the genomes of two subspecies, especially in centromeric regions.

2. Materials and Methods

2.1. Indica and Japonica Genomes Used for TE Matrix Generation and GPDF Analysis

Two cultivated rice Indica (MH63) and Japonica (Nip) genome sequence data were applied to the analysis process. The Indica (MH63) genome assembly ID was GWHBCKY00000000 and the Japonica (Nip) genome assembly ID was GCF_001433935.1_IRGSP-1.0 [4]. Intact LTR/TEs of the MH63 and Nip genomes were annotated by LTR_finder software with default parameters.

2.2. LTR/TE ORF Matrix Generation

The ORFs were extracted from the intact LTR/TEs by the Getorf Script in the EMBOSS package with default parameters. Then, the ORFs were sorted by length from long to short, and we discarded ORFs shorter than 1500 bp. The identity matrix for the selected longer ORF sequences was calculated by BioEdit software with default parameters [3].

2.3. Phylogenetic Analysis of TE ORFs

The LTR/TE ORFs with sequence identities greater than 95% in the TE matrix were extracted according to their sequence homology. Then, the MEGA software with the construct neighbor-joining tree method was used to generate the molecular phylogenetic trees of the ORF groups. The LTR/TE ORF sequences on each top branch of the phylogenetic trees were determined as the TE ORF reference sequences of the super-families in the following steps.

2.4. Whole Genome and Centromere Scanning with TE ORF Reference Sequences and GPDF Analysis of Individual TE Peaks

The Indica (MH63) and Japonica (Nip) whole genomes and centromeric regions were searched by the TE ORF reference sequences with BLASTN software using the parameters: $blastn -db Ricegenomedb -query ref-ORFseq.fa -out ref-ORFseq-blast-Ricegenomedb -evalue 0.00001 -word_size 11 -gapopen 5 -gapextend 2 -penalty -2 -reward 1 -culling_limit 0 -outfmt 7.
Sequences obtained from the above blast search contained intact and truncated TE sequences, and identity distribution curves were generated using individual TE super-family sequences. The individual peaks of the curves were fitted by GPDF and the average nucleotide substitution ratio Ks of each TE peak were defined as 2.58σ [3]. The TE insertion time was calculated by the formula: T = Ks/2r, where r is the average nucleotide substitution rate (1.3 × 10⁻⁸ here) [27].

2.5. TE Insertion Events, Whole Genome, and Centromere Evolution Analysis

The distribution of the single nucleotide polymorphism across Ty1/Copia and Ty3/Gypsy ORFs were scanned in Nip and MH63 genomes to calculate the SNP densities. The individual TE peaks were compared with Indica and Japonica rice genomes as well as the centromeric regions. Different TE insertion events among the whole genomes and centromeric regions were applied to correlate with the differentiation of rice subspecies [28,29].

3. Results

3.1. Development of Matrix-TE Approach Pipeline

Considering the large amount of TEs and the stochastic nucleotide substitutions, we developed the approach matrix-TE to successfully evaluate the TE ORFs, and calculated the Ks of the TE insertion events in rice genomes (Figure S1). Whole rice genome sequences were sequentially applied to the LTR_finder, Getorf, and BioEdit scripts to obtain various related data. ORF clusters with an identity over 95% were observed at the diagonal of the TE matrix and were extracted based on sequence identities. The whole genome or the centromeric regions were scanned by the reference sequence with the identity distribution curve fitted by the GPDF model. The individual TE insertion event was analyzed by calculating the Ks derived from the GPDF. The matrix-TE approach was used to analyze the most abundant TE super-families, and the TE content at both the whole genome level and in the centromeric regions were subsequently quantified.

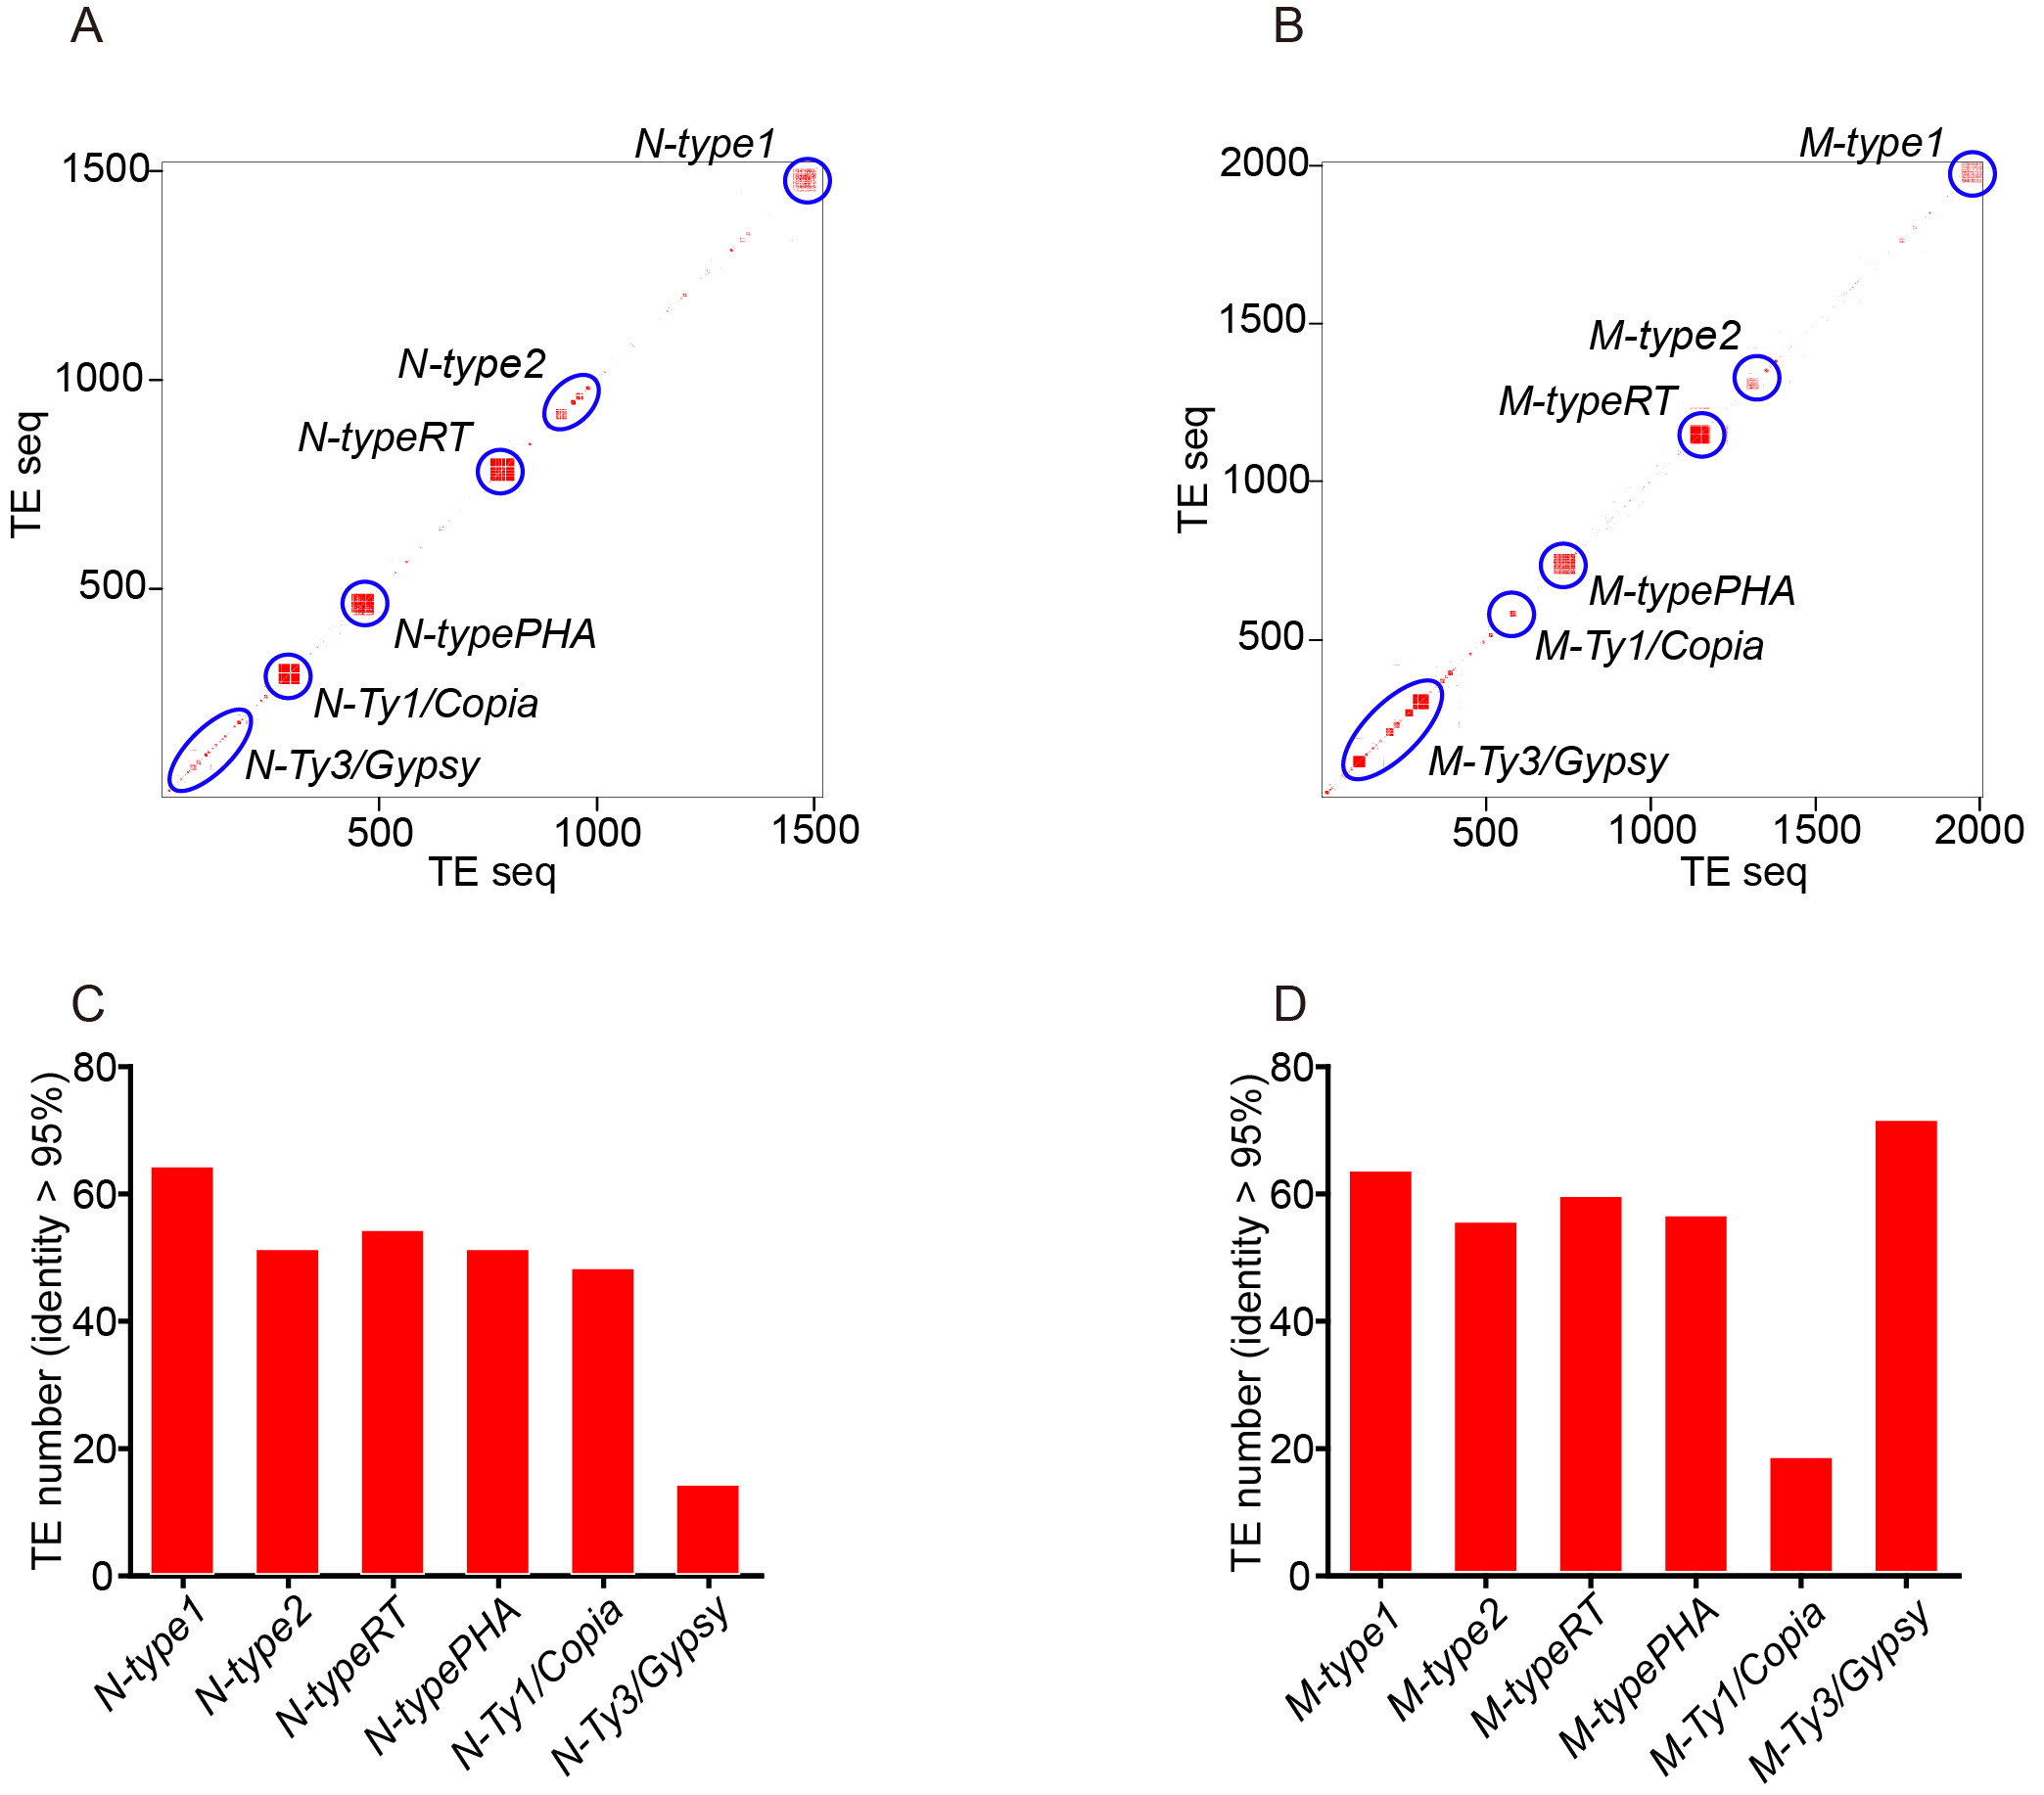
3.2. TE Matrix and Cluster Generation for Indica and Japonica Rice Whole Genomes

Compared with that of Nip, MH63 had a slightly bigger genome and higher TE content with both having more annotated intact LTR/TEs and ORFs (Table 1). A total of 1520 Nip ORFs and 2010 MH63 ORFs were discovered from the super matrices, and clusters with identities over 95% observed at the matrix diagonals (Figure 1A,B) were extracted and annotated so that both the Nip and MH63 genomes contained six clusters of LTR/TE super families, named type1, type2, typeRT, typePHA, Ty1/Copia, and Ty3/Gypsy. Both the Nip and MH63 genomes contained similar numbers of type1, type2, typeRT, and typePHA TEs (from 51 to 64), whereas significantly more of the Ty1/Copia TEs were observed in Nip than in MH63 (comparing 48 in Nip to 18 in the later). In contrast, MH63 contained significantly more Ty3/Gypsy type TEs than that of Nip (71 in MH63 while there were only 14 in the latter) (Figure 1C,D).

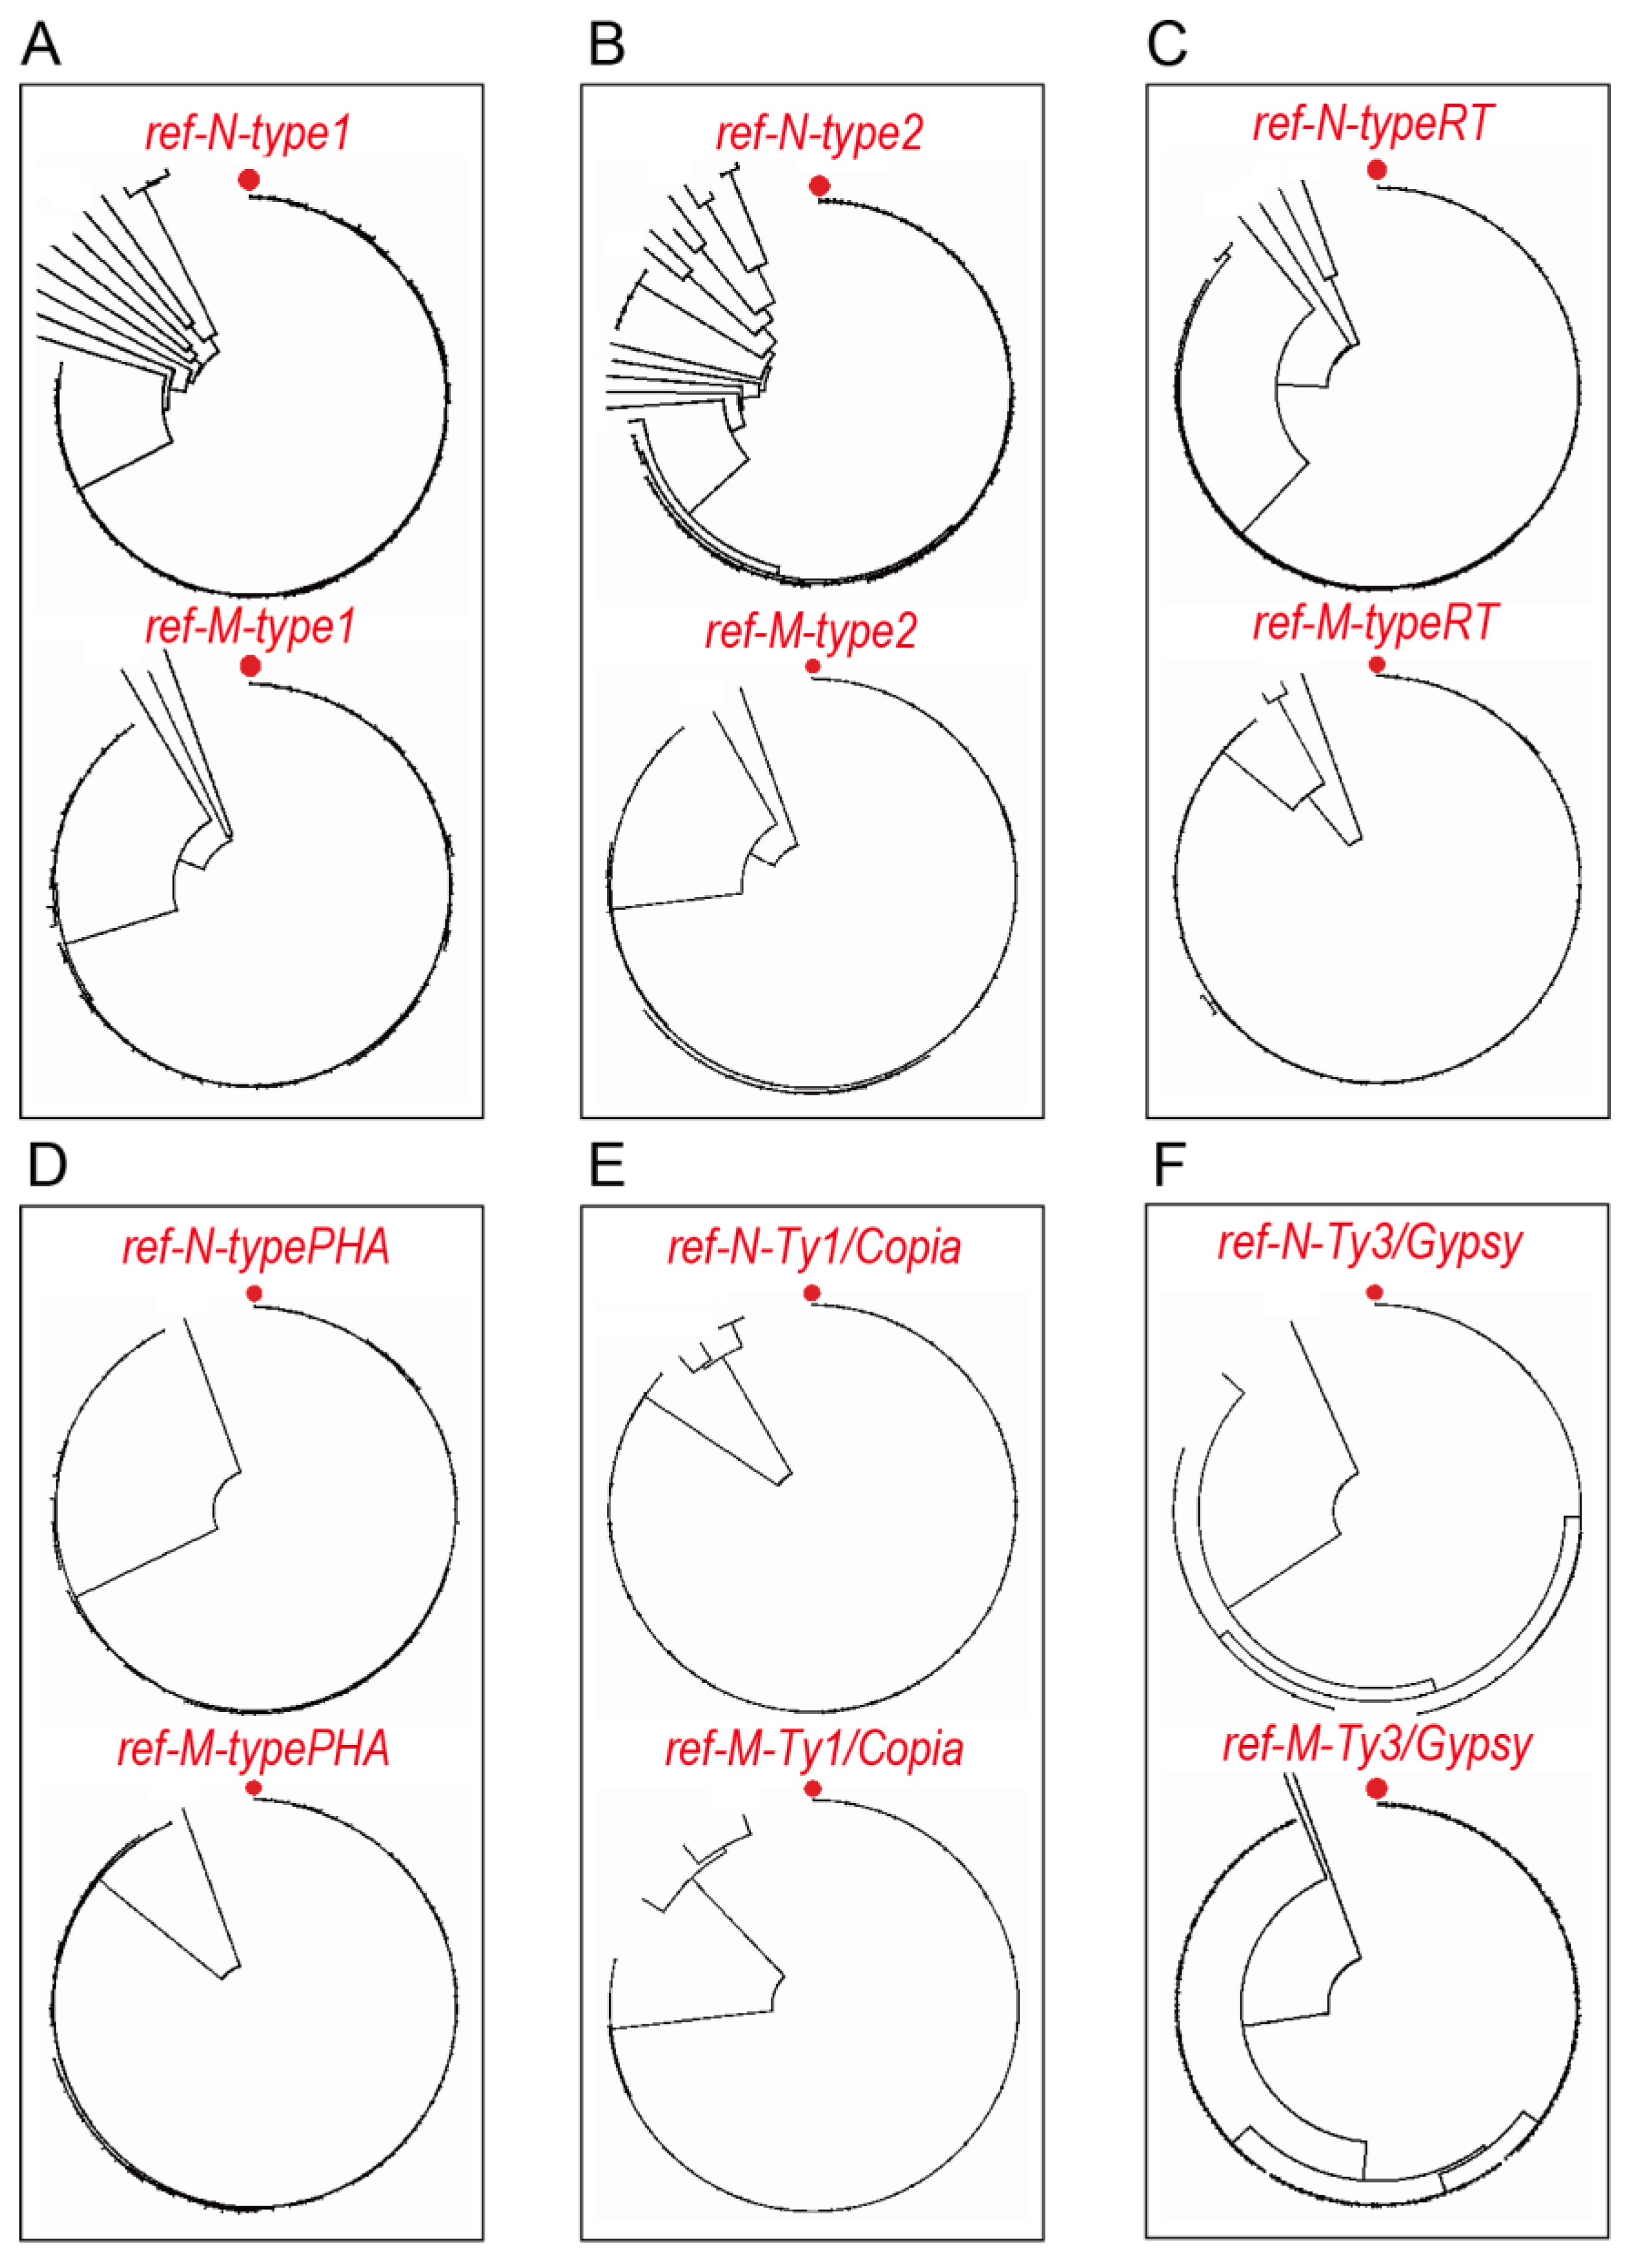
3.3. Phylogenetic Trees and ORF Reference Sequences of TE Clusters

The phylogenetic trees of TE ORFs were constructed with the six TE clusters of the Nip and MH63 genomes separately (Figure 2). With a non-homologous sequence as the root (e.g., using Ty1/Copia as the root of Ty3/Gypsy tree and vice versa), the ref-N-type1 and ref-M-type1 (Figure 2A), the ref-N-type2 and ref-M-type2 (Figure 2B), the ref-N-typeRT and ref-M-typeRT (Figure 2C), the ref-N-typePHA and ref-M-typePHA (Figure 2D), the ref-N-Ty1/Copia and ref-M-Ty1/Copia (Figure 2E), and the ref-N-Ty3/Gypsy and ref-M-Ty3/Gypsy (Figure 2F) on the top branch of each tree were selected as the reference sequences for the TE ORFs of each Nip or MH63 TE cluster. These reference sequences were potentially active and were probably inserted into rice genomes in recent ages [2,3]. These TE ORF reference sequences were applied to whole genome and centromere scanning in the following steps.

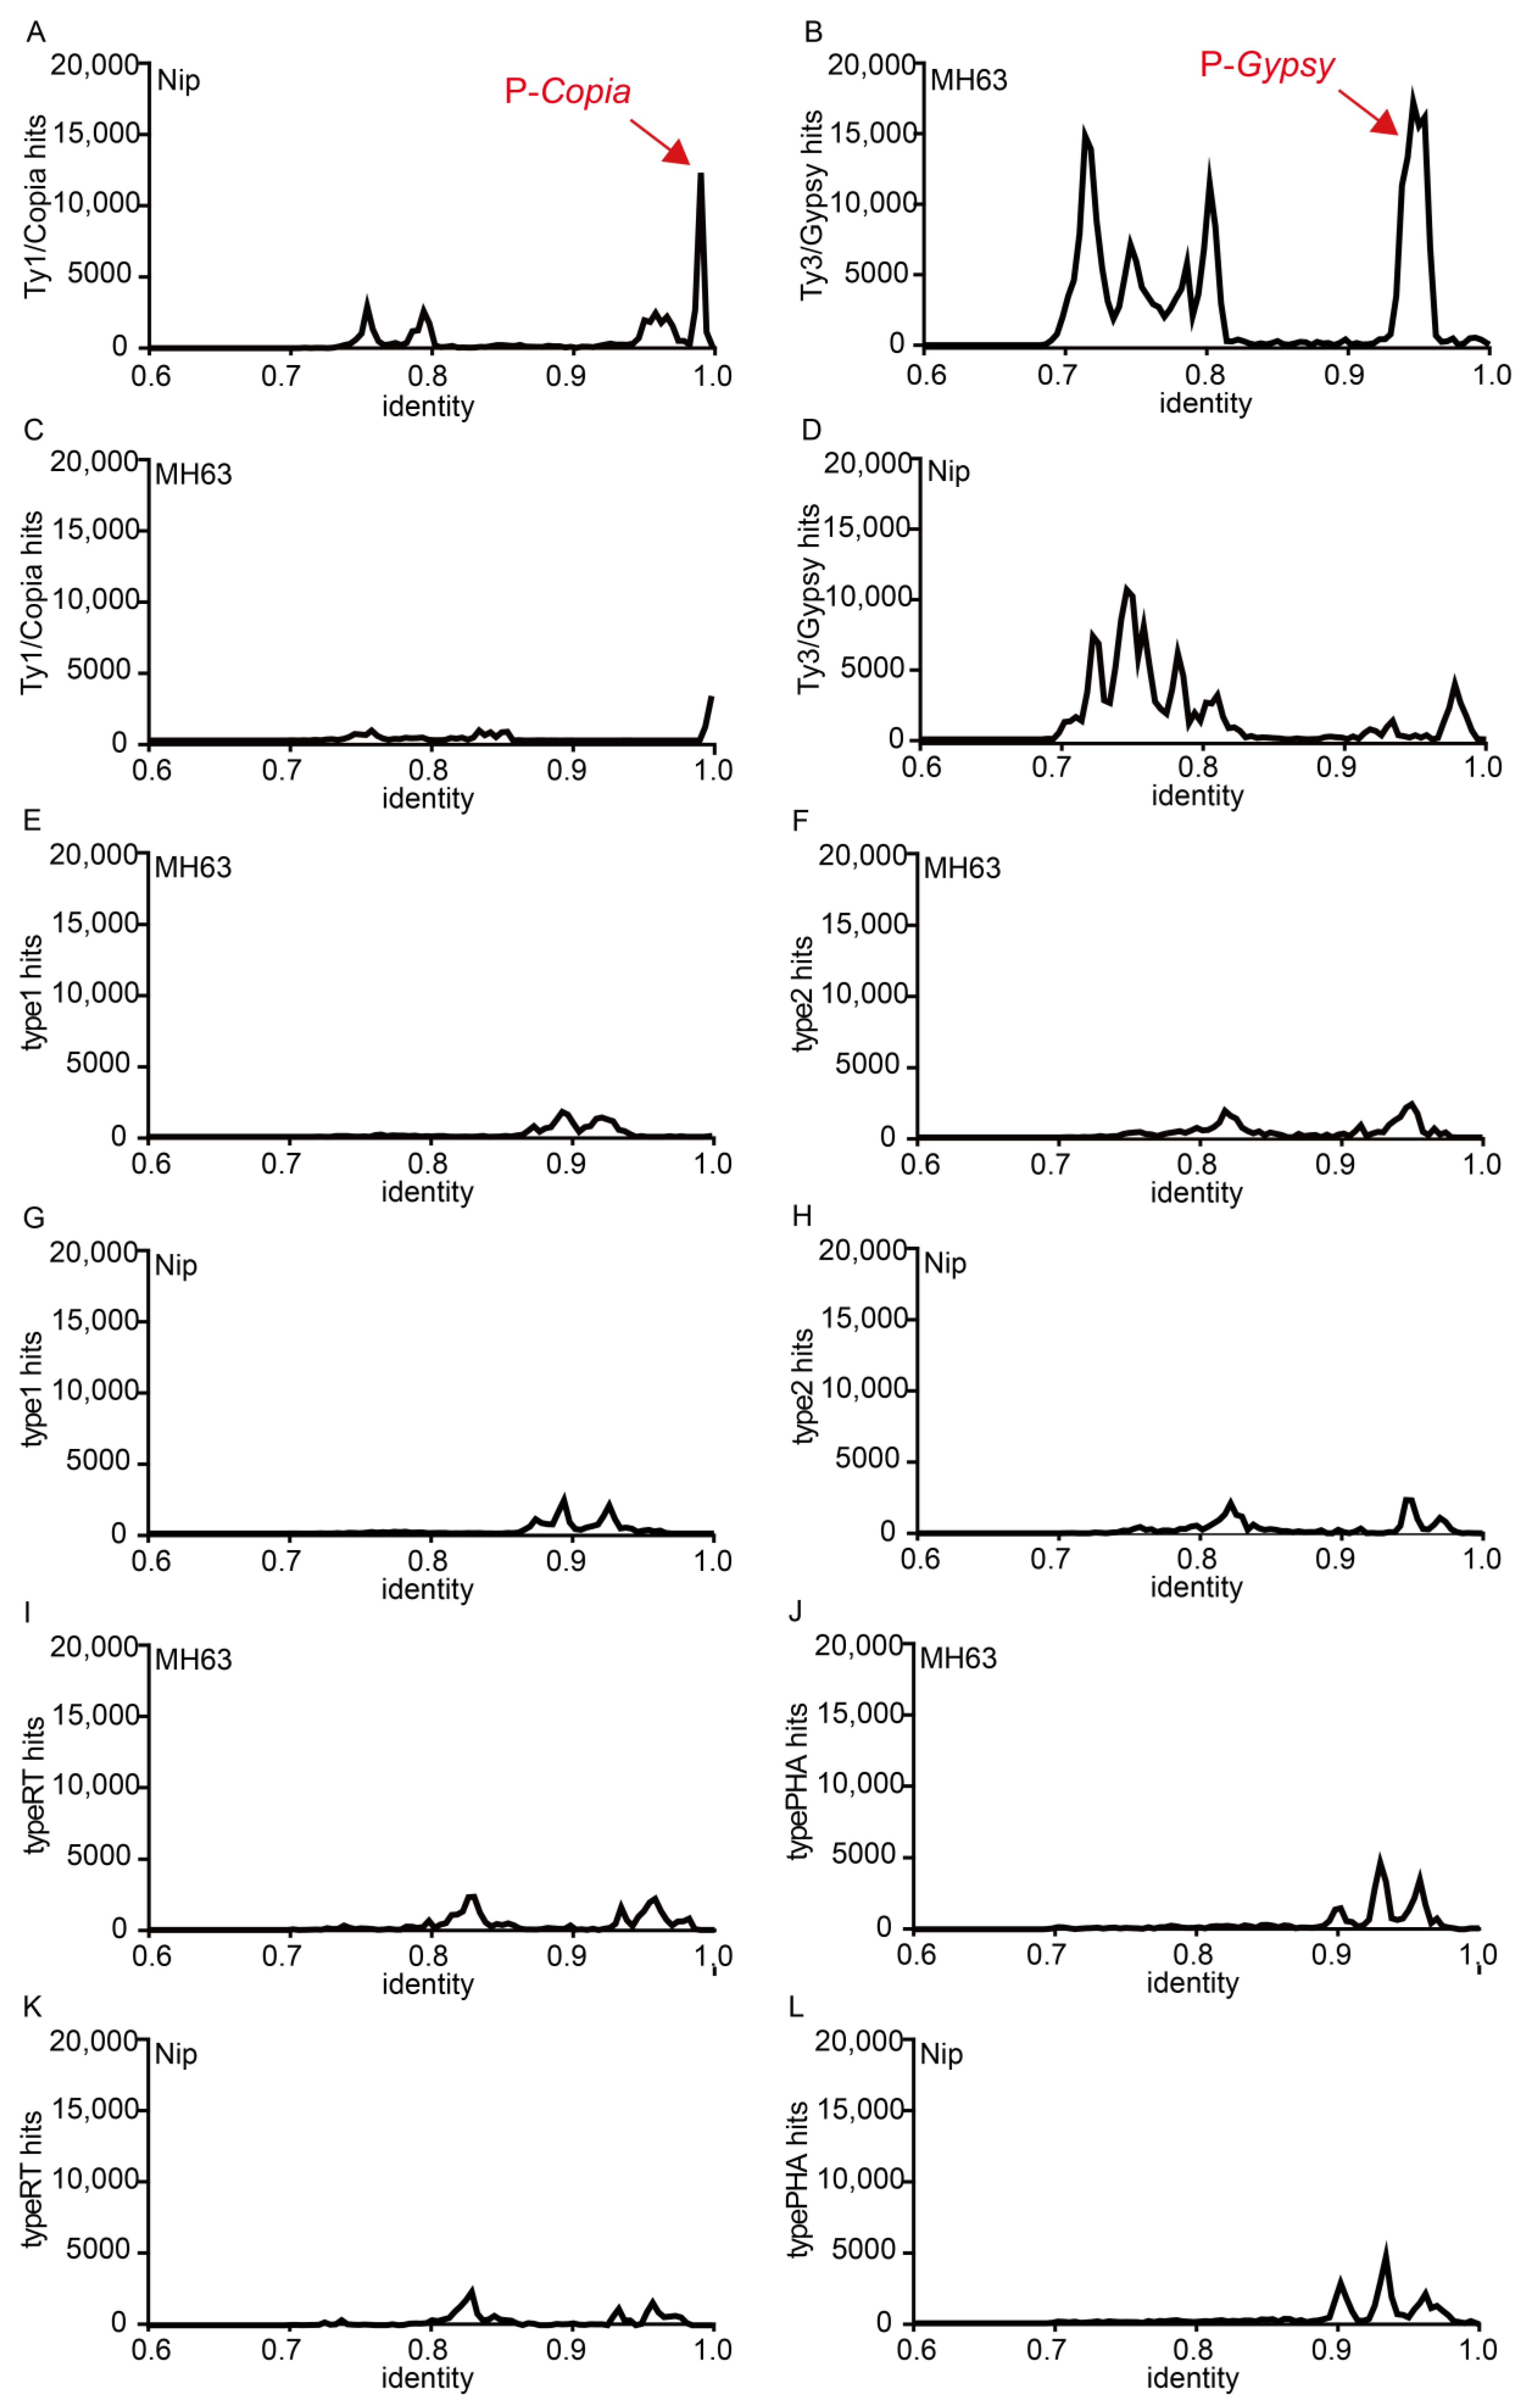
3.4. Whole Genome and Centromere Scanning by TE ORF Reference Sequences

Both whole genome and the centromeric regions of Nip or MH63 were scanned with the TE ORF reference sequences. Data analysis indicated that the TE ORF contents for the type1, type2, typeRT, and typePHA clusters were similar in the Nip or MH63 genomes (Table 2), with similar identity distribution curves and in general quite weak TE hit signals for these four super-families (Figure 3E–L). There were 1479 Ty1/Copia ORFs in Nip vs. 316 in MH63, and 6277 Ty3/Gypsy ORFs in MH63 compared with 3328 in the Nip genomes. In the Nip centromeres, a total of 57 Ty1/Copia and 345 Ty3/Gypsy ORFs were observed, while 23 Ty1/Copia and 758 Ty3/Gypsy ORFs were found in that of MH63 (Table 2), which may indicate the importance of the activities of Ty1/Copia and Ty3/Gypsy in the evolutions of the Nip and MH63 genomes, respectively. Indeed, sharp peaks of P-Copia and P-Gypsy were detected in the Nip and MH63 genomes (Figure 3A,B), whereas significantly lower levels of Ty3/Gypsy were found in Nip and only some scattered Ty1/Copia was revealed in MH63 (Figure 3C,D).

3.5. Stochastic SNP Distribution in TE ORFs, and GPDF Analysis of P-Copia and P-Gypsy

Across the Ty1/Copia and Ty3/Gypsy ORF sequences in both MH63 and Nip, the SNP distribution was observed. A significantly much higher rate of the SNP distributions was found for Ty3/Gypsy ORFs than that of Ty1/Copia ORFs in both rice genomes (Figure 4A,B). We further produced identity distribution curves for P-Copia and P-Gypsy, and they fitted well to the mathematical GPDF model (Figure 4C,D). We reported the R square values in the inset of Figure 4C,D, respectively. The nucleotide substitution ratio (Ks) of the two peaks were calculated as 2.58σ [3]. The Ks value of P-Copia was calculated to be 0.0049, while that of P-Gypsy was 0.020. The individual P-Copia peak representing the Ty1/Copia insertion events in the Nip genome were estimated to be 0.19 Mya by GPDF fitting (Figure 4C), and the individual P-Gypsy peak representing the Ty3/Gypsy insertion events in the MH63 genome were calculated to be at around 0.77 Mya (Figure 4D). The Ty3/Gypsy peaks with identity at Ks values of 0.7–0.8 were estimated to be inserted in the MH63 genome at 6.3~9.7 Mya (Figure 4D).

3.6. LTR/TE Analysis in Nip and MH63 Centromeric Regions

Centromere sequences of the MH63 and Nip genomes were extracted from the whole genome data (Tables S1 and S2) [4], and were scanned with the Ty1/Copia and Ty3/Gypsy ORF reference sequences (Figure 5). No significant Ty1/Copia ORF distribution signals were observed in centromeres of MH63 (Figure 5A) or in that of Nip (Figure 5C). However, strong distribution signals for Ty3/Gypsy ORFs in the centromeric regions of MH63 (Figure 5B) and Nip (Figure 5D), although the 0.77 Mya Ty3/Gypsy peak was only observed in the former. In centromeres of the Nip genome, this most recent Ty3/Gypsy peak was not observed, which may indicate that these two types of rice have been diversified for at least 0.77 million years (Figure 5D).

4. Discussion

LTR/TEs have been shown to constitute the major of many monocotyledonous plant genome components, usually, LTR/TEs are randomly inserted across the whole genomes [30]. Earlier inserted TEs may be truncated or fragmented at stochastic sites by various insertional events or sequence mutations that happened later on [31]. Thus, comparisons of the rate in the nucleotide changes between two intact LTR sequences were often used to estimate their insertion time, although it is a challenge to define the exact insertion events for truncated TEs [32]. In our analysis, both rice genomes cumulated plenty of SNPs in the TE ORFs as they were supposed to experience low selection forces during the evolution [33,34]. The huge number of LTR/TE copies, together with their non-conserved nucleotide substitution sites, make them good candidates for evolutionary analysis in several plant systems [2,3,35]. Currently, we have established a matrix-TE approach to comprehensively evaluate the TE insertion events in plant genomes and centromeric regions. This approach overcomes problems related to fragmented TE pieces as well as to stochastic nucleotide substitution sites in the ORFs, as was previously elucidated [3].
Six super-families of LTR/TEs were identified for Indica and Japonica rice genomes through our super matrix (Figure 1 and Figure 2). The ORFs of intact LTR/TEs were used to generate the identity matrix, then the extracted clusters with high identities were analyzed to figure out the ORF reference sequences by constructing phylogenetic trees (Figure 2). This pipeline has been proven to be an efficient strategy for this type of analysis, because both the intact and truncated TE ORF sequences with diverse SNPs were identified and collected for subsequent evolutionary studies. Ty1/Copia and Ty3/Gypsy were the two families that showed significant different distribution patterns between the two rice genomes, with that of the other four types showing similar distribution patterns (Figure 3). Detailed analysis showed that significantly more Ty3/Gypsy ORFs were inserted in the Indica genome, while more Ty1/Copia ORFs were inserted in the Japonica genome (Table 2). The un-balanced Ty1/Copia and Ty3/Gypsy insertions increased the diversification potential for the Oryza genus [5]. These data strongly indicate that Ty1/Copia and Ty3/Gypsy ORF insertions were probably an important driving force for the differentiation of Indica and Japonica rice [3,36,37].
LTR/TEs are also major components of the centromeres in both the MH63 and Nip genomes. A significant Ty3/Gypsy peak, calculated to appear at around 0.77 Mya, was observed only in MH63 centromeres, suggesting that Indica and Japonica genomes must be diverged at or before this time point (Figure 5). Previously, by calculating Ks values with single-copy ortholog genes, the mean divergence time of Indica and Japonica rice was at around 0.55 Mya [11]. Since LTR/TE ORFs are generally not under strict evolutionary selection forces as the ortholog genes are, they may accumulate more nucleotide substitutions or other sequence mutations [27,33,34]. We thus conclude that Indica and Japonica rice may have diverged between 0.55 to 0.77 Mya. For a more accurate estimation of key time points during genome evolution, both ortholog genes as well as LTR/TE ORFs have to be considered simultaneously in a fully balanced way. A recent publication by Zhang et al. successfully applied the GPDF model to interpret the evolution of autopolyploids in the Saccharum species [38]. The optimized matrix-TE method may probably be used in other plant species with large genomes.

Supplementary Materials

The following supporting information can be downloaded at: https://www.mdpi.com/article/10.3390/agronomy12071490/s1, Figure S1: The matrix-TE approach pipeline. A rice genome with 12 chromosome sequences was used as the input data and the TE ORFs were used to generate the super matrix. The TE ORF clusters with an identity of over 95% were extracted and annotated. The TE ORF reference sequence was identified by phylogenetic analysis with the whole genomes and the centromeres were scanned and analyzed by the GPDF fit; Table S1: The centromere locations and length statistics for different chromosomes in the MH63 genome; Table S2: The centromere locations and length statistics for different chromosomes in the Nip genome.

Author Contributions

Z.W., W.X., Z.H., Y.W., Y.G. and Y.Z. conceived the bioinformatics experiments and carried out the data analysis. Y.Z. and Z.W. conceived the project and wrote the manuscript. All authors have read and agreed to the published version of the manuscript.

Funding

This work was supported by grants from the Natural Science Foundation of China (No. 21602162, No. 31690090, No. 31690091) and the National Science and Technology Major Project (No. 2016ZX08005003-001).

Data Availability Statement

Not applicable.

Conflicts of Interest

The authors declare no conflict of interest.

References

  1. Lisch, D. How important are transposons for plant evolution? Nat. Rev. Genet. 2013, 14, 49–61. [Google Scholar] [CrossRef] [PubMed]
  2. Lin, J.; Cai, Y.; Huang, G.; Yang, Y.; Li, Y.; Wang, K.; Wu, Z. Analysis of the chromatin binding affinity of retrotransposases reveals novel roles in diploid and tetraploid cotton. J. Integr. Plant Biol. 2019, 61, 32–44. [Google Scholar] [CrossRef] [PubMed] [Green Version]
  3. Huang, G.; Wu, Z.; Percy, R.G.; Bai, M.; Li, Y.; Frelichowski, J.E.; Hu, J.; Wang, K.; Yu, J.; Zhu, Y. Genome sequence of Gossypium herbaceum and genome updates of Gossypium arboreum and Gossypium hirsutum provide insights into cotton A-genome evolution. Nat. Genet. 2020, 52, 516–524. [Google Scholar] [CrossRef] [PubMed] [Green Version]
  4. Song, J.M.; Xie, W.Z.; Wang, S.; Guo, Y.X.; Koo, D.H.; Kudrna, D.; Gong, C.; Huang, Y.; Feng, J.W.; Zhang, W.; et al. Two gap-free reference genomes and a global view of the centromere architecture in rice. Mol. Plant. 2021, 14, 1757–1767. [Google Scholar] [CrossRef]
  5. Li, K.; Jiang, W.; Hui, Y.; Kong, M.; Feng, L.; Gao, L.; Li, P.; Lu, S. Gapless Indica rice genome reveals synergistic contributions of active transposable elements and segmental duplications to rice genome evolution. Mol. Plant. 2021, 14, 1745–1756. [Google Scholar] [CrossRef]
  6. Möller, M.; Stukenbrock, E.H. Evolution and genome architecture in fungal plant pathogens. Nat. Rev. Microbiol. 2017, 15, 756–771. [Google Scholar] [CrossRef]
  7. Goff, S.A.; Ricke, D.; Lan, T.H.; Presting, G.; Wang, R.; Dunn, M.; Glazebrook, J.; Sessions, A.; Oeller, P.; Varma, H.; et al. A draft sequence of the rice genome (Oryza sativa L. ssp. japonica). Science 2002, 296, 92–100. [Google Scholar] [CrossRef] [Green Version]
  8. Yu, J.; Hu, S.; Wang, J.; Wong, G.; Li, S.; Liu, B.; Deng, Y.; Dai, L.; Zhou, Y.; Zhang, X.; et al. A Draft Sequence of the Rice Genome (Oryza sativa L. ssp. indica). Science 2002, 296, 79–92. [Google Scholar] [CrossRef]
  9. Wang, W.; Mauleon, R.; Hu, Z.; Chebotarov, D.; Tai, S.; Wu, Z.; Li, M.; Zheng, T.; Fuentes, R.R.; Zhang, F.; et al. Genomic variation in 3010 diverse accessions of Asian cultivated rice. Nature 2018, 557, 43–49. [Google Scholar] [CrossRef]
  10. Huang, X.; Kurata, N.; Wei, X.; Wang, Z.X.; Wang, A.; Zhao, Q.; Zhao, Y.; Liu, K.; Lu, H.; Li, W.; et al. A map of rice genome variation reveals the origin of cultivated rice. Nature 2012, 490, 497–501. [Google Scholar] [CrossRef] [Green Version]
  11. Stein, J.C.; Yu, Y.; Copetti, D.; Zwickl, D.J.; Zhang, L.; Zhang, C.; Chougule, K.; Gao, D.; Iwata, A.; Goicoechea, J.L.; et al. Genomes of 13 domesticated and wild rice relatives highlight genetic conservation, turnover and innovation across the genus Oryza. Nat. Genet. 2018, 50, 285–296. [Google Scholar] [CrossRef] [PubMed]
  12. Sun, J.; Ma, D.; Tang, L.; Zhao, M.; Zhang, G.; Wang, W.; Song, J.; Li, X.; Liu, Z.; Zhang, W.; et al. Population Genomic Analysis and De Novo Assembly Reveal the Origin of Weedy Rice as an Evolutionary Game. Mol. Plant. 2019, 12, 632–647. [Google Scholar] [CrossRef] [PubMed] [Green Version]
  13. Luo, M.C.; Gu, Y.Q.; Puiu, D.; Wang, H.; Twardziok, S.O.; Deal, K.R.; Huo, N.; Zhu, T.; Wang, L.; Wang, Y.; et al. Genome sequence of the progenitor of the wheat D genome Aegilops tauschii. Nature 2017, 551, 498–502. [Google Scholar] [CrossRef] [PubMed]
  14. Ling, H.Q.; Ma, B.; Shi, X.; Liu, H.; Dong, L.; Sun, H.; Cao, Y.; Gao, Q.; Zheng, S.; Li, Y.; et al. Genome sequence of the progenitor of wheat A subgenome Triticum urartu. Nature 2018, 557, 424–428. [Google Scholar] [CrossRef] [Green Version]
  15. Springer Nathan, M.; Anderson Sarah, N.; Andorf Carson, M.; Ahern Kevin, R.; Bai, F.; Barad, O.; Barbazuk, W.B.; Bass Hank, W.; Baruch, K.; Ben Zvi, G.; et al. The maize W22 genome provides a foundation for functional genomics and transposon biology. Nat. Genet. 2018, 50, 1282–1288. [Google Scholar] [CrossRef] [Green Version]
  16. Haberer, G.; Kamal, N.; Bauer, E.; Gundlach, H.; Fischer, I.; Seidel Michael, A.; Spannagl, M.; Marcon, C.; Ruban, A.; Urbany, C.; et al. European maize genomes highlight intraspecies variation in repeat and gene content. Nat. Genet. 2020, 52, 950–957. [Google Scholar] [CrossRef]
  17. Sun, S.; Zhou, Y.; Chen, J.; Shi, J.; Zhao, H.; Zhao, H.; Song, W.; Zhang, M.; Cui, Y.; Dong, X.; et al. Extensive intraspecific gene order and gene structural variations between Mo17 and other maize genomes. Nat. Genet. 2018, 50, 1289–1295. [Google Scholar] [CrossRef] [Green Version]
  18. Lippman, Z.; Gendrel, A.V.; Black, M.; Vaughn, M.W.; Dedhia, N.; McCombie, W.R.; Lavine, K.; Mittal, V.; May, B.; Kasschau, K.D.; et al. Role of transposable elements in heterochromatin and epigenetic control. Nature 2004, 430, 471–476. [Google Scholar] [CrossRef]
  19. Goerner-Potvin, P.; Bourque, G. Computational tools to unmask transposable elements. Nat. Rev. Genet. 2018, 19, 688–704. [Google Scholar] [CrossRef]
  20. Tang, Y.; Ma, X.; Zhao, S.; Xue, W.; Zheng, X.; Sun, H.; Gu, P.; Zhu, Z.; Sun, C.; Liu, F.; et al. Identification of an active miniature inverted-repeat transposable element mJing in rice. Plant J. 2019, 98, 639–653. [Google Scholar] [CrossRef] [Green Version]
  21. Zhao, Q.; Feng, Q.; Lu, H.; Li, Y.; Wang, A.; Tian, Q.; Zhan, Q.; Lu, Y.; Zhang, L.; Huang, T.; et al. Pan-genome analysis highlights the extent of genomic variation in cultivated and wild rice. Nat. Genet. 2018, 50, 278–284. [Google Scholar] [CrossRef] [PubMed] [Green Version]
  22. Deininger, P.; Morales, M.E.; White, T.B.; Baddoo, M.; Hedges, D.J.; Servant, G.; Srivastav, S.; Smither, M.E.; Concha, M.; DeHaro, D.L.; et al. A comprehensive approach to expression of L1 loci. Nucleic Acids Res. 2017, 45, e31. [Google Scholar] [CrossRef] [PubMed]
  23. El Baidouri, M.; Kim, K.D.; Abernathy, B.; Arikit, S.; Maumus, F.; Panaud, O.; Meyers, B.C.; Jackson, S.A. A new approach for annotation of transposable elements using small RNA mapping. Nucleic Acids Res. 2015, 43, e84. [Google Scholar] [CrossRef]
  24. Jiang, N.; Bao, Z.; Zhang, X.; Hirochika, H.; Eddy, S.R.; McCouch, S.R.; Wessler, S.R. An active DNA transposon family in rice. Nature 2003, 421, 163–167. [Google Scholar] [CrossRef]
  25. Chen, J.; Lu, L.; Benjamin, J.; Diaz, S.; Hancock, C.N.; Stajich, J.E.; Wessler, S.R. Tracking the origin of two genetic components associated with transposable element bursts in domesticated rice. Nat. Commun. 2019, 10, 641. [Google Scholar] [CrossRef] [PubMed] [Green Version]
  26. Carpentier, M.C.; Manfroi, E.; Wei, F.J.; Wu, H.P.; Lasserre, E.; Llauro, C.; Debladis, E.; Akakpo, R.; Hsing, Y.I.; Panaud, O. Retrotranspositional landscape of Asian rice revealed by 3000 genomes. Nat. Commun. 2019, 10, 24. [Google Scholar] [CrossRef]
  27. Liao, Y.; Zhang, X.; Li, B.; Liu, T.; Chen, J.; Bai, Z.; Wang, M.; Shi, J.; Walling, J.G.; Wing, R.A.; et al. Comparison of Oryza sativa and Oryza brachyantha genomes reveals selection-driven gene escape from the centromeric regions. Plant Cell 2018, 30, 1729–1744. [Google Scholar] [CrossRef] [Green Version]
  28. Ma, J.; Bennetzen, J.L. Rapid recent growth and divergence of rice nuclear genomes. Proc. Nati. Acad. Sci. USA 2004, 101, 12404–12410. [Google Scholar] [CrossRef] [Green Version]
  29. Chuong, E.B.; Elde, N.C.; Feschotte, C. Regulatory activities of transposable elements: From conflicts to benefits. Nat. Rev. Genet. 2017, 18, 71–86. [Google Scholar] [CrossRef] [Green Version]
  30. Jain, M.; Nijhawan, A.; Tyagi, A.K.; Khurana, J.P. Validation of housekeeping genes as internal control for studying gene expression in rice by quantitative real-time PCR. Biochem. Biophys. Res. Commun. 2006, 345, 646–651. [Google Scholar] [CrossRef]
  31. Meyers, B.C.; Tingey, S.V.; Morgante, M. Abundance, distribution, and transcriptional activity of repetitive elements in the maize genome. Genome Res. 2001, 11, 1660–1676. [Google Scholar] [CrossRef] [PubMed] [Green Version]
  32. Sultana, T.; Zamborlini, A.; Cristofari, G.; Lesage, P. Integration site selection by retroviruses and transposable elements in eukaryotes. Nat. Rev. Genet. 2017, 18, 292–308. [Google Scholar] [CrossRef] [PubMed]
  33. SanMiguel, P.; Gaut, B.S.; Tikhonov, A.; Nakajima, Y.; Bennetzen, J.L. The paleontology of intergene retrotransposons of maize. Nat. Genet. 1998, 20, 43–45. [Google Scholar] [CrossRef] [PubMed]
  34. Biémont, C.; Vieira, C. Genetics: Junk DNA as an evolutionary force. Nature 2006, 443, 521–524. [Google Scholar] [CrossRef]
  35. Feschotte, C.; Jiang, N.; Wessler, S.R. Plant transposable elements: Where genetics meets genomics. Nat. Rev. Genet. 2002, 3, 329–341. [Google Scholar] [CrossRef]
  36. Huang, G.; Huang, J.Q.; Chen, X.; Zhu, Y.X. Recent advances and future perspectives in cotton research. Annu. Rev. Plant. Biol. 2021, 72, 437–462. [Google Scholar] [CrossRef]
  37. Wang, K.; Huang, G.; Zhu, Y. Transposable elements play an important role during cotton genome evolution and fiber cell development. Sci. China Life Sci. 2016, 59, 112–121. [Google Scholar] [CrossRef] [Green Version]
  38. Zhang, Q.; Qi, Y.; Pan, H.; Tang, H.; Wang, G.; Hua, X.; Wang, Y.; Lin, L.; Li, Z.; Li, Y.; et al. Genomic insights into the recent chromosome reduction of autopolyploid sugarcane Saccharum spontaneum. Nat. Genet. 2022, 54, 885–896. [Google Scholar] [CrossRef]
Figure 1. The Nip and MH63 TE ORF matrix and clusters. (A,B) Six TE ORF clusters type1, type2, typeRT, typePHA, Ty1/Copia, and Ty3/Gypsy with identities of over 95% observed at the TE matrix diagonals in the Nip and MH63 genomes, respectively, where N indicates Nip and M indicates MH63. (C) TE numbers with identities of over 95% for each cluster in Nip, N-type1 (64 TEs), N-type2 (51 TEs), N-typeRT (54 TEs), N-typePHA (51 TEs), N-Ty1/Copia (48 TEs), N-Ty3/Gypsy (14 TEs). (D) TE numbers with an identity over 95% for each cluster in MH63, M-type1 (63 TEs), M-type2 (55 TEs), M-typeRT (59 TEs), M-typePHA (56 TEs), M-Ty1/Copia (18 TEs), and M-Ty3/Gypsy (71 TEs).
Agronomy 12 01490 g001
Figure 2. The phylogenetic analysis of the Nip and MH63 TE super-family clusters and ORF reference sequence identifications for each cluster. (A) Phylogenetic trees of type1 TE ORFs for Nip and MH63, the ref-N-type1 and ref-M-type1 sequence on the top branch was selected as the reference sequences for the N-type1 and M-type1 clusters, respectively. (BF) In the same format as (A), for type2, typeRT, typePHA, Ty1/Copia and Ty3/Gypsy, respectively. The TE ORF reference sequences on the top of the branch for each cluster are shown in red.
Agronomy 12 01490 g002
Figure 3. Scanning of the Nip and MH63 whole genomes with the TE ORF reference sequences. (A) Nip genome scanning after normalization with ref-N-Ty1/Copia. (B) MH63 genome scanning after normalization with ref-M-Ty3/Gypsy. (CL) in the same format as (A), for Ty1/Copia, Ty3/Gypsy, type1, type2, typeRT and typePHA, respectively. Individual TE peaks P-Copia (p value = 0.0001) and P-Gypsy (p value = 0.008) were observed in the Nip and MH63 genomes separately.
Agronomy 12 01490 g003
Figure 4. The SNP distributions across Ty1/Copia and Ty3/Gypsy ORFs, and the GPDF fit of the P-Copia and P-Gypsy peaks. (A) The SNP level distributions of Ty1/Copia in the MH63 (upper panel) and Nip (lower panel) genomes. (B) The SNP level distributions of Ty3/Gypsy in the MH63 (upper panel) and Nip genomes (lower panel). gag, the GAG protein; pr, the protease; int, the integrase; RT, the reverse transcriptase; RH, RNaseH. (C) The GPDF fit of the P-Copia peak in the Nip genome with an R square value 0.99, and the age of the peak was calculated at around 0.19 Mya. (D) The GPDF fit of the P-Gypsy peak in MH63 with an R square value of 0.96, and the age of the peak was 0.77 Mya. The peaks with identities of 0.7–0.8 were estimated as Ty3/Gypsy insertion events at 9.7~6.3 Mya.
Agronomy 12 01490 g004
Figure 5. The centromeres of MH63 and Nip were scanned with Ty1/Copia and Ty3/Gypsy ORF reference sequences and normalized with sequence identities. (A) MH63 centromere scanning and normalizing with ref-M-Ty1/Copia. (BD) In the same way. Individual peak P-Gypsy (p value = 0.03) was observed in the MH63 centromeres, and the age of the peaks was 0.77 Mya.
Agronomy 12 01490 g005
Table 1. Genome size, TE content, and intact TE ORF statistics of two rice genomes.
SpeciesJaponica (Nip)Indica (MH63)
Genome size (Mb)380395
Total TE content (%)44.145.9
Intact LTR/TE47445146
ORFs in matrix15202010
Table 2. The whole genome and centromere scanning with six TE ORF reference sequences in MH63 and Nip.
Genome and Centromere Scanning by TE ORFs
Type1Type2TypeRTTypePHATy1/CopiaTy3/Gypsy
Number of TE ORFs in genomesIndica (MH63)728108699823793166277
Japonica (Nip)8201039859221914793328
Number of TE ORFs in centromeresIndica (MH63)////23758
Japonica (Nip)////57345
Publisher’s Note: MDPI stays neutral with regard to jurisdictional claims in published maps and institutional affiliations.

