Article

Impact of Combined Drought and Heat Stress and Nitrogen on Winter Wheat Productivity and End-Use Quality

by
Gražina Statkevičiūtė
1,*,
Žilvinas Liatukas
1,
Jurgita Cesevičienė
1,
Kristina Jaškūnė
1,
Rita Armonienė
1,
Ramune Kuktaite
2 and
Gintaras Brazauskas
1
1
Institute of Agriculture, Lithuanian Research Centre for Agriculture and Forestry, Instituto al. 1, Akademija, LT-58344 Kėdainiai District Municipality, Lithuania
2
Department of Plant Breeding, Swedish University of Agricultural Sciences (Alnarp), P.O. Box 190, SE-234 22 Lomma, Sweden
*
Author to whom correspondence should be addressed.
Agronomy 2022, 12(6), 1452; https://doi.org/10.3390/agronomy12061452
Submission received: 27 April 2022 / Revised: 9 June 2022 / Accepted: 15 June 2022 / Published: 17 June 2022
(This article belongs to the Section Crop Breeding and Genetics)

Abstract

:
Water deficit and heat stress are the main abiotic stresses affecting the yield and quality of winter wheat. The increasing frequency of the simultaneous occurrence of these two stresses might threaten global food security and drives the need to breed resilient high-quality cultivars. The aim of this study was to evaluate the grain yield, quality and gluten protein characteristics in 50 winter wheat cultivars and breeding lines during the harvest years of 2018 and 2019. The yield and grain quality components were affected more severely by the combined heat and drought in 2019 than the drought in 2018. Two nitrogen (N) fertilization regimes were studied, sustainable (S, 15/100/30 kg N ha−1) and high-input (HI, 15/100/100 kg N ha−1). The yield was higher in HI trials compared to S trials by 2.2 t ha−1 in 2018 and by 2.4 t ha−1 in 2019. Higher protein content and sedimentation volume and lower yield, test weight and starch content were observed under combined heat and drought stress in 2019 compared to 2018. Genotypes containing the Glu-D1 x5-y10 allele exhibited the higher amounts of unextractable polymeric proteins (%UPP = 58.5%) in gluten studied by size exclusion liquid chromatography (SE-HPLC) as compared to Glu-D1 x2-y12 allele (%UPP = 54.3%). Genotype was the main determinant of gluten protein characteristics regardless of the nitrogen application and the abiotic stress conditions. The results suggest that the relatively mild drought and heat events in Lithuania might not threaten gluten quality in the future; however, breeding efforts should be directed towards improved drought and heat stress resistance to ensure stable wheat productivity in the region.

1. Introduction

Bread wheat (Triticum aestivum L.) is one of the key staple crops grown globally. In Lithuania, winter wheat occupies the lion’s share of agricultural land [1]. The increasing human population in the world drives the need to increase the production of wheat and ensure food security. Climate change, characterized by an increase in frequency and severity of extreme events, has been shown to threaten global wheat production [2,3,4]. However, an even higher frequency of abiotic stresses is predicted for the future, meaning that exposure to extreme climatic events of the key European wheat-growing areas may increase more than twofold [5,6]. Therefore, there is the need for new wheat cultivars that are adapted to upcoming climatic variations and produce stable yields of high quality grain.
Heat and drought induce an array of complex morphological, physiological and biochemical responses in plants. Both stresses trigger accumulation of reactive oxygen species (ROS); therefore, wheat genotypes with higher oxidative scavenging ability can be less susceptible to drought and/or heat [7,8]. Increases in metabolites such as glutathione, methionine, cysteine, proline and phenolic acids in wheat plants subjected to drought stress indicate that a strong antioxidant defense system is vital for stress tolerance [7,8,9]. Abscisic acid signaling, an array of transcription factors, heat shock proteins and sugar transport and accumulation in floral organs play major roles in plant resilience to combined heat and drought stress [7,10,11].
Tolerance to drought stress during plant reproductive development is predicted to increase yield 10–23% under the 2050 climate scenario in Central and Eastern Europe [12]. Wheat yield and quality traits are highly influenced by the interplay of environment and management practices, especially nitrogen (N) application. A high N input increases wheat yield and its quality. However, excessive use of N fertilizers leads to environmental pollution, including greenhouse gases, which further drive climate change [13]. The reduction of N application in sustainable agriculture can be achieved by breeding wheat genotypes with high N-use efficiency, capable of producing stable, good-quality yields under low N input [14]. Climate-smart cultivation practices in combination with breeding for stress-resilient wheat genotypes are also needed to maintain stable wheat yields in the future [7].
Significant progress has been achieved through breeding directed towards improved grain yield and baking quality during last decades [15,16,17]. The improvement in yield and protein content needs to go hand in hand with the quality parameters required for diverse end-use applications, which are mainly determined by the composition of various gluten protein fractions [18,19] and their stability in a varying climate. From these protein fractions, the monomeric gliadins are responsible for wheat dough extensibility, while the polymeric glutenins are the determinants of dough strength [20,21]. The ability of gliadins and glutenins to polymerize during dough mixing and bread baking into large polymers is normally evaluated by the percentage of unextractable polymeric proteins in the total polymeric proteins (%UPP), a character that is known to differ between different types of wheat flour [22,23], especially between winter and spring wheat. Furthermore, varying climates, such as heat and drought, are known to induce the formation of both large gluten polymers and large monomeric proteins and decrease the protein concentration in spring wheat [24]. However, the impact of complex interactions between wheat yield and end-use quality characteristics and severe climate fluctuations, such as heat and drought, fertilizer management and genotype are not fully understood. The objective of this study was to determine the impact of combined drought and heat stress and nitrogen application on the end-use quality characteristics and gluten protein composition in 50 winter wheat cultivars and breeding lines grown over 2017–2019 in Lithuania.

2. Materials and Methods

2.1. Wheat Material

Twelve winter wheat cultivars originating from Lithuania (8), Germany (3) and Denmark (1), and 38 winter wheat breeding lines developed at the Institute of Agriculture, Lithuanian Research Centre for Agriculture and Forestry were included in this study (50 genotypes in total, Table S1). The field trials were carried out for two consecutive growing seasons in 2017–2018 and 2018–2019 at the Institute of Agriculture, Lithuanian Research Centre for Agriculture and Forestry (55°40′ N, 23°87′ E), Kedainiai district, Lithuania. The soil of the experimental site was light loam endocalcari-epihypogleyic-cambisol (CMg-pw-can).

2.2. Nitrogen Application

Two nitrogen (N) fertilization regimes, designated as sustainable (S) and high-input (HI), were applied at different plant growth stages and contained N amounts 15/100/30 kg N ha−1 and 15/100/100 kg N ha−1, respectively. Each genotype was sown in 3 replicates in a randomized complete block design of a plot size of 11 × 1.6 m. Equal amounts of fertilizers were applied for both fertilization trials during both growing seasons before sowing in September (15 kg N ha−1, 50 kg P2O5 ha−1, 100 kg K2O ha−1) and in spring (100 kg N ha−1). The last fertilization was applied when plants reached stem elongation stage e.g., 30 kg N ha−1 for the S and 100 kg N ha−1 for the HI trials. Trials were sown on 27th (S trial) and 28th (HI trial) of September in 2017. The soil pH at the S trial site was 5.6, available phosphorus was 205 mg kg−1, available potassium was 210 mg kg−1, while for the HI trial soil, pH was 7.5, phosphorus content was 200 mg kg−1 and potassium content was 135 mg kg−1. Plants reached heading stage at the end of May. Harvesting of the grain was carried out on 20th–23rd July. In 2018, the S trial was sown on 10th September, (soil pH 5.7, phosphorus 205 mg kg−1, potassium 216 mg kg−1), while HI trial was sown on 17th September 2018 (soil pH was 6.6, phosphorus content was 230 mg kg−1, potassium content was 125 mg kg−1). The plant heading was recorded on 26th May–5st June. The trials were harvested on 23rd–26th July. The duration of 2017–2018 crop cycle was 297–299 days, duration of 2018–2019 crop cycle was 313–317 days. Protein, starch, wet gluten content, sedimentation volume and test weight were determined using Infratec™ 1241 grain analyzer (FOSS, Denmark).

2.3. Determination of the HMW-GS Alleles at the Glu-A1 and Glu-D1 Loci

Genomic DNA was extracted from the fresh leaves of at least 10 plants per cultivar/breeding line using GeneJET Plant Genomic DNA Purification Kit (ThermoFisher Scientific, Vilnius, Lithuania). The allele-specific primers were used to amplify the genes encoding HMW-GS at the Glu-A1 and Glu-D1 loci. (Table 1). PCR contained 1 × DreamTaq Green PCR Master Mix (ThermoFisher Scientific Baltics, Vilnius, Lithuania), 50 ng of genomic DNA, the primer concentration was used as described by the authors for each primer pair, the total volume of the reaction mixture was 10 µL. PCR was carried out on an Eppendorf Mastercycler (Eppendorf AG, Hamburg, Germany), the obtained products were separated by the electrophoresis in agarose gels, GeneRuler DNA Ladder Mix (ThermoFisher Scientific Baltics, Vilnius, Lithuania) was used as a molecular size standard.

2.4. SE-HPLC Analysis

Whole grains were milled into flour using a Perten Lab Mill 3100 (PerkinElmer Inc., Waltham, MA, USA). The flour was used to study gluten protein extractability and polymerization by size-exclusion high-performance liquid chromatography (SE-HPLC) at the Department of Plant Breeding, SLU, Alnarp. Two-step extraction procedure was used to extract gluten proteins according to Ceresino et al. [23] and Lama et al. [24]. In the first step, 16.5 mg of flour was suspended in 1.4 mL of SDS-phosphate buffer (0.5% SDS, 0.05 M NaH2PO4, pH 6.9), shaken for 5 min at 2000 rpm and centrifuged for 30 min at 10,000 rpm (1st Extr). Supernatant was decanted into HPLC vials. In the second extraction, the pellet was resuspended in 1.4 mL of SDS-phosphate buffer and the blend was sonicated for 45 s, at amplitude 5, in an ultrasonic disintegrator (Soniprep 150, Tamro, Mölndal, Sweden), then later centrifuged for 30 min at 10,000 rpm and the supernatant decanted into HPLC vials for analysis (2nd Extr). For each sample, three technical replicates were studied. The samples were analyzed on Waters HPLC system (Milford, CT, USA): e2695 separation module, 2998 PDA detector, BioSep SEC-s4000 Phenomenex column. Separation was run for 30 min after injecting 20 µL of sample into an eluent of acetonitrile and water (1:1 v/v) containing 0.1% trifluoroacetic acid, flow rate 0.2 mL min−1. Proteins were detected by 210 mm UV absorbance. Obtained chromatograms were divided into four fractions. Fractions of the 1st Extr were denoted as eF1, eF2, eF3 and eF4; fractions of the 2nd Extr were denoted as uF1, uF2, uF3 and uF4. The eF1 and uF1 areas correspond to large polymeric proteins (LPP), eF2 and uF2 correspond to small polymeric proteins (SPP), eF3 and uF3 correspond to large monomeric proteins (LMP), eF4 and uF4 correspond to small monomeric proteins (SMP). The unextractable LPP in total LPP (%LUPP), % of unextractable polymeric protein in total polymeric proteins (%UPP), unextractable LMP in total LMP (%LUMP), monomer to polymer ratio (Mon/Pol), total amount of unextractable proteins (TotU) and total amount of extractable proteins (TotE) were calculated as follows:
%LUPP = uF1/(uF1 + eF1) × 100,
%UPP = (uF1 + uF2)/(uF1 + uF2 + eF1 + eF2) × 100,
%LUMP = uF3/(uF3 + eF3) × 100,
Mon/Pol = (uF3 + uF4 + eF3 + eF4)/(uF1 + uF2 + eF1 + eF2),
TotU = uF1 + uF2 + uF3 + uF4,
TotE = eF1 + eF2 + eF3 + eF4,

2.5. Statistical Analysis

The statistical analysis was carried out in the open-source R statistical environment version 4.0.2 [30]. Basic descriptive statistics was calculated using R package ‘metan’ function desc_stat() [31]. Analysis of variance was performed using function aov(), effect sizes (ω2) for ANOVA were calculated using function omega_sq() from the R package ‘sjstats’ [32]. Post hoc Tukey HSD tests were conducted using function HSD.test() from the R package ‘agricolae’ [33]. The means of two traits were compared by using t tests. Pearson correlation was calculated using function cor.test(). Principal component analysis (PCA) was performed using R package FactoMineR [34].

3. Results

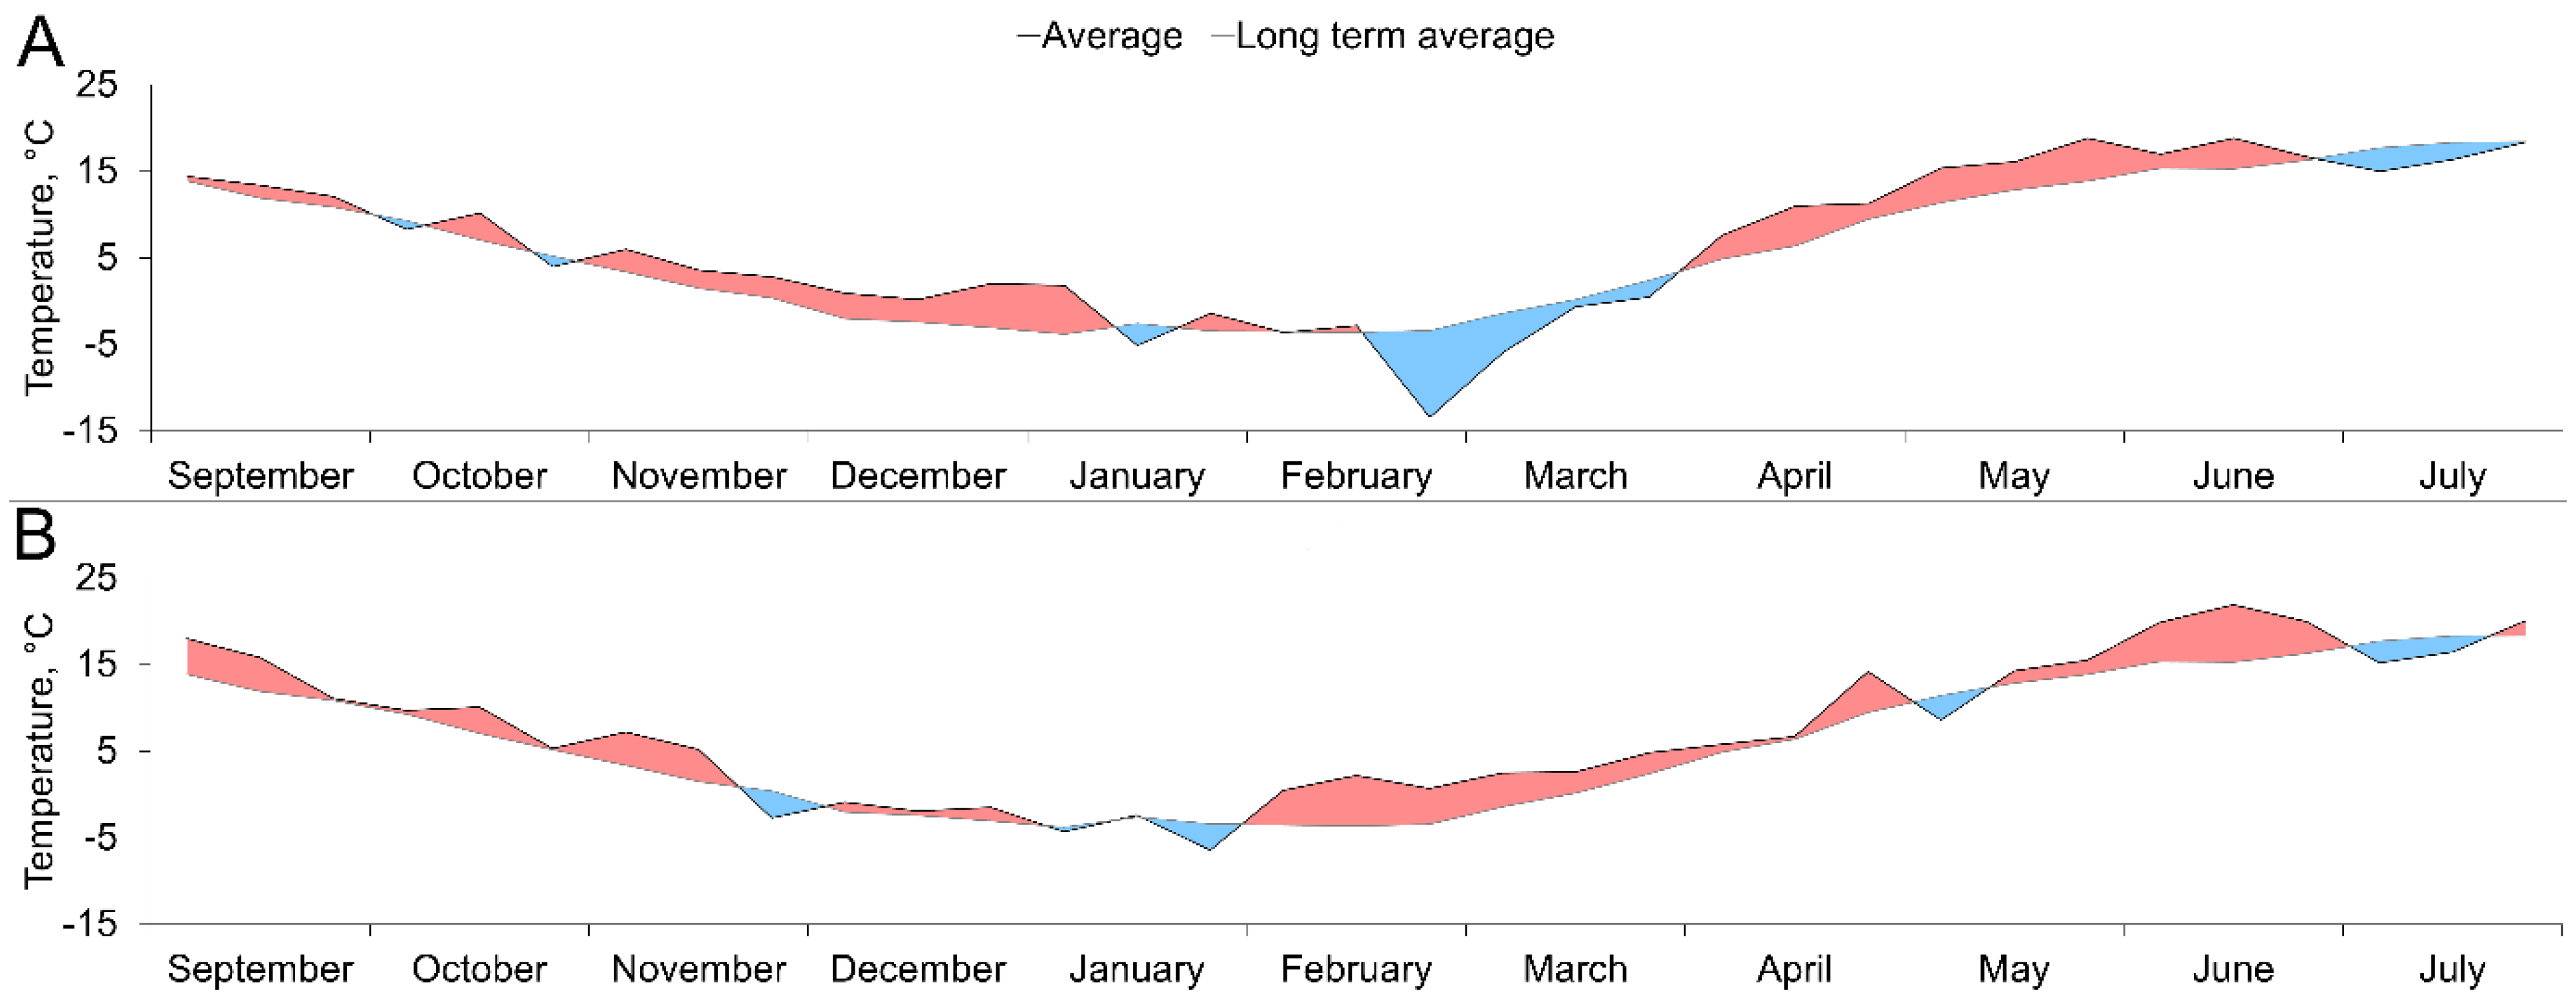
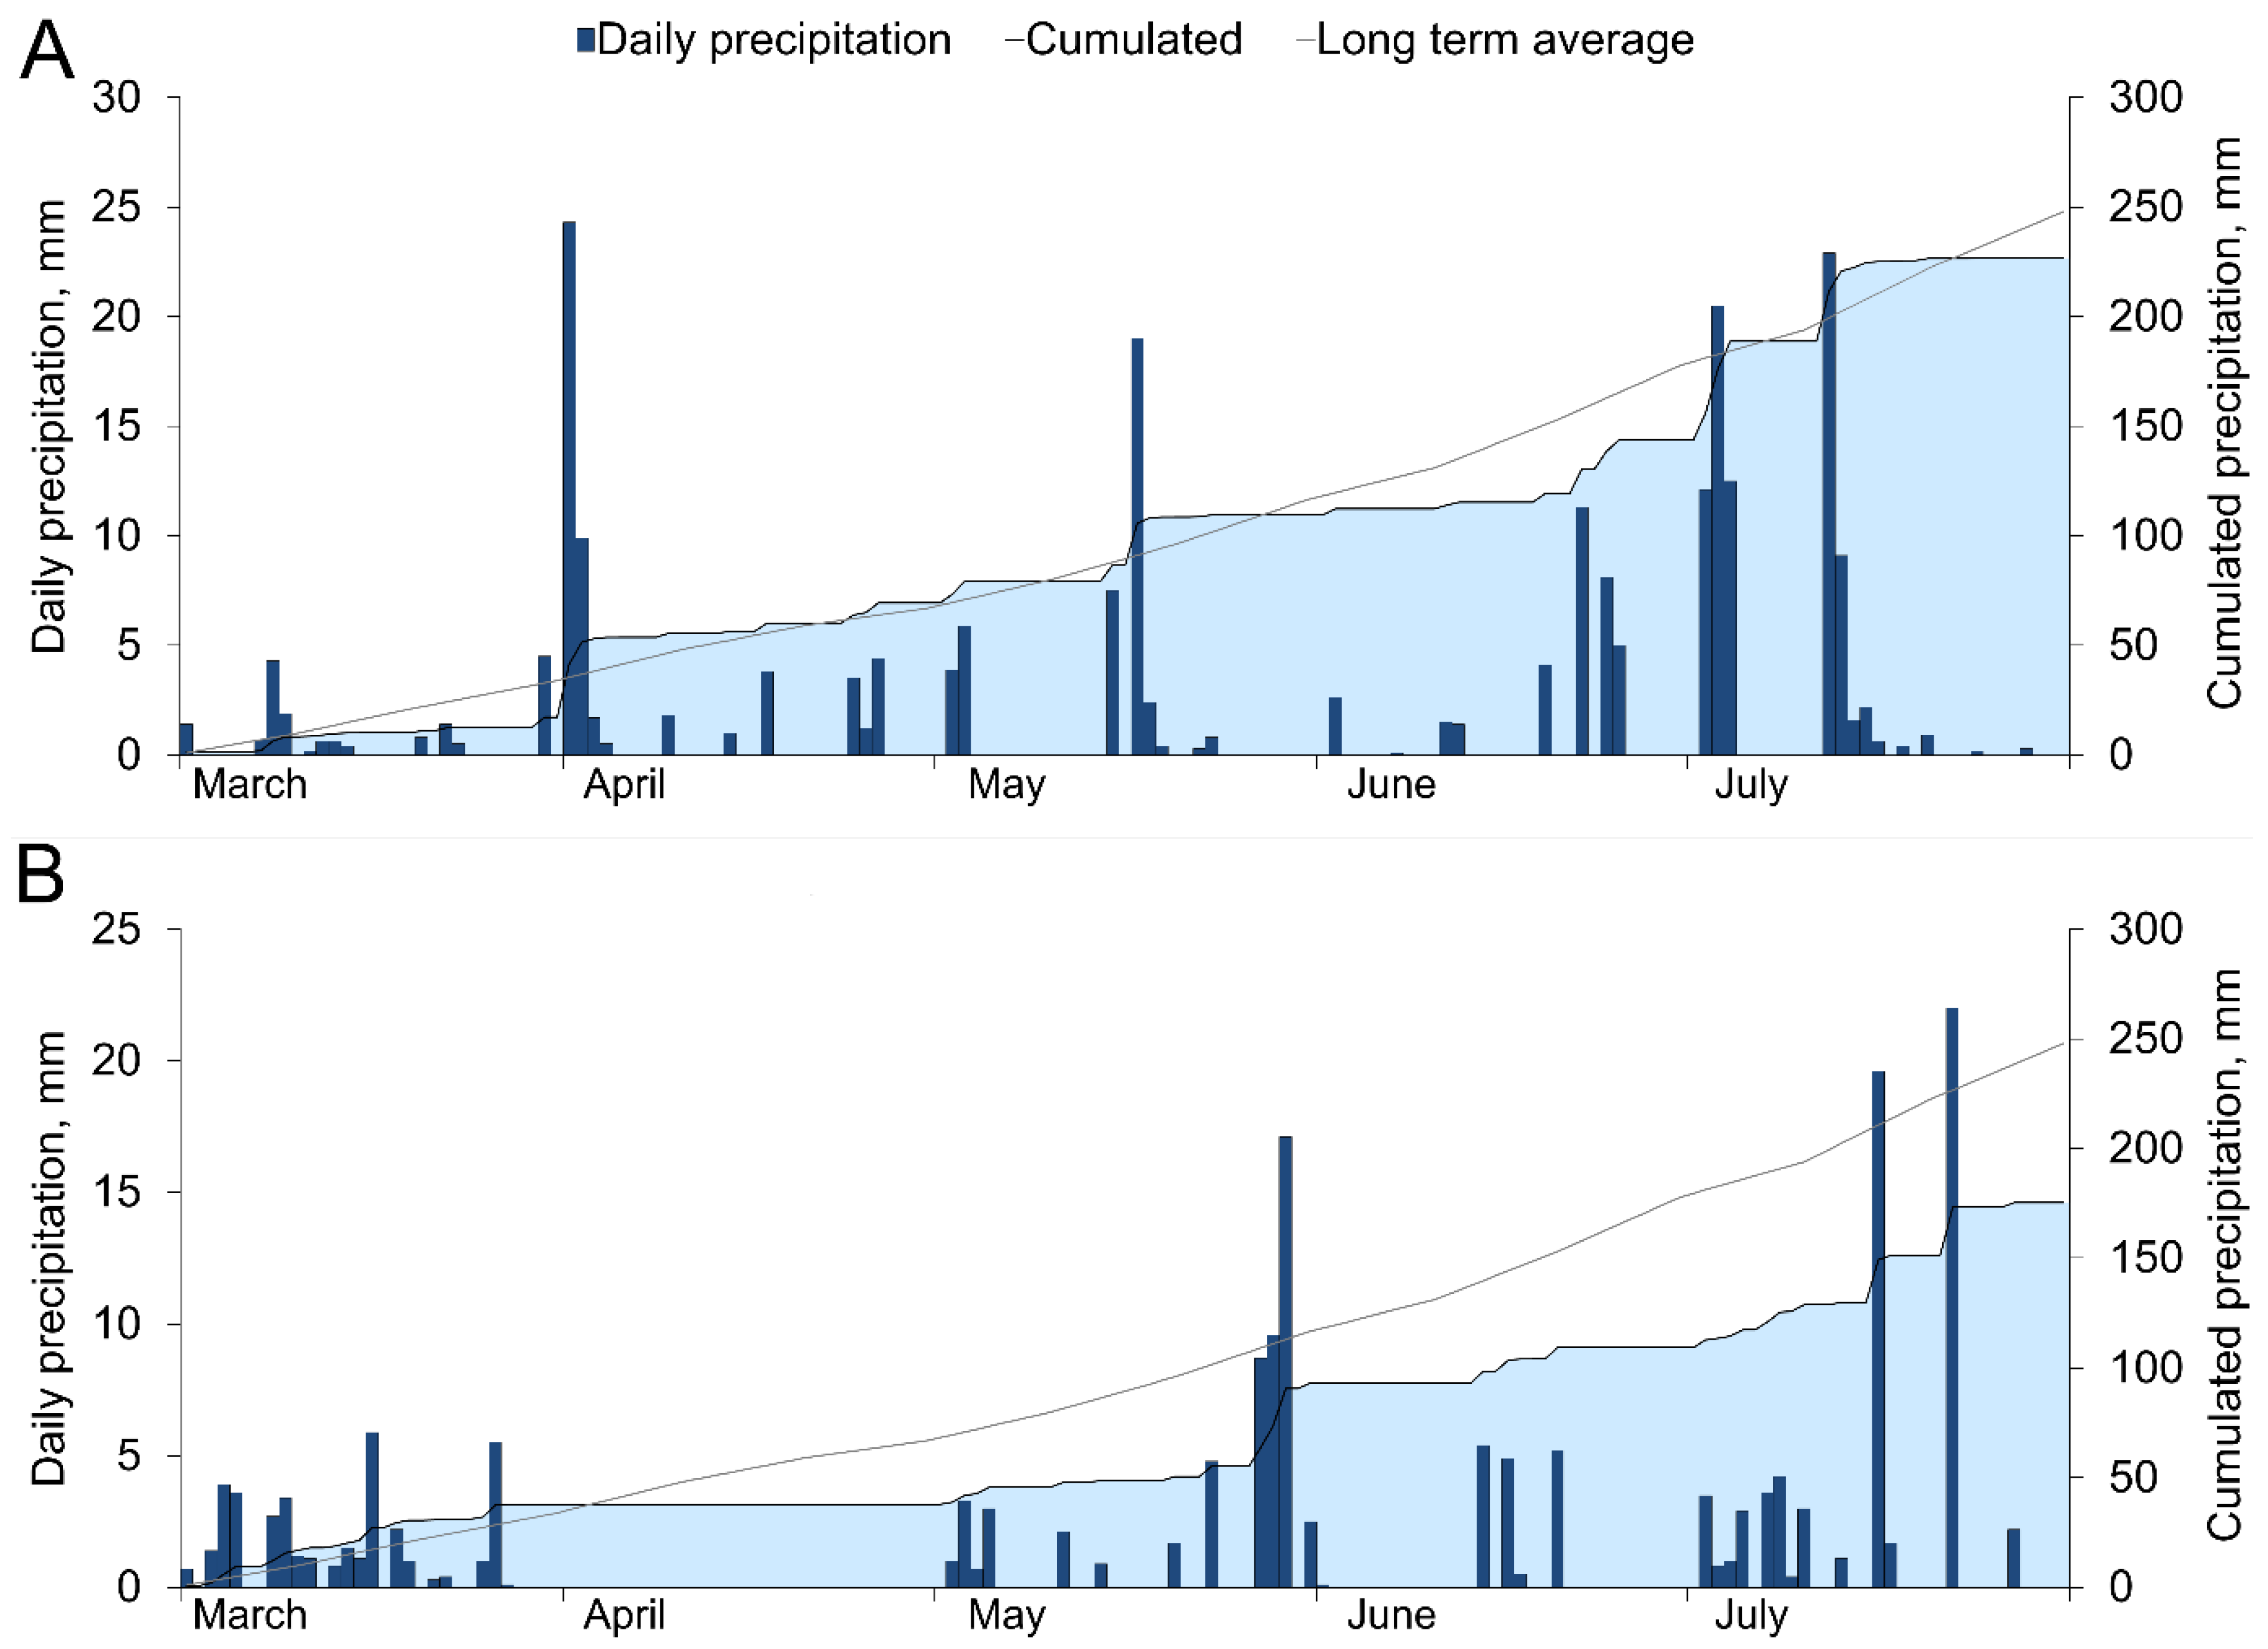
3.1. Temperature and Precipitation Variation

In this study, both growing seasons were warmer (Figure 1) and dryer (Figure 2) than the average temperature and precipitation of a 30-year period (1981–2010). In this study, the two winters were mostly mild, with the mean temperatures dropping below −10 °C for 10 days in total during the winter season of 2018 and for 3 days in total during the season of 2019. Wheat plants experienced heat waves during the grain filling period, with the maximum temperature rising above 25 °C in 2019. To sum up, the crops experienced severe drought stress during 2018 and combined drought and heat stress during 2019.

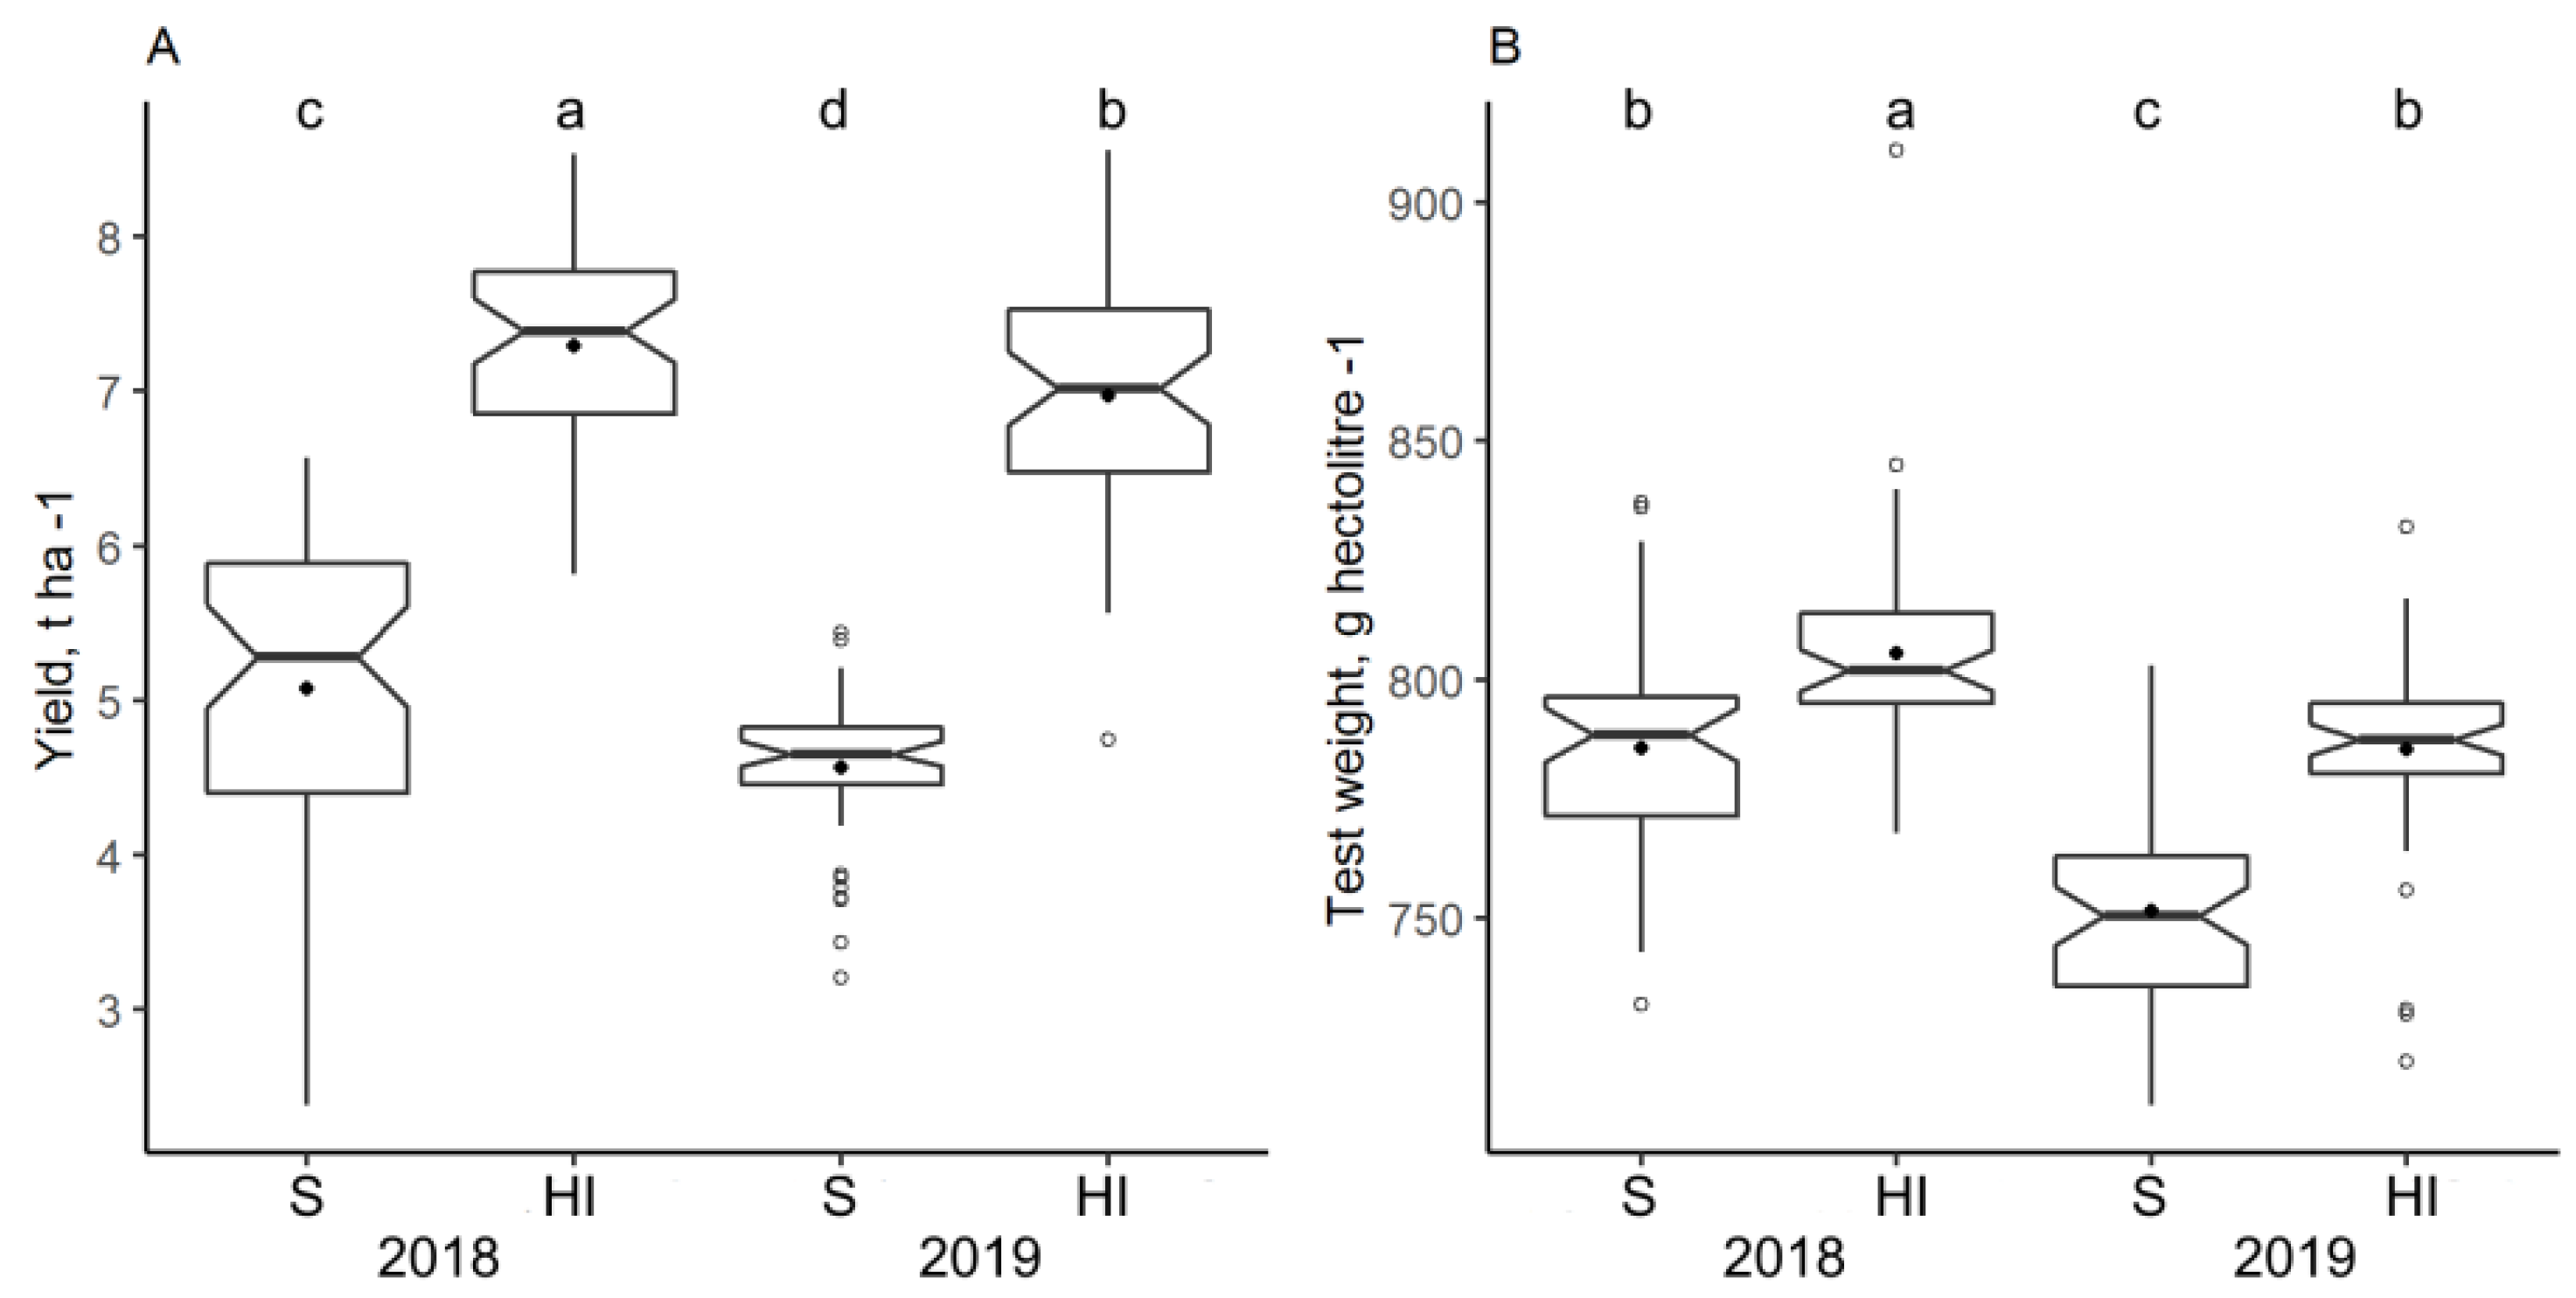
3.2. Impact of Climate and Nitrogen Application on Yield and Grain Test Weight

Yield and grain test weight were significantly affected by the nitrogen application and growing conditions in both years (Figure 3A,B). Mean yield was found to be higher in HI trials compared to S trials, and was 2.2 t ha−1 in 2018 and 2.4 t ha−1 in 2019 (Figure 3A). There was no correlation between the yield increase in response to nitrogen application in 2018 vs. 2019. The yield was lower by 0.5 t ha−1, on average, in the S trial of 2019 compared to the S trial of 2018, while the mean yield reduction of the HI trial was 0.3 t ha−1. However, not all genotypes suffered yield decrease, and 26% of genotypes in the S trial and 36% of genotypes in the HI trial produced higher yields in 2019 compared to 2018. Similar trends were observed in the grain test weight, and the amounts were higher in the HI trial compared to the S trial and higher in 2018 compared to 2019.

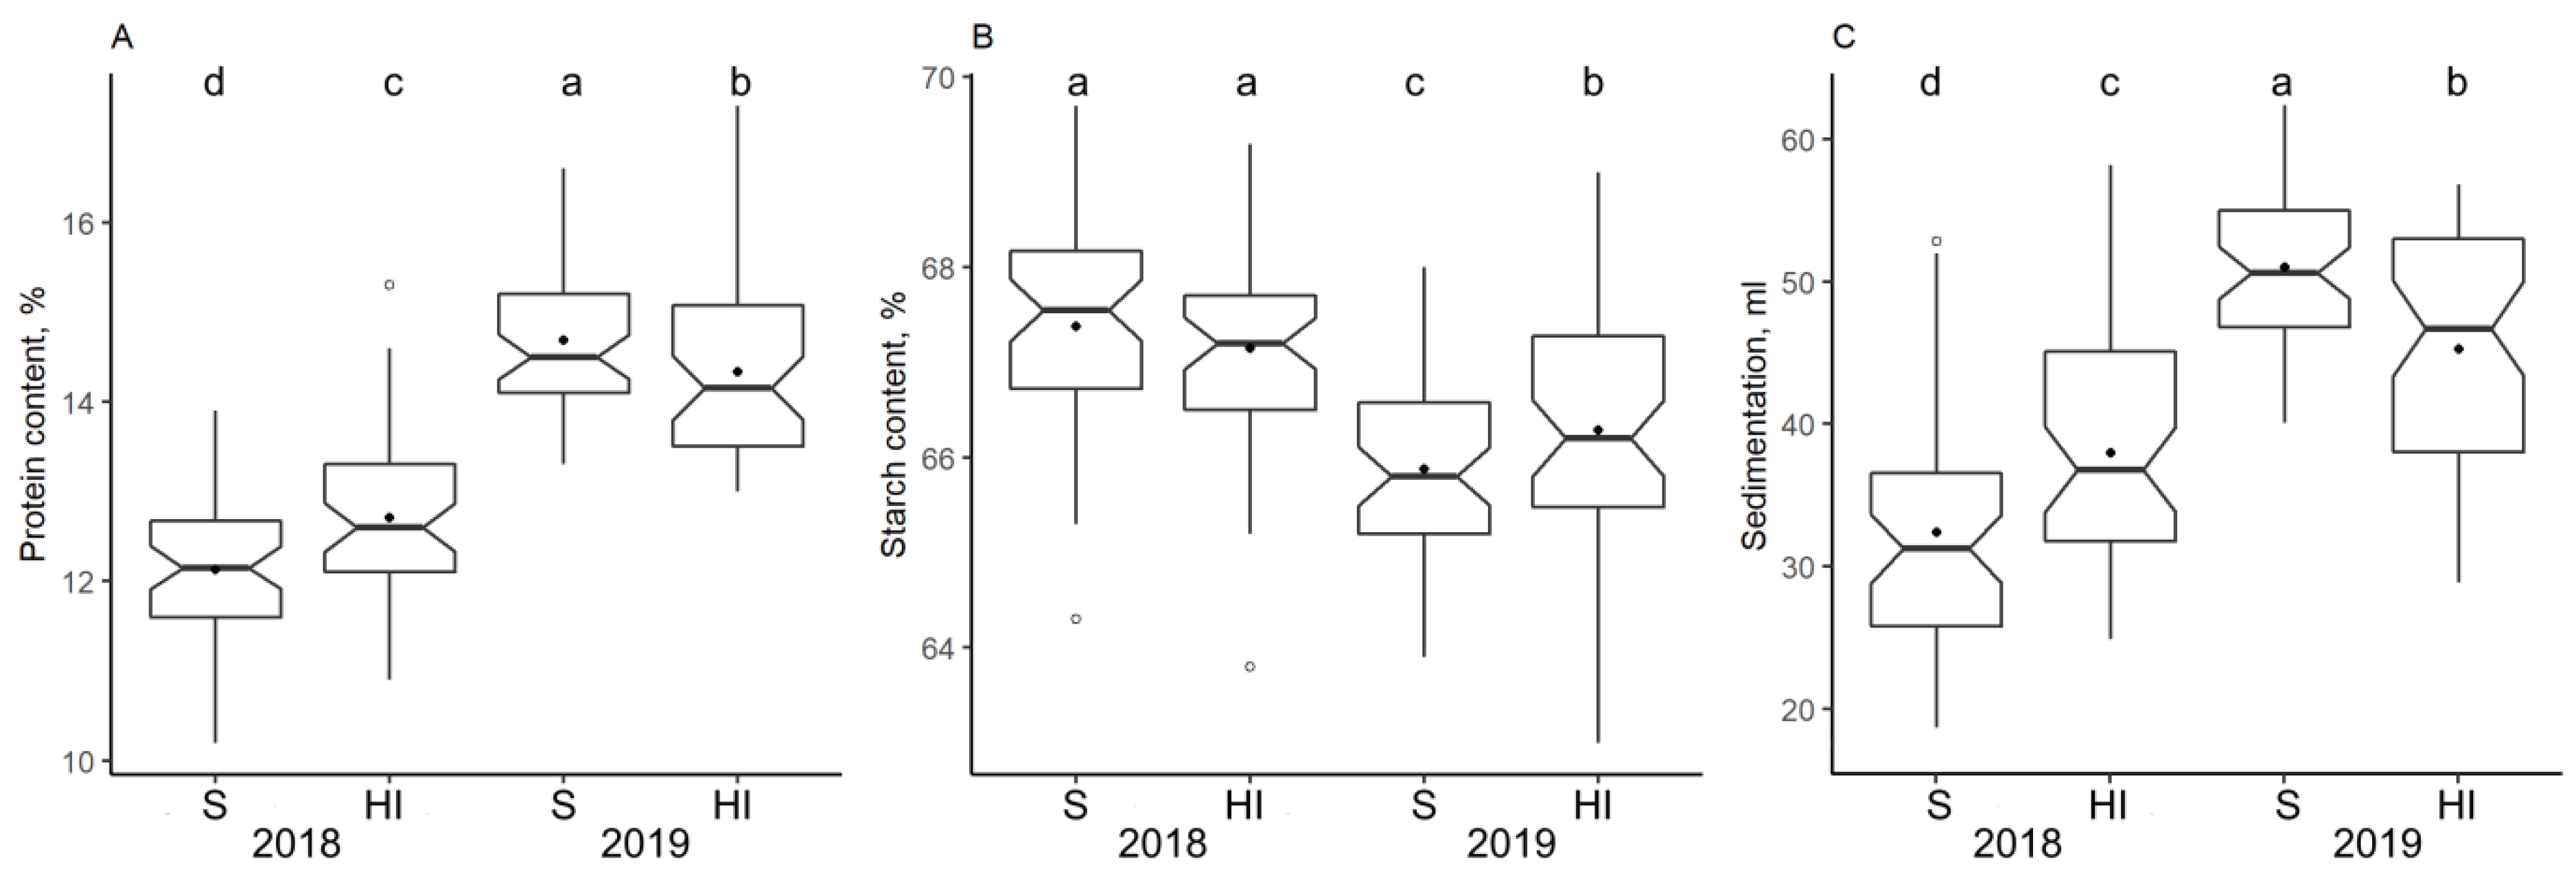
3.3. Impact of Climate and Nitrogen Application on Protein Concentration and Flour Quality Characteristics

Higher nitrogen application resulted in significantly higher gluten protein content in the grain in 2018 (Figure 4A). In the 2018 HI trial, the protein content was higher compared to the S trial, and the maximum protein content increase in the HI compared to the S trial was 2.5%. However, in 2019, the HI trial’s overall protein content was lower compared to that of the S trial. There was a negative correlation between yield and protein content in all four trials, ranging from −0.36 to −0.46 (p < 0.05).
A high correlation was found between the protein content and sedimentation volume (r = 0.89, p < 0.01), and as expected, sedimentation volume followed the same trend such that the mean of the HI trial was higher compared to that of the S trial in 2018 but lower in 2019 (Figure 4C). Overall, the hot and dry climate in 2019 positively affected both the protein content and sedimentation volume.
Starch content was found higher in 2018 than in 2019 (Figure 4C). Nitrogen application did not have significant effect on the starch content in 2018, but in 2019 it was slightly higher (mean difference per genotype 0.4%) in the HI trial compared to the S trial (Figure 4B). Starch content was also the only trait which showed a consistent negative correlation (p < 0.05) with the plant heading date in all trials. It was weak in the S trials in both years (r = −0.30) and moderate in the HI trials (r = −0.55 in 2018, r = −0.53 in 2019).

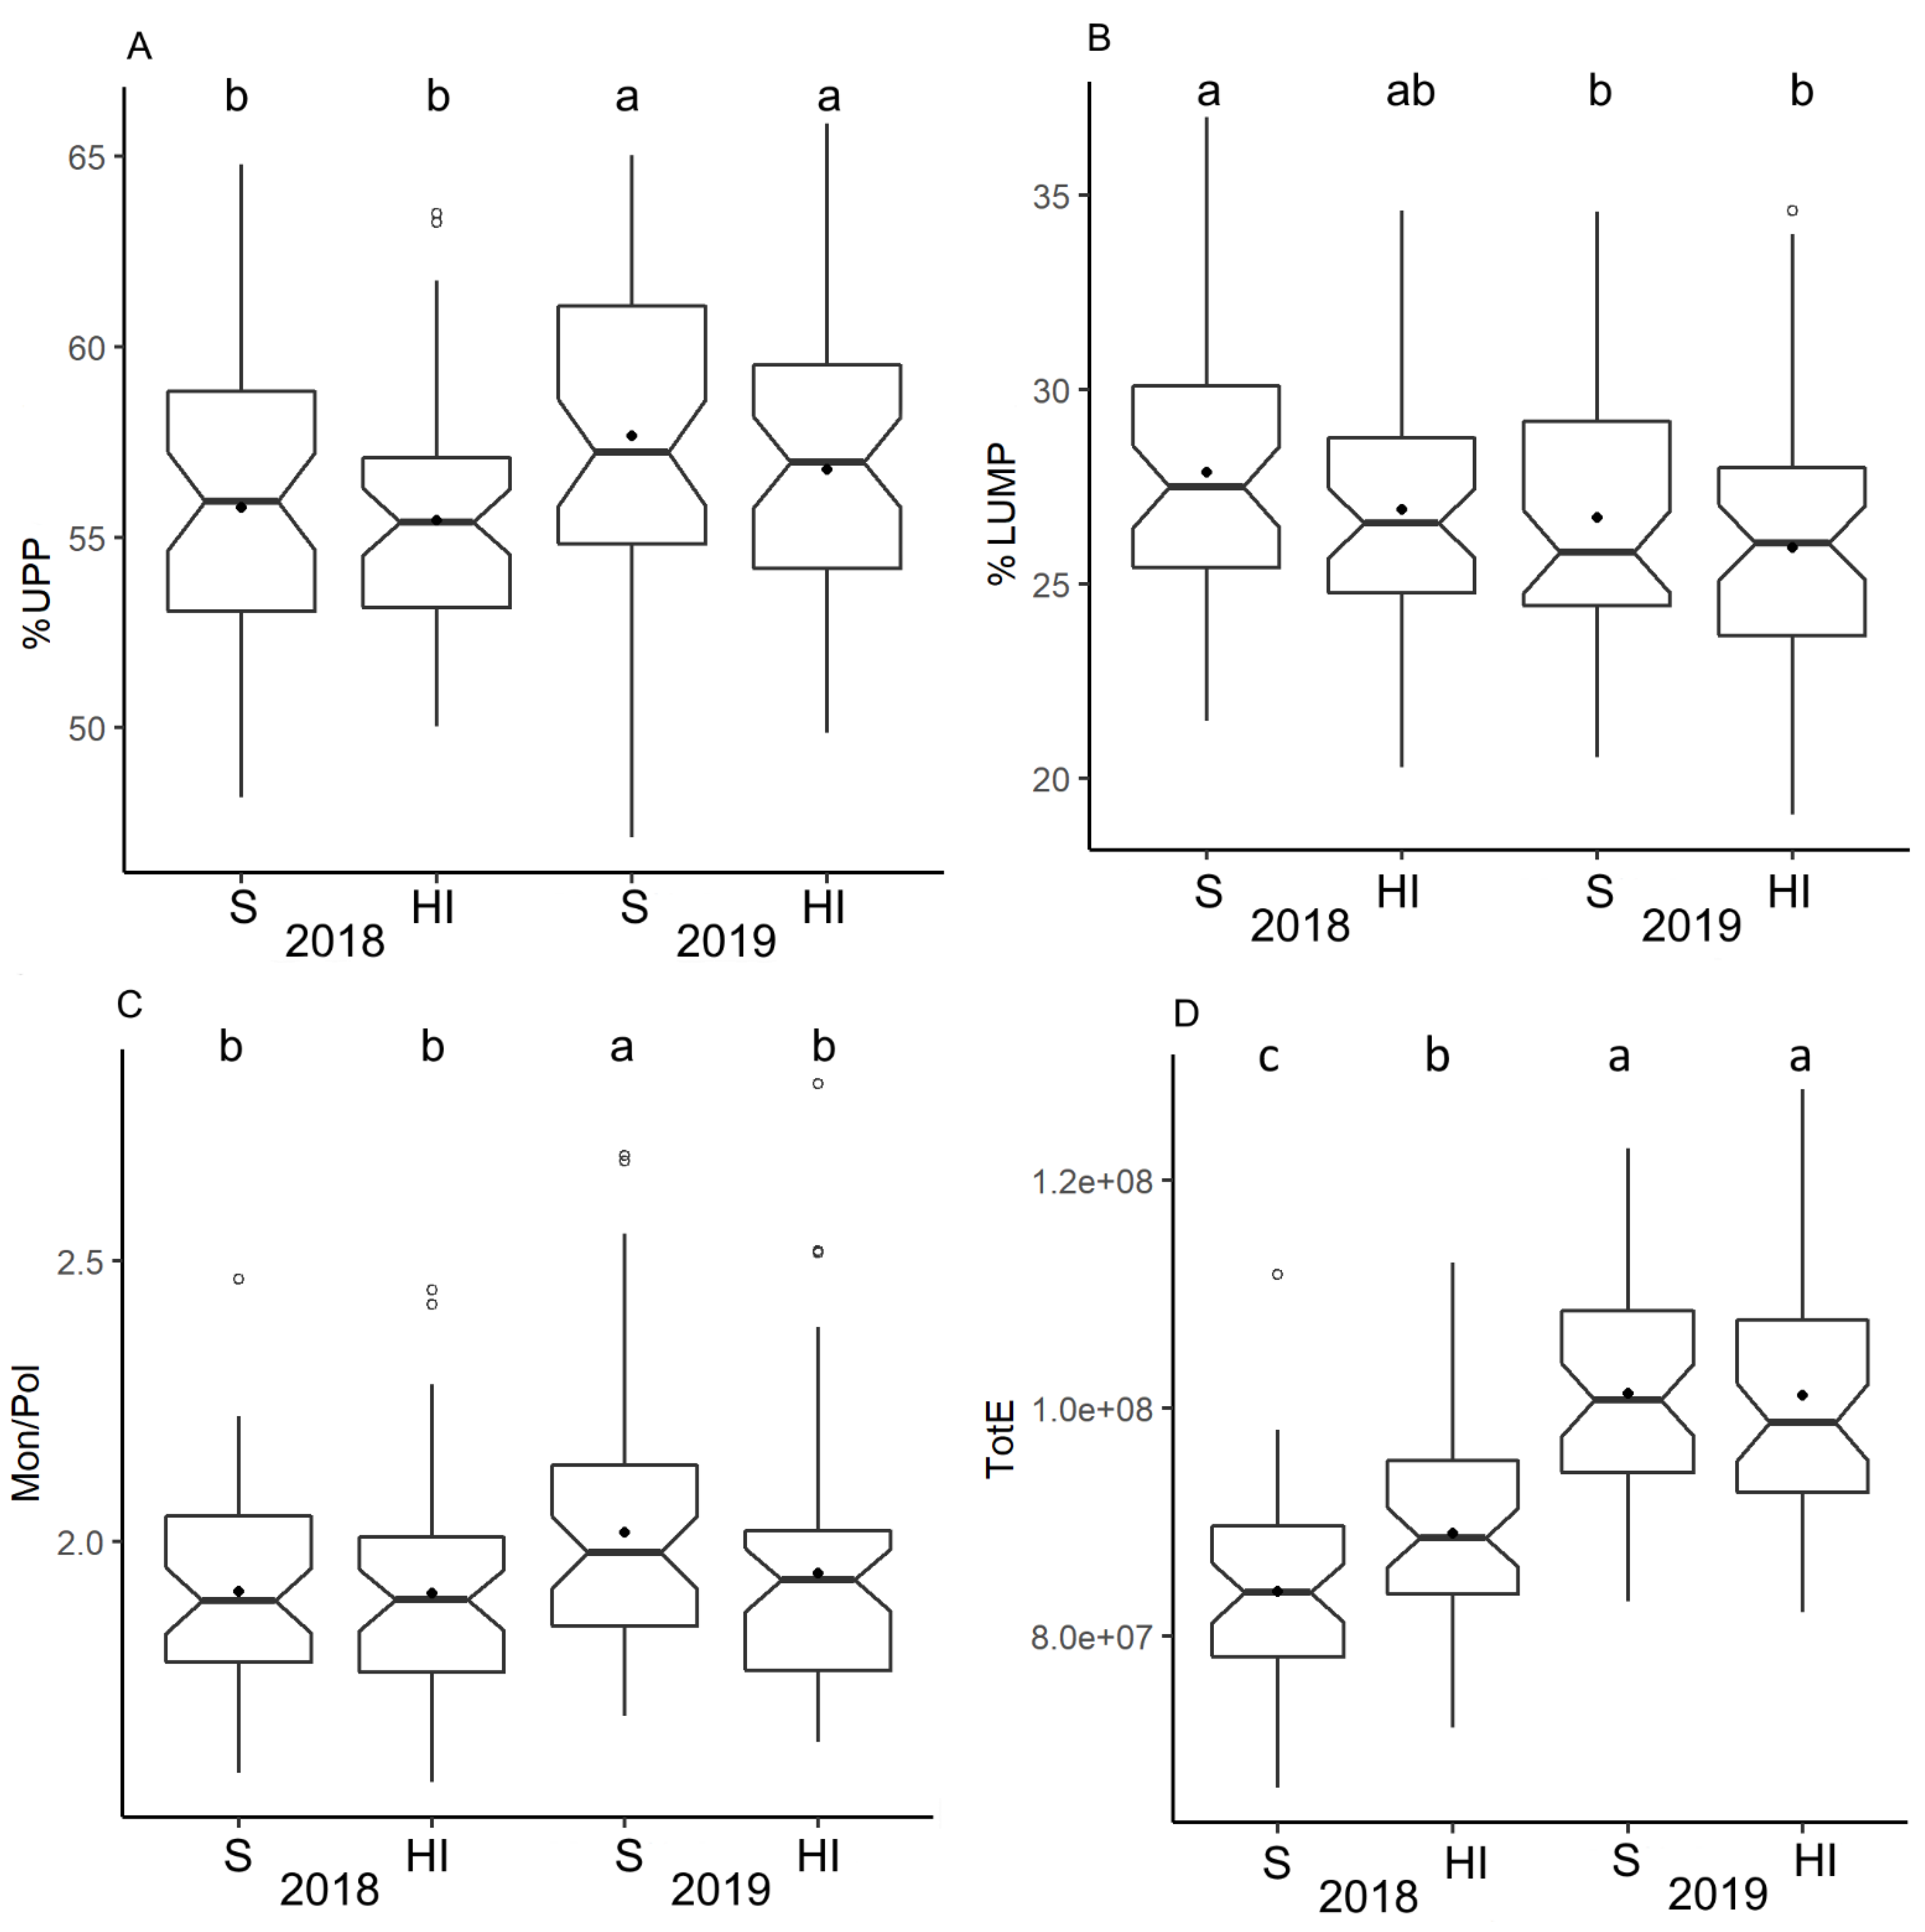
3.4. Gluten Protein Parameters by SE-HPLC

The gluten protein polymerization of the wheat grown under the different nitrogen regimes (S and HI) in 2018 and 2019 was studied using SE-HPLC, and a clear variation in the protein composition was observed due to the varying climate (Figure 5). The heat and drought in 2019 were found to increase the polymeric proteins, %UPP, %LUPP and TotU for both S and HI nitrogen regimes (Figure 5A and Figure S1). The heat in 2018 significantly increased the amounts of large monomeric protein fraction, %LUMP for the S regime compared to the S and HI regimes in heat and drought in 2019 (Figure 5B). The significantly higher Mon/Pol ratio due to the applied nitrogen regimes was found only in 2019 for the S regime compared to the HI regime (Figure 5C). The total amount of extractable protein, TotE, representing protein concentration, was observed significantly higher in 2019 compared to 2018 (Figure 5D), further indicating the higher amounts in the HI regime compared to the S regime in 2018.
Genotype was the major factor affecting all the studied gluten protein parameters (Table 2). The gluten parameters %UPP, %LUPP and Mon/Pol and to minor extent %LUMP were the parameters dependent on the genotype, while no effect was observed for either climate conditions or nitrogen application. The effect of growing conditions was not significant on unextractable protein fractions either, whereas extractable protein fractions were affected by both nitrogen application and experimental year. Protein content was mostly impacted by the variation in climate conditions between the years. Nitrogen application had the greatest impact on yield, but no impact of year × nitrogen was observed (Table 2).

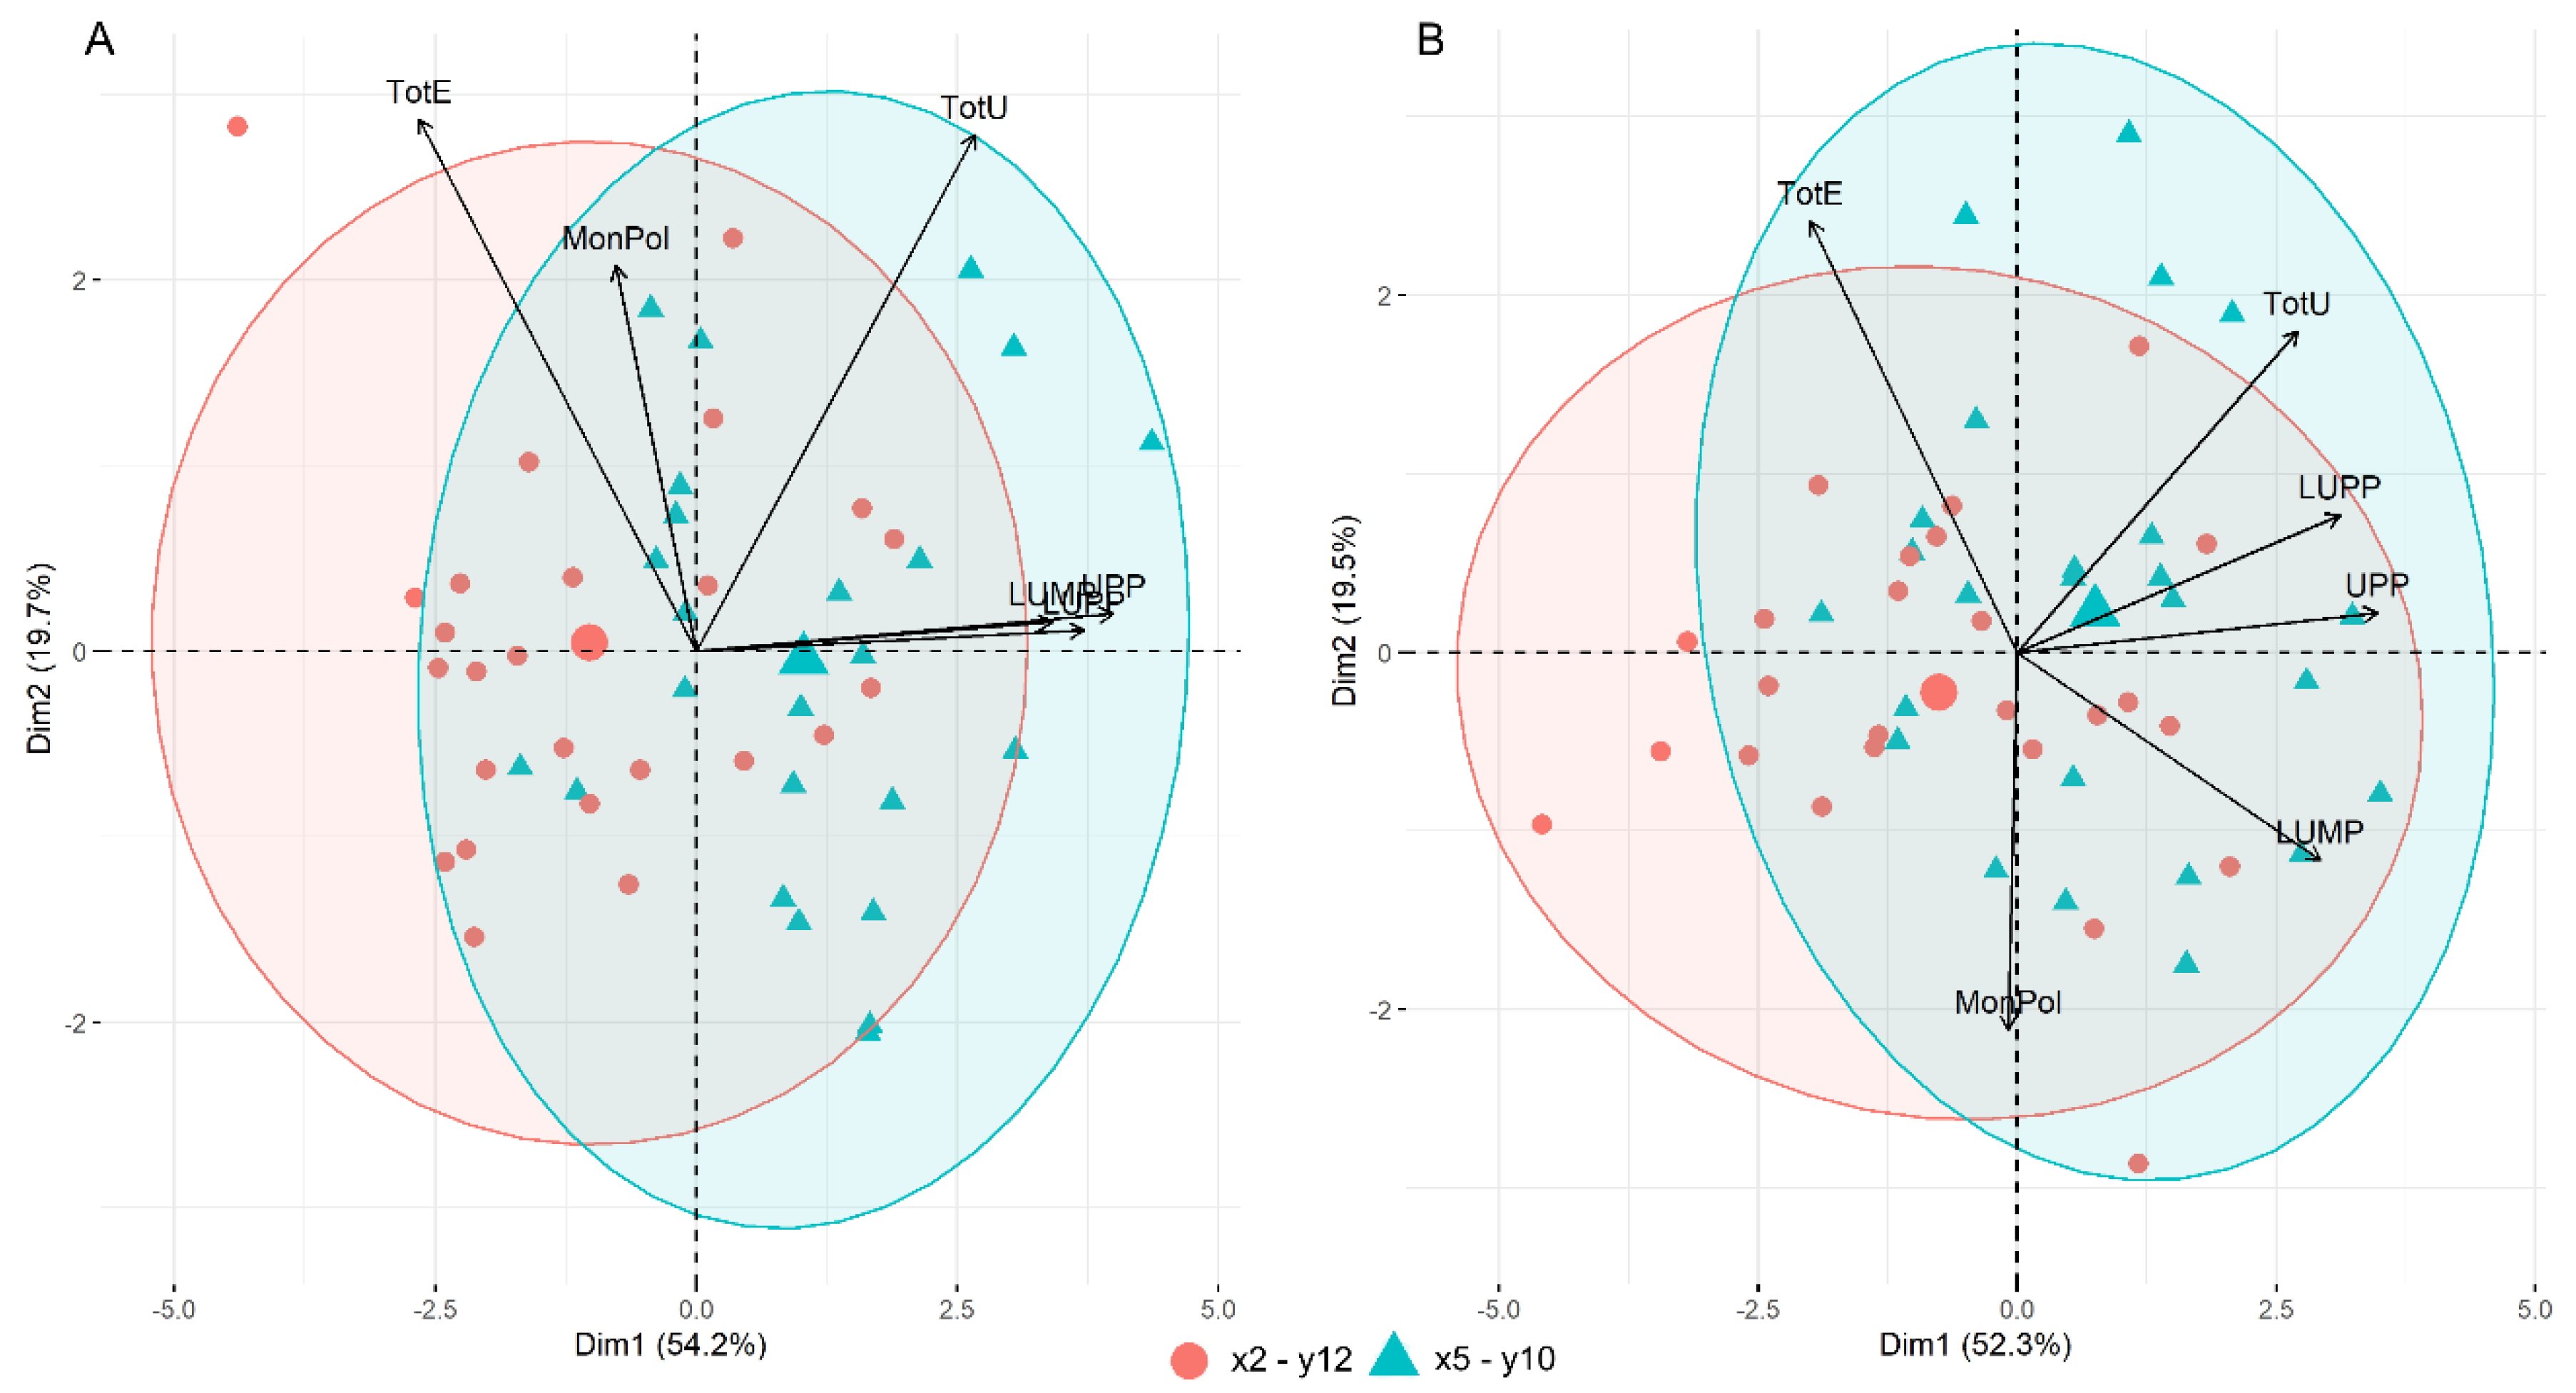
3.5. Gluten Protein Parameters and Genetic Composition of HMW-GS

Gluten protein composition studied by SE-HPLC and genetic composition genotypes were analyzed using principal component analysis (PCA) in order to compare the relationship (Figure 6). The first and the second principal components explained 74% (Figure 6A) and 72% (Figure 6B) of the variation. The first PCA component explained 54.2 and 52.3% of variation and was mainly determined by the polymeric protein content (%UPP and %LUPP), regardless of the varying climate (heat/drought vs. heat). The second PCA component explained 19.7 and 19.5% of the variation. TotE was the major contributor to the second PCA in both 2018 and 2019. TotU was a major contributor to the second PCA in the HI trial in 2019 (Figure S2).
The impact of glutenin subunit composition on the gluten protein parameters was compared between the studied genotypes. Glu-D1 x5-y10 and Glu-A1 x2 * alleles were found to have positive effects for polymeric protein fractions, %LUPP, %UPP and %uF1 (Table S2). The ratio of small polymeric proteins (%uF2) was not significantly different between Glu-D1 x5-y10 and x2-y12 genotypic groups. TotU was also higher in GluD1 x5-y10 group. However, the difference was significant only in the S trials in both years. The importance of Glu-D1 locus on gluten protein composition was also confirmed by the PCA results, genotypes containing the x5-y10 allele tended to have higher %LUPP, %UPP values in both years and fertilization trials.

4. Discussion

Predicted climate change and consequent crop yielding uncertainties raise concerns about future food security in Europe and the rest of the world [35]. Droughts will likely become more widespread and severe due to either a decrease in precipitation, an increase in temperatures, or a combination of both [6]. Winter wheat flowering and grain filling periods were negatively affected by the unusually high temperatures and lack of rainfall in both years of our experiment; however, the heat waves and dry spells were substantially worse in 2019, especially in June, which was one of the hottest on record [36,37]. Combined drought and heat stress are well known to have negative impacts on wheat yield and its grain quality components [38,39]. The effects of the weather conditions on nearly all investigated end-use quality traits during the two growing seasons were apparent in this experiment as well. High temperature and drought stress at the start of plant heading reduces yield potential [24], mainly by affecting floret fertility and thus reducing grain number per spike [40,41]. Heat stress during reproductive stages also negatively impacts the biomass partitioning of the wheat spikes, thus reducing potential grain weight [42]. Drought stress reduces stomatal conductance, leading to a decrease in the CO2 assimilation rate and subsequent low grain weight [43,44]. Both heat and drought strongly affect wheat photosynthetic parameters, and the combination of these two stresses have an interactive effect on the photochemical efficiency of the photosystem II and CO2 assimilation rates [44,45]. Drought and/or heat stress also shorten the duration of grain filling in wheat, disrupt the synthesis and accumulation of seed reserves and cause reduced grain weight [38,46]. Lower grain number, as well as reduced seed weight, most likely contributed to the yield losses in 2019 compared to 2018 due to higher temperatures during the heading and grain filling stages. Based on the ANOVA, the nitrogen application level was the crucial factor affecting grain yield, both the genotype and year of growing had far smaller albeit significant effects. The yield was mostly determined by the environment and management practices in other studies as well [47,48]. The rather low genotype and environment effects in this experiment could also be affected by the fact that the genotype set consisted of modern cultivars and advanced breeding lines with high-yield potential.
Wheat-yield quality is determined by the complex interaction between genotype and environmental factors, such as nitrogen supply, water availability and air temperatures during flowering and ripening. There is a well-known, negative correlation between protein content and grain yield, which was observed in this study as well. Environmental factors and fertilization rates have greater effects on the protein content than genotype. High nitrogen input tends to increase protein content [48,49,50] in wheat. However, in this study, contrasting results were obtained; higher nitrogen input increased protein content and sedimentation volume in 2018, but had the opposite effect on these traits in the hotter and dryer year of 2019. The level of drought stress after anthesis can have different effects on grain quality depending on the severity; moderate stress can increase protein content and sedimentation, whereas severe drought reduces them [51]. In our case, the more severe stress in 2019 increased protein content and sedimentation volume in both sustainable and high-input N treatments compared to respective treatments in 2018, but in 2019, the higher nitrogen application resulted in higher grain yield and lower end-use quality.
The quality of wheat grain largely depends on the quantity and polymerization of gluten proteins and the larger the polymers are, the stronger both the dough properties and the processing quality are [18,52]. There is a clear variation in wheat quality between winter and spring wheat, indicating spring wheat being superior in comparison to winter wheat and, as a result, having gluten polymers larger in size. Monomeric proteins are known to determine dough viscosity, while polymeric proteins determine its elasticity [18,53], and here we have the main differences between the spring and winter wheat types. It must be noted that in this study, genetics played a fundamental role for larger gluten quality parameters. The percentage of large polymeric gluten proteins (such as, %UPP and %LUPP), which determine the size of the polymer, and the percentage of large monomeric proteins (%LUMP) were also clearly impacted in the spring wheat in the study by Lama et al., although the varying climate was not a factor [24]. Large polymers are mainly glutenins, while large monomers include gliadins. It is interesting that the monomer to polymer ratio (Mon/Pol) was mostly impacted by the genotype, too, in this study, pointing out the winter wheat quality benefits due to temperature increase. As has been stressed in several studies, it is likely that winter wheat might replace spring wheat in northern Europe, including Lithuania, as has already been noted in some parts of China [54]. In this study, climate conditions, such as drought and heat stress, played an important role in 2019’s increased %LUPP and %UPP and decreased %LUMP, with no significant effect of nitrogen application within each year. The Mon/Pol ratio was unaffected by the fertilization under combined heat and water stress in 2019. The total amount of the extractable gluten protein fraction, TotE, representing protein concentration, was impacted more by the year than the genotype (Table 2), and a possible explanation is the TotE relation to protein concentration, which saw a dilution effect in this study. TotE took into account both environment and genetics effects, although the genetic effect was weakened. Large genotypic effects have been observed for the gliadin:glutenin ratio in other studies [55,56], and in this study the ratio observed for winter wheat is even stronger. Polymeric gluten protein, %UPP, was mainly affected by the environment of the durum wheat, but the effect depended on the earliness of the genotype [50], whereas in our study, the heading date did not correlate with the polymeric protein ratio. In other studies, the year was the more important factor than the cultivar in determining %UPP in Uruguayan wheat [57]. It is worth noting that in the latter study, the wheat plants were affected by the excessive water stress, whereas in our study plants experienced differing levels of heat and drought stresses in both years. Therefore, it is possible that these opposite environmental stressors affected the nitrogen assimilation and protein polymerization processes in a different manner. Various abiotic stresses significantly affected the total amounts of extractable and unextractable gluten protein fractions, but the monomer to polymer ratio seems to be mainly determined by the genotype [56,58]. Nitrogen application explained the highest proportion of %UPP variation at low temperatures, while genotype was the main factor at the high temperatures [59]. Dough strength and bread-making quality, which can be predicted by %UPP, are known to be positively associated with the x5-y10 allele at the Glu-D1 locus [60]. Genotypes carrying this allele showed higher %UPP and %LUPP regardless of the environment in our study as well. Differences in %UPP between these two genotypic groups, x5-y10 and x2-y12, was determined by the amount of large polymers only. These findings suggest that the breeding of winter wheat genotypes containing the Glu-D1 x5-y10 allele might help to achieve consistently high gluten strength under abiotic stresses.

5. Conclusions

The combined drought and heat stress in 2019 increased the bread-making quality by positively affecting formation of unextractable gluten polymers. The total protein content as well as the total amount of extractable proteins also increased due to drought and heat. The Mon/Pol ratio was unaffected by the fertilization under combined heat and water stress in 2019, possibly due to the lack of water during N fertilization moments. Generally, high nitrogen input did not significantly impact gluten characteristics, but in this study it was the main factor affecting yield, indicating that the balance must be found between the expected productivity and grain quality required by the end user. However, the genetic determinant of yielding capability under heat and/or drought stress was obvious in this study, and the yield of some genotypes was not impacted by the combined stresses in 2019. The genetic make-up of winter wheat cultivars or breeding lines was the main determinant of gluten protein quality components. The results suggest that predicted future climatic conditions, i.e., frequent drought and heat spells during the summer season, might not threaten wheat gluten quality, but attention should be paid in future breeding efforts to strive for drought and heat stress resistance. One such opportunity might be to explore biotechnological tools and search for sustainable agronomical practices.

Supplementary Materials

The following supporting information can be downloaded at: https://www.mdpi.com/article/10.3390/agronomy12061452/s1, Table S1: Winter wheat germplasm used in the study; Table S2: Effect of gluten subunit composition on the gluten protein parameters: large unextractable polymeric protein %LUPP, unextractable polymeric protein %UPP, large unextractable monomeric protein %LUMP content, ratio of total monomer to total polymer (Mon/Pol), ratio of each SDS-unextractable (%uF1–%uF4) and extractable (%eF1–%eF4) protein group in total protein content measured by SE-HPLC of winter wheat genotypic groups (mean ± sd) over 2018–2019. Number of genotypes indicated in parentheses. Means followed by the same letter are not significantly different (p < 0.05, Tukey HSD test); Figure S1: Gluten protein parameters of winter wheat studied in varying climates (heat and drought/heat) and nitrogen regimes of sustainable (S) and high-input (HI) trials in 2018–2019 investigated by SE-HPLC; % of large unextractable polymeric protein (%LUPP) (A), total unextractable protein content (TotU) (B). Means followed by the same letters are not significantly different (p < 0.05, Tukey HSD test, n = 50); Figure S2: Principal component analysis of winter wheat gluten protein parameters in high-input fertilization trials in 2018 (A) and 2019 (B).

Author Contributions

Conceptualization, G.S.; methodology, G.S.; data curation, G.S.; formal analysis, G.S.; investigation, G.S. and Ž.L.; resources, Ž.L. and R.K.; supervision, G.B. and R.K.; writing—original draft preparation, G.S.; writing—review and editing, R.A., Ž.L., K.J., J.C., G.B. and R.K.; funding acquisition, K.J., Ž.L., G.S., J.C., R.K. and G.B. All authors have read and agreed to the published version of the manuscript.

Funding

This study received funding from the European Regional Development Fund under a grant agreement with the Research Council of Lithuania (grant No. DOTSUT-218; 01.2.2-LMT-K-718-01-0065).

Data Availability Statement

Data sets analyzed during the current study are available from the authors on reasonable request.

Acknowledgments

We would like to express gratitude to Anders Ekholm and Maria Luisa Prieto-Linde for their guidance in SE-HPLC analysis. Vytautas Ruzgas is acknowledged for invaluable input in shaping research policy and promoting the smart specialisation programme, and Andrii Gorash is acknowledged for fruitful discussions. The Swedish governmental initiative SLU Grogrund-Centre for Breeding of Food Crops, Partnerskap Alnarp and Trees and Crops for the Future (TC4F) are acknowledged for financial support to R.K.

Conflicts of Interest

The authors declare no conflict of interest.

References

  1. Lithuanian Agriculture Facts & Figures. Semiannual Statistical Report. 2021. Volume 2. Available online: https://www.vic.lt/download/faktai-ir-skaiciai-2021-m-nr-2-28/ (accessed on 30 March 2022).
  2. Asseng, S.; Ewert, F.; Martre, P.; Rötter, R.P.; Lobell, D.B.; Cammarano, D.; Kimball, B.A.; Ottman, M.J.; Wall, G.W.; White, J.W.; et al. Rising Temperatures Reduce Global Wheat Production. Nat. Clim. Chang. 2015, 5, 143–147. [Google Scholar] [CrossRef]
  3. Ortiz, R.; Sayre, K.D.; Govaerts, B.; Gupta, R.; Subbarao, G.V.; Ban, T.; Hodson, D.; Dixon, J.M.; Iván Ortiz-Monasterio, J.; Reynolds, M. Climate Change: Can Wheat Beat the Heat? Agric. Ecosyst. Environ. 2008, 126, 46–58. [Google Scholar] [CrossRef]
  4. Le Gouis, J.; Oury, F.X.; Charmet, G. How Changes in Climate and Agricultural Practices Influenced Wheat Production in Western Europe. J. Cereal Sci. 2020, 93, 102960. [Google Scholar] [CrossRef]
  5. Trnka, M.; Hlavinka, P.; Semenov, M.A. Adaptation Options for Wheat in Europe Will Be Limited by Increased Adverse Weather Events under Climate Change. J. R. Soc. Interface 2015, 12, 20150721. [Google Scholar] [CrossRef] [PubMed] [Green Version]
  6. Dai, A. Increasing Drought under Global Warming in Observations and Models. Nat. Clim. Chang. 2013, 3, 52–58. [Google Scholar] [CrossRef]
  7. Yadav, M.R.; Choudhary, M.; Singh, J.; Lal, M.K.; Jha, P.K.; Udawat, P.; Gupta, N.K.; Rajput, V.D.; Garg, N.K.; Maheshwari, C.; et al. Impacts, Tolerance, Adaptation, and Mitigation of Heat Stress on Wheat under Changing Climates. Int. J. Mol. Sci. 2022, 23, 2838. [Google Scholar] [CrossRef]
  8. Islam, M.; Begum, M.C.; Kabir, A.H.; Alam, M.F. Molecular and Biochemical Mechanisms Associated with Differential Responses to Drought Tolerance in Wheat (Triticum aestivum L.). J. Plant Interact. 2015, 10, 195–201. [Google Scholar] [CrossRef]
  9. Gregorová, Z.; Kováčik, J.; Klejdus, B.; Maglovski, M.; Kuna, R.; Hauptvogel, P.; Matušíková, I. Drought-Induced Responses of Physiology, Metabolites, and PR Proteins in Triticum aestivum. J. Agric. Food Chem. 2015, 63, 8125–8133. [Google Scholar] [CrossRef]
  10. Itam, M.; Mega, R.; Tadano, S.; Abdelrahman, M.; Matsunaga, S.; Yamasaki, Y.; Akashi, K.; Tsujimoto, H. Metabolic and Physiological Responses to Progressive Drought Stress in Bread Wheat. Sci. Rep. 2020, 10, 17189. [Google Scholar] [CrossRef] [PubMed]
  11. Lawas, L.M.F.; Zuther, E.; Jagadish, S.K.; Hincha, D.K. Molecular Mechanisms of Combined Heat and Drought Stress Resilience in Cereals. Curr. Opin. Plant Biol. 2018, 45, 212–217. [Google Scholar] [CrossRef]
  12. Senapati, N.; Stratonovitch, P.; Paul, M.J.; Semenov, M.A. Drought Tolerance during Reproductive Development Is Important for Increasing Wheat Yield Potential under Climate Change in Europe. J. Exp. Bot. 2019, 70, 2549–2560. [Google Scholar] [CrossRef] [PubMed] [Green Version]
  13. Butterbach-Bahl, K.; Baggs, E.M.; Dannenmann, M.; Kiese, R.; Zechmeister-Boltenstern, S. Nitrous Oxide Emissions from Soils: How Well Do We Understand the Processes and Their Controls? Philos. Trans. R. Soc. B Biol. Sci. 2013, 368, 20130122. [Google Scholar] [CrossRef]
  14. Zörb, C.; Ludewig, U.; Hawkesford, M.J. Perspective on Wheat Yield and Quality with Reduced Nitrogen Supply. Trends Plant Sci. 2018, 23, 1029–1037. [Google Scholar] [CrossRef] [PubMed] [Green Version]
  15. Laidig, F.; Piepho, H.P.; Rentel, D.; Drobek, T.; Meyer, U.; Huesken, A. Breeding Progress, Environmental Variation and Correlation of Winter Wheat Yield and Quality Traits in German Official Variety Trials and on-Farm during 1983–2014. Theor. Appl. Genet. 2017, 130, 223–245. [Google Scholar] [CrossRef] [PubMed] [Green Version]
  16. Guzmán, C.; Autrique, E.; Mondal, S.; Huerta-Espino, J.; Singh, R.P.; Vargas, M.; Crossa, J.; Amaya, A.; Peña, R.J. Genetic Improvement of Grain Quality Traits for CIMMYT Semi-Dwarf Spring Bread Wheat Varieties Developed during 1965–2015: 50 Years of Breeding. Field Crops Res. 2017, 210, 192–196. [Google Scholar] [CrossRef]
  17. Nehe, A.; Akin, B.; Sanal, T.; Evlice, A.K.; Ünsal, R.; Dinçer, N.; Demir, L.; Geren, H.; Sevim, I.; Orhan, Ş.; et al. Genotype x Environment Interaction and Genetic Gain for Grain Yield and Grain Quality Traits in Turkish Spring Wheat Released between 1964 and 2010. PLoS ONE 2019, 14, e0219432. [Google Scholar] [CrossRef] [Green Version]
  18. Rasheed, A.; Xia, X.; Yan, Y.; Appels, R.; Mahmood, T.; He, Z. Wheat Seed Storage Proteins: Advances in Molecular Genetics, Diversity and Breeding Applications. J. Cereal Sci. 2014, 60, 11–24. [Google Scholar] [CrossRef] [Green Version]
  19. Rasheed, F.; Plivelic, T.S.; Kuktaite, R.; Hedenqvist, M.S.; Johansson, E. Unraveling the Structural Puzzle of the Giant Glutenin Polymer—An Interplay between Protein Polymerization, Nanomorphology, and Functional Properties in Bioplastic Films. ACS Omega 2018, 3, 5584–5592. [Google Scholar] [CrossRef]
  20. Branlard, G.; Dardevet, M.; Saccomano, R.; Lagoutte, F.; Gourdon, J. Genetic Diversity of Wheat Storage Proteins and Bread Wheat Quality. Euphytica 2001, 119, 59–67. [Google Scholar] [CrossRef]
  21. Dhaka, V.; Khatkar, B.S. Effects of Gliadin/Glutenin and HMW-GS/LMW-GS Ratio on Dough Rheological Properties and Bread-Making Potential of Wheat Varieties. J. Food Qual. 2015, 38, 71–82. [Google Scholar] [CrossRef]
  22. Hussain, A.; Larsson, H.; Kuktaite, R.; Prieto-Linde, M.L.; Johansson, E. Towards the Understanding of Bread-Making Quality in Organically Grown Wheat: Dough Mixing Behaviour, Protein Polymerisation and Structural Properties. J. Cereal Sci. 2012, 56, 659–666. [Google Scholar] [CrossRef]
  23. Ceresino, E.B.; Kuktaite, R.; Hedenqvist, M.S.; Sato, H.H.; Johansson, E. Processing Conditions and Transglutaminase Sources to “Drive” the Wheat Gluten Dough Quality. Innov. Food Sci. Emerg. Technol. 2020, 65, 102439. [Google Scholar] [CrossRef]
  24. Lama, S.; Vallenback, P.; Hall, S.A.; Kuzmenkova, M.; Kuktaite, R. Prolonged Heat and Drought versus Cool Climate on the Swedish Spring Wheat Breeding Lines: Impact on the Gluten Protein Quality and Grain Microstructure. Food Energy Secur. 2022, 11, e376. [Google Scholar] [CrossRef]
  25. Lafiandra, D.; Tucci, G.F.; Pavoni, A.; Turchetta, T.; Margiotta, B. PCR Analysis of X- and y-Type Genes Present at the Complex Glu-A1 Locus in Durum and Bread Wheat. Theor. Appl. Genet. 1997, 94, 235–240. [Google Scholar] [CrossRef]
  26. Ma, W.; Zhang, W.; Gale, K.R. Multiplex-PCR Typing of High Molecular Weight Glutenin Alleles in Wheat. Euphytica 2003, 134, 51–60. [Google Scholar] [CrossRef]
  27. De Bustos, A.; Rubio, P.; Jouve, N. Molecular Characterisation of the Inactive Allele of the Gene Glu-A1 and the Development of a Set of AS-PCR Markers for HMW Glutenins of Wheat. Theor. Appl. Genet. 2000, 100, 1085–1094. [Google Scholar] [CrossRef]
  28. Ishikawa, G.; Nakamura, T. A New Co-Dominant PCR-Based Marker to Identify the High-Molecular-Weight Glutenin Subunit Combination. Wheat Inf. Servise 2007, 103, 1–4. [Google Scholar]
  29. Smith, R.L.; Schweder, M.E.; Barnett, R.D. Identification of Glutenin Alleles in Wheat and Triticale Using PCR-Generated DNA Markers. Crop Sci. 1994, 34, 1373–1378. [Google Scholar] [CrossRef]
  30. R Core Team. A Language and Environment for Statistical Computing; R Foundation for Statistical Computing: Vienna, Austria, 2020; Available online: https://www.R-project.org/ (accessed on 22 June 2020).
  31. Olivoto, T.; Lúcio, A.D.C. Metan: An R Package for Multi-Environment Trial Analysis. Methods Ecol. Evol. 2020, 2020, 783–789. [Google Scholar] [CrossRef]
  32. Lüdecke, D. Sjstats: Statistical Functions for Regression Models (Version 0.18.0). 2020. Available online: https://zenodo.org/record/1489175#.YqvmLOxBzIU (accessed on 20 May 2020). [CrossRef]
  33. de Mendiburu, F.; Yaseen, M. Agricolae: Statistical Procedures for Agricultural Research 2020. Available online: https://cran.r-project.org/package=agricolae (accessed on 20 May 2020).
  34. Lê, S.; Josse, J.; Husson, F. FactoMineR: An R Package for Multivariate Analysis. J. Stat. Softw. 2008, 25, 1–18. [Google Scholar] [CrossRef] [Green Version]
  35. Challinor, A.J.; Watson, J.; Lobell, D.B.; Howden, S.M.; Smith, D.R.; Chhetri, N. A Meta-Analysis of Crop Yield under Climate Change and Adaptation. Nat. Clim. Chang. 2014, 4, 287–291. [Google Scholar] [CrossRef]
  36. Baruth, B.; Bassu, S.; Bussay, A.; Cerrani, I.; Chemin, Y.; De Palma, P.; Fumagalli, D.; Lecerf, R.; Manfron, G.; Nisini Scacchiafichi, L.; et al. JRC MARS Bulletin—Crop Monitoring in Europe; Van Den Berg, M., Baruth, B., Niemeyer, S., Chemin, Y., Eds.; Publications Office of the European Union: Luxembourg, 2019; Volume 27, p. 44. [Google Scholar]
  37. Bussay, A.; Bassu, S.; Ceglar, A.; Cerrani, I.; Garcia Condado, S.; Lecerf, R.; Lopez Lozano, R.; Manfron, G.; Nisini Scacchiafichi, L.; Panarello, L.; et al. JRC MARS Bulletin—Crop Monitoring in Europe; Van Den Berg, M., Baruth, B., Van Der Velde, M., Niemeyer, S., Eds.; Publications Office of the European Union: Luxembourg, 2018; Volume 26, p. 48. [Google Scholar]
  38. Farooq, M.; Hussain, M.; Siddique, K.H.M. Drought Stress in Wheat during Flowering and Grain-Filling Periods. CRC. Crit. Rev. Plant Sci. 2014, 33, 331–349. [Google Scholar] [CrossRef]
  39. Balla, K.; Rakszegi, M.; Li, Z.; Békés, F.; Bencze, S.; Veisz, O. Quality of Winter Wheat in Relation to Heat and Drought Shock after Anthesis. Czech J. Food Sci. 2011, 29, 117–128. [Google Scholar] [CrossRef] [Green Version]
  40. Prasad, P.V.V.; Djanaguiraman, M. Response of Floret Fertility and Individual Grain Weight of Wheat to High Temperature Stress: Sensitive Stages and Thresholds for Temperature and Duration. Funct. Plant Biol. 2014, 41, 1261–1269. [Google Scholar] [CrossRef] [Green Version]
  41. Onyemaobi, I.; Liu, H.; Siddique, K.H.M.; Yan, G. Both Male and Female Malfunction Contributes to Yield Reduction under Water Stress during Meiosis in Bread Wheat. Front. Plant Sci. 2017, 7, 2071. [Google Scholar] [CrossRef] [Green Version]
  42. Liu, B.; Liu, L.; Asseng, S.; Zhang, D.; Ma, W.; Tang, L.; Cao, W.; Zhu, Y. Modelling the Effects of Post-Heading Heat Stress on Biomass Partitioning, and Grain Number and Weight of Wheat. J. Exp. Bot. 2020, 71, 6015–6031. [Google Scholar] [CrossRef]
  43. Wasaya, A.; Manzoor, S.; Yasir, T.A.; Sarwar, N.; Mubeen, K.; Ismail, I.A.; Raza, A.; Rehman, A.; Hossain, A.; Sabagh, A.E.L. Evaluation of Fourteen Bread Wheat (Triticum aestivum L.) Genotypes by Observing Gas Exchange Parameters, Relative Water and Chlorophyll Content, and Yield Attributes under Drought Stress. Sustainability 2021, 13, 4799. [Google Scholar] [CrossRef]
  44. Urban, O.; Hlaváčová, M.; Klem, K.; Novotná, K.; Rapantová, B.; Smutná, P.; Horáková, V.; Hlavinka, P.; Škarpa, P.; Trnka, M. Combined Effects of Drought and High Temperature on Photosynthetic Characteristics in Four Winter Wheat Genotypes. Field Crops Res. 2018, 223, 137–149. [Google Scholar] [CrossRef]
  45. Hlaváčová, M.; Klem, K.; Rapantová, B.; Novotná, K.; Urban, O.; Hlavinka, P.; Smutná, P.; Horáková, V.; Škarpa, P.; Pohanková, E.; et al. Interactive Effects of High Temperature and Drought Stress during Stem Elongation, Anthesis and Early Grain Filling on the Yield Formation and Photosynthesis of Winter Wheat. Field Crops Res. 2018, 221, 182–195. [Google Scholar] [CrossRef]
  46. Sehgal, A.; Sita, K.; Siddique, K.H.M.; Kumar, R.; Bhogireddy, S.; Varshney, R.K.; HanumanthaRao, B.; Nair, R.M.; Prasad, P.V.V.; Nayyar, H. Drought or/and Heat-Stress Effects on Seed Filling in Food Crops: Impacts on Functional Biochemistry, Seed Yields, and Nutritional Quality. Front. Plant Sci. 2018, 9, 1705. [Google Scholar] [CrossRef] [PubMed] [Green Version]
  47. Qaseem, M.F.; Qureshi, R.; Shaheen, H. Effects of Pre-Anthesis Drought, Heat and Their Combination on the Growth, Yield and Physiology of Diverse Wheat (Triticum aestivum L.) Genotypes Varying in Sensitivity to Heat and Drought Stress. Sci. Rep. 2019, 9, 6955. [Google Scholar] [CrossRef] [PubMed] [Green Version]
  48. Rozbicki, J.; Ceglińska, A.; Gozdowski, D.; Jakubczak, M.; Cacak-Pietrzak, G.; Madry, W.; Golba, J.; Piechociński, M.; Sobczyński, G.; Studnicki, M.; et al. Influence of the Cultivar, Environment and Management on the Grain Yield and Bread-Making Quality in Winter Wheat. J. Cereal Sci. 2015, 61, 126–132. [Google Scholar] [CrossRef]
  49. Šíp, V.; Vavera, R.; Chrpová, J.; Kusá, H.; Růžek, P. Winter Wheat Yield and Quality Related to Tillage Practice, Input Level and Environmental Conditions. Soil Tillage Res. 2013, 132, 77–85. [Google Scholar] [CrossRef]
  50. Gagliardi, A.; Carucci, F.; Masci, S.; Flagella, Z.; Gatta, G.; Giuliani, M.M. Effects of Genotype, Growing Season and Nitrogen Level on Gluten Protein Assembly of Durum Wheat Grown under Mediterranean Conditions. Agronomy 2020, 10, 755. [Google Scholar] [CrossRef]
  51. Ozturk, A.; Erdem, E.; Aydin, M.; Karaoglu, M.M. The Effects of Drought after Anthesis on the Grain Quality of Bread Wheat Depend on Drought Severity and Drought Resistance of the Variety. Cereal Res. Commun. 2022, 50, 105–116. [Google Scholar] [CrossRef]
  52. Malalgoda, M.; Ohm, J.B.; Meinhardt, S.; Simsek, S. Association between Gluten Protein Composition and Breadmaking Quality Characteristics in Historical and Modern Spring Wheat. Cereal Chem. 2018, 95, 226–238. [Google Scholar] [CrossRef]
  53. Anjum, F.M.; Khan, M.R.; Din, A.; Saeed, M.; Pasha, I.; Arshad, M.U. Wheat Gluten: High Molecular Weight Glutenin Subunits—Structure, Genetics, and Relation to Dough Elasticity. J. Food Sci. 2007, 72, R56–R63. [Google Scholar] [CrossRef]
  54. He, Z.; Joshi, A.K.; Zhang, W. Climate Vulnerabilities and Wheat Production. In Climate Vulnerability; Pielke, R.A.B.T.-C.V., Ed.; Academic Press: Oxford, UK, 2013; pp. 57–67. ISBN 978-0-12-384704-1. [Google Scholar]
  55. Thungo, Z.; Shimelis, H.; Odindo, A.; Mashilo, J. Genotype-by-Environment Effects on Grain Quality among Heat and Drought Tolerant Bread Wheat (Triticum aestivum L.) Genotypes. J. Plant Interact. 2020, 15, 83–92. [Google Scholar] [CrossRef] [Green Version]
  56. Tomás, D.; Viegas, W.; Silva, M. Effects of Post-Anthesis Heat Waves on the Grain Quality of Seven European Wheat Varieties. Agronomy 2020, 10, 268. [Google Scholar] [CrossRef] [Green Version]
  57. Vazquez, D.; Berger, A.; Prieto-Linde, M.L.; Johansson, E. Can Nitrogen Fertilization Be Used to Modulate Yield, Protein Content and Bread-Making Quality in Uruguayan Wheat? J. Cereal Sci. 2019, 85, 153–161. [Google Scholar] [CrossRef]
  58. Labuschagne, M.T.; Moloi, J.; van Biljon, A. Abiotic Stress Induced Changes in Protein Quality and Quantity of Two Bread Wheat Cultivars. J. Cereal Sci. 2016, 69, 259–263. [Google Scholar] [CrossRef]
  59. Malik, A.H.; Kuktaite, R.; Johansson, E. Combined Effect of Genetic and Environmental Factors on the Accumulation of Proteins in the Wheat Grain and Their Relationship to Bread-Making Quality. J. Cereal Sci. 2013, 57, 170–174. [Google Scholar] [CrossRef]
  60. He, Z.H.; Liu, L.; Xia, X.C.; Liu, J.J.; Peña, R.J. Composition of HMW and LMW Glutenin Subunits and Their Effects on Dough Properties, Pan Bread, and Noodle Quality of Chinese Bread Wheats. Cereal Chem. 2005, 82, 345–350. [Google Scholar] [CrossRef]
Figure 1. Average daily temperatures during growing seasons of 2017–2018 (A) and 2018–2019 (B) at the experimental site (Dotnuva meteorological station, Lithuania). Positive deviations from long-term average (1981–2010) are highlighted in light red, negative are highlighted in light blue.
Agronomy 12 01452 g001
Figure 2. Average daily temperatures during growing seasons of 2017–2018 (A) and 2018–2019. Daily and cumulated precipitation at the experimental site (Dotnuva meteorological station, Lithuania) from 1st March to 31st July of 2018 (A) and 2019 (B).
Agronomy 12 01452 g002
Figure 3. Winter wheat yield (A) and test weight (B) in sustainable (S) and high-input (HI) trials in 2018–2019. Means followed by the same letters are not significantly different (p < 0.05, Tukey HSD test, n = 50).
Agronomy 12 01452 g003
Figure 4. Winter wheat protein content (%) (A), starch content (%) (B) and sedimentation volume (ml) (C) of sustainable (S) and high-input (HI) trials in 2018–2019. Means followed by the same letters are not significantly different (p < 0.05, Tukey HSD test, n = 50).
Agronomy 12 01452 g004
Figure 5. Gluten protein parameters of winter wheat studied in varying climates (heat and drought-heat) and nitrogen regimes of sustainable (S) and high-input (HI) trials in 2018–2019 investigated by SE-HPLC; unextractable polymeric protein (%UPP) (A); % large unextractable monomeric protein (%LUMP) (B); total monomer to total polymer ratio (Mon/Pol) (C); and total extractable protein content (TotE) (D). Means followed by the same letters are not significantly different (p < 0.05, Tukey HSD test, n = 50).
Agronomy 12 01452 g005
Figure 6. Principal component analysis of winter wheat gluten protein parameters in sustainable fertilization trials in 2018 (A) and 2019 (B).
Agronomy 12 01452 g006
Table 1. PCR primers used for the amplification of specific HMW-Glu genes.
LocusGene/AlleleProduct Size (bp)Reference
Glu-A1Ax null920Lafiandra et al. [25]
Ax1 or Ax2 *1500 or 1400Lafiandra et al. [25]
Ax2 *1319 Ma et al. [26]
Ax2 *2650De Bustos et al. [27]
Glu-D1Dx5478Ma et al. [26]
Dx5-y10343 + 320, other alleles 361Ishikawa and Nakamura [28]
Dy10 or Dy12576 or 612Smith et al. [29]
Table 2. ANOVA effect size (ω²) of genotype, year and nitrogen fertilizations on the winter wheat yield and quality traits. n.s.—not significant.
VariableGenotypeYearNitrogenYear × Nitrogen
Yield0.060.020.63n.s.
Test weight0.220.230.21n.s.
Protein content0.300.57n.s.0.03
Starch content0.570.22n.s.0.02
Sedimentation volume0.400.34n.s.0.07
%UPP0.740.040.01n.s.
%LUPP0.710.04n.sn.s.
%LUMP0.590.020.02n.s.
Mon/Pol ratio0.810.030.010.01
TotU0.420.34n.s.0.01
TotE0.470.370.010.01
Publisher’s Note: MDPI stays neutral with regard to jurisdictional claims in published maps and institutional affiliations.

