Article

Mixture Composition Influenced the Biomass Yield and Nutritional Quality of Legume–Grass Pastures

1
College of Grassland Science and Technology, Sichuan Agricultural University, Chengdu 611130, China
2
College of Agronomy, Sichuan Agricultural University, Chengdu 611130, China
*
Author to whom correspondence should be addressed.
Agronomy 2022, 12(6), 1449; https://doi.org/10.3390/agronomy12061449
Submission received: 16 April 2022 / Revised: 3 June 2022 / Accepted: 13 June 2022 / Published: 17 June 2022

Abstract

:
A two-year field experiment was conducted to address the effects of mixture composition and legume-grass seeding ratio on the biomass yield and nutritional quality of legume–grass mixtures. Alfalfa (Medicago sativa L.), white clover (Trifolium repens L.), red clover (Trifolium pratense L.), orchardgrass (Dactylis glomerata L.), perennial ryegrass (Lolium perenne L.), and tall fescue (Festuca arundinacea Schreb.) were selected as plant materials. A total of seven legume–grass mixtures (A1: white clover, orchardgrass, and tall fescue; A2: alfalfa, orchardgrass, and tall fescue; B1: alfalfa, white clover, orchardgrass, and tall fescue; B2: red clover, white clover, orchardgrass, and tall fescue; C1: alfalfa, white clover, orchardgrass, tall fescue, and perennial ryegrass; C2: red clover, white clover, orchardgrass, tall fescue, and perennial ryegrass; and D: alfalfa, red clover, white clover, orchardgrass, tall fescue, and perennial ryegrass) were sown in two legume-grass seeding ratios (L:G) of 4:6 and 5:5. The results showed that A2 produced a higher two-year average biomass yield (14.20 t/ha) in L:G of 4:6 than that of other mixtures. The grasses biomass yield proportion decreased while legume biomass yield proportion increased with prolonged establishment time. A2 showed a higher crude protein yield (2.5 t/ha) in L:G of 4:6. C2 and A1 showed lower neutral detergent fiber (4.6 t/ha) and acid detergent fiber (2.8 t/ha) yields in L:G 5:5, while diverse mixtures showed higher water-soluble carbohydrate yields. Overall, A2 showed a relative feed value of 146.50 in L:G of 4:6, indicating that it has not only produced the higher biomass yield but also had a better nutritional quality.

1. Introduction

Multispecies mixture cultivation for forage production recently emerged as an attractive alternative to growing species in monocultures [1,2] because plant species diversity has a positive interaction with biomass production [3]. Moreover, numerous studies have reported that increasing species diversity could improve nutrient use, stabilize biomass production and suprress weeds [4,5]. Species diversity offers complementarity, insurance and sampling effects which are key drivers for enhancing the biomass yield and stability of the mixstures [6,7,8]. The complementarity effect is a positive interaction between different species or better efficiency in acquiring available resources; for example, legumes fix atmospheric nitrogen from which other species also benefit, particularly in legume–grass mixtures [9]. The sampling effect is based on the greater possibility that a mixture comprises high-performing species, which also become dominant. Increased species diversity offers an insurance effect in which mixtures with more species guarantee that some species continue functioning when others fail [6]. However, many studies also reported that increasing the number of species in the mixture has no clear advantages in terms of biomass production or stability [10,11]. A multiyear and multisite study showed that mixtures consisting of four legume and grass species indicated overyielding and transgressive overyielding effects and about 70% of the yield was site-dependent [2]. Therefore, factors such as mixture composition, geography, climate, and soil conditions play a key role in defining the species diversity and productivity relationship as various patterns of relationships have emerged worldwide such as hump-shaped, monotonic, and non-significant monotonic, or hump-shaped relationships [12,13,14,15].
Apart from yield benefits, forage quality has great importance for practical farming. The amount of biomass and energy contents increased with properly conducted agricultural managements and practices [16]. The plant species diversity can also influence the quality of biomass yields. However, the results of studies concerning the effects of plant diversity on forage nutritional quality are ambiguous and the effects were often reported to be small [17,18,19]. Large effects of species diversity on nutritional quality were only reported when mixtures composed of one to four species provided that legumes are combined with grasses [2,20,21]. Executing such moderate increases in species diversity could be considered as a ‘ready to use’ approach for sustainable intensification. However, the species diversity effect on biomass yield and the forage quality of mixtures from other management practices such as mixture composition still needs to be illuminated. Therefore, a generic strategy to improve the efficiency of multispecies mixtures is to select the best adaptable species in mixtures according to the local climate.
Appropriate species selection for a balanced multispecies mixture is crucial to cope with blank and unproductive gaps [22]. The cultivation of multispecies mixtures especially legume–grass pastures has surged dramatically for dairy farms because they provide higher stable biomass yields, balanced feedstock for animals, and improve soil fertility [2,23], along with their renewed interest in sustainable agriculture [24]. The legume component of the mixture improves the pasture soil carbon sink, increases protein self-sufficiency, and decreases fertilizer consumption through biological nitrogen fixation [9,25]. The grass component in the mixture contributes to total biomass yield and reduces weeds encroachment, legume lodging, and the possibility of bloating [26]. The most common legumes for forage production are alfalfa (Medicago sativa L.), white clover (Trifolium repens L.), and red clover (Trifolium pratense L.), while those of grasses are orchardgrass (Dactylis glomerata L.), tall fescue (Festuca arundinacea Schreb.), and perennial ryegrass (Lolium perenne L.). Alfalfa is a drought-tolerant and high-quality forage legume compatible with perennial grasses, enhances dietary protein supply for livestock and improves pasture soil health [27]. Clovers are short-lived and readily re-establish from seed and produce less biomass than alfalfa in mixtures but can transfer high amounts of nitrogen to companion grasses [28]. Orchardgrass, tall fescue, and perennial ryegrass show high forage biomass yield, fast re-growth, and winter hardiness. A previous study reported that alfalfa–grass mixtures produce greater forage yield and nutritional value compared to others [29]. Similarly, another study reported that mixtures of alfalfa, sainfoin, orchardgrass, and tall fescue showed better interspecific interactions and contribute to the higher biomass yield [30]. However, little is known about the legume–grass mixtures consisting of the abovementioned legumes and grasses from well-defined species diversity gradient for forage production and forage quality.
For the formulation of seed mixtures, knowledge related to the effects of species seeding proportions on the mixture production and nutritional quality will be useful information for farmers. A previous study reported that the effect of varying species proportions is dependent on the dominant species in the mixture [31], while another study reported that it is also dependent on the proportion of the legumes in the mixture [32]. In a multilocation (28 sites) study across Europe, herbage production of the legume-grass mixtures (two grasses and two legumes) increased as the proportions of the species in mixture became more equal [20]. Moreover, another study established that the mixture with more equal proportions of species in the seed mixture did not have more biomass yield than that of other mixtures [33]. This study further concluded that the presence of 30–40% seeding rate of legume in a mixture would achieve a higher biomass yield and better nutritional quality. However, the effects of the legume-grass seeding ratio on the biomass yield and nutritional quality of mixtures from well-defined species diversity are not well established.
Consequently, the current study investigated the effects of mixture composition and legume-grass seeding ratio on the biomass yield and nutritional quality of legume–grass mixtures from a well-defined plant species diversity gradient.

2. Materials and Methods

2.1. Experimental Site and Plant Material

A field experiment was conducted from September 2017 to June 2019 at the experimental area of Chongzhou Research Station, Sichuan Agricultural University, China (103°07′ E, 30°30′ N). The legumes components included alfalfa (Xibuzhixing), white clover (Ladi-no) and red clover (Duoli), while that of grasses components included orchardgrass (Anba), tall fescue (Meishijia), and perennial ryegrass (Kaidi) to compose the different legume–grass mixtures.

2.2. Soil Characteristics and Weather Description

The soil in the upper 20 cm of the experimental field is purple clay loam with uniform fertility and has the following properties: pH: 6.30; organic matter: 37.6 g/kg; alkali hydrolyzed nitrogen: 135.7 mg/kg; total nitrogen: 1.81 g/kg; available phosphorous: 10.2 mg/kg; available potassium: 101.1 mg/kg. The climate of the experimental site is subtropical monsoon humid with an annual average temperature of 15.9 °C, rainfall of 1012.4 mm, and sunlight hours of 1161.5 h. The average temperatures (°C) during the mixtures growing season were as follows: autumn 2017 vs. autumn 2018 (20.09 and 19.47), winter 2018 vs. winter 2019 (8.40 and 7.82), spring 2018 vs. spring 2019 (16.95 and 16.15), and summer 2018 vs. summer 2019 (22.60 and 23.29). However, the sum of rainfalls (mm) during growing season was as follows: autumn 2017 vs. autumn 2018 (190.00 and 146.00), winter 2018 vs. winter 2019 (19.50 and 33.80), spring 2018 vs. spring 2019 (95.10, 72.20), and summer 2018 vs. summer 2019 (799.50 and 479.20). The average monthly temperature (°C) and rainfall (mm) of the experimental site from the year 2017 to 2019 are shown in Table 1. The temperature and rainfall data were collected from Chongzhou Meteorological Bureau.

2.3. Experimental Design and Field Management

The experiment was laid out in a randomized complete block design (RCBD) with three biological repeats in a split-plot arrangement. A total of seven legume–grass mixtures (with different species composition and diversity) were grown in a net plot size of 5 m × 3 m on 15 September 2017 in two legume-grass seeding ratios. Considering the landform of experimental field, the main plots were treated with legume–grass mixtures (A1: white clover, orchardgrass, and tall fescue; A2: alfalfa, orchardgrass, and tall fescue; B1: alfalfa, white clover, orchardgrass, and tall fescue; B2: red clover, white clover, orchardgrass, and tall fescue; C1: alfalfa, white clover, orchardgrass, tall fescue, and perennial ryegrass; C2: red clover, white clover, orchardgrass, tall fescue, and perennial ryegrass; and D: alfalfa, red clover, white clover, orchardgrass, tall fescue, and perennial ryegrass). The subplots were treated with legume-grass seeding ratios (L:G) of 5:5 and 4:6. Seeding rates used for pure stands of alfalfa, white clover, red clover, orchardgrass, tall fescue, and perennial ryegrass were 22.50, 7.5, 15, 15, 37.50, and 18 kg/ha, respectively. Seeding rates of different legume and grass species in the mixture for legume-grass seeding ratios of 5:5 and 4:6 were calculated using the following formula:
Seeding rate of specie in mixture = Single planting seeding density × Mixed seeding ratio
The seeding rates of selected species for mixtures are shown in Table 2. If a mixture contains two or more than two legumes or grasses then their respective seeding ratio was adjusted to 1:1. For example, mixture A1 contains two grasses, the seeding rate of each grass specie was equally divided. Basal dose of nitrogen, phosphorus, and potassium fertilizers was applied at the rate of 47, 24, and 40 kg/ha, respectively. The first, second, and third cuts of biomass production were performed on 24 March, 6 May, and 23 July in 2018 and 21 March, 1 May, and 15 July in 2019.

2.4. Sampling and Measurement

2.4.1. Sampling and Measurement

Soil samples from 20 cm depth were collected randomly from the experimental site prior to the sowing of mixtures. From each replication, several subsamples were taken and then bulked into one sample. Soil samples stored in cloth bags were air-dried at room temperature to a constant weight. The roots, stones, and other debris in the soil samples were removed. Then, soil samples were passed through 0.149 mm and 2 mm sieves, respectively, and stored in the laboratory until analysis. The pH was measured in a 1/5 (w/v) aqueous extract using a pH meter. The contents of phosphorus and potassium were determined by ICP spectrometry after nitric-perchloric acid digestion. Soil organic matter was determined by the dilution heat method, while that of alkali hydrolyzed nitrogen was determined by the alkaline hydrolysis diffusion method [34]. The total nitrogen was measured by the Kjeldahl method [35].

2.4.2. Biomass Yield

In the establishment years 2018 and 2019, each mixture was harvested thrice depending upon the plant growth and establishment. Harvesting time of mixtures were little varied with year because of growing conditions and plant growth stage. All plots were harvested when the alfalfa reach at the flowering stage. Side rows of each plot were removed before harvesting and then whole plots were cut to a stubble height of 5–10 cm. After harvesting, the legume and grass components of the mixtures were separated and weeds were removed. Whole-plot fresh weight was recorded, and a fresh sample was taken and weighed for moisture determination. A subsample of approximately 300 g was dried at 75 °C for 72 h to estimate the dry matter concentration of the harvested biomass, which was later used to estimate the dry matter yield. Dried samples of each plot were ground to pass a 1 mm Wiley mill (Arthur H., Thomas, Philadelphia, PA, USA) screen for nutritional quality analysis.

2.4.3. Legume/Grass Biomass Yield Proportions

The biomass yields of mixtures change greatly in the following years because of fierce competition between component species. However, when the component species reach a certain degree of compromise and occupy an ecological niche, the biomass yields of the mixtures become stable. In order to investigate the biomass yield changes in two establishment years of the mixtures, we calculated the legume/grass biomass yield proportions. The legume/grass biomass yield proportions for each mixture were expressed in percentage to better understand the difference in biomass yield of legume and grass components for each mixture.

2.4.4. Nutritional Quality Analysis

The dried samples of the year 2018 of each mixture were used to determine the nutritional quality parameters. The water-soluble carbohydrate (WSC) was determined using anthranone colorimetry and the crude protein (CP) was determined by the Kjeldahl method [36]. Acid detergent fiber (ADF) and neutral detergent fiber (NDF) were analyzed according to previous work [37]. The relative feed value (RFV) was calculated by the following formula:
RFV = (DMI × DDM)/1.29
DMI = 120/NDF
DDM = 88.9 − (0.779 × ADF)
Here, DMI is the dry matter intake and DDM is the digestible dry matter.

2.5. Statistical Analysis

For statistical analysis, ANOVA was conducted using the SPSS software (version 19.0) with Duncan’s multiple range tests. Biomass yield was analyzed by repeated-measures ANOVA technique. Legume–grass mixture, legume-grass seeding ratio and year of sampling were fixed factors, replicate was the random factor and year of measurement was included as a repeated-measure. The least significance difference (LSD) test was employed at 0.05 probability level to compare the means. Pearson’s correlation coefficients were calculated to determine the relationships between the biomass yield and nutritional quality indexes. Tables and graphics were created using Excel 2019 and Origin 2022.

3. Results

3.1. Mixture Composition Influenced the Biomass Yield of Legume-Grass Mixtures

The biomass yield data of first, second and third cuttings of legume–grass mixtures in two legume-grass seeding ratios was recorded for two consecutive years. The mixture composition and year showed significant effects (p < 0.001) on biomass yield, while the legume-grass seeding ratio showed a non-significant effect on biomass yield of mixtures (Table 3). However, the interaction between the mixture composition, legume-grass seeding ratio, and year was significant (p < 0.01) with regard to biomass yield. The biomass yield productivity of A2, C1, and D mixtures was better than that of other mixtures in both legume-grass seeding ratios (Table 4). However, A2 produced the higher two-year average biomass yields of 14.24 and 12.89 t/ha, while that of A1 produced the lowest biomass yields of 8.70 and 8.60 t/ha in legume-grass seeding ratios of 4:6 and 5:5, respectively, compared to other mixtures. The biomass yields of C1, C2, and D mixtures ranged from 9.90 to 11.99 t/ha in both legume-grass seeding ratios. The biomass yield data of different legume-grass mixtures in different legume-grass seeding ratios suggested that the productivity of a mixture is dependent on the mixture composition rather than the legume-grass seeding ratio or species diversity.

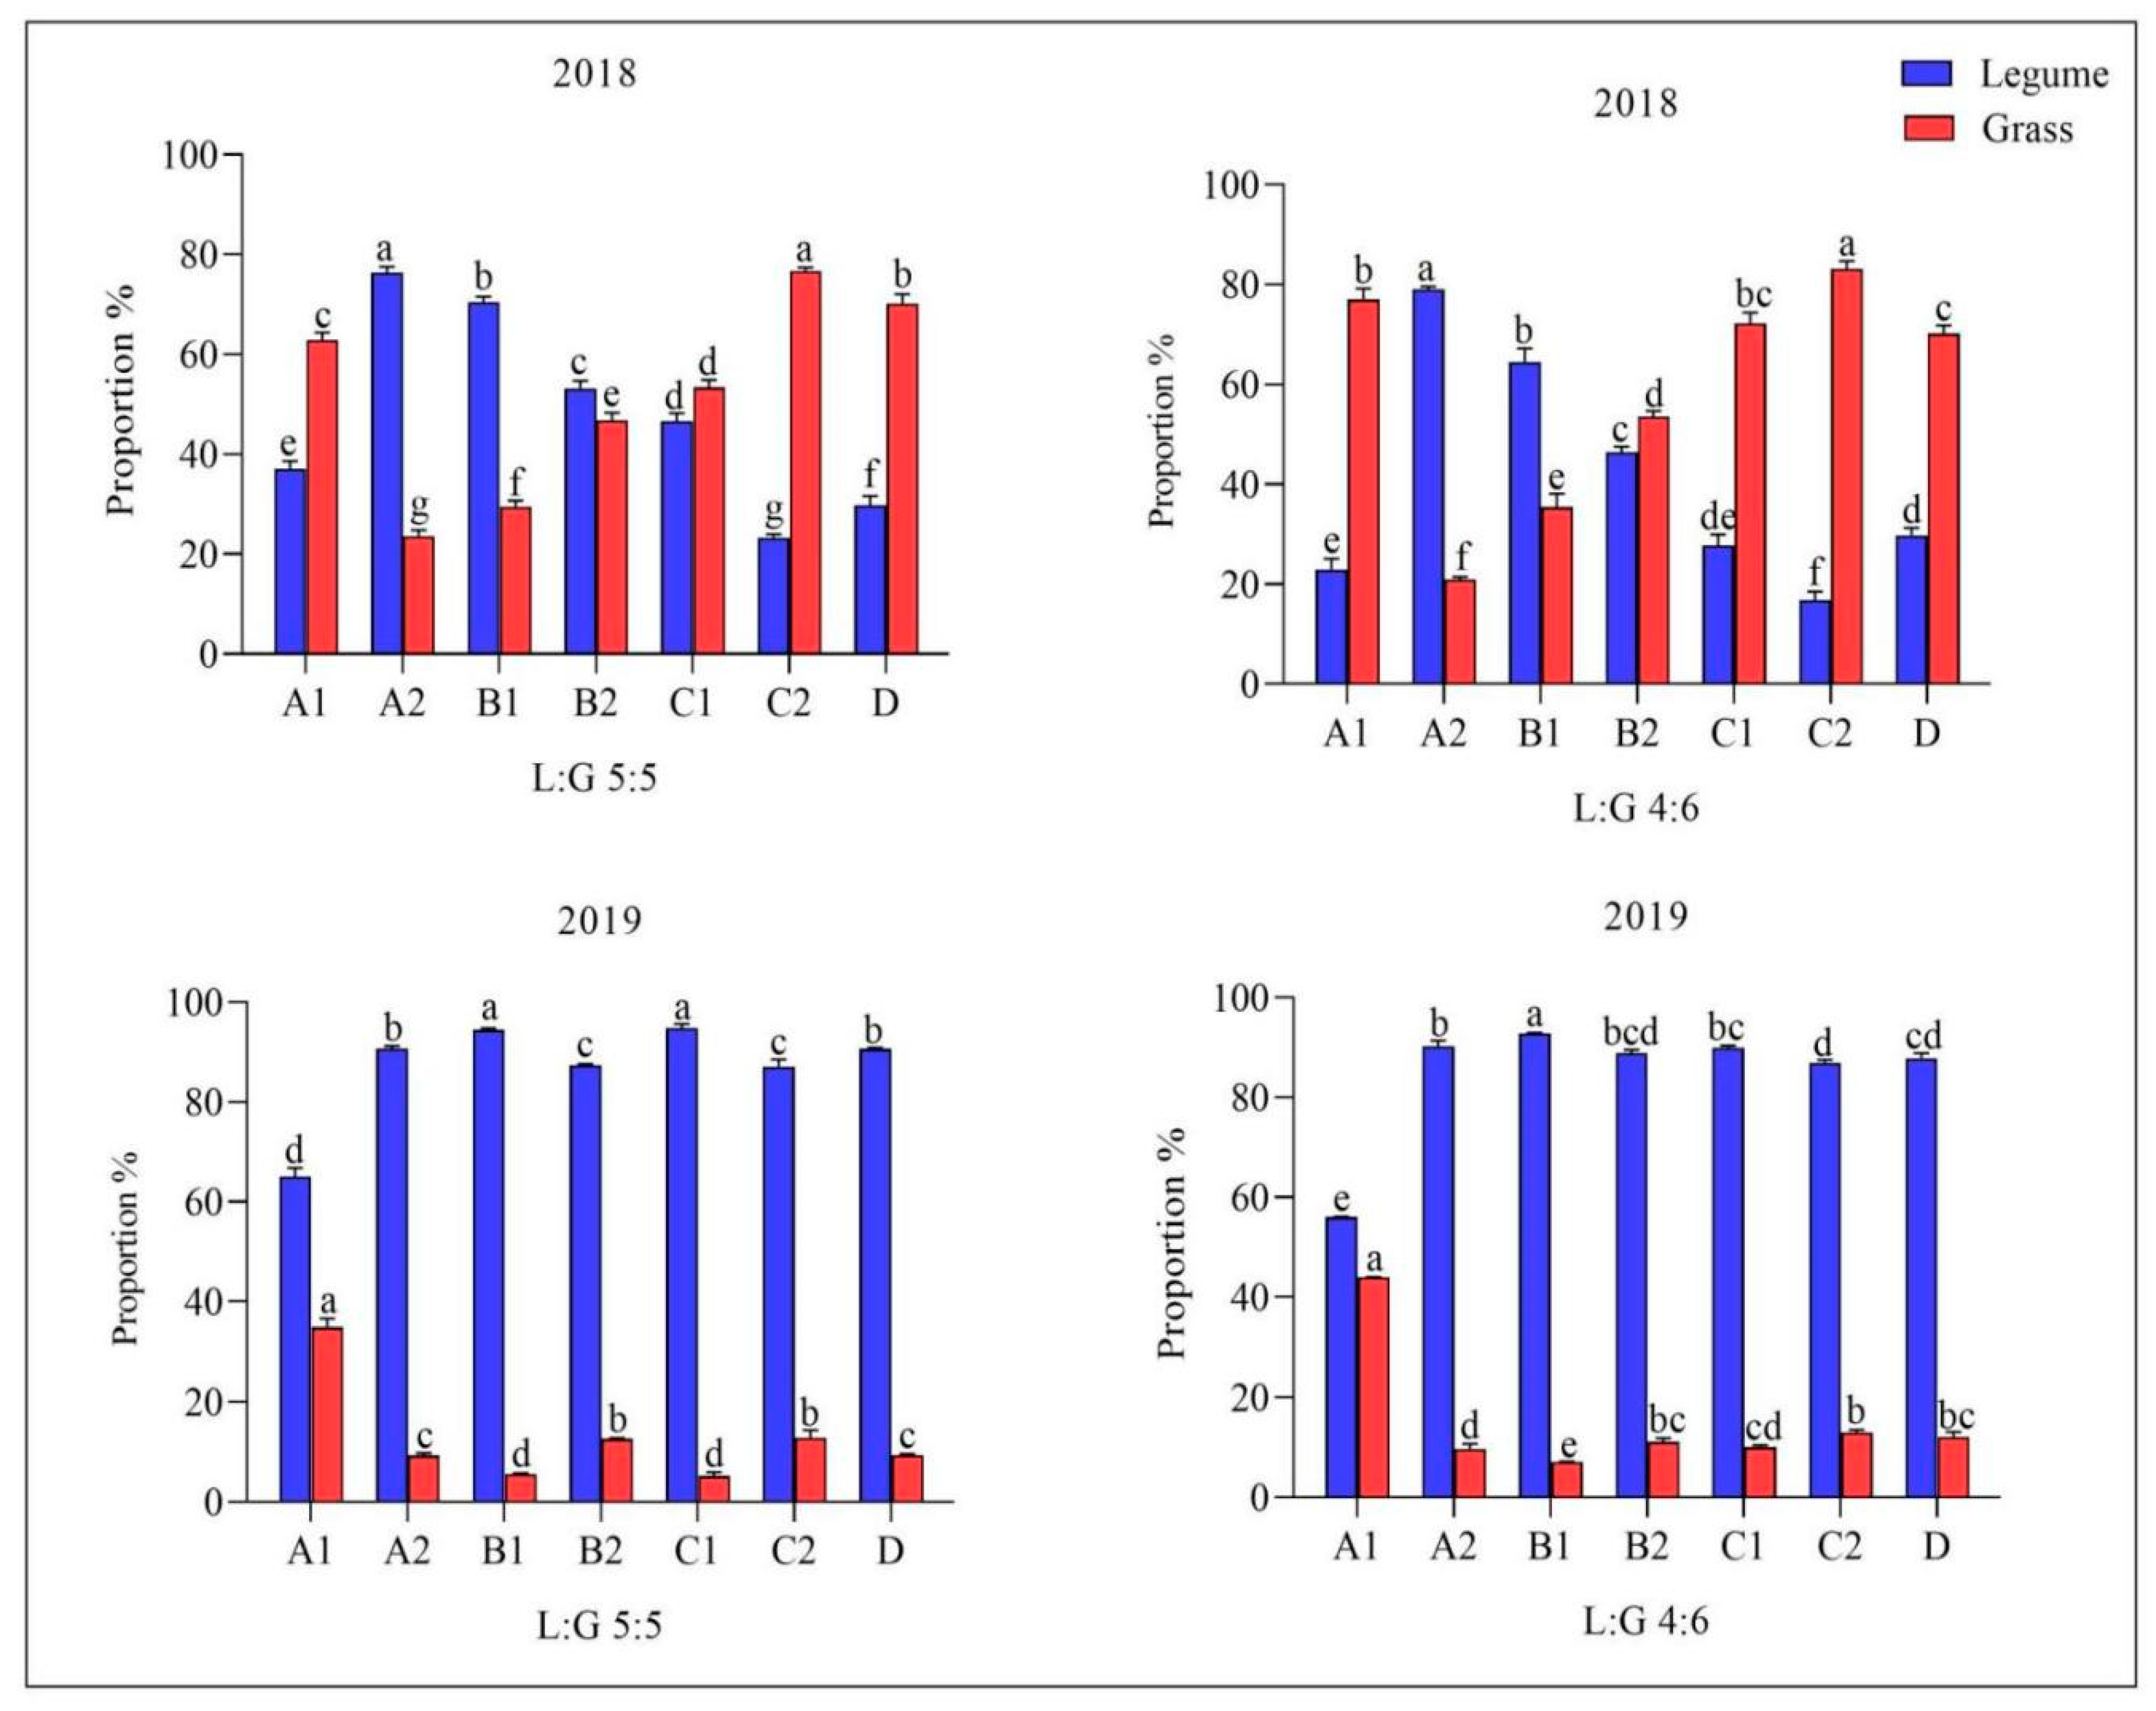
3.2. Grasses Showed Less Biomass Yield Proportion in the Second Year Compared to Legumes

The biomass yields of legume–grass mixtures fluctuate greatly during the early establishment years and are dependent on the component species of the mixtures. The A2 mixture showed a highest biomass yield, but how it performed in the second year was also important. Therefore, we calculated the legume/grass proportions of all mixtures in both legume-grass seeding ratios and years (Figure 1). Grasses biomass yields of all mixtures except A2 and B1 in both legume-grass seeding ratios were significantly higher than that of legumes in 2018. However, the grasses biomass yields of all the mixtures significantly decreased in 2019 and legumes had an absolute advantage over grasses in terms of biomass production. The A2 and B1 showed higher legume proportions of 76 and 70% for L:G 5:5 and 79 and 64% for L:G 4:6, respectively, compared to that of legume proportions of other mixtures in 2018. On the other hand, C2 and D showed higher grass proportions of 76 and 70% for L:G 5:5, respectively, and C2 and A1 showed higher grass proportions of 83 and 77% for L:G 4:6, respectively, than that of grass proportions of other mixtures in 2018. However, the grass proportions of all the mixtures decreased significantly in 2019 and ranged from 5 to 43% in both seeding ratios, while that of legume proportions were ranged from 56 to 94% in all the mixtures. The legume/grass biomass yield proportions data of the mixtures suggest that grasses were less competitive for resource utilization in the second year compared to legumes, leading to a significant impact on the biomass production or stability of the mixtures.

3.3. Mixture Composition Influenced the Nutritional Quality of Legume-Grass Mixtures

The biomass yield data of mixtures and legume/grass proportions showed that the A2 mixture produced a more stable biomass yield compared to other mixtures. So, we further tested the forage quality of all the mixtures in both legume-grass seeding ratios (Table 5). An interaction between the legume–grass mixtures × and legume-grass seeding ratios with regard to CP, WSC, NDF, and ADF yields existed (p < 0.05). The CP yield of all mixtures under both legume-grass seeding ratios of 4:6 and 5:5 was ranged from 1.5 to 2.5 t/ha and 1.4 to 2.5 t/ha, respectively. However, A2 mixture showed a higher CP yield of 2.5 t/ha in L:G 4:6 compared to other mixtures. The WSC yields of all mixtures ranged from 0.3 to 0.8 t/ha in both legume-grass seeding ratios, but the C2 and C1 mixtures showed higher WSC yields of 0.8 and 0.77 t/ha, respectively, in L:G 4:6. Lower NDF yields of 4.6 and 4.8 t/ha were found for C2 mixture in L:G 5:5 and B1 in L:G 4:6, respectively, while that of A1 showed the lower ADF yields of 2.7 and 2.8 t/ha in L:G 5:5 and 4:6, respectively. B1 and A2 mixtures showed the higher RFV of 149.0 in L:G 5:5 and 146.5 in L:G 4:6, respectively compared to other mixtures. The nutritional quality data indicated that the legume-grass seeding ratio has less of an impact on the forage quality compared to mixture composition.

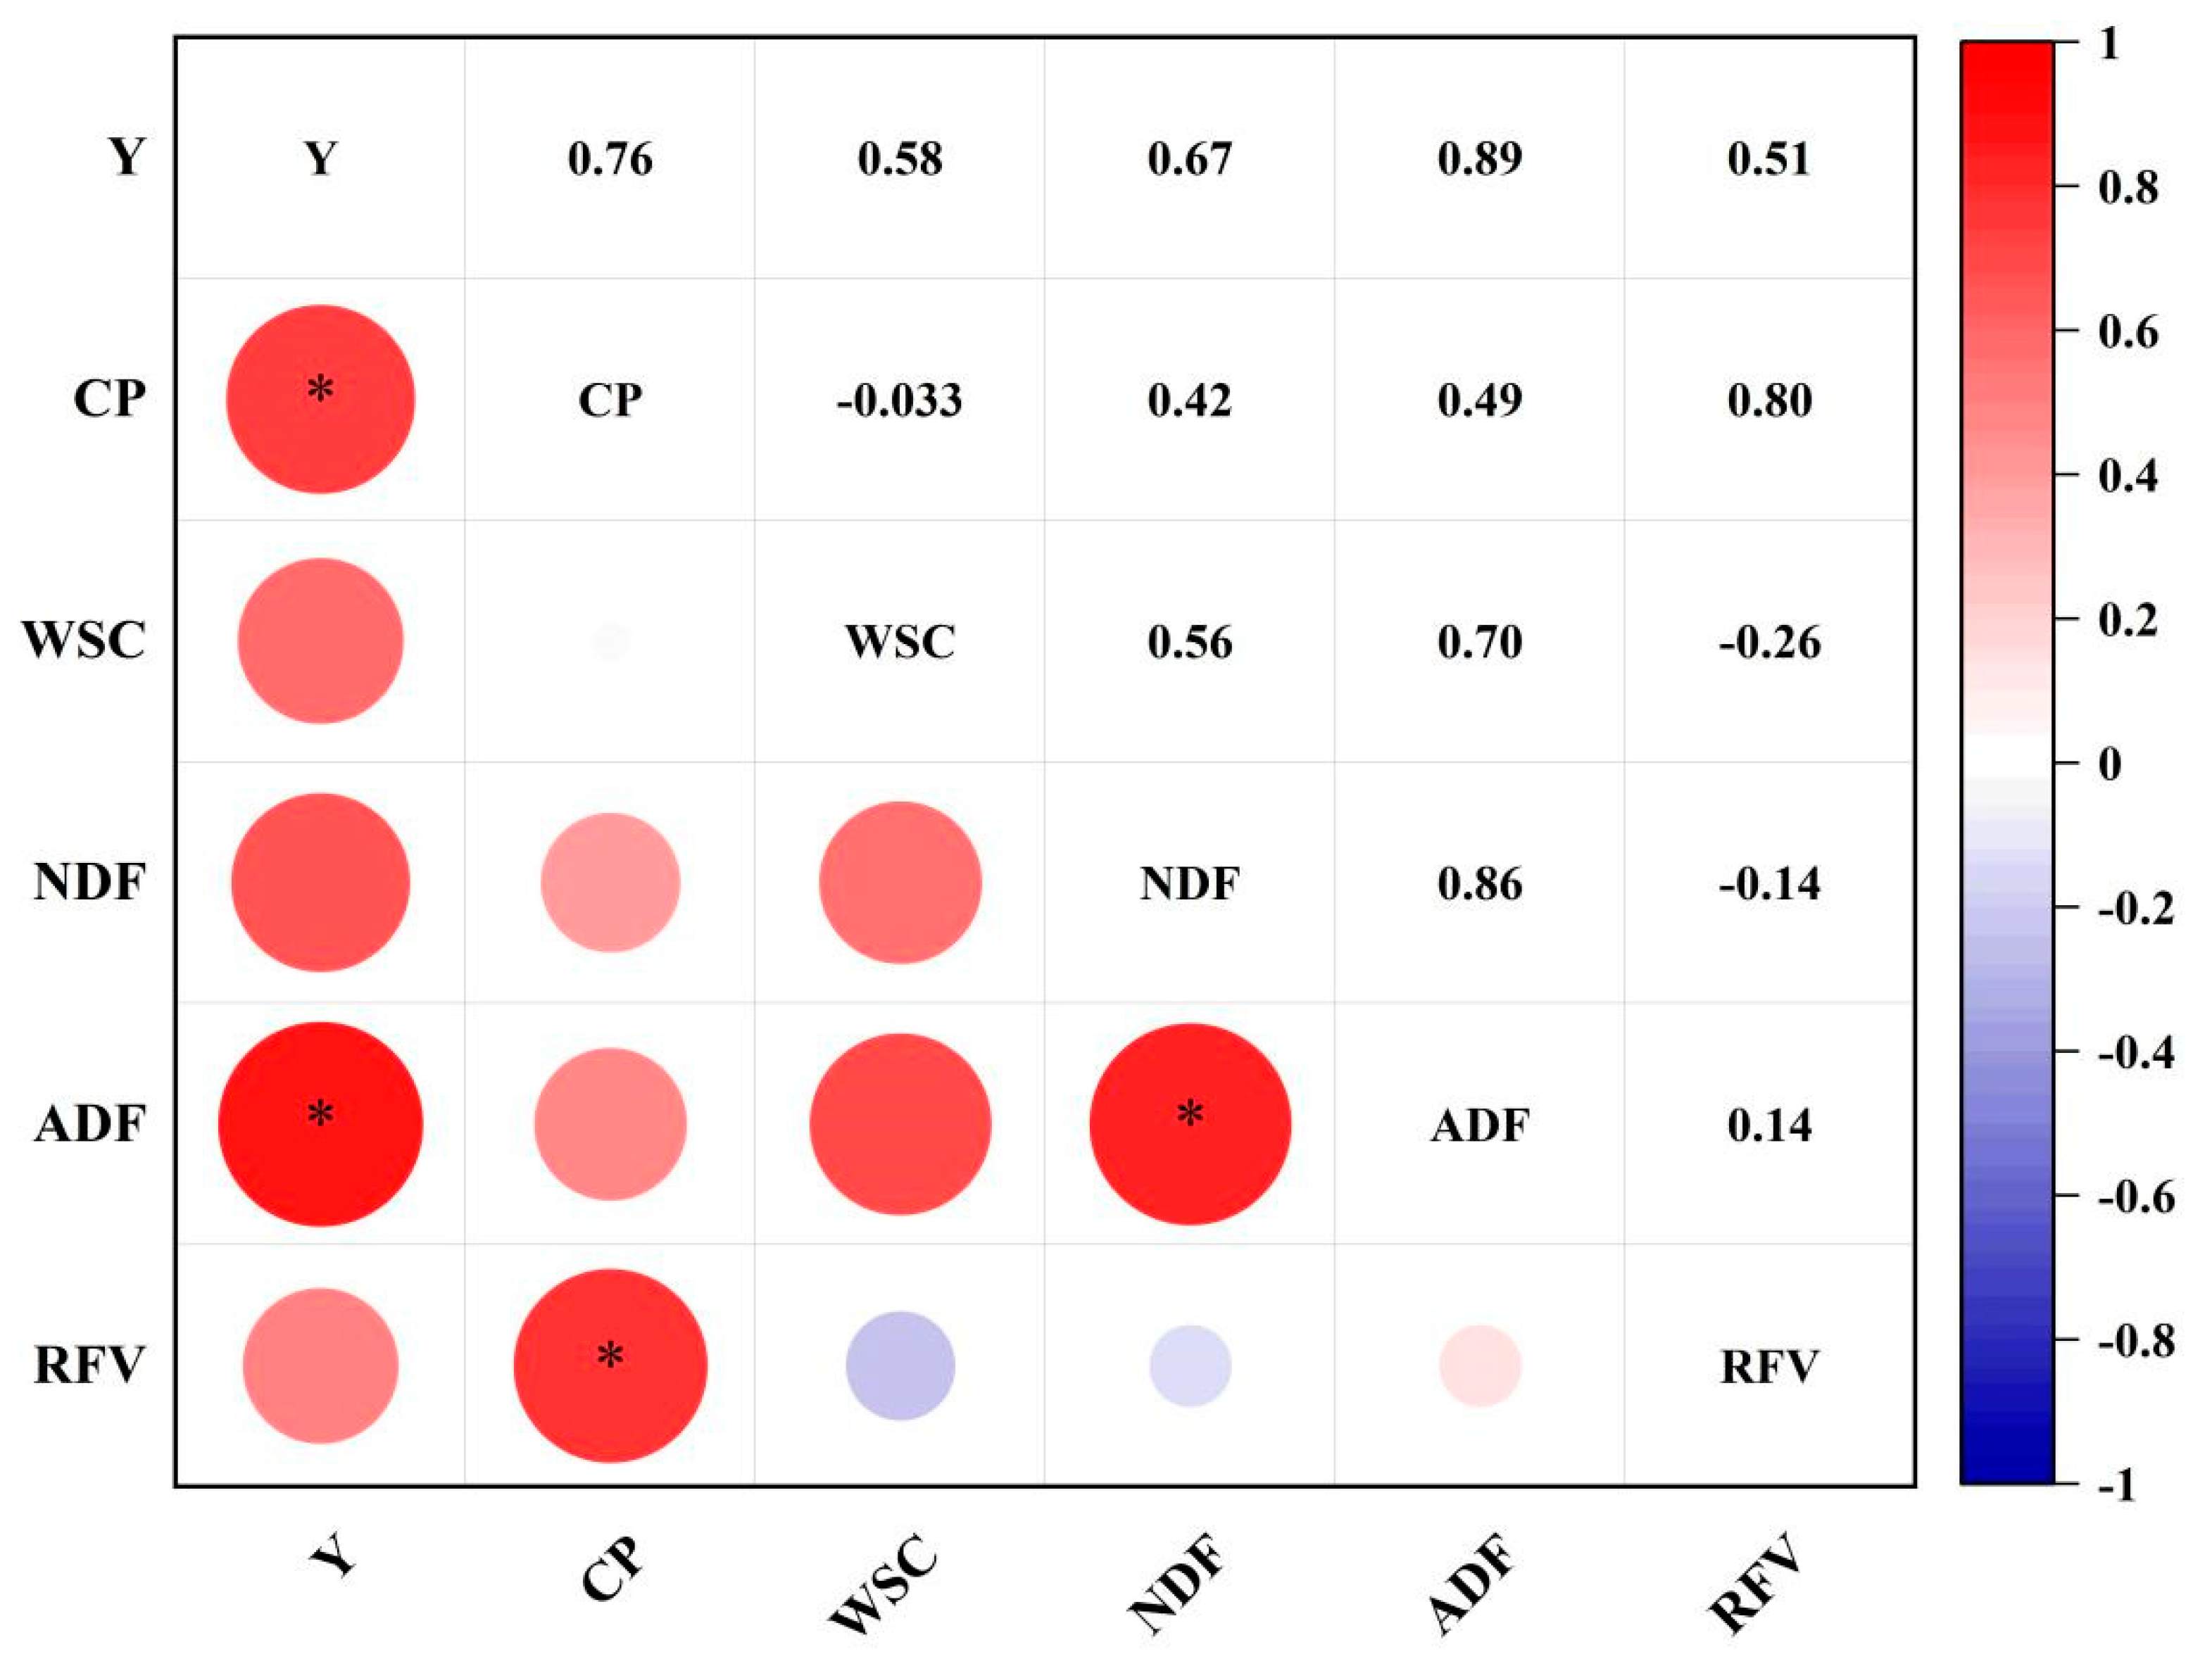
3.4. Correlation Analysis

The correlation analysis of the current study revealed that CP and ADF were significantly positively correlated with the biomass yield (Figure 2). It was further found that biomass yield and NDF were significantly positively correlated with the ADF. However, a positive correlation was found between RFV and CP. These associations might suggest that as the biomass yield increased, the CP and NDF contents increased and vice versa, while CP plays a key role to enhance the RFV.

4. Discussion

This study investigated whether and how the mixture composition and legume-grass seeding ratio affect the biomass yield and nutritional quality of legume–grass mixtures from low to high species diversity gradient. The data confirmed the benefits in terms of biomass yield and nutritional quality of mixing alfalfa with orchardgrass and tall fescue in a legume-grass seeding ratio of 4:6 for the first two years of establishment. The early establishment of the mixture is mainly dependent on mixture composition as a result of competition for resources among component species. Fluctuation in the legume-grass biomass yield proportions is the main agronomic concern as both affect the total biomass yield and nutritional quality of the forages. The mixture composition is more essential in affecting the biomass yield and nutritional quality than that of diversity or legume and grass seeding ratio [33,38,39].

4.1. Mixture Composition Influenced the Biomass Yield of Legume-Grass Mixtures

The biomass yield is dependent on the mixture composition due to differences in the competitive ability of the component species [40]. We found that the A2 mixture (alfalfa, orchardgrass, and tall fescue) produced a higher biomass yield than that of other mixtures. It suggests that species of the A2 mixture were partly complementary with resource utilization by mitigating the fierce competition between species, and as a bonus, the biological nitrogen fixation of alfalfa in the root nodules could transfer towards grasses to nourishment their growth [41]. Similarly, the A1 mixture (white clover, orchardgrass, and tall fescue) also consists of three species, but the mixture composition was different and produced the lowest biomass yield which might be due to the lower competitive ability of white clover as previous studies have proven that white clover is less competitive than alfalfa [28,42].
We found that highly diversified mixtures had less of a biomass yield advantage from the best-adapted specie compared to low diversified mixtures that might be due to the lower seeding density of that specie in such mixtures. However, the C1 mixture (alfalfa, white clover, orchardgrass, tall fescue, and perennial ryegrass) showed a significantly higher biomass yield than all other mixtures except a mixture of alfalfa, tall fescue, and orchardgrass. This could be due to the sampling effect in which mixtures containing more species with complementary characteristics have a greater possibility to include at least one species adapted to a specific environment [43].
From a management perspectives, knowledge related to the effects of legume–grass seeding proportions on the mixture production and nutritional quality would be very useful information for farmers to formulate the seed mixes. Our study showed that the legume-grass seeding ratio has no significant effect on the total biomass yield of the mixtures, which agreed with the previous work [33]. The biomass yield of mixtures increased as the proportion of the species in mixture became more equal [20]. The effect of different species proportions also depended on the dominant species in the mixture and on the proportion of legume in the mixture [31,32]. Therefore, optimal legume components of 40 to 50% in a mixture can achieve a greater biomass yield in legume–grass mixtures, suggesting that farmers have wide flexibility to formulate seed mixtures for specific location.

4.2. Grasses Biomass Yield Decreased with Increased in Establishment Time

With the increase in establishment years, the biomass yields of the mixtures fluctuate because of interspecific competition among the component species. We found that the grass proportions of all the mixtures except A2 and B1 in both seeding ratios were higher than that of legume proportions in 2018. However, the grass proportions decreased significantly in 2019 compared to 2018 and legume proportions of all the mixtures increased than that of grass proportions. This shows that grasses have lower competitiveness than legumes and this trend was found in both legume and grass seeding ratios. Polly et al. (2020) reported that the dominance of early species has a greater influence to reduce the biomass yield stability of the mixture [44]. There could be the several reasons for the lower biomass yield of grasses in second year such as management practices, climate and recommend cutting height of forages. Initial N fertilization and high fertility of soil, which may minimize the ecological benefits of legumes in the mixtures during the early establishment and higher soil N would have favored the grasses and thereby reduced the competitiveness of legumes; however, the second-year mixtures did not undergo the fertilizer treatment, which might be another reason for the decrease in the competition of grasses. Rainfall amount and temperature are well known factors to define the productivity and stability of legume–grass mixtures. We noticed that rainfall distributions during growing season had somewhat difference in growing years which might lead to competition among species for water resources and it is well established that legumes are more competitive than grasses. Another possible reason for the low biomass yield of grasses in the second year could be the recommend cutting height (10 cm) of orchardgrass and tall fescue since they store energy in the plant bases for regrowth [29]. This cutting height is likely why the grasses played a smaller role in the second year.
However, mixtures of A2 and B1 contained alfalfa which have deeper, more developed and larger roots, with a smaller proportion of root mass in fine roots and nodules. Alfalfa have stronger competitive ability and occupy a superior ecological niche in the intercropping system [30]. This might reduce belowground competition with grasses, particularly in the areas immediately around grasses roots, and contributed more in the total biomass production.

4.3. Mixture Composition Influenced the Nutritional Quality of Legume-Grass Mixtures

The cultivation of legume–grass pastures provide balanced feedstocks for animals compared to their respective pure stands because legumes are protein-rich and grasses have higher carbohydrate contents. The agronomic managements practices for the cultivation of legume–grass mixtures play a key role to define their energy contents. The inclusion of legumes with grasses up to a moderate species diversity ensures a better nutritional quality of forages. We found that the interactive effect of the legume–grass mixture and legume-grass seeding ratio on the nutritional quality parameters was significant (p < 0.05) on the nutritional quality parameters, while the legume-grass seeding ratio showed a non-significant effect. The A2 mixture showed a higher CP yield compared to other mixtures. The higher CP yield of the A2 mixture could be due to the alfalfa, as it is a protein-rich forage crop and has 14% more crude protein content than other legumes. A previous study also reported that the inclusion of alfalfa with bunchgrass ensures a higher CP yield [45]. Higher WSC yields were found for the C2 and D1 mixtures, while B1 resulted in a lower WSC yield. Perennial ryegrass and tall fescue have a higher WSC concentration than that of orchardgrass, and its concentration is mostly dependent on the cultivar and environment [46]. However, Jensen et al. (2014) reported that perennial ryegrass has a 33% higher WSC than that of tall fescue or orchardgrass in field plots [47]. Therefore, in the current study, the mixtures having perennial ryegrass as a component specie resulted in higher WSC yields compared to other mixtures. We found that the B1 and A1 mixtures showed lower NDF and ADF yields compared to other mixtures. Sanderson (2010) reported that the proportion of grasses is positively correlated with the fiber and digestibility (Pearson r of 0.54–0.88) of legume–grass mixtures [39]. As the diversity of the mixtures increased, the NDF yield of the mixture increased, suggesting that it might be correlated with the increase in the fiber contents of the mixtures. The RFV is used to predict the intake and energy value of forages. The higher the RFV, the better the nutritional quality of the forage. In the current study, B1 and A2 mixtures showed higher RFV compared to respective mixtures. The RFV was positively correlated with CP content, suggesting that CP plays a role for enhancing the RFV. Taken together, the alfalfa, tall fescue and orchardgrass (A2) mixture not only provide the higher biomass yield, but also the better nutritional quality forage.

5. Conclusions

This study showed that mixture composition has a significant effect on the biomass yield and nutritional quality of legume–grass mixtures rather than species diversity. The performance of the low diversified mixture was better than that of highly diversified mixtures in terms of productivity and nutritional quality. Our results indicate that the productivity of the mixtures was related to the dominant species in the mixtures. However, the legume-grass seeding ratio showed a non-significant effect on the total biomass yield and the nutritional quality parameters of the mixtures, suggesting that farmers have the flexibility to formulate the seeding rates of mixtures for the specific location. The legume–grass mixture of alfalfa, tall fescue and orchardgrass not only produced a higher biomass yield compared to other mixtures, but also had a higher relative feed value, highlighting it as the best choice for practical agricultural settings.

Author Contributions

Conceptualization, M.T., C.L. and Y.Y.; methodology, M.T.; software, T.Z.; validation, M.T., C.C. and T.Z.; formal analysis, Y.X.; investigation, H.H.J.; resources, Y.Y.; data curation, M.T.; writing—original draft preparation, M.T.; writing—review and editing, W.Y.; visualization, Y.Y. and M.T.; supervision, Y.Y.; project administration, Y.Y.; funding acquisition, Y.Y. All authors have read and agreed to the published version of the manuscript.

Funding

This research was funded by Sichuan Science and Technology Department Programs (grant numbers 2020YFN0021, 2021YFH0155, 2021YFN0059 and 2021YFQ0015).

Institutional Review Board Statement

Not applicable.

Informed Consent Statement

Not applicable.

Data Availability Statement

Not applicable.

Acknowledgments

The authors are grateful for the support of Xingjin Wen and Jizhi Yang for the field management.

Conflicts of Interest

The authors declare no conflict of interest.

References

  1. Marquard, E.; Weigelt, A.; Temperton, V.M.; Roscher, C.; Schumacher, J.; Buchmann, N.; Fischer, M.; Weisser, W.W.; Schmid, B. Plant species richness and functional composition drive overyielding in a six-year grassland experiment. Ecology 2009, 90, 3290–3302. [Google Scholar] [CrossRef] [PubMed] [Green Version]
  2. Finn, J.A.; Kirwan, L.; Connolly, J.; Sebastià, M.T.; Helgadottir, A.; Baadshaug, O.H.; Bélanger, G.; Black, A.; Brophy, C.; Collins, R.P. Ecosystem function enhanced by combining four functional types of plant species in intensively managed grassland mixtures: A 3-year continental-scale field experiment. J. Appl. Ecol. 2013, 50, 365–375. [Google Scholar] [CrossRef] [Green Version]
  3. Favre, J.R.; Castiblanco, T.M.; Combs, D.K.; Wattiaux, M.A.; Picasso, V.D. Forage nutritive value and predicted fiber digestibility of Kernza intermediate wheatgrass in monoculture and in mixture with red clover during the first production year. Anim. Feed Sci. Technol. 2019, 258, 114298. [Google Scholar] [CrossRef]
  4. Picasso, V.D.; Brummer, E.C.; Liebman, M.; Dixon, P.M.; Wilsey, B.J. Crop species diversity affects productivity and weed suppression in perennial polycultures under two management strategies. Crop Sci. 2008, 48, 331–342. [Google Scholar] [CrossRef]
  5. Sanderson, M.; Skinner, R.; Barker, D.; Edwards, G.; Tracy, B.; Wedin, D. Plant species diversity and management of temperate forage and grazing land ecosystems. Crop Sci. 2004, 44, 1132–1144. [Google Scholar] [CrossRef]
  6. Yachi, S.; Loreau, M. Biodiversity and ecosystem productivity in a fluctuating environment: The insurance hypothesis. Proc. Natl. Acad. Sci. USA 1999, 96, 1463–1468. [Google Scholar] [CrossRef] [Green Version]
  7. Tilman, D. Plant diversity and composition: Effects on productivity and nutrient dynamics of experimental grasslands. In Biodiversity and Ecosystem Functioning: Synthesis and Perspectives; Tilman, D., Knops, J., Wedin, D., Reich, P., Eds.; Oxford University Press: Oxford, UK, 2002; p. 21. [Google Scholar]
  8. Cong, W.-F.; Suter, M.; Lüscher, A.; Eriksen, J. Species interactions between forbs and grass-clover contribute to yield gains and weed suppression in forage grassland mixtures. Agric. Ecosyst. Environ. 2018, 268, 154–161. [Google Scholar] [CrossRef]
  9. Lüscher, A.; Mueller-Harvey, I.; Soussana, J.-F.; Rees, R.; Peyraud, J.-L. Potential of legume-based grassland–livestock systems in Europe: A review. Grass Forage Sci. 2014, 69, 206–228. [Google Scholar] [CrossRef]
  10. Ashworth, A.J.; Toler, H.D.; Allen, F.L.; Augé, R.M. Global meta-analysis reveals agro-grassland productivity varies based on species diversity over time. PLoS ONE 2018, 13, e0200274. [Google Scholar] [CrossRef] [Green Version]
  11. Miyazawa, K.; Takeda, M.; Murakami, T.; Murayama, T. Dual and triple intercropping: Potential benefits for annual green manure production. Plant Prod. Sci. 2014, 17, 194–201. [Google Scholar] [CrossRef]
  12. Duffy, J.E.; Godwin, C.M.; Cardinale, B.J. Biodiversity effects in the wild are common and as strong as key drivers of productivity. Nature 2017, 549, 261–264. [Google Scholar] [CrossRef] [PubMed]
  13. Fraser, L.H.; Pither, J.; Jentsch, A.; Sternberg, M.; Zobel, M.; Askarizadeh, D.; Bartha, S.; Beierkuhnlein, C.; Bennett, J.A.; Bittel, A. Worldwide evidence of a unimodal relationship between productivity and plant species richness. Science 2015, 349, 302–305. [Google Scholar] [CrossRef] [PubMed] [Green Version]
  14. Hooper, D.U.; Chapin, F., III; Ewel, J.J.; Hector, A.; Inchausti, P.; Lavorel, S.; Lawton, J.H.; Lodge, D.; Loreau, M.; Naeem, S. Effects of biodiversity on ecosystem functioning: A consensus of current knowledge. Ecol. Monogr. 2005, 75, 3–35. [Google Scholar] [CrossRef]
  15. Li, W.; Knops, J.M.; Brassil, C.E.; Lu, J.; Qi, W.; Li, J.; Liu, M.; Chang, S.; Li, W. Functional group dominance and not productivity drives species richness. Plant Ecol. Divers. 2016, 9, 141–150. [Google Scholar] [CrossRef]
  16. Roman, K.; Barwicki, J.; Rzodkiewicz, W.; Dawidowski, M. Evaluation of Mechanical and Energetic Properties of the Forest Residues Shredded Chips during Briquetting Process. Energies 2021, 14, 3270. [Google Scholar] [CrossRef]
  17. Deak, A.; Hall, M.; Sanderson, M.; Archibald, D. Production and nutritive value of grazed simple and complex forage mixtures. Agron. J. 2007, 99, 814–821. [Google Scholar] [CrossRef] [Green Version]
  18. Khalsa, J.; Fricke, T.; Weigelt, A.; Wachendorf, M. Effects of species richness and functional groups on chemical constituents relevant for methane yields from anaerobic digestion: Results from a grassland diversity experiment. Grass Forage Sci. 2014, 69, 49–63. [Google Scholar] [CrossRef]
  19. Ergon, Å.; Kirwan, L.; Fystro, G.; Bleken, M.A.; Collins, R.P.; Rognli, O.A. Species interactions in a grassland mixture under low nitrogen fertilization and two cutting frequencies. II. Nutritional quality. Grass Forage Sci. 2017, 72, 333–342. [Google Scholar] [CrossRef]
  20. Kirwan, L.; Lüscher, A.; Sebastià, M.T.; Finn, J.A.; Collins, R.; Porqueddu, C.; Helgadottir, A.; Baadshaug, O.H.; Brophy, C.; Coran, C. Evenness drives consistent diversity effects in intensive grassland systems across 28 European sites. J. Ecol. 2007, 95, 530–539. [Google Scholar] [CrossRef]
  21. Suter, M.; Connolly, J.; Finn, J.A.; Loges, R.; Kirwan, L.; Sebastià, M.T.; Lüscher, A. Nitrogen yield advantage from grass–legume mixtures is robust over a wide range of legume proportions and environmental conditions. Glob. Chang. Biol. 2015, 21, 2424–2438. [Google Scholar] [CrossRef] [Green Version]
  22. Peeters, A.; Parente, G.; Le Gall, A. Temperate legumes: Key-species for sustainable temperate mixtures. In Sustainable Grassland Productivity; Grassland Science in Europe; Artes Gráficas Marcipa: Badajoz, Spain, 2006. [Google Scholar]
  23. Ghosh, P.; Manna, M.; Bandyopadhyay, K.; Tripathi, A.; Wanjari, R.; Hati, K.; Misra, A.; Acharya, C.; Subba Rao, A. Interspecific interaction and nutrient use in soybean/sorghum intercropping system. Agron. J. 2006, 98, 1097–1108. [Google Scholar] [CrossRef]
  24. Nyfeler, D.; Huguenin-Elie, O.; Frossard, E.; Lüscher, A. Regulation of symbiotic nitrogen fixation in grass-clover mixtures. In Sustainable Grassland Productivity; Artes Gráficas Marcipa: Badajoz, Spain, 2006. [Google Scholar]
  25. Ojeda, J.J.; Caviglia, O.P.; Agnusdei, M.G.; Errecart, P.M. Forage yield, water-and solar radiation-productivities of perennial pastures and annual crops sequences in the south-eastern Pampas of Argentina. Field Crops Res. 2018, 221, 19–31. [Google Scholar] [CrossRef]
  26. Khatiwada, B.; Acharya, S.N.; Larney, F.J.; Lupwayi, N.Z.; Smith, E.G.; Islam, M.A.; Thomas, J.E. Benefits of mixed grass–legume pastures and pasture rejuvenation using bloat-free legumes in western Canada: A review. Can. J. Plant Sci. 2020, 100, 463–476. [Google Scholar] [CrossRef]
  27. Bhandari, K.B.; West, C.P.; Acosta-Martinez, V. Assessing the role of interseeding alfalfa into grass on improving pasture soil health in semi-arid Texas High Plains. Appl. Soil Ecol. 2020, 147, 103399. [Google Scholar] [CrossRef]
  28. Louarn, G.; Pereira-Lopès, E.; Fustec, J.; Mary, B.; Voisin, A.-S.; de Faccio Carvalho, P.C.; Gastal, F. The amounts and dynamics of nitrogen transfer to grasses differ in alfalfa and white clover-based grass-legume mixtures as a result of rooting strategies and rhizodeposit quality. Plant Soil 2015, 389, 289–305. [Google Scholar] [CrossRef]
  29. Aponte, A.; Samarappuli, D.; Berti, M.T. Alfalfa–grass mixtures in comparison to grass and alfalfa monocultures. Agron. J. 2019, 111, 628–638. [Google Scholar] [CrossRef]
  30. Bi, Y.; Zhou, P.; Li, S.; Wei, Y.; Xiong, X.; Shi, Y.; Liu, N.; Zhang, Y. Interspecific interactions contribute to higher forage yield and are affected by phosphorus application in a fully-mixed perennial legume and grass intercropping system. Field Crops Res. 2019, 244, 107636. [Google Scholar] [CrossRef]
  31. Mulder, C.P.; Bazeley-White, E.; Dimitrakopoulos, P.G.; Hector, A.; Scherer-Lorenzen, M.; Schmid, B. Species evenness and productivity in experimental plant communities. Oikos 2004, 107, 50–63. [Google Scholar] [CrossRef]
  32. Nyfeler, D.; Huguenin-Elie, O.; Suter, M.; Frossard, E.; Connolly, J.; Lüscher, A. Strong mixture effects among four species in fertilized agricultural grassland led to persistent and consistent transgressive overyielding. J. Appl. Ecol. 2009, 46, 683–691. [Google Scholar] [CrossRef]
  33. Sanderson, M.A.; Brink, G.; Stout, R.; Ruth, L. Grass–legume proportions in forage seed mixtures and effects on herbage yield and weed abundance. Agron. J. 2013, 105, 1289–1297. [Google Scholar] [CrossRef] [Green Version]
  34. Bao, S. Soil Agrochemical Analysis; China Agricultural Press: Beijing, China, 2000; Volume 67, p. 72. [Google Scholar]
  35. Bremner, J.M. Nitrogen-total. In Methods of Soil Analysis: Part 3 Chemical Methods; Soil Science Society of America: Madison, WI, USA, 1996; Volume 5, pp. 1085–1121. [Google Scholar]
  36. AOAC. Official Methods of Analysis; Association of Official Analytical Chemists: Arlington, VA, USA, 1990. [Google Scholar]
  37. Van Soest, P.V.; Robertson, J.; Lewis, B. Methods for dietary fiber, neutral detergent fiber, and nonstarch polysaccharides in relation to animal nutrition. J. Dairy Sci. 1991, 74, 3583–3597. [Google Scholar] [CrossRef]
  38. Sanderson, M.A. Stability of production and plant species diversity in managed grasslands: A retrospective study. Basic Appl. Ecol. 2010, 11, 216–224. [Google Scholar] [CrossRef]
  39. Sturludóttir, E.; Brophy, C.; Belanger, G.; Gustavsson, A.M.; Jørgensen, M.; Lunnan, T.; Helgadóttir, Á. Benefits of mixing grasses and legumes for herbage yield and nutritive value in Northern Europe and Canada. Grass Forage Sci. 2014, 69, 229–240. [Google Scholar] [CrossRef] [Green Version]
  40. Wendling, M.; Büchi, L.; Amossé, C.; Jeangros, B.; Walter, A.; Charles, R. Specific interactions leading to transgressive overyielding in cover crop mixtures. Agric. Ecosyst. Environ. 2017, 241, 88–99. [Google Scholar] [CrossRef]
  41. Zhao, Y.; Liu, X.; Tong, C.; Wu, Y. Effect of root interaction on nodulation and nitrogen fixation ability of alfalfa in the simulated alfalfa/triticale intercropping in pots. Sci. Rep. 2020, 10, 4269. [Google Scholar] [CrossRef] [PubMed] [Green Version]
  42. Heshmati, S.; Tonn, B.; Isselstein, J. White clover population effects on the productivity and yield stability of mixtures with perennial ryegrass and chicory. Field Crops Res. 2020, 252, 107802. [Google Scholar] [CrossRef]
  43. Loreau, M.; Hector, A. Partitioning selection and complementarity in biodiversity experiments. Nature 2001, 412, 72–76. [Google Scholar] [CrossRef]
  44. Polley, H.W.; Collins, H.P.; Fay, P.A. Biomass production and temporal stability are similar in switchgrass monoculture and diverse grassland. Biomass Bioenergy 2020, 142, 105758. [Google Scholar] [CrossRef]
  45. Bork, E.W.; Gabruck, D.T.; McLeod, E.M.; Hall, L.M. Five-year forage dynamics arising from four legume–grass seed mixes. Agron. J. 2017, 109, 2789–2799. [Google Scholar] [CrossRef]
  46. Kramer, K.J.; Kagan, I.A.; Lawrence, L.M.; Goff, B.M.; Smith, S.R. Water-soluble carbohydrates of cool-season grasses: Prediction of concentrations by near-infrared reflectance spectroscopy and evaluation of effects of genetics, management, and environment. J. Equine Vet. Sci. 2020, 90, 103014. [Google Scholar] [CrossRef]
  47. Jensen, K.B.; Harrison, P.; Chatterton, N.J.; Bushman, B.S.; Creech, J.E. Seasonal trends in nonstructural carbohydrates in cool-and warm-season grasses. Crop Sci. 2014, 54, 2328–2340. [Google Scholar] [CrossRef]
Figure 1. Legume/grass biomass yield proportions of legume–grass mixtures under two different legume-grass seeding ratios for consecutive two years. A1: white clover, orchardgrass, and tall fescue; A2: alfalfa, orchardgrass, and tall fescue; B1: alfalfa, white clover, orchardgrass, and tall fescue; B2: red clover, white clover, orchardgrass, and tall fescue; C1: alfalfa, white clover, orchardgrass, tall fescue, and perennial ryegrass; C2: red clover, white clover, orchardgrass, tall fescue, and perennial ryegrass; and D: alfalfa, red clover, white clover, orchardgrass, tall fescue, and perennial ryegrass. The small letters indicate the significant difference between legume or grass proportions between legume–grass mixtures. Significant difference test was performed at probability level of 0.05.
Agronomy 12 01449 g001
Figure 2. Relationship between biomass yield and nutritional quality parameters. Red color shows the positive correlation, and blue color shows the negative correlation (* p < 0.05). The intensity of color represents the significance of a variable. Y, biomass yield; DM, dry matter; WSC, water-soluble carbohydrates; CP, crude protein; NDF, neutral detergent fiber; ADF, acid detergent fiber; RFV, relative feed value.
Agronomy 12 01449 g002
Table 1. Monthly average temperature and rainfall of experimental site from year 2017 to 2019.
MonthAverage Temperature (°C)Average Rainfall (mm)
201720182019201720182019
January7.585.976.6716.003.405.20
February10.057.677.442.901.4014.00
March13.8415.4813.0110.6025.8027.60
April15.4718.4219.2924.1069.3044.60
May21.4323.3120.2362.40121.70146.30
June22.2513.5123.75151.67235.106.60
July25.5726.7124.07288.56357.80294.30
August26.8326.8525.1066.3484.9032.00
September22.6321.9920.41144.50109.50205.20
October17.5416.9418.3945.5037.108.50
November12.1211.5011.249.3010.5013.00
December7.835.657.665.404.102.90
Table 2. Seeding rates of legume and grass species in selected mixtures under two legume-grass seeding ratios.
MixtureSpeciesSeeding Rate (kg/ha)/Mixed Ratio (%)
L:G 5:5L:G 4:6
A1Orchardgrass3.75/254.50/30
Tall fescue9.38/2511.25/30
White clover3.75/503.00/40
A2Orchardgrass3.75/254.50/30
Tall fescue9.38/2511.25/30
Alfalfa11.25/509.00/40
B1Orchardgrass3.75/254.50/30
Tall fescue9.38/2511.25/30
Alfalfa5.62/254.50/20
White clover1.86/251.50/20
B2Orchardgrass3.75/254.50/30
Tall fescue9.38/2511.25/30
White clover1.86/251.50/20
Red clover3.75/253.00/20
C1Orchardgrass2.50/16.703.00/20
Perennial ryegrass3.01/16.703.60/20
Tall fescue6.26/16.707.50/20
Alfalfa5.62/254.50/20
White clover1.86/251.50/20
C2Orchardgrass2.50/16.703.00/20
Perennial ryegrass3.01/16.703.60/20
Tall fescue6.26/16.707.50/20
White clover1.86/251.50/20
Red clover3.75/253.00/20
DOrchardgrass2.50/16.703.00/20
Perennial ryegrass3.01/16.703.60/20
Tall fescue6.25/16.677.50/20
Alfalfa3.75/16.672.99/13.30
White clover1.25/16.670.99/13.30
Red clover2.50/16.671.99/13.30
Note. L:G shows the legume and grass seeding ratio.
Table 3. Repeated-measures ANOVA for the effects of mixture composition and legume-grass seeding ratio on the biomass yield in 2018 and 2019.
VariableBiomass Yield
dfType III Sum of SquaresF
Between-subjects source
Mixture6169.20 ***97.40
Ratio10.010.04
Mixture × Ratio613.69 ***7.88
Error288.107
Within-subjects source
Year159.67 ***135.55
Mixture × Year631.56 ***11.94
Ratio × Year10.120.27
Mixture × Ratio × year610.47 **3.96
Error2812.327
Notes: The degree of freedom, F value, and Type III sums of squares and significance levels of effects are shown for each variable. Legume-grass mixtures means under two legume-grass seeding ratios are shown in Table 4. **, p < 0.01; ***, p < 0.001.
Table 4. Biomass yield (t/ha) of legume–grass mixtures in different legume-grass seeding ratios for two consecutive years.
YearCuttingsL:G 5:5L:G 4:6
Legume–Grass Mixtures
A1A2B1B2C1C2DA1A2B1B2C1C2D
2018First cut4.45 abcBC3.72 cdeD3.81 bcdCD4.54 abAB4.86 aA3.09 deE3.92 bcCD3.75 bcdBC3.85 bcdBC3.04 eC3.98 bcB5.22 aA4.54 abAB4.86 aA
Second cut3.25 deD4.58 bB3.88 cC4.03 bcC3.74 cdC3.66 cdeCD5.12 aA3.25 deB4.51 bA3.15 eB4.02 bcA4.25 bcA4.47 bA4.20 bcA
Third cut2.89 gC4.29 bcAB4.37 bcA3.95 bcdAB3.92 bcdAB2.92 gC3.57 defBC3.01 egDE5.51 aA4.45 bB3.76 cdeC3.26 efgD2.74 gE2.94 gDE
Sum10.60 dB12.60 bA12.08 bA12.53 bA12.52 bA9.68 dB12.62 bA10.01 dD13.88 aA10.65 cdCD11.77 bcBC12.73 bAB11.76 bcBC12.01 bB
2019First cut3.39 cdeCD4.24 bA3.46 cdeCD2.97 eD3.91 bcAB3.43 cdeCD3.62 cdBC3.08 deC5.76 aA3.14 deC3.50 cdeBC3.15 deC3.10 deC3.72 cB
Second cut2.07 gD4.01 abA3.23 deB2.90 efBC3.86 bcA2.67 fC3.77 bcA2.65 fC4.41 aA2.65 fC2.92 efBC3.48 cdB3.04 defBC3.47 cdB
Third cut1.33 hE4.92 aA3.57 cdeBC2.68 gD3.69 cdBC4.03 bcB3.39 defC1.46 hD4.42 bA3.08 fgC3.12 efgC3.88 cB3.19 efC3.23 defC
Sum6.80 hE13.17 bA10.27 defC8.55g D11.46 cB10.13 defC10.79 cdBC7.20 hD14.59 aA8.87 gC9.54 efgBC10.52 cdeB9.34 fgC10.43 deB
2-year mean8.70 hF12.89 bA11.17 deC10.54 efD11.99 cB9.90 fgE11.70 cdBC8.60 hE14.24 aA9.76 gD10.66 eC11.63 cdB10.55 efC11.22 deBC
Notes: A1: white clover, orchardgrass, and tall fescue; A2: alfalfa, orchardgrass, and tall fescue; B1: alfalfa, white clover, orchardgrass, and tall fescue; B2: red clover, white clover, orchardgrass, and tall fescue; C1: alfalfa, white clover, orchardgrass, tall fescue, and perennial ryegrass; C2: red clover, white clover, orchardgrass, tall fescue, and perennial ryegrass; and D: alfalfa, red clover, white clover, orchardgrass, tall fescue, and perennial ryegrass. Data are the mean of three biological repeats. Lowercase letters indicate the significant difference among mixtures in both legume and grass seeding ratios within same cut, while uppercase letters indicate the significant different among mixtures within same legume-grass seeding ratio and cut. Significant difference was performed at a probability level of 0.05. L:G represents the legume-grass seeding ratio.
Table 5. Nutritional quality of legume–grass mixtures in two legume-grass seeding ratios in 2018.
Seeding RatioMixtureNutritional Parameters
CPWSCNDFADFRFV
L:G 5:5A11.83 efgD0.54 defCD5.35 bcdB2.77 gD125.97 dC
A22.30 bA0.75 abcA5.68 abcAB3.49 abcAB138.64 bcB
B12.24 bcAB0.49 defD5.15 cdeBC3.21 cdeBC149.02 aA
B22.18 bcdAB0.50 defCD6.05 aA3.36 bcdAB131.08 cdC
C12.06 bcdBC0.63 bcdB6.03 aA3.64 abA128.66 dC
C21.42 hE0.57 cdeBC4.69 eC2.94 efgCD126.15 dC
D1.93 defCD0.76 abcA6.13 aA3.59 abcA127.78 dC
L:G 4:6A11.59 ghD0.51 defCD4.95 deB2.86 fgD125.51 dC
A22.57 aA0.72 abcAB6.03 aA3.85 aA146.57 aA
B11.91 defBC0.36 fD4.81 deB3.00 defCD138.79 bcAB
B22.02 cdeB0.45 efCD5.63 abcA3.29 bcdBC130.63 cdBC
C11.87 efBC0.77 abA6.17 aA3.87 aA126.38 dC
C21.67 fghCD0.85 aA5.83 abA3.55 abcAB124.16 dC
D1.86 efBC0.67 bcdBC5.72 abcA3.49 abcAB130.32 cdBC
Mixture (M)***************
Ratio (R)NSNSNS*NS
M × R******NS
Note: A1: white clover, orchardgrass, and tall fescue; A2: alfalfa, orchardgrass, and tall fescue; B1: alfalfa, white clover, orchardgrass, and tall fescue; B2: red clover, white clover, orchardgrass, and tall fescue; C1: alfalfa, white clover, orchardgrass, tall fescue, and perennial ryegrass; C2: red clover, white clover, orchardgrass, tall fescue, and perennial ryegrass; and D: alfalfa, red clover, white clover, orchardgrass, tall fescue, and perennial ryegrass. DM: dry matter, CP: crude protein, WSC: water-soluble carbohydrate, NDF: Neutral detergent fiber, ADF: acid detergent fiber and RFV: relative feed value. Data are the mean of three biological repeats. The small letters indicate the significant difference between mixtures within different legume-grass seeding ratios, while capital letters indicate the significant different between mixtures within the same seeding ratio. M × R indicates the interactive effect mixtures and legume-grass seeding ratios. L:G represents the legume and grass seeding ratio. * p < 0.05; ** p < 0.01; *** p < 0.001; NS, non-significant. Significant difference test was performed at probability level of 0.05.
Publisher’s Note: MDPI stays neutral with regard to jurisdictional claims in published maps and institutional affiliations.

