Article

Leaf Scorching following Foliar Fertilization of Wheat with Urea or Urea–Ammonium Nitrate Is Caused by Ammonium Toxicity

by
Saulo Augusto Quassi de Castro
1,2,
Thomas Kichey
3,
Daniel Pergament Persson
1 and
Jan Kofod Schjoerring
1,*
1
Department of Plant and Environmental Sciences, Faculty of Science, University of Copenhagen, Thorvaldsensvej 40, DK-1871 Frederiksberg C, Denmark
2
Department of Soil Science, “Luiz de Queiroz” College of Agriculture, University of São Paulo, Avenida Pádua Dias, 11, São Paulo 13418-900, Brazil
3
Écologie et Dynamique des Systèmes Anthropisés (EDYSAN, UMR 7058 CNRS UPJV) Université de Picardie Jules Verne, CEDEX, 80039 Amiens, France
*
Author to whom correspondence should be addressed.
Agronomy 2022, 12(6), 1405; https://doi.org/10.3390/agronomy12061405
Submission received: 9 May 2022 / Revised: 29 May 2022 / Accepted: 8 June 2022 / Published: 11 June 2022

Abstract

:
Foliar fertilization is a potential tool to increase the use-efficiency of nitrogen (N) fertilizers. However, whilst leaf scorching has frequently been reported, the underlying physiological processes are not clear. In the present work, we investigate the intensity of leaf scorching as affected by the balance between ammonium assimilation and accumulation. Leaves were sprayed with urea–ammonium nitrate (UAN) solution without surfactant or applied liquid droplets of urea in different N concentrations with surfactant. UAN solutions without surfactant containing >10% N caused leaf scorching already after 24 h and the severity increased with the N concentration. The same pattern was observed 3 days after the application of urea solutions containing >4% N together with surfactant. The scorching was accompanied by a massive increase in foliar and apoplastic ammonium (NH4+) concentration. Moreover, the activity of glutamine synthetase (GS), most pronouncedly that of the chloroplastic isoform (GS2), decreased a few hours after the application of high N-concentrations. Along with this, the concentration of glutamate—the substrate for GS—decreased. We conclude that leaf scorching is promoted by NH4+ accumulation due to a limitation in N assimilation capacity.

1. Introduction

Wheat is the most widely grown crop in the world, covering approximately 219 million hectares of harvested area in 2020 and yielding approximately 761 million tons of grain [1]. Wheat grains are rich in carbohydrates and have a high protein content which is used for the production of flour, pasta, bread, and other bakery products [2,3]. Cereals such as rice, maize, and wheat are of vital importance to the human diet, constituting a main source of protein and fiber in developing countries. On a global scale, cereal crops provide 48% of the total calories and 20% of the energy intake of the population [4,5]. Many factors influence the content of protein in grain and nitrogen (N) availability is one of the most important alongside genetic and environmental conditions [6,7].
In addition to global food security, wheat is also important for the production of biofuels. First-generation biofuel is produced on the basis of starchy grains which has led to controversial land use (food vs. fuels) and started a discussion over what the main use of wheat grains should be [8,9,10]. This discussion prompted the development of second-generation biofuels which are produced from lignocellulosic biomass, making wheat straw yields important in addition to grain yields [11]. To achieve this dual-purpose (food and fuels), plant breeders have designed new wheat ideotypes with high potential yields of both grain and straw [6,12].
Nitrogen is an essential element for plant growth and is the primary driver of crop yields. Nitrogen plays a central role in photosynthesis during plant development and subsequently becomes important for grain establishment [2,13]. Studies have shown that N-fertilizer applied during generative growth stages primarily boosts grain yields, while post-anthesis N-dressings improve the grain protein content (GPC) [14,15,16,17,18]. The use-efficiency of nitrogen fertilizers (fertilizer-NUE) during the first growing season after application to the soil is considered to be low (30–40%). A major part of the applied fertilizer is incorporated into the soil organic matter from where it may subsequently mineralize and increase N losses to the environment [2,19,20]. Nitrogen losses can cause several damages to the environment, e.g., the eutrophication caused by nitrate leaching and increased global warming due to the emission of N2O [21,22].
One approach to improve the fertilizer-NUE is foliar fertilization, where liquid N-fertilizer is sprayed directly onto the leaves, thereby bypassing the soil from which N is easily leached or volatilized [23]. Foliar N-fertilization (FNf) also offers greater possibilities to match plant demand and N supply during the growing season, which might further improve the fertilizer-NUE [24,25]. Foliar fertilization with various N sources may, however, cause leaf scorching [22,23,26,27,28,29]. Very limited information is available on how different N-forms affect leaf scorching and the physiological processes underlying the scorching. In this context, the objective of the present work was to investigate the effects of the increasing application to wheat leaves of two N sources, namely urea and urea–ammonium nitrate, on leaf scorching and foliar N assimilation.

2. Materials and Methods

2.1. Plant Growth Conditions

Two experiments were carried out in a greenhouse with a controlled environment at 275 µmol m−2 s−1 light intensity, within a temperature range of 19/15 °C (day/night), a photoperiod of 4/20 h (day/night), and relative air humidity of ~65%. Two spring wheat cultivars were used in the experiments; cv Amaretto in the first experiment, and cv Harenda in the second experiment.
All seeds were sown in 2 L pots (experimental units) filled with substrate (Pindstrup, substrate no 2) and a pH range of 5.6–6.4 and nutrient contents (g m−3) of 70 NO3-N, 50 NH4+-N, 89 P, 200 K, 14 Mg, 0.4 B, 2 Mo, 1.7 Cu, 2.9 Mn, 0.9 Zn, and 8 Fe. Each experimental unit contained 2 plants with 4 tillers each, which were 5 weeks old when the N-fertilizer applications were initiated.

2.2. Treatments and Foliar N-Fertilization (FNf)

The experiments were carried out in a completely randomized design with 3 and 4 replicates, respectively, in the first and second experiment. In the first experiment, urea–ammonium nitrate (UAN) was used as the N source and the treatments consisted of four UAN solutions with different N concentrations of 0, 5, 10, 20, and 40% of N, corresponding to 0, 2.7, 5.5, 11, and 22 mg of N per plant, respectively. In the second experiment, urea with surfactant (0.05% tween 20) was used as the N source and the treatments consisted of 0 (only 0.05% tween 20 aqueous solution), 2, 4, 6, and 9% of N, corresponding to 0.18, 0.36, 0.56, and 0.84 mg of N per leaf.
The application method differed between the experiments. In the first experiment, UAN solutions were sprayed onto the adaxial side of the leaves. The volume applied was 40 mL m−2 (simulating a field application with 400 L ha−1 with a plant density of 230 m−2). The leakage of the nitrogen solution into the soil during the application of the solution was prevented by carefully covering the entire soil surface with plastic film. In the second experiment, in order to apply an exact and repeatable volume onto each leaf, all solutions were applied by volume repeater pipette and tween 20 (0.05%) was added to all solutions to increase the droplet adherence, including all control treatments which consisted of Milli-Q water with tween 20. Three droplets (3 µL in each droplet) were pipetted onto the middle section of the adaxial surface of the youngest fully expanded leaf (YFEL), as indicated in Figure S1.

2.3. Evaluation Time and Leaf Sampling

The YFEL and the second youngest leaf were harvested at 1, 3, 6, 12, and 24 h after foliar N-fertilization (HAFNf) in the first experiment, aiming to investigate short-term leaf scorching. In the second experiment, photos of the YFEL were taken every day after the application of urea droplets. Seven days after foliar N-fertilization (DAFNf), when leaf scorching was no longer increasing, the YFEL was collected and part of the leaf blade above the middle section where the N droplets were applied was sampled for further analysis. After sampling, the leaves were washed in Milli-Q water and wiped dry, then weighed, put in polyethylene vials, and finally frozen in liquid N2 for later analysis. Prior to starting the analysis, the frozen leaf tissue was ground in liquid N2 in the vials (homogenized leaf sample).

2.4. Ammonium Analysis

One quarter of a gram of homogenized leaf sample was extracted in 2.5 mL of 10 mM formic acid, according to the method adapted from [30]. The homogenate was centrifuged at 13,400× g for 21 min at 2 °C. To remove the small particles, 1 mL supernatant was filtered through a 0.45 µm nylon filter (Q-Max® RR Syringe filters; filter diameter 13 mm) previously washed with formic acid. The filtered supernatant was stored in the freezer at −20 °C until the analysis. Ammonium was measured based on the method described by [30] using flow injection analysis system (FIA) with online gas dialysis (Tecator FIA Star 5000; Höganäs, Sweden) following ISO 11732:2005 E [31]. Due to the high ammonium concentration, the filtered supernatants were diluted in Milli-Q water (1:10 v/v, supernatant: water). Four hundred microliters of diluted supernatants were injected into the system and mixed with an alkaline solution (10 g NaOH, 15 g EDTA disodium salt, 6.2 g H3BO3 in 500 mL MilliQ water). The formed ammonia diffused across a semi-permeable PTFE membrane and became trapped in an indicator solution (10 mL indicator stock solution to 500 mL Milli-Q water). The resulting color change was measured by a UV-spectrophotometer (absorbance at 590 nm).
Apoplastic ammonium concentration was also determined in the first experiment following the method described by [32]. We then weighed 4 cm2 of YFEL segment which was followed by infiltration with 350 mOsmol isotonic sorbitol (0.28 M). The YFEL segments were centrifuged at 2000× g for 15 min at 10 °C. Ammonium was measured as described above.

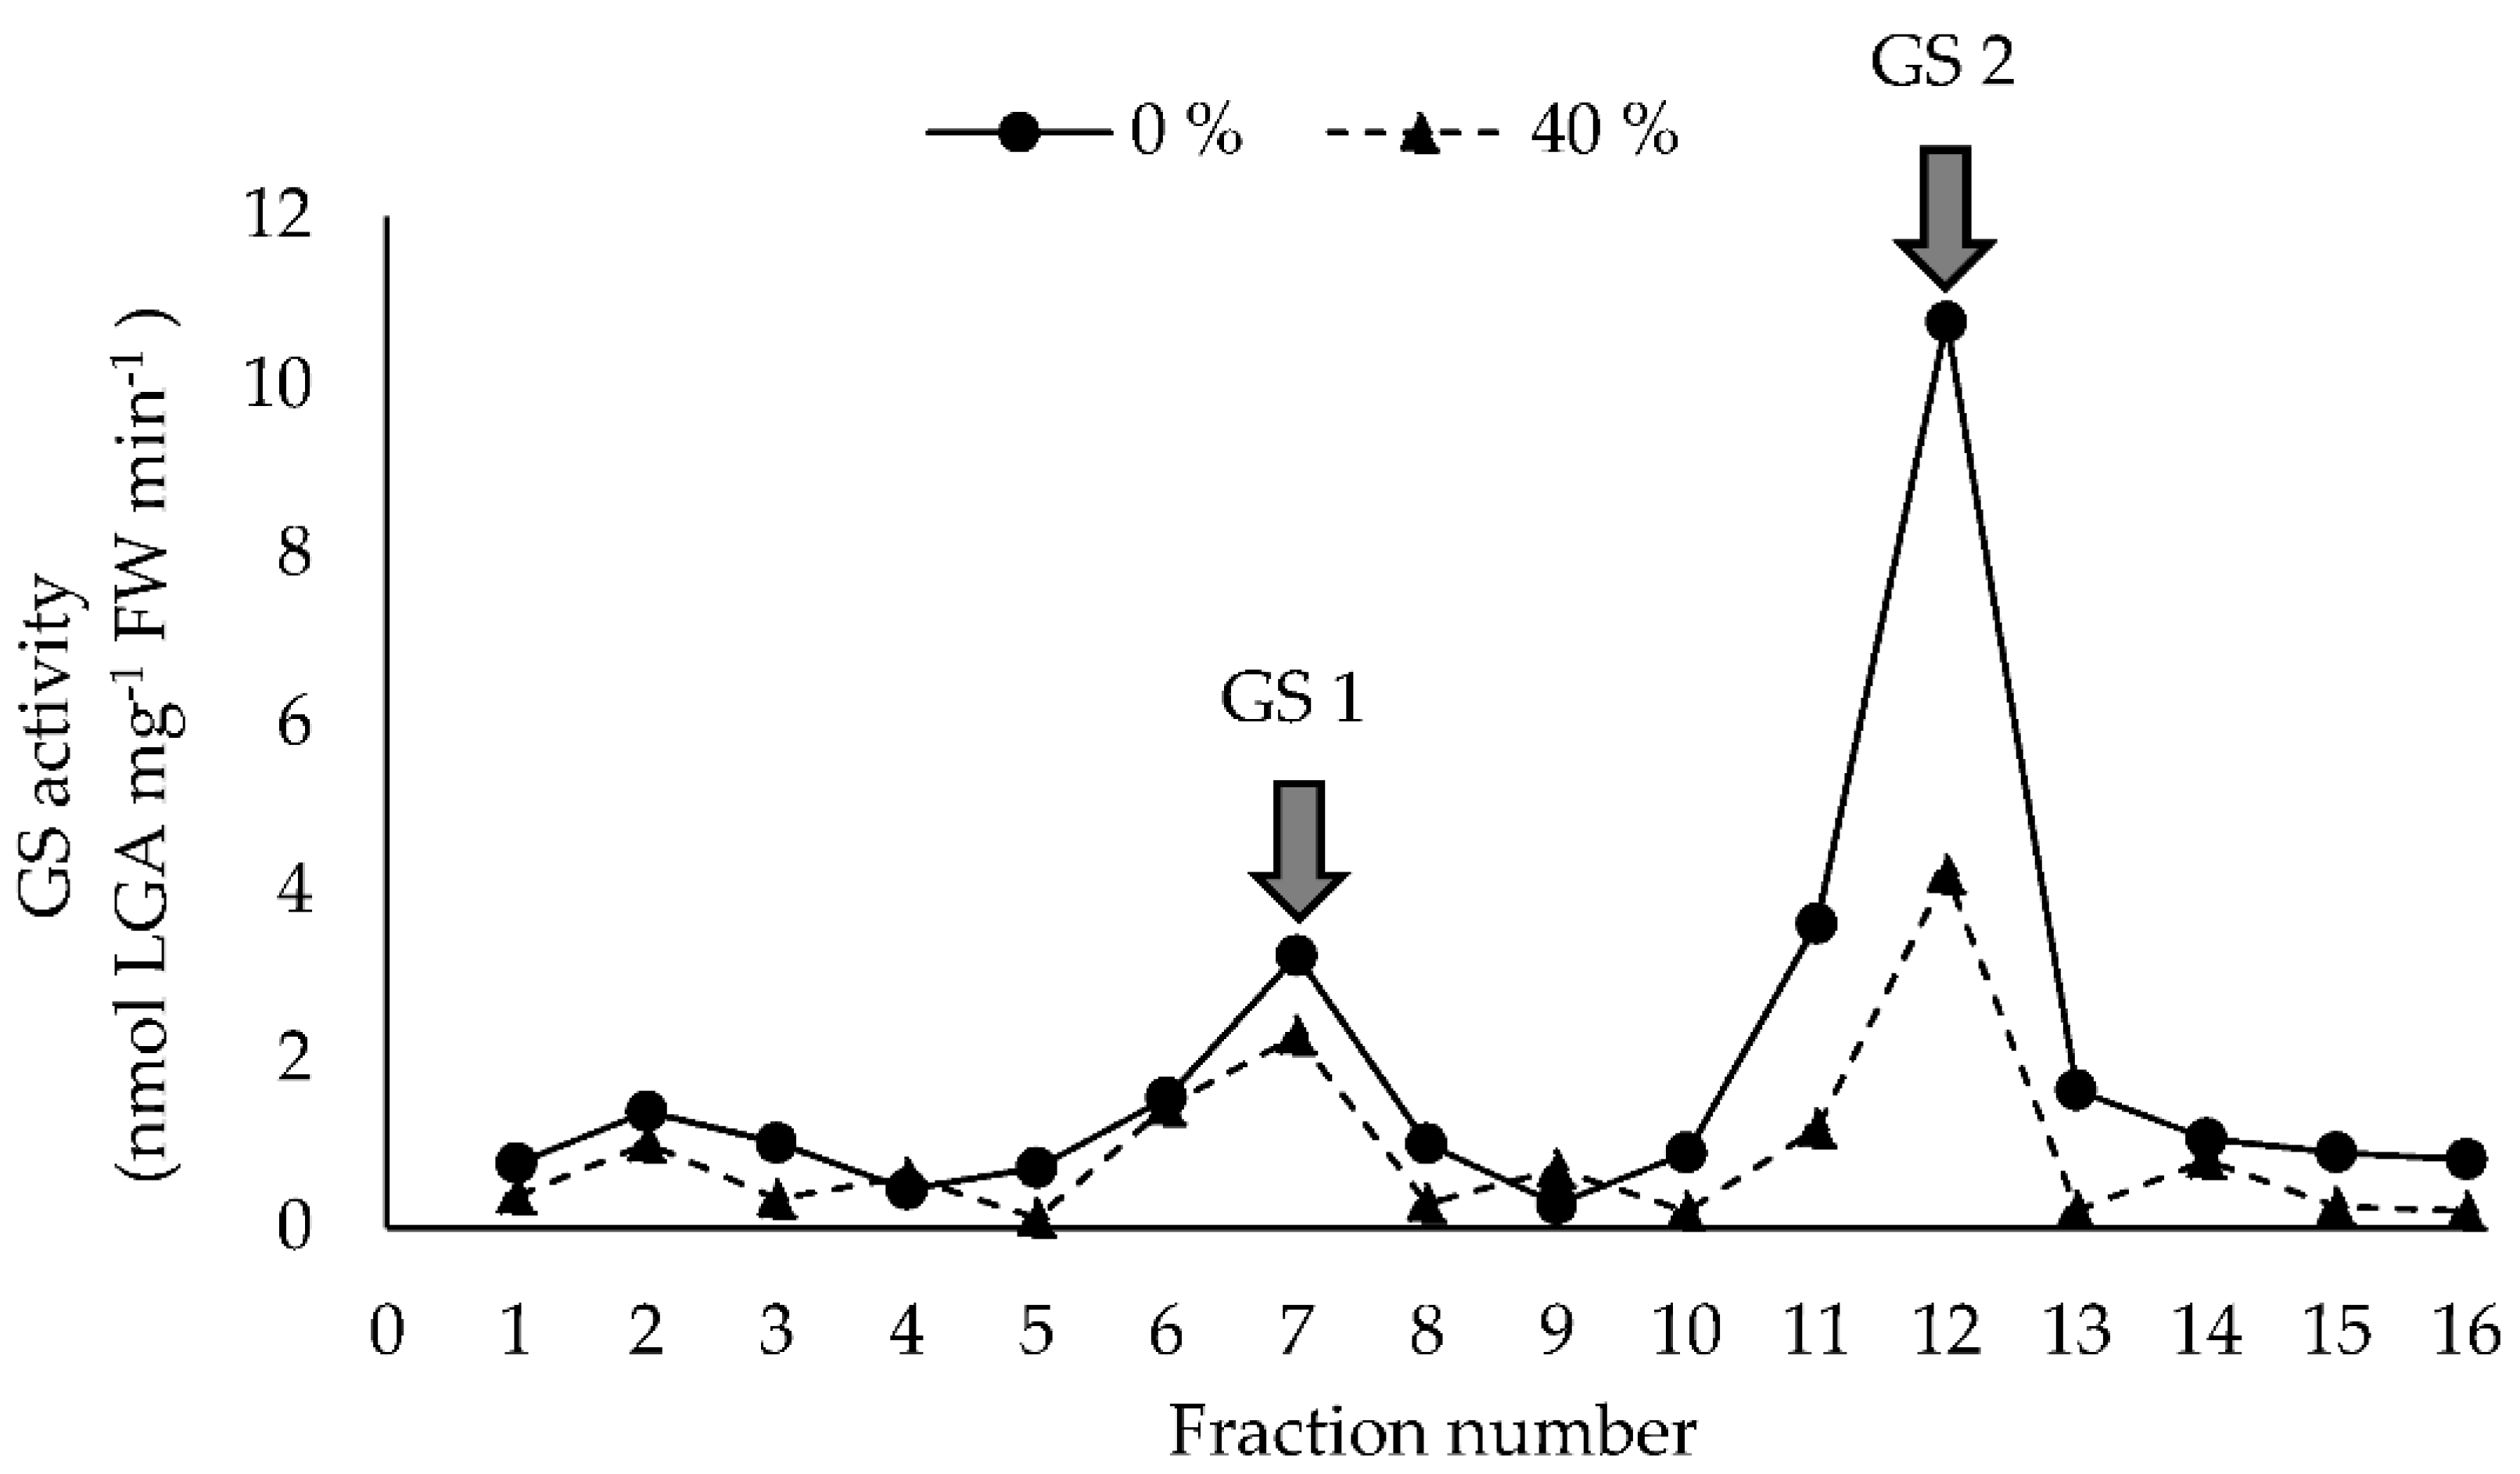
2.5. Total Glutamine Synthetase and Specific GS1 and GS2 Activity

We extracted 0.1 g of homogenized leaf sample in 1 mL of buffer containing 5 mM glutamate, 1 mM EDTA, 10 mM MgSO4, 100 mM triethanol-amine, 10% (v/v) ethylene glycol, 6 mM DL-dithiothreitol, and 10 µM leupeptin at pH 7.6. The homogenates were centrifuged at 21,000× g for 30 min at 4 °C and the supernatant was analyzed based on the method described by [33]. One hundred microliters of supernatant was incubated with 380 µL assay mix (20 mM MgSO4, 100 mM triethanol-amine, 80 mM glutamate, 4 mM EDTA, and 6 mM hydroxylammonium chloride at pH 7.6) for 10 min at 30 °C. The reaction was started by adding 20 µL of 0.2 M ATP and, after 10 min, it was stopped by the addition of 500 µL stop solution (0.1 M ferric chloride, 1 M HCl, and 0.24 M TCA). Blank controls were obtained by omitting the addition of ATP. The solutions were centrifuged at 10,000× g for 5 min and the L-glutamic acid γ-monohydroxamate (LGA) was spectrophotometrically quantified at 505 nm absorbance (Eon, BioTek microplate reader, Winooski, VT, USA). Synthetic LGA was also used to prepare the calibration standards.
In the first experiment, the specific GS1 and GS2 activities were also evaluated after separation by fast protein liquid chromatography (FPLC). We injected 250 μL of the supernatant containing crude protein extract into a Mono Q anion-exchange column (5/50 GL; GE Healthcare, Brøndbyvester, Denmark) connected to the FPLC system (ÄKTA, GE Healthcare, Brøndbyvester, Denmark). The entire FPLC system was kept in a cold room at 4 °C. The column was pre-equilibrated with equilibration buffer (25 mM Tris-HCl, 10 mM MgCl2, 1 mM DTT and 5% (v/v) glycerol at pH 7.0) before loading. Proteins were separated on the column using two linear gradients from 0.168 to 0.246 M NaCl and 0.246 to 0.390 M NaCl at a flow rate of 0.3 mL min−1. Thirty fractions of 300 µL were collected per analytical run. The first six fractions after equilibration contained no GS proteins and were not included in the results. GS activity was assayed by the transferase reaction, which measures the ability of GS to replace the g-amino group of glutamine (Gln) with hydroxylamine in the presence of ADP and Na-arsenate [34]. We mixed 100 µL of the collected fractions with 100 µL transferase reaction buffer (80 mM Tris-HCl, pH 6.4, 64 mM Gln, 16 mM hydroxylamine, 2.24 mM MnC12, 0.24 mM ADP, and 25 mM sodium arsenate dibasic) which was then incubated at 30 °C for 60 min. Blank controls were obtained by omitting the addition of ADP and Na-arsenate dibasic to the transferase reaction buffer. The stop solution (0.12 M FeCl3, 36.4 mM TCA, and 2 M HCl) was added and the LGA product was spectrophotometrically quantified at 540 nm (FLUOstar Galaxy, BMG Labtech, Cary, NC, USA). Synthetic LGA was also used to prepare calibration standards.

2.6. Urease Activity

Urease activity was analyzed in the leaf samples of the second experiment. The extraction was based on the method described by [35]. We incubated 0.2 g of homogenized leaf sample with 8 mL buffer (216 mM urea, 5% (v/v) n-propanol, 0.2 M NaH2PO4, 0.5 M Na2HPO4) at 30 °C for 3 h, shaking every 3 min. To remove small particles, 1 mL of the supernatant was filtered through a 0.45 µm nylon filter (Q-Max® RR Syringe filters; filter diameter = 13 mm). We mixed 0.5 mL of the filtered supernatants with 2.5 mL of the first reagent (0.1 M phenol, 170 µM sodium nitroprusside) and 2.5 mL of the second reagent (125 mM NaOH, 150 mM Na2HPO4 × 12H2O, 3% (v/v) NaOCl), carefully shaking the samples after the addition of each reagent [36]. The tubes were thereafter capped and the supernatant solutions incubated at 37 °C for 35 min. The absorbance of the solutions was spectrophotometrically measured at 625 nm (Eon, BioTek microplate reader, Winooski, VT, USA) and quantified based on a standard curve obtained by using NH4Cl (Merck, Søborg, Denmark).

2.7. Total-N and Amino Acid Concentrations

Leaf samples were freeze-dried for 48 h followed by grounding in the ball mill. For total-N, 40 mg of homogenized dried leaf sample was weighed in a tin capsule, adding the same amount of tungsten. Afterward, the total-N concentration was determined by Dumas combustion (Vario Macro elemental analyzer, Hanu, Germany) [37].
Free amino acids were determined in the first experiment, while total amino acids were determined in the second experiment. Free amino acid concentrations were quantified in 0.25 g of homogenized leaf sample extracted in 2.5 mL of 10 mM formic acid [30]. Amino acids were separated with an HPLC system (Nova-Pak C18 bonded silica guard column and AccQ-Tag column, both from Waters A/S., Taastrup, Denmark) after derivatization with 6-aminoquinolyl-N-hydroxysuccinimidyl-carbamate according to [38]. Total concentrations of amino acids were quantified in 0.2 mg of homogenized dried leaf sample, weighed into a 10 mL headspace vial, with the addition of 3 mL of hydrolysis mixture (6 M HCl with 0.1% phenol). The vials were capped with a crimp lid and sealed. Afterwards, the vials were placed in a preheated oven at 110 °C for 24 h. After cooling, samples were neutralized with 3 mL of 6 M NaOH, capped with rubber lids, and shaken. One microliter of hydrolyzed solution was filtered through a 0.45 µm nylon filter (Q-Max® RR Syringe filters; filter diameter 13 mm). Five microliters of hydrolyzed and filtered solution was used to determine and quantify the amino acid by chromatography system (UPLC), as described by [39].

2.8. Gas Exchange Parameters

Gas exchange parameters were evaluated by measurements of the middle section of the YFEL not affected by leaf scorching. A CIRAS-3 portable photosynthesis system (PP Systems, Amsbury, MA, USA) was used for the measurements that were carried out between 9:00 and 15:00 h. The measured parameters were: internal CO2 concentration in the stomatal cavity (Ci); stomatal conductance (gs); vapor pressure deficit (VPD); net photosynthesis rate (A); transpiration rate (E); and instantaneous water use efficiency (WUE; net photosynthesis A divided by transpiration E). The leaf chamber CO2 concentration (400 μmol mol−1), relative air humidity (65%), and leaf temperature (22 °C) were set and maintained using an automatic control device on the CIRAS-3. Red–blue light (90%: 10%; light intensity of 300 μmol m−2 s−1) was provided by the LED light unit in CIRAS-3. Data were recorded after equilibration to a steady state.

2.9. Statistical Analysis

The data from the first experiment were analyzed as a two-factor completely randomized design (N treatments and evaluation time) with three biological replicates, and the data from the second experiment were analyzed as a one-way completely randomized design with four biological replicates. The mean values were analyzed by the F test (p < 0.05), and significant differences among the means were compared by Tukey’s post hoc test (p < 0.05), using the package agricolae [40]. Data variability was indicated with standard error. Charts were made using Microsoft Excel (Microsoft, Redmond, WA, USA). Pearson correlation analysis was also performed in both experiments, using the package corrplot [41] and canonical discriminant analysis was performed in the second experiment using the package candisc [42]. All statistical analyses were performed using the R software version 4.1.0 [43].

3. Results

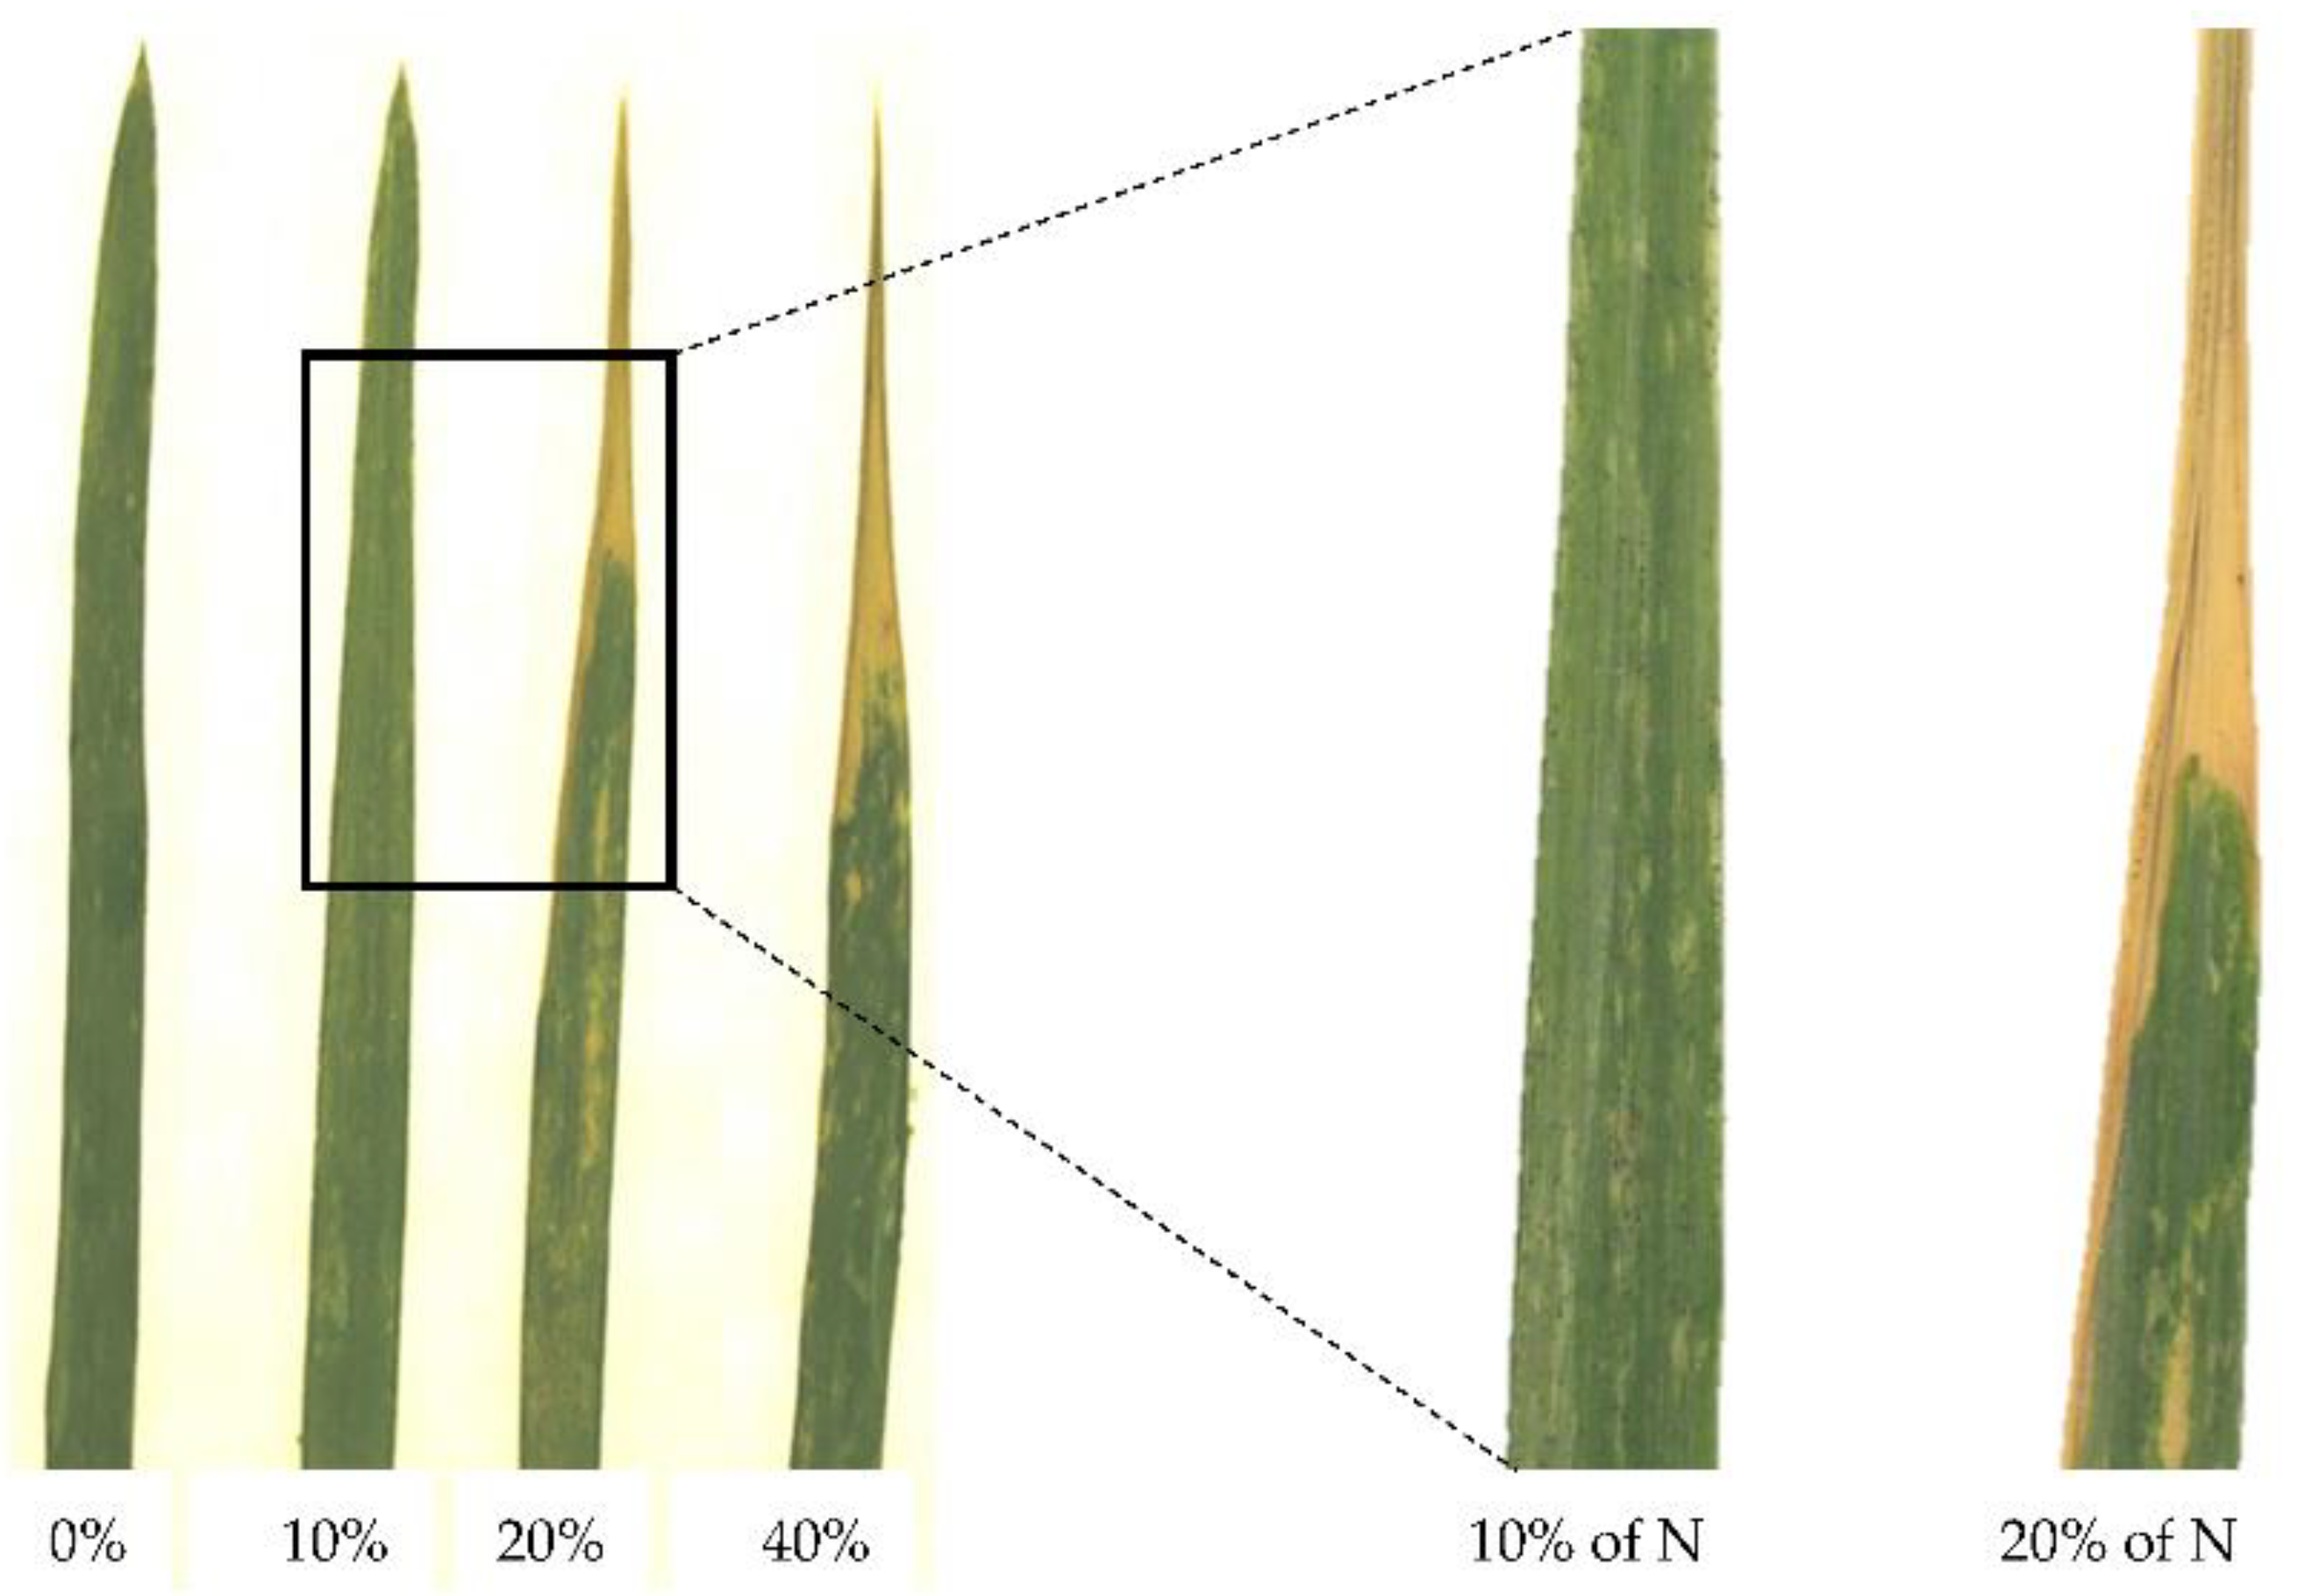
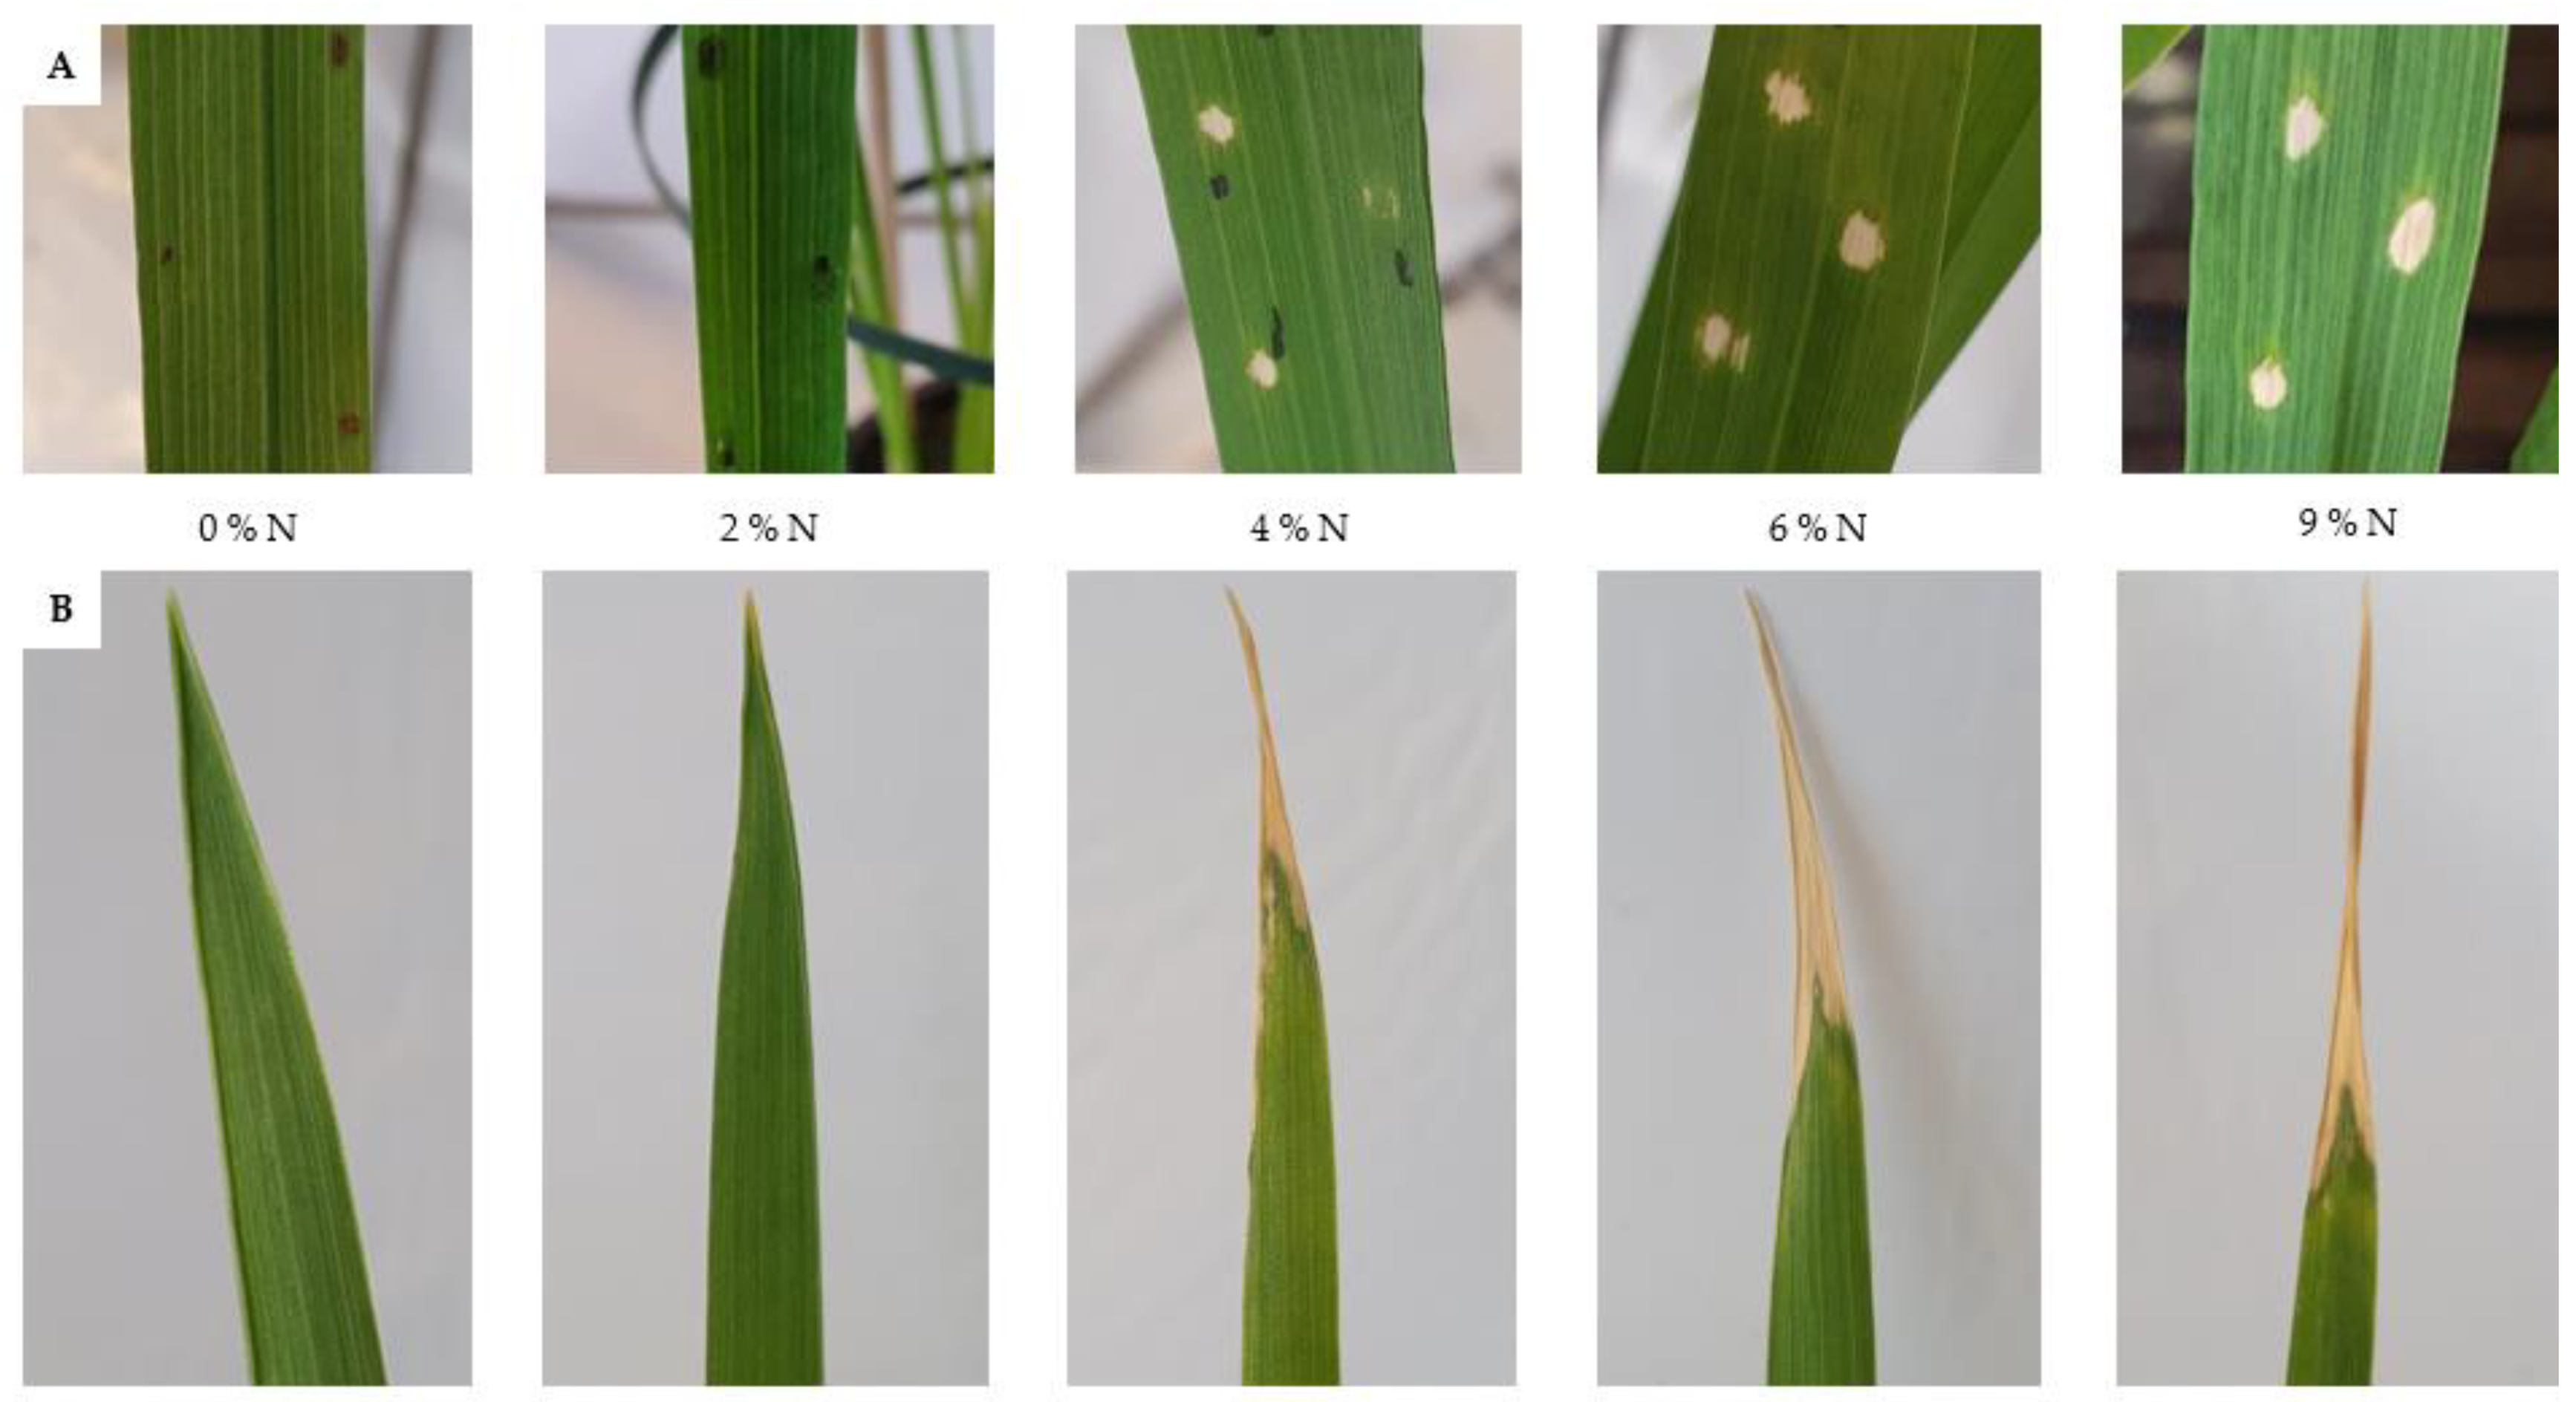
3.1. Leaf Scorching Characterization

To understand the physiological processes underlying leaf scorching in wheat, two experiments were carried out in a greenhouse with controlled climate.
In the first experiment, plants sprayed with 5 or 10% of N as UAN solution without surfactant showed no visual signs of scorching at the tip of the leaves, and looked very similar to the control plants (Figure 1). However, UAN solutions containing 20 or 40% of N gave rise to leaf scorching that extended from the tip of the leaf and covered approximately 20% of the leaf blade 24 HAFNf (Figure 1).
In the second experiment, three droplets of urea in concentrations of 0, 2, 4, 6, or 9% of N with surfactant was pipetted onto the middle section of the adaxial surface of the YFEL (Figure S1B). In the leaves treated with 4, 6, and 9% of N as urea solution, scorching underneath the droplets was observed already 1 DAFNf (Figure 2A). The scorching intensity was N concentration-dependent, and clearly more severe in the 9% N treatment compared to the 4% N treatment (Figure 2A). In the 9% N treatment, incipient scorching (dark green) was also observed at the tip of the leaf (Figure 2B). At 3 DAFNf (Figure S2), scorching caused by the urea solutions was very clearly observed underneath the droplets as well as at the tip of the leaves in the 4, 6, and 9% N treatments. Scorching at the tip of the leaf in the 9% N treatment was still more severe than that in the 6% N treatment, while in the 4% N treatment, scorching was only observed at the leaf margins. For the urea solution with 2% of N, no scorching was observed, neither underneath the droplets nor at the tip of the leaf, which looked similar to the control plants. At 5 DAFNf (Figure 3), the scorching in the 6 and 9% N treatments at the tip of the leaf increased compared to the scorching at 3 DAFNf. There was also an increase in the scorching area from the 4% N treatment (5 DAFNf), compared to 3 DAFNf, now being not only localized at the leaf margins, but also appearing in the central parts of the tip.

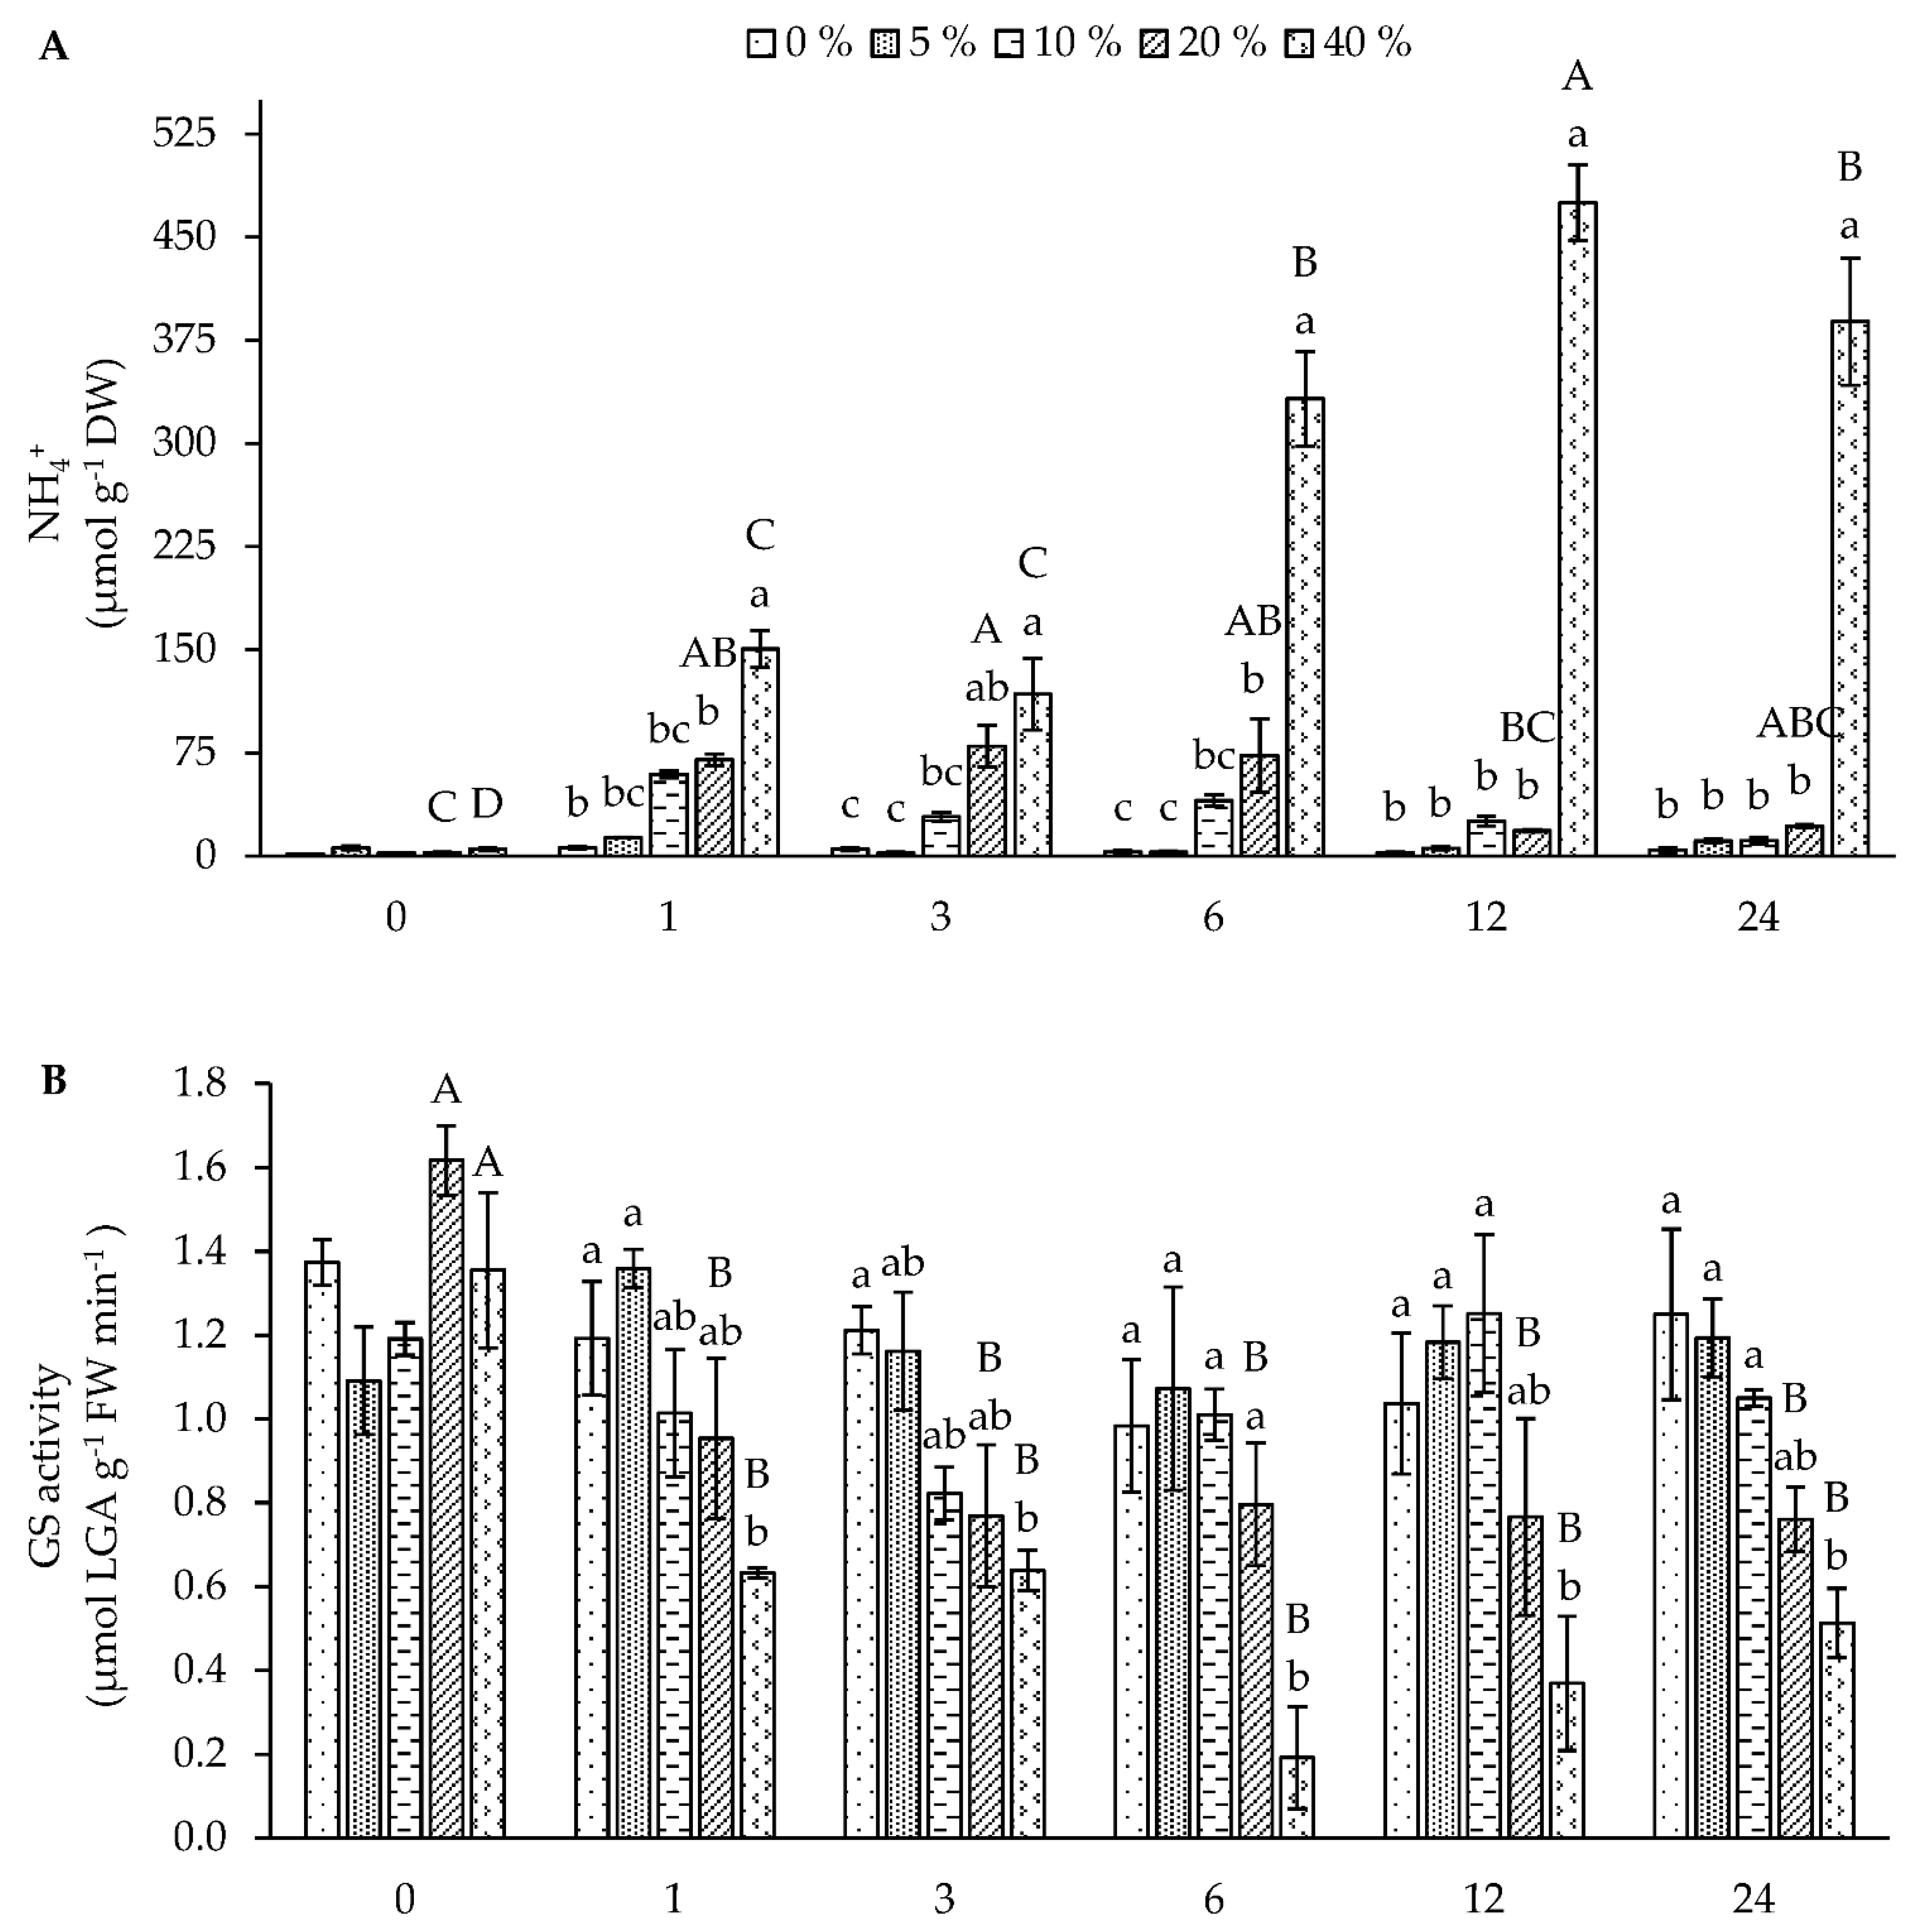
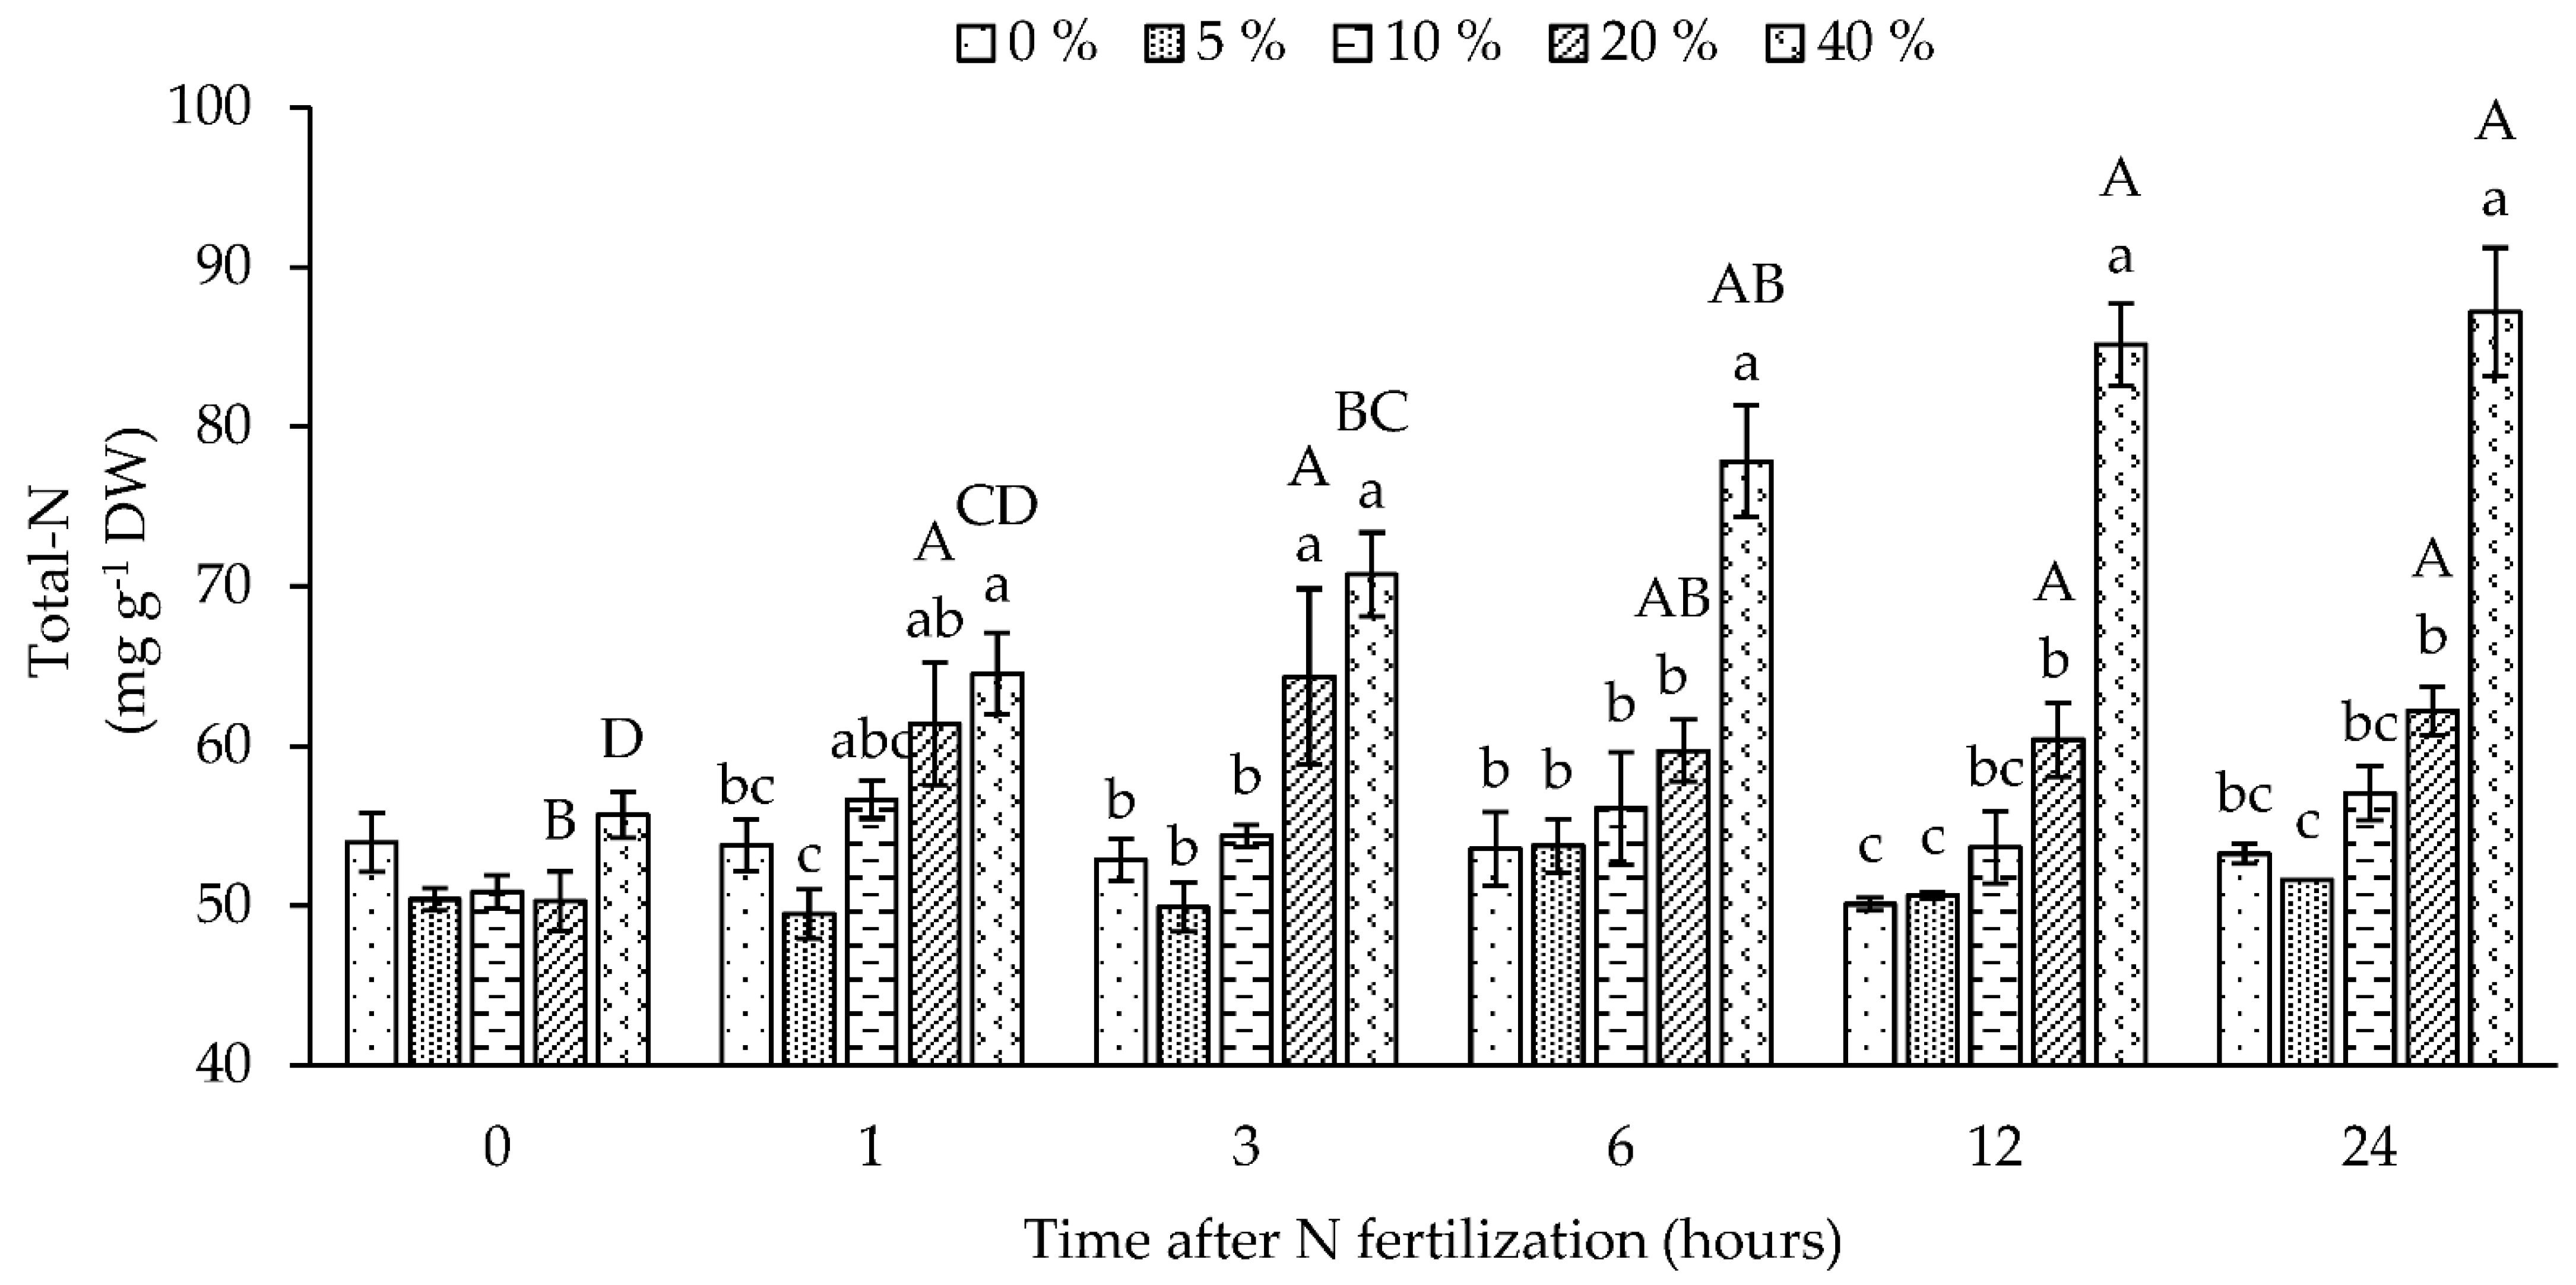
3.2. Absorption and Assimilation of Foliar Applied Nitrogen

3.2.1. Short-Term Foliar N-Fertilization Responses (First Experiment)

UAN solutions with a high N concentration (20 or 40%) sprayed without surfactant resulted in a quick N absorption, increasing the total-N concentration in the leaves already at 1 HAFNf (Figure 4). Thereafter, the total-N concentration remained steady in the leaves sprayed with 20% of N UAN solution, while the 40% N treatment achieved the highest value at 12 HAFNf (85.1 mg g−1). The 5 and 10% N treatments did not increase the total-N concentration in the leaves during 24 h (on average, 50.9 and 54.8 mg g−1, respectively), similar to the total-N concentration in the control treatment (on average 52.9 mg g−1) (Figure 4).
Measurements of leaf NH4+ showed the highest concentration in the 40% N treatment (Figure 5A). In this treatment, the NH4+ concentration reached the peak value at 12 HAFNf, followed by a 20% decrease towards 24 HAFNf. The 20% N treatment resulted in the second highest NH4+ concentration in the leaves, peaking at 3 HAFNf and thereafter decreasing. As was the case for the total-N concentration, the 5 and 10% N treatments did not cause any significant increase in NH4+ concentration. The apoplastic NH4+ concentration reached a high value >1 mM in the 20% and 40% N treatments (Figure S3).
Ammonium assimilation in plants is catalyzed by the GS enzyme, incorporating NH4+ into glutamine (Gln). Unexpectedly, the GS activity dropped in plants sprayed with 20 and 40% N treatments already at 1 HAFNf (Figure 5B), but remained similar to the control treatment in the 5 and 10% N treatments (Figure 5B). The GS activity remained low in the 20 and 40% N treatments during the experimental period. In order to decipher the decline in GS activity, the individual activities of the GS isoenzyme GS1 (localized in the cytosol) and GS2 (localized in the chloroplast) were also evaluated at 6 HAFNf in the control and 40% N treatment. These measurements revealed that the foliar N-fertilization promoted a large (61%) decline in GS2 activity, while GS1 activity was reduced by 29.5% (Figure 6).
In order for the GS isoforms to continuously function in the leaves, an adequate supply of substrate is needed. The main substrates for GS are NH4+ and the amino acid glutamate (Glu). Since the GS activity reached a low value in the 40% N treatment at 6 HAFNf, the quantification of free amino acids was performed. These measurements showed that the total free amino acid concentration increased in the leaves fertilized with UAN solution (Figure 7A). The highest value was obtained in the 10% N treatment (2.4 and 5.1 times higher than the mean value of 20 and 40% N treatment and the control, respectively). The free Glu concentration followed the same distribution pattern as the total concentrations of free amino acids, but did not differ between N treatments, while the Gln concentration increased in the 10 and 20% N treatments, enhancing the ratio of Gln:Glu in the pool of free amino acids (Figure 7A). In the 40% N treatment, the total concentration of free amino acids was dominated by an increase in the asparagine (Asn) concentration. Expressed on a relative basis to the total concentration of amino acids, Glu decreased with the N concentration in the applied UAN solution, while Gln increased in the 20 and 40% N treatments and Asn increased in the 40% N treatment (Figure 7B).
Pearson correlation was performed at 6 HAFNf, when total-N, NH4+, and amino acids concentration, as well as GS activity, were evaluated in the youngest and second youngest fully expanded leaves. The leaf NH4+ concentration was positively correlated with Asn (R2 = 0.95) and total-N (R2 = 0.95) but correlated negatively with the GS activity (R2 = −0.86) (Figure 8). GS activity was negatively correlated with Asn (R2 = −0.84) and total-N (R2 = −0.87).
Before the sampling of the wheat leaves, net photosynthesis, transpiration rate, and stomatal conductance were also measured in the youngest and second youngest fully expanded leaves of plants in the control and 20% N treatments. The latter N treatment was chosen because it was the lowest N concentration of the UAN solution which caused leaf scorching (Figure 1). Net photosynthesis (Figure 9) as well as the stomatal conductance (Figure S4) decreased in the plants following foliar fertilization with 20% N treatment already at 3 HAFNf, while no difference was observed in the transpiration rate.

3.2.2. Long-Term Foliar N-Fertilization Responses (Second Experiment)

Steady-state leaf N assimilation after foliar N-fertilization with urea was studied by the analysis of the middle section of the YFEL above the part of the leaf blade where the N droplets were applied. The samples were collected 7 DAFNf when there was no longer an increase in leaf scorching at the tip of the leaf.
Total-N and amino acid concentrations in the YFEL were highest in the control plants, while leaves fertilized with different urea-N concentrations on average had 27 and 26% lower total-N and amino acid concentration, respectively, irrespectively of the applied N concentration (Table 1). The same pattern was observed for the glutamate + glutamine (Glx) concentration, where the highest value was measured in the control plants, decreasing by 26% on average in the plants fertilized with urea (Table 1). However, the percentage of Glx in the total amino acid pool did not differ among treatments, constituting on average 11% (Figure S5). On the other hand, the NH4+ concentration in the YFEL increased with the N concentration in the applied urea solution with the highest NH4+ concentration occurring in the 9% N treatment (Table 1). The decrease in total-N and amino acid concentration and the increase in NH4+ concentration in the upper part of the leaves where urea was applied shows that the resulting scorching triggered significant N remobilization.
The activity of urease was not affected by the N concentration in the applied urea solution (Table 1). However, there was a difference between the N treatments in GS activity (Table 1).
Discriminant and Pearson correlation analysis were also used to evaluate the plant response to foliar N-fertilization in the second experiment. The leaf NH4+ concentration was positively correlated (R2 = 0.72) with the N concentration in the urea solution, while the total leaf N concentration correlated negatively (R2 = −0.51) (Table 2). The same pattern was evident in the multivariate analysis, in which the canonical discriminant variable (CDV) (Can1 + Can2) explained 89.1% of the results (Figure S6). According to the CDV, the leaf NH4+ concentration was the most important parameter. The CDV indicated that increasing N concentration in the urea solution promoted an increase in GS activity as well as in NH4+ concentration, while causing a decrease in the other evaluated leaf parameters (Figure S6). In the second experiment, no difference was observed between N treatments in the gas exchange parameters (Table S1).

4. Discussion

4.1. Leaf Scorching Is Promoted by NH4+ Accumulation

N-fertilizer is usually applied as a soil dressing to wheat crops. The NUE of soil-applied N-fertilizer is generally low (~30–40%) in the first year after application due to soil immobilization, leaching, and gaseous emissions [44]. Foliar N-fertilization has the potential to improve fertilizer-NUE. However, leaf scorching may occur after foliar N-fertilization [23,45,46], as was also observed and characterized in the present work (Figure 1 and Figure 3). The scorching appeared as chlorosis of the leaf tip, where NH4+ accumulation is driven by the transpiration stream [47]. Leaf tissue scorching has in previous studies been attributed to weather conditions, N concentration in the applied solution (osmotic effect), and N uptake rate [48,49,50], but the metabolic processes accompanying leaf scorching in wheat were not revealed [51]. In our study, we demonstrated that high NH4+ concentration in the leaf tip may promote the deterioration of the chloroplasts (Figure 1 and Figure 3) [52,53], decreasing the GS2 activity (Figure 6) and the rate of photosynthesis (Figure 9).
Urea has been used as an N source for foliar N-fertilization due to its quick absorption, resulting in high recoveries of the applied N-fertilizer within a few hours, as demonstrated in apple [54], grass [55,56], sugarcane [57], tea [58], tomato [49], and wheat [59]. Being a small and neutral molecule with high solubility, urea rapidly penetrates the leaf cuticle by lipophilic [45,60] and stomatal pathways, the latter facilitated by aquaporins [61,62,63,64]. Inside the leaf, urea hydrolysis is catalyzed by urease, an enzyme that is constitutively present in the plant tissue [65]. A very small part of the foliar-applied urea may be hydrolyzed to ammonia and carbon dioxide by urease on the leaf surface [56,59,63]. This reaction can be attenuated by the addition of a urease inhibitor to the applied solution but may increase the concentration of urea in the leaf and enhance the scorching of the leaf tip [48]. Other N sources such as sodium nitrate, ammonium sulfate and urea–ammonium nitrate may cause more severe leaf scorching than urea [49,50], suggesting that ammonium toxicity is promoted by the lack of balance between N uptake and assimilation [51,66,67].
Ammonium toxicity has previously been reported in plants growing in soil or solution with high NH4+ concentration [67,68,69]. However, the processes underlying NH4+ toxicity after foliar N-fertilization are still not fully elucidated. Ammonium in non-senescing leaves is predominantly assimilated via the chloroplastic glutamine synthetase (GS)/glutamine-2-oxoglutarate aminotransferase (GOGAT) cycle, converting NH4+ into Gln which subsequently delivers N to other compounds, e.g., amino acids and proteins [70,71]. The GS is represented by two isoforms, distinguished by their location; GS1 is located in the cytosol, while GS2 is located in the chloroplasts [33]. For the continuous functionality of this enzyme complex, Glu is required in addition to NH4+ and acts as a biochemical regulator of GS2 [72].
We quantified the NH4+ concentration in the youngest fully expanded leaf (Figure 5 and Table 1) and observed a close relationship between leaf scorching and elevated NH4+ concentration (Figure 5 and Figure S5). Surprisingly, elevated NH4+ concentration was in the short-term accompanied by a decline in chloroplastic GS2 activity (Figure 6). This may be due to the acidic stress caused by an abundance of protons released during NH4+ assimilation in the chloroplasts [52,68,73,74]. In our short-term evaluation (first experiment), foliar N-fertilization not only increased the free NH4+ in the leaves but also decreased the proportion of Glu in the total pool of free amino acids (Figure 7). Thus, along with acidification, a temporary depletion of free Glu may occur, increasing the ratio of Gln:Glu (Figure 7) [73], further inhibiting GS activity. A continued increase in the NH4+ concentration in the leaf intensified the NH4+ toxicity, as shown in the 40% N treatment (Figure 1). Stress induced by NH4+ accumulation activates the asparagine synthetase pathway [75,76,77,78]. The stimulated synthesis of Asn (Figure 7) increases the N transport to the other plant tissues, reflecting that Asn together with Gln are major forms of N translocated in phloem [75,79]. Observed over a longer time span, GS activity may recover (Table 1).
The long-term response experiment (second experiment) showed only very small differences in the N assimilation and no differences in gas exchange parameters between N treatments. However, an increase in the leaf senescence rate mediated by N treatment was observed (Figure 3). This indicates that the high NH4+ concentration in leaves caused premature senescence, increasing nitrogen remobilization (Table 1; [80,81]). An elevated concentration of ethylene and reactive oxygen species may contribute to the NH4+-induced senescence [66,82,83,84]. During abiotic stress, plants activate the defense machinery to survive allowing the maintenance of physiological activities [85,86,87], as also shown by our data on photosynthesis (Table S1) and nitrogen assimilation capacity, where the GS activity recovered 7 DAFNf (Table 1) after the initial decline during the first hours after foliar fertilization (Figure 5). Conversely, an abundant supply of N via the roots may delay leaf senescence and maintain photosynthesis and plant growth [88,89]. Thus, there seems to be a limit for how much N can be applied to the leaves, irrespective of the N source, without causing NH4+ toxicity.

4.2. Future Remarks

The results of the present study show that foliar N-fertilization caused leaf tip scorching due to the accumulation of NH4+. This accumulation of NH4+ was coupled with the decreasing activity of both the chloroplastic (GS2) and cytosolic (GS1) isoforms of glutamine synthetase, most pronouncedly that of GS2. The decline in GS2 may partly reflect a disruption of chloroplast integrity caused by the acidification triggered by NH4+ assimilation. Thus, to improve fertilizer-NUE and reduce the risks of leaf scorching associated with foliar N-fertilization, GS1 will be important in order to mitigate NH4+ accumulation in the leaf tip [71]. GS1 activity in green leaves is lower than that of GS2 [90], but the upregulation of GS1 may nevertheless be important for mitigating NH4+ toxicity as demonstrated in Arabidopsis [73,91].The accumulation of NH4+ along with the decline in GS activity and in the proportion of Glu in the pool of free amino acids (Figure 7) suggest that the maintenance of amino acid homeostasis might be a problem. In this context, silicon (Si) fertilization can bring benefits by increasing the redistribution of amino acids, e.g., Gln [92,93]. Foliar Si fertilization before foliar N-fertilization might accordingly mitigate NH4+ toxicity as already demonstrated in tomato and eucalyptus plants [94,95]. The co-supply of Glu and/or carbohydrates (e.g., sucrose) and/or modifications of the N assimilation pathway [76,84,96,97,98,99] might also decrease NH4+ accumulation reducing leaf scorching.

Supplementary Materials

The following are available online at https://www.mdpi.com/article/10.3390/agronomy12061405/s1, Figure S1. A. Spring wheat plant before foliar nitrogen fertilization (5-week-old) in the second experiment; B. The microliters of urea solution with surfactant droplets applied onto the middle section of the adaxial surface of the youngest fully expanded leaf (YFEL); Figure S2. Nitrogen toxicity occurring 3 days after application of urea solution with surfactant onto the YFEL of wheat (cv. Harenda). Three droplets of each 3 µL urea solution with concentration of 0, 2, 4, 6, or 9% N was pipetted onto the middle section of the adaxial surface of the YFEL: A. Scorching underneath the droplets; B. Scorching at tip of the leaf; Figure S3. Apoplastic ammonium concentration (NH4+) of the youngest and second youngest fully expanded leaves of wheat (cv. Amaretto) at 0, 1, 3, 6, 12, and 24 h after the application of UAN solutions with increasing N concentration, namely 0, 5, 10, 20, and 40% N. Figure S4. Transpiration rate and stomatal conductance of the youngest and second youngest fully expanded leaves of spring wheat (cv. Amaretto) after foliar fertilization with UAN solution (20% of N in solution) and in control plants (without foliar N-fertilization) at 0, 3, 6, 12, and 24 h after foliar N-fertilization. Data are the means of three independent biological replicates ± standard error; small letters indicate difference between N treatments in each evaluation time, and capital letters indicate the difference between evaluation times in each N treatment, according to Tukey’s post hoc test (p < 0.05); Figure S5. The percentage of amino acids in total amino acid quantified in the YFEL of spring wheat (cv. Harenda) at 7 days after the application of urea solution with surfactant onto the YFEL. Data are the means of four independent biological replicates. “Glx” is the sum of glutamine and glutamate. “Others” are the sum of histidine, hydroxyproline, proline, serine, threonine, and tyrosine; Figure S6. Canonical discriminant analysis of N parameters analyzed in the YFEL of spring wheat (cv. Harenda) foliar fertilized with urea with surfactant in different N concentrations at 7 days after foliar N-fertilization; Table S1. Gas exchange parameters (Ci—internal CO2 concentration in stomatal chamber; gs—stomatal conductance; VPD—vapor pressure deficit; A—photosynthesis rate; E—transpiration rate; and WUE—water use efficiency) of the YFEL of spring wheat (cv. Harenda) at 7 DAFNf.

Author Contributions

Conceptualization, J.K.S. and S.A.Q.d.C.; methodology, D.P.P., J.K.S., S.A.Q.d.C. and T.K.; investigation, S.A.Q.d.C. and T.K.; statistical analysis, S.A.Q.d.C.; writing—original draft preparation, S.A.Q.d.C.; writing—review and editing, D.P.P. and J.K.S.; supervision, D.P.P. and J.K.S. All authors have read and agreed to the published version of the manuscript.

Funding

This research was funded by the Independent Research Fund Denmark, Grant #9041-00022B to J.K.S.; S.A.Q.d.C. received a research internship abroad scholarship from São Paulo Research Foundation (FAPESP) grant #2020/11959-0.

Institutional Review Board Statement

Not applicable.

Informed Consent Statement

Not applicable.

Data Availability Statement

The data presented in this study are available on request from the corresponding author.

Acknowledgments

The authors thank the University of Copenhagen and the University of São Paulo for their collaboration and educational partnership and thank Anja Hecht Ivø for helping with the laboratory analyses; S.A.Q.d.C. thanks the São Paulo Research Foundation (FAPESP) for financial support during their research work time.

Conflicts of Interest

The authors declare no conflict of interest.

References

  1. FAO Statistics Division. Available online: http://www.fao.org/faostat/en/#data/QC (accessed on 30 March 2022).
  2. Zörb, C.; Ludewig, U.; Hawkesford, M.J. Perspective on wheat yield and quality with reduced nitrogen supply. Trends Plant Sci. 2018, 23, 1029–1037. [Google Scholar] [CrossRef] [Green Version]
  3. Shewry, P.R.; Hey, S.J. The contribution of wheat to human diet and health. Food Energy Secur. 2015, 4, 178–202. [Google Scholar] [CrossRef] [PubMed]
  4. Reeves, T.; Thomas, G.; Ramsay, G. (Eds.) Save and Grow in Practice: Maize, Rice and Wheat - A Guide to Sustainable Cereal Production; FAO: Rome, Italy, 2016; ISBN 978-92-5-108519-6. [Google Scholar]
  5. Shiferaw, B.; Smale, M.; Braun, H.J.; Duveiller, E.; Reynolds, M.; Muricho, G. Crops that feed the world 10. Past successes and future challenges to the role played by wheat in global food security. Food Secur. 2013, 5, 291–317. [Google Scholar] [CrossRef] [Green Version]
  6. Senapati, N.; Semenov, M.A. Assessing yield gap in high productive countries by designing wheat ideotypes. Sci. Rep. 2019, 9, 5516. [Google Scholar] [CrossRef] [PubMed]
  7. Guberac, V.; Marić, S.; Drezner, G.; Petrović, S.; Dvojković, K.; Brandić, V. Interrelationships of important agronomic traits and kernel yield in winter wheat. In Proceedings of the 11th International Wheat Genetics Symposium, Sydney, Australia; 2008; pp. 681–684. [Google Scholar]
  8. Oladosu, G.; Msangi, S. Biofuel-food market interactions: A review of modeling approaches and findings. Agriculture 2013, 3, 53–71. [Google Scholar] [CrossRef] [Green Version]
  9. Sims, R.E.H.; Mabee, W.; Saddler, J.N.; Taylor, M. An overview of second generation biofuel technologies. Bioresour. Technol. 2010, 101, 1570–1580. [Google Scholar] [CrossRef]
  10. Townsend, T.J.; Roy, J.; Wilson, P.; Tucker, G.A.; Sparkes, D.L. Food and bioenergy: Exploring ideotype traits of a dual-purpose wheat cultivar. F. Crop. Res. 2017, 201, 210–221. [Google Scholar] [CrossRef]
  11. Copeland, J.; Turley, D. National and regional supply/demand balance for agricultural straw in Great Britain. Natl. Non-Food Crops Cent. 2008, 17p. [Google Scholar]
  12. Jørgensen, H.; van Hecke, J.; Zhang, H.; Malik, P.L.; Felby, C.; Schjoerring, J.K. Wheat as a dual crop for biorefining: Straw quality parameters and their interactions with nitrogen supply in modern elite cultivars. GCB Bioenergy 2019, 11, 400–415. [Google Scholar] [CrossRef]
  13. Lv, X.; Ding, Y.; Long, M.; Liang, W.; Gu, X.; Liu, Y.; Wen, X. Effect of foliar application of various nitrogen forms on starch accumulation and grain filling of wheat (Triticum aestivum L.) under drought stress. Front. Plant Sci. 2021, 12, 645379. [Google Scholar] [CrossRef]
  14. Mandic, V.; Krnjaja, V.; Tomic, Z.; Bijelic, Z.; Simic, A.; Muslic, D.R.; Gogic, M. Nitrogen fertilizer influence on wheat yield and use efficiency under different environmental conditions. Chil. J. Agric. Res. 2015, 75, 92–97. [Google Scholar] [CrossRef] [Green Version]
  15. Pask, A.J.D.; Sylvester-Bradley, R.; Jamieson, P.D.; Foulkes, M.J. Quantifying how winter wheat crops accumulate and use nitrogen reserves during growth. F. Crop. Res. 2012, 126, 104–118. [Google Scholar] [CrossRef]
  16. Xue, C.; Erley, G.S.A.; Rossmann, A.; Schuster, R.; Koehler, P.; Mühling, K.H. Split nitrogen application improves wheat baking quality by influencing protein composition rather than concentration. Front. Plant Sci. 2016, 7, 738. [Google Scholar] [CrossRef] [PubMed] [Green Version]
  17. Rossmann, A.; Buchner, P.; Savill, G.P.; Hawkesford, M.J.; Scherf, K.A.; Mühling, K.H. Foliar N application at anthesis alters grain protein composition and enhances baking quality in winter wheat only under a low N fertiliser regimen. Eur. J. Agron. 2019, 109, 125909. [Google Scholar] [CrossRef]
  18. Varga, B.; Svečnjak, Z. The effect of late-season urea spraying on grain yield and quality of winter wheat cultivars under low and high basal nitrogen fertilization. Field Crops Res. 2006, 96, 125–132. [Google Scholar] [CrossRef]
  19. Zhang, X.; Davidson, E.A.; Mauzerall, D.L.; Searchinger, T.D.; Dumas, P.; Shen, Y. Managing nitrogen for sustainable development. Nature 2015, 528, 51–59. [Google Scholar] [CrossRef] [Green Version]
  20. Hawkesford, M.J.; Griffiths, S. Exploiting genetic variation in nitrogen use efficiency for cereal crop improvement. Curr. Opin. Plant Biol. 2019, 49, 35–42. [Google Scholar] [CrossRef]
  21. Sylvester-Bradley, R.; Kindred, D.R. Analysing nitrogen responses of cereals to prioritize routes to the improvement of nitrogen use efficiency. J. Exp. Bot. 2009, 60, 1939–1951. [Google Scholar] [CrossRef] [Green Version]
  22. Walsh, O.S.; Shafian, S.; Christiaens, R.J. Nitrogen fertilizer management in dryland wheat cropping systems. Plants 2018, 7, 9. [Google Scholar] [CrossRef] [Green Version]
  23. Dick, C.D.; Thompson, N.M.; Epplin, F.M.; Arnall, D.B. Managing late-season foliar nitrogen fertilization to increase grain protein for winter wheat. Agron. J. 2016, 108, 2329–2338. [Google Scholar] [CrossRef]
  24. Wyatt, E.C.; Bushong, J.T.; Macnack, N.E.; Mullock, J.L.; Taylor, R.; Raun, W.R. Influence of droplet size of foliar-applied nitrogen on grain protein content of hard red winter wheat. Crop Forage Turfgrass Manag. 2017, 3, 1–10. [Google Scholar] [CrossRef]
  25. Abad, A.; Lloveras, J.; Michelena, A. Nitrogen fertilization and foliar urea effects on durum wheat yield and quality and on residual soil nitrate in irrigated Mediterranean conditions. Field Crops Res. 2004, 87, 257–269. [Google Scholar] [CrossRef]
  26. Woodard, H.J.; Bly, A. Relationship of nitrogen management to winter wheat yield and grain protein in South Dakota. J. Plant Nutr. 1998, 21, 217–233. [Google Scholar] [CrossRef]
  27. Gooding, M.J.; Davies, W.P. Foliar urea fertilization of cereals: A review. Fertil. Res. 1992, 32, 209–222. [Google Scholar] [CrossRef]
  28. Woolfolk, C.W.; Raun, W.R.; Johnson, G.V.; Thomason, W.E.; Mullen, R.W.; Wynn, K.J.; Freeman, K.W. Influence of Late-Season Foliar Nitrogen Applications on Yield and Grain Nitrogen in Winter Wheat. Agron. J. 2002, 94, 429–434. [Google Scholar] [CrossRef] [Green Version]
  29. Brown, B.; Westcott, M.; Christensen, N.; Pan, B.; Stark, J. Nitrogen Management for Hard Wheat Protein Enhancement. Available online: https://www.extension.uidaho.edu/publishing/pdf/PNW/PNW0578.pdf (accessed on 31 August 2021).
  30. Husted, S.; Hebbern, C.A.; Mattsson, M.; Schjoerring, J.K. A critical experimental evaluation of methods for determination of NH4+ in plant tissue, xylem sap and apoplastic fluid. Physiol. Plant. 2000, 109, 167–179. [Google Scholar] [CrossRef]
  31. ISO 11732:2005(en); Water Quality—Determination of Ammonium Nitrogen—Method by Flow Analysis (CFA and FIA) and Spectrometric Detection. ISO: Geneva, Switzerland. Available online: https://www.iso.org/obp/ui/#iso:std:iso:11732:ed-2:v1:en (accessed on 31 August 2021).
  32. Husted, S.; Schjoerring, J.K. Apoplastic pH and ammonium concentration in leaves of Brassica napus L. Plant Physiol. 1995, 109, 1453–1460. [Google Scholar] [CrossRef]
  33. Bernard, S.M.; Møller, A.L.B.; Dionisio, G.; Kichey, T.; Jahn, T.P.; Dubois, F.; Baudo, M.; Lopes, M.S.; Tercé-Laforgue, T.; Foyer, C.H.; et al. Gene expression, cellular localisation and function of glutamine synthetase isozymes in wheat (Triticum aestivum L.). Plant Mol. Biol. 2008, 67, 89–105. [Google Scholar] [CrossRef]
  34. Seiler, N.; Reid, J.; Knödgen, B. A sensitive method for the assay of glutamine synthetase. Neurochem. Res. 1990, 15, 301–305. [Google Scholar] [CrossRef]
  35. Hogan, M.E.; Swift, I.E.; Done, J. Urease assay and ammonia release from leaf tissues. Phytochemistry 1983, 22, 663–667. [Google Scholar] [CrossRef]
  36. McCullough, H. The determination of ammonia in whole blood by a direct colorimetric method. Clin. Chim. Acta 1967, 17, 297–304. [Google Scholar] [CrossRef]
  37. ISO 16634-2:2016(en); Food Products—Determination of the Total Nitrogen Content by Combustion According to the Dumas Principle and Calculation of the Crude Protein Content—Part 2: Cereals, Pulses and Milled Cereal Products. ISO: Geneva, Switzerland. Available online: https://www.iso.org/obp/ui/#iso:std:iso:16634:-2:ed-1:v1:en (accessed on 31 August 2021).
  38. van Wandelen, C.; Cohen, S.A. Using quaternary high-performance liquid chromatography eluent systems for separating 6-aminoquinolyl-N-hydroxysuccinimidyl carbamate-derivatized amino acid mixtures. J. Chromatogr. A 1997, 763, 11–22. [Google Scholar] [CrossRef]
  39. Dahl-Lassen, R.; van Hecke, J.; Jørgensen, H.; Bukh, C.; Andersen, B.; Schjoerring, J.K. High-throughput analysis of amino acids in plant materials by single quadrupole mass spectrometry. Plant Methods 2018, 14, 8. [Google Scholar] [CrossRef] [PubMed] [Green Version]
  40. Mendiburu, F. De Agricolae: Statistical Procedures for Agricultural Research. Available online: https://cran.r-project.org/web/packages/agricolae/index.html (accessed on 26 May 2022).
  41. Wei, T.; Simko, V. R Package “Corrplot”: Visualization of a Correlation Matrix. Available online: https://github.com/taiyun/corrplot (accessed on 26 May 2022).
  42. Friendly, M.; Fox, J. Candisc: Visualizing Generalized Canonical Discriminant and Canonical Correlation Analysis. Available online: https://cran.r-project.org/web/packages/candisc/index.html (accessed on 20 May 2022).
  43. R Core Team. R: A Language and Environment for Statistical Computing; R Project for statistical Computing: Vienna, Austria, 2021. [Google Scholar]
  44. Hawkesford, M.J.; Riche, A.B. Impacts of G x E x M on nitrogen use efficiency in wheat and future prospects. Front. Plant Sci. 2020, 11, 1157. [Google Scholar] [CrossRef]
  45. Fernández, V.; Brown, P.H. From plant surface to plant metabolism: The uncertain fate of foliar-applied nutrients. Front. Plant Sci. 2013, 4, 289. [Google Scholar] [CrossRef] [Green Version]
  46. Ferrari, M.; Dal Cortivo, C.; Panozzo, A.; Barion, G.; Visioli, G.; Giannelli, G.; Vamerali, T. Comparing soil vs. foliar nitrogen supply of the whole fertilizer dose in common wheat. Agronomy 2021, 11, 2138. [Google Scholar] [CrossRef]
  47. Gonçalves, A.Z.; Oliveira, P.M.R.; Neto, A.A.C.; Mercier, H. Thinking of the leaf as a whole plant: How does N metabolism occur in a plant with foliar nutrient uptake? Environ. Exp. Bot. 2020, 178, 104163. [Google Scholar] [CrossRef]
  48. Krogmeier, M.J.; McCarty, G.W.; Bremner, J.M. Phytotoxicity of foliar-applied urea. Proc. Natl. Acad. Sci. 1989, 86, 8189–8191. [Google Scholar] [CrossRef] [Green Version]
  49. Tan, X.W.; Ikeda, H.; Oda, M. Absorption, translocation, and assimilation of foliar-applied urea compared with nitrate and ammonium in tomato plants. Soil Sci. Plant Nutr. 1999, 45, 609–616. [Google Scholar] [CrossRef]
  50. Clapp, J.G.; Parham, T.M. Properties and uses of liquid urea-triazone-based nitrogen fertilizers. Fertil. Res. 1991, 28, 229–232. [Google Scholar] [CrossRef]
  51. Bittsánszky, A.; Pilinszky, K.; Gyulai, G.; Komives, T. Overcoming ammonium toxicity. Plant Sci. 2015, 231, 184–190. [Google Scholar] [CrossRef] [PubMed]
  52. Masclaux-Daubresse, C.; Daniel-Vedele, F.; Dechorgnat, J.; Chardon, F.; Gaufichon, L.; Suzuki, A. Nitrogen uptake, assimilation and remobilization in plants: Challenges for sustainable and productive agriculture. Ann. Bot. 2010, 105, 1141–1157. [Google Scholar] [CrossRef] [Green Version]
  53. Li, B.; Li, G.; Kronzucker, H.J.; Baluška, F.; Shi, W. Ammonium stress in Arabidopsis: Signaling, genetic loci, and physiological targets. Trends Plant Sci. 2014, 19, 107–114. [Google Scholar] [CrossRef] [PubMed]
  54. Dong, S.; Cheng, L.; Scagel, C.F.; Fuchigami, L.H. Nitrogen absorption, translocation and distribution from urea applied in autumn to leaves of young potted apple (Malus domestica) trees. Tree Physiol. 2002, 22, 1305–1310. [Google Scholar] [CrossRef] [Green Version]
  55. Stiegler, J.C.; Richardson, M.D.; Karcher, D.E. Foliar nitrogen uptake following urea application to putting green turfgrass species. Crop Sci. 2011, 51, 1253–1260. [Google Scholar] [CrossRef]
  56. Bowman, D.C.; Paul, J.L. Volatilization and rapid depletion of urea spray-applied to Kentucky bluegrass turf. J. Plant Nutr. 1990, 13, 1335–1344. [Google Scholar] [CrossRef]
  57. Trivelin, P.C.O.; de Carvalho, J.G.; da Silva, A.Q.; Primavesi, A.C.P.A.; Camacho, E.; Eimori, I.E.; Guilherme, M.R. Adubação foliar de cana-de-açúcar (Saccharum spp.): Absorção e translocação de uréia-15N. Energ. Nucl. Agric. 1988, 9, 52–65. [Google Scholar]
  58. Ruan, J.; Gerendás, J. Absorption of foliar-applied urea- 15 N and the impact of low nitrogen, potassium, magnesium and sulfur nutritional status in tea (Camellia sinensis L.) plants. Soil Sci. Plant Nutr. 2015, 61, 653–663. [Google Scholar] [CrossRef] [Green Version]
  59. Smith, C.J.; Freney, J.R.; Sherlock, R.R.; Galbally, I.E. The fate of urea nitrogen applied in a foliar spray to wheat at heading. Fertil. Res. 1991, 28, 129–138. [Google Scholar] [CrossRef]
  60. Fernández, V.; Gil-Pelegrín, E.; Eichert, T. Foliar water and solute absorption: An update. Plant J. 2021, 105, 870–883. [Google Scholar] [CrossRef]
  61. Heinen, R.B.; Bienert, G.P.; Cohen, D.; Chevalier, A.S.; Uehlein, N.; Hachez, C.; Kaldenhoff, R.; Le Thiec, D.; Chaumont, F. Expression and characterization of plasma membrane aquaporins in stomatal complexes of Zea mays. Plant Mol. Biol. 2014, 86, 335–350. [Google Scholar] [CrossRef] [PubMed]
  62. Dawson, T.E.; Goldsmith, G.R. The value of wet leaves. New Phytol. 2018, 219, 1156–1169. [Google Scholar] [CrossRef] [PubMed] [Green Version]
  63. Wang, W.-H.; Köhler, B.; Cao, F.-Q.; Liu, L.-H. Molecular and physiological aspects of urea transport in higher plants. Plant Sci. 2008, 175, 467–477. [Google Scholar] [CrossRef]
  64. Eichert, T.; Burkhardt, J. Quantification of stomatal uptake of ionic solutes using a new model system. J. Exp. Bot. 2001, 52, 771–781. [Google Scholar] [CrossRef] [Green Version]
  65. Witte, C.-P. Urea metabolism in plants. Plant Sci. 2011, 180, 431–438. [Google Scholar] [CrossRef]
  66. Jian, S.; Liao, Q.; Song, H.; Liu, Q.; Lepo, J.E.; Guan, C.; Zhang, J.; Ismail, A.M.; Zhang, Z. NRT1.1-Related NH4+ toxicity is associated with a disturbed balance between NH4+ uptake and assimilation. Plant Physiol. 2018, 178, 1473–1488. [Google Scholar] [CrossRef] [Green Version]
  67. Esteban, R.; Ariz, I.; Cruz, C.; Moran, J.F. Review: Mechanisms of ammonium toxicity and the quest for tolerance. Plant Sci. 2016, 248, 92–101. [Google Scholar] [CrossRef] [Green Version]
  68. Britto, D.T.; Kronzucker, H.J. NH4+ toxicity in higher plants: A critical review. J. Plant Physiol. 2002, 159, 567–584. [Google Scholar] [CrossRef] [Green Version]
  69. Guo, J.; Jia, Y.; Chen, H.; Zhang, L.; Yang, J.; Zhang, J.; Hu, X.; Ye, X.; Li, Y.; Zhou, Y. Growth, photosynthesis, and nutrient uptake in wheat are affected by differences in nitrogen levels and forms and potassium supply. Sci. Rep. 2019, 9, 1248. [Google Scholar] [CrossRef] [Green Version]
  70. Hawkesford, M.; Horst, W.; Kichey, T.; Lambers, H.; Schjoerring, J.; Møller, I.S.; White, P. Functions of macronutrients. In Mineral Nutrition of Higher Plants; Marschner, P., Ed.; 2012; pp. 135–189. ISBN 978-0-12-384905-2. [Google Scholar]
  71. Zhang, Z.; Xiong, S.; Wei, Y.; Meng, X.; Wang, X.; Ma, X. The role of glutamine synthetase isozymes in enhancing nitrogen use efficiency of N-efficient winter wheat. Sci. Rep. 2017, 7, 1000. [Google Scholar] [CrossRef] [Green Version]
  72. Németh, E.; Nagy, Z.; Pécsváradi, A. Chloroplast glutamine synthetase, the key regulator of nitrogen metabolism in wheat, performs its role by fine regulation of Enzyme activity via negative cooperativity of its subunits. Front. Plant Sci. 2018, 9, 191. [Google Scholar] [CrossRef] [PubMed] [Green Version]
  73. Hachiya, T.; Inaba, J.; Wakazaki, M.; Sato, M.; Toyooka, K.; Miyagi, A.; Kawai-Yamada, M.; Sugiura, D.; Nakagawa, T.; Kiba, T.; et al. Excessive ammonium assimilation by plastidic glutamine synthetase causes ammonium toxicity in Arabidopsis thaliana. Nat. Commun. 2021, 12, 4944. [Google Scholar] [CrossRef] [PubMed]
  74. Britto, D.T.; Kronzucker, H.J. Nitrogen acquisition, PEP carboxylase, and cellular pH homeostasis: New views on old paradigms. Plant Cell Environ. 2005, 28, 1396–1409. [Google Scholar] [CrossRef]
  75. Lea, P.J.; Sodek, L.; Parry, M.A.J.; Shewry, P.R.; Halford, N.G. Asparagine in plants. Ann. Appl. Biol. 2007, 150, 1–26. [Google Scholar] [CrossRef]
  76. Oddy, J.; Raffan, S.; Wilkinson, M.D.; Elmore, J.S.; Halford, N.G. Stress, nutrients and genotype: Understanding and managing asparagine accumulation in wheat grain. CABI Agric. Biosci. 2020, 1, 10. [Google Scholar] [CrossRef]
  77. Hildebrandt, T.M. Synthesis versus degradation: Directions of amino acid metabolism during Arabidopsis abiotic stress response. Plant Mol. Biol. 2018, 98, 121–135. [Google Scholar] [CrossRef]
  78. Wong, H.-K.; Chan, H.-K.; Coruzzi, G.M.; Lam, H.-M. Correlation of ASN2 gene expression with ammonium metabolism in Arabidopsis. Plant Physiol. 2004, 134, 332–338. [Google Scholar] [CrossRef] [Green Version]
  79. Yoneyama, T.; Suzuki, A. Light-independent nitrogen assimilation in plant leaves: Nitrate incorporation into glutamine, glutamate, aspartate, and asparagine traced by 15N. Plants 2020, 9, 1303. [Google Scholar] [CrossRef]
  80. Maillard, A.; Diquélou, S.; Billard, V.; Laîné, P.; Garnica, M.; Prudent, M.; Garcia-Mina, J.-M.; Yvin, J.-C.; Ourry, A. Leaf mineral nutrient remobilization during leaf senescence and modulation by nutrient deficiency. Front. Plant Sci. 2015, 6, 317. [Google Scholar] [CrossRef] [Green Version]
  81. Martins, M.T.B.; de Souza, W.R.; da Cunha, B.A.D.B.; Basso, M.F.; de Oliveira, N.G.; Vinecky, F.; Martins, P.K.; de Oliveira, P.A.; Arenque-Musa, B.C.; de Souza, A.P.; et al. Characterization of sugarcane (Saccharum spp.) leaf senescence: Implications for biofuel production. Biotechnol. Biofuels 2016, 9, 153. [Google Scholar] [CrossRef] [Green Version]
  82. Li, G.; Zhang, L.; Wang, M.; Di, D.; Kronzucker, H.J.; Shi, W. The Arabidopsis AMOT1/EIN3 gene plays an important role in the amelioration of ammonium toxicity. J. Exp. Bot. 2019, 70, 1375–1388. [Google Scholar] [CrossRef] [PubMed] [Green Version]
  83. Podgórska, A.; Szal, B. The role of reactive oxygen species under ammonium nutrition. In Reactive Oxygen and Nitrogen Species Signaling and Communication in Plants; Gupta, K.J., Igamberdiev, A.U., Eds.; Springer International Publishing: London, UK, 2015; pp. 133–154. ISBN 978-3-319-10079-1. [Google Scholar]
  84. Yang, S.; Hao, D.; Jin, M.; Li, Y.; Liu, Z.; Huang, Y.; Chen, T.; Su, Y. Internal ammonium excess induces ROS-mediated reactions and causes carbon scarcity in rice. BMC Plant Biol. 2020, 20, 143. [Google Scholar] [CrossRef] [PubMed]
  85. You, J.; Chan, Z. ROS regulation during abiotic stress responses in crop plants. Front. Plant Sci. 2015, 6, 1092. [Google Scholar] [CrossRef] [PubMed] [Green Version]
  86. Amir, R.; Hussain, S.; Noor-ul-Ain, H.; Hussain, A.; Yun, B.-W. ROS Mediated plant defense against abiotic stresses. In Plant Biotechnology: Progress in Genomic Era; Springer Singapore: Singapore, 2019; pp. 481–515. ISBN 9789811384998. [Google Scholar]
  87. He, M.; He, C.-Q.; Ding, N.-Z. Abiotic stresses: General defenses of land plants and chances for engineering multistress tolerance. Front. Plant Sci. 2018, 9, 1771. [Google Scholar] [CrossRef] [PubMed] [Green Version]
  88. Barneix, A.J. Physiology and biochemistry of source-regulated protein accumulation in the wheat grain. J. Plant Physiol. 2007, 164, 581–590. [Google Scholar] [CrossRef]
  89. Liu, Y.; von Wirén, N. Ammonium as a signal for physiological and morphological responses in plants. J. Exp. Bot. 2017, 68, 2581–2592. [Google Scholar] [CrossRef] [Green Version]
  90. Thomsen, H.C.; Eriksson, D.; Møller, I.S.; Schjoerring, J.K. Cytosolic glutamine synthetase: A target for improvement of crop nitrogen use efficiency? Trends Plant Sci. 2014, 19, 656–663. [Google Scholar] [CrossRef]
  91. Guan, M.; de Bang, T.C.; Pedersen, C.; Schjoerring, J.K. Cytosolic glutamine synthetase Gln1;2 is the main isozyme contributing to GS1 activity and can be up-regulated to relieve ammonium toxicity. Plant Physiol. 2016, 171, 1921–1933. [Google Scholar] [CrossRef] [Green Version]
  92. Detmann, K.C.; Araújo, W.L.; Martins, S.C.V.; Sanglard, L.M.V.P.; Reis, J.V.; Detmann, E.; Rodrigues, F.Á.; Nunes-Nesi, A.; Fernie, A.R.; DaMatta, F.M. Silicon nutrition increases grain yield, which, in turn, exerts a feed-forward stimulation of photosynthetic rates via enhanced mesophyll conductance and alters primary metabolism in rice. New Phytol. 2012, 196, 752–762. [Google Scholar] [CrossRef] [Green Version]
  93. Campos, C.N.S.; da Silva Júnior, G.B.; de Mello Prado, R.; de David, C.H.O.; de Souza Junior, J.P.; Teodoro, P.E. Silicon mitigates ammonium toxicity in plants. Agron. J. 2020, 112, 635–647. [Google Scholar] [CrossRef]
  94. Barreto, R.F.; de Mello Prado, R.; Lúcio, J.C.B.; López-Díaz, I.; Carrera, E.; Carvalho, R.F. Ammonium toxicity alleviation by silicon is dependent on cytokinins in tomato cv. micro-tom. J. Plant Growth Regul. 2021, 41, 417–428. [Google Scholar] [CrossRef]
  95. de Souza Junior, J.P.; de Mello Prado, R.; de Morais, T.C.B.; Frazão, J.J.; dos Santos Sarah, M.M.; de Oliveira, K.R.; de Paula, R.C. Silicon fertigation and salicylic acid foliar spraying mitigate ammonium deficiency and toxicity in Eucalyptus spp. clonal seedlings. PLoS ONE 2021, 16, e0250436. [Google Scholar] [CrossRef] [PubMed]
  96. Wei, Y.; Xiong, S.; Zhang, Z.; Meng, X.; Wang, L.; Zhang, X.; Yu, M.; Yu, H.; Wang, X.; Ma, X. Localization, gene expression, and functions of glutamine synthetase isozymes in wheat grain (Triticum aestivum L.). Front. Plant Sci. 2021, 12, 580405. [Google Scholar] [CrossRef] [PubMed]
  97. Kan, C.-C.; Chung, T.-Y.; Wu, H.-Y.; Juo, Y.-A.; Hsieh, M.-H. Exogenous glutamate rapidly induces the expression of genes involved in metabolism and defense responses in rice roots. BMC Genom. 2017, 18, 186. [Google Scholar] [CrossRef] [Green Version]
  98. Teixeira, W.F.; Fagan, E.B.; Soares, L.H.; Soares, J.N.; Reichardt, K.; Neto, D.D. Seed and foliar application of amino acids improve variables of nitrogen metabolism and productivity in soybean crop. Front. Plant Sci. 2018, 9, 396. [Google Scholar] [CrossRef] [Green Version]
  99. Miller, A.J.; Fan, X.; Shen, Q.; Smith, S.J. Amino acids and nitrate as signals for the regulation of nitrogen acquisition. J. Exp. Bot. 2007, 59, 111–119. [Google Scholar] [CrossRef]
Figure 1. Scorching at the tip of the youngest fully expanded leaf of spring wheat (cv. Amaretto) plants 24 h after spraying UAN solution with different N concentrations (0, 10, 20, and 40% of N) without surfactant.
Agronomy 12 01405 g001
Figure 2. Nitrogen toxicity occurring 1 day after the application of urea solution with surfactant onto the YFEL of wheat (cv. Harenda). Three droplets of 3 µL urea solution with a concentration of 0, 2, 4, 6 or 9% N were pipetted onto the middle section of the adaxial surface of the YFEL. (A) Scorching underneath the droplets; and (B) scorching at the tip of the leaf.
Agronomy 12 01405 g002
Figure 3. Nitrogen toxicity occurring 5 days after the application of urea solution with surfactant onto the YFEL of wheat (cv. Harenda). Three droplets of 3 µL urea solution with a concentration of 0, 2, 4, 6 or 9% N were pipetted onto the middle section of the adaxial surface of the YFEL. (A) Scorching underneath the droplets; and (B) scorching at the tip of the leaf.
Agronomy 12 01405 g003
Figure 4. Total-N concentration of the youngest and second youngest fully expanded leaves of wheat (cv. Amaretto) at 0, 1, 3, 6, 12, and 24 h after the application of UAN solutions with increasing N concentration, namely 0, 5, 10, 20, and 40% N. Data are the means of three independent biological replicates ± standard error. Small letters indicate the difference between N treatments at each application time, and capital letters indicate the difference between application times for each N treatment according to Tukey’s post hoc test (p < 0.05).
Agronomy 12 01405 g004
Figure 5. Ammonium concentration (NH4+) (A) and glutamine synthetase (GS) activity (B) of the youngest and second youngest fully expanded leaves of wheat (cv. Amaretto) at 0, 1, 3, 6, 12, and 24 h after application of UAN solutions with increasing N concentrations, namely 0, 5, 10, 20, and 40% N. Data are the means of three independent biological replicates ± standard error. Small letters indicate a difference between N treatments at each application time, and capital letters indicate a difference in the application times for each N treatment, according to Tukey’s post hoc test (p < 0.05).
Agronomy 12 01405 g005
Figure 6. Cytosolic (GS1) and plastidic (GS2) GS activity of the youngest and second youngest fully expanded leaves of spring wheat (cv. Amaretto) foliar fertilized with 0% N or 40% N UAN solution at 6 HAFNf.
Agronomy 12 01405 g006
Figure 7. Absolute (A) and relative (B) concentrations of free amino acids in the youngest and second youngest fully expanded leaves of spring wheat (cv. Amaretto) foliar fertilized with UAN in different N concentrations (0, 10, and 20% of N) at 6 HAFNf. Data are the means of three independent biological replicates ± standard error; letters indicate a difference between the N treatments according to Tukey’s post hoc test (p < 0.05). “Other AAs” are the sum of the percentage of arginine, serine, threonine, valine, isoleucine, leucine, and phenylalanine.
Agronomy 12 01405 g007
Figure 8. Pearson correlation of N parameters determined in the youngest and second youngest fully expanded leaves of spring wheat (cv. Amaretto) foliar fertilized with UAN in different N concentrations (0, 10, and 20% of N) at 6 HAFNf. * indicates significant correlation (p < 0.05).
Agronomy 12 01405 g008
Figure 9. Photosynthesis rate of the youngest and second youngest fully expanded leaves of spring wheat (cv. Amaretto) after foliar fertilization with UAN solution (0% or 20% of N in solution) at 0, 3, 6, 12, and 24 HAFNf. Data are the means of three independent biological replicates ± standard error; small letters indicate difference between N treatments at each evaluation time, and capital letters indicate difference between the evaluation times in each N treatment according to Tukey’s post hoc test (p < 0.05).
Agronomy 12 01405 g009
Table 1. Total-N, amino acid, NH4+, and glutamate + glutamine (Glx) concentration as well as urease, and glutamine synthetase (GS) activity in the YFEL of spring wheat (cv. Harenda) foliar fertilized with different urea-N concentrations at 7 DAFNf.
N Concentration
(%)
Total-N
(mg g−1 DW)
Amino Acid
(mg g−1 DW)
GS Activity
(µmol LGA g−1 FW min−1)
0%35.7a188.7a1.16a
2%26.8b138.6ab0.83b
4%28.3ab157.2ab0.98ab
6%21.5b115.9b1.04ab
9%27.4b144.0ab1.18a
Mean27.9 148.9 1.04
N Concentration
(%)
NH4+
(µg g−1 FW)
Glx Concentration
(mg g−1 DW)
Urease Activity
(µmol NH4+ g−1 FW h−1)
0%5.0cd20.6a1083.6a
2%3.2d15.3ab894.6a
4%9.8ab17.1ab998.5a
6%7.4bc12.7b886.1a
9%11.6a16.1ab909.8a
Mean7.4 16.4 954.5
Data are the means of four independent biological replicates; letters indicate difference between N treatments according to Tukey’s post hoc test (p < 0.05).
Table 2. Pearson correlation and pairwise correlation t-test (p-values) of the N-concentration in the applied urea solution with surfactant and the N parameters evaluated in the YFEL of spring wheat (cv. Harenda) at 7 DAFNf.
Pearson Cor./
p-Value
N Concentration
%
Urease
Activity
GS
Activity
NH4+Total-NGlx
Concentration
Amino Acid
N concentration, %-−0.430.240.72 ***−0.51 *−0.39−0.42
Urease activity0.06-0.48 *−0.230.63 **0.63 **0.65 **
GS activity0.310.03-0.310.240.270.27
NH4+0.000.330.19-−0.27−0.21−0.21
Total-N0.020.000.300.26-0.95 ***0.96 ***
Glx concentration0.090.000.250.380.00-0.99 ***
0.060.000.240.370.000.00-
Values marked in blue represent a negative correlation between the analyzed parameters and those in green represent the positive correlation. Correlation significance: *** p-value < 0.001; ** p-value < 0.01; * p-value < 0.05.
Publisher’s Note: MDPI stays neutral with regard to jurisdictional claims in published maps and institutional affiliations.

