Article

Biological Response of Triticum aestivum L. to the Abiotic Stress Induced by Winemaking Waste

by
Silvica Padureanu
1 and
Antoanela Patras
2,*
1
Department of Plant Science, “Ion Ionescu de la Brad” Iasi University of Life Sciences, 700490 Iasi, Romania
2
Department of Sciences, “Ion Ionescu de la Brad” Iasi University of Life Sciences, 700490 Iasi, Romania
*
Author to whom correspondence should be addressed.
Agronomy 2022, 12(6), 1371; https://doi.org/10.3390/agronomy12061371
Submission received: 9 May 2022 / Revised: 29 May 2022 / Accepted: 3 June 2022 / Published: 6 June 2022

Abstract

:
The winemaking waste (grape marc) can be beneficial if it is used in food, pharmaceutical industry, and medicine. However, studies reported that some concentrations of grape marc extracts may induce negative effects on animals. The present study was conducted in order to research if the grape marc induces abiotic stress with serious negative implications on plants. For this purpose, wheat grains were treated for 48 h with 0.025%, 0.05%, 0.1% and 0.2% aqueous extracts of Merlot and Sauvignon blanc grape marc. Grains germination rate and cytogenetic parameters were investigated. The germination rate decreased moderately compared to the control in all treatments. The investigated cytogenetic parameters were: mitotic index (MI) and genetic abnormalities (bridges, fragments, associations between bridges and fragments, multipolar ana-telophases, micronuclei). As the grape marc concentration increases, the germination rate and mitotic index decrease moderately, while the percent of cells with chromosomal aberrations and micronuclei increases. Treatments with Merlot grape marc extract induced a higher percent of genetic abnormalities. The results prove from a genetic point of view that the winemaking waste induces abiotic stress on wheat (and probably, on other plants) and it should be depleted in polyphenols before storing on fields. Possible use of unprocessed grape marc could be as bio-herbicide.

1. Introduction

Winemaking is a very important worldwide horticultural sector. However, it generates important quantities of waste (grape marc). Last decades, scientists and wine-producers tried to find different ways to valorize the resulted grape marc. The main affordable directions are: animal feeding, composting/fertilizing, incineration, biofuel/biogas/energy generation, biotechnological production of specific chemicals (e.g., ethanol), extraction of antioxidants and natural pigments in order to be included in functional foods [1].
Grape marc has a complex composition, including neutral polysaccharides (30%), pectic substances (20%), insoluble proanthocyanidins (15%), lignin, proteins and phenolic compounds [2]. The grape marc phenolic profile depends on the grape variety, soil properties and vineyard location, climatic conditions and winemaking technology. Very important representatives are: catechin, epicatechin, proanthocyanidins (B1 and B2), myricetin, quercetin, kaempferol, resveratrol, as well as ellagic, gallic, ferrulic, salicylic, vanillic, chlorogenic, protocatechuic, sinapic, caffeic acids, and condensed tannins [3,4]. Grape marc polyphenols are the main ones responsible for the antioxidant capacity [5,6].
The phenolic composition of grapes depends mainly on the soil, the mean climate of the geographical area and the intensity of vine water stress, and less on the cultivar [7,8].
Presently, different techniques are used for polyphenol recovery from grape marc and for phenolic extracts preparation [9,10]. Polyphenolic extracts significantly influence vital processes in plants, such as seed germination, cell division and photosynthesis [11].
The total phenolic content of red grapes is usually higher than in white grapes, due to the presence of anthocyanins, the pigments responsible for their red color [12,13]. This difference is reflected in the higher nutraceutical value of red grapes [14,15].
Jara-Palacios [16] and Tian [17] proved that the polyphenolic compounds from the white grape marc extracts are inhibitors of cell proliferation and initiate the death of cancer cells, justifying their use in the treatment of colon carcinogenesis. The inhibitory nature of polyphenolic compounds is partially explained by blocking the mitotic cycle in the G2 stage of the interphase by reducing the expression of cyclin D1 [18,19,20].
Despite the recognized benefits of polyphenols, there are some concerns about their side effects in animal organisms [21,22,23]. In this respect, Abdel-Moneim [21] found that polyphenols have inhibitory effects on digestive enzymes in poultry, showing a harmful effect on intestinal health through the incomplete digestion of nutrients and the non-absorption of vitamins and minerals. Some herbs rich in polyphenols, in addition to antioxidant activity, may have genotoxic potential if concentrated [24,25]. Some studies on the biological effects of polyphenols from different plants, stated that high phenolic concentrations are toxic for cells, inducing their death [26]. According to Ugartondo [27], the cytotoxic effects of epicatechin conjugates obtained by depolymerization of grape polymeric flavanols were noticed at concentrations 3–7-fold higher than the antioxidant concentration after exposure for 24, 48, and 72 h. Stagos [28] stated that synergistic effects of fractions of grape extracts at concentrations from 75 to 300 μg/L induced sister chromatid exchanges in human peripheral blood lymphocytes. Fan [29] proved that the biological properties of grape seed polyphenols depend on their concentration. High catechin concentration (150 μM) induced significant DNA damages in mice spleen cells, while contrary, low concentrations of catechin (as well as Procyanidin B4 and gallic acid) were good antioxidants, preventing oxidative damage to cellular DNA. Xia [30] mentioned that anthocyanins, flavanols, flavonols, resveratrol are the main grape polyphenols with antioxidant, antimicrobial, antiinflamatory, cardioprotective, anticancer and anti-age properties, but he also discussed their potential toxicity, depending on their concentration.
Thus, many researchers proved the opposite effect of polyphenols on animal organisms, correlated to their concentration: small concentrations induce positive effects, high concentrations, negative effects.
The various effects of grape marc extracts (GME) and the recommendations of some above-mentioned research to conduct further studies in order to elucidate the extent to which affect the early developmental stages of plants, motivated us to initiate the present study. The aim of this research is to evaluate the possible inhibitory effects of grape marc on wheat. The main objectives are to study:
(a)
the phytotoxic effect of grape marc extracts on wheat; grains;
(b)
the genotoxic potential of grape marc extracts on wheat cells.

2. Materials and Methods

2.1. Extracts Preparation

The treatments applied during germination are represented by aqueous extracts of dry grape marc. The grape marc is the winemaking waste resulting from Merlot and Sauvignon blanc varieties. The water-soluble compounds were extracted in 4 steps at room temperature, using an ultrasonic bath. The 2 first steps lasted 40 min each, while the 3rd and the 4th lasted 20 min each. Each step of the extraction was followed by filtration and the resulted solid residue was used in the following step. The ratio between dried marc and distilled water was 2:1000 (g/mL) in case of the 0.2% extract (M4 and SB4), 1:1000 (g/mL) in case of the 0.1% extract (M3 and SB3), 0.5:1000 (g/mL) in case of the 0.05% extract (M2 and SB2), and, respectively, 0.25:1000 (g/mL) in case of the 0.025% extract (M1 and SB1).

2.2. Experimental Procedure

The biological material was represented by grains of Triticum aestivum L., variety Izvor, obtained from an experimental plot at the farm of Iaşi University of Life Sciences, Romania. Triticum aestivum (wheat) is a test plant used to verify the toxicity or therapeutic properties of various environmental agents [31].
Wheat grains were placed in 27 Petri dishes with 10 cm diameter, on filter paper, using 100 grains per dish. Three Petri dishes contained the control (C), represented by grains irrigated with distilled water. The remaining 24 Petri dishes represented 8 variants (in triplicate): in 4 was administrated Merlot grape marc extracts and in 4 was administrated Sauvignon blanc grape marc extracts at 0.025% (M1, SB1), 0.05% (M2, SB2), 0.1% (M3, SB3) and 0.2% (M4, SB4). Merlot is a red grape variety, while Sauvignon blanc is a white grape variety.
The grains in each Petri dish were initially irrigated with 20 mL of distilled water (control), and, respectively, grape marc extracts, and introduced for 48 h in a climatic germination room MRC PGI-500H (Holon, Israel), at 25 °C, 90% humidity, in the absence of the light. After 24 h, in all Petri dishes, the solutions were removed and replaced with 15 mL/Petri dish of the same solution (in order to maintain the freshness). After 48 h the germinated grains were harvested.

2.3. Evaluation of Germination Rate

The grains germination rate was calculated for each Petri dish, by applying the formula:
Germination rate (%) = germinated grains/total grains × 100

2.4. Cytogenetic Investigations

The 15–17 mm long embryonic roots of treated and untreated wheat (2 days old) were subjected to the standard protocol for highlighting the genetic material of meristematic cells. In this regard, embryonic roots were fixed in Carnoy solution (3:1 v/v, ethanol–glacial acetic acid) for 24 h at 4 °C, then hydrolyzed in 1N HCl at 60 °C for 15 min, then stained with carbol-fuchsin solution (Carr reagent) for 24 h at 4 °C [32,33,34]. Then, the root tips were squashed in 45% acetic acid, in order to obtain the slides (3–4 root tips/slide). Twenty slides were prepared for each replication, respectively, 60 slides/variant, and 15 microscopic fields/slide were examined. Around 35 cells were observed/microscopic field. At least 10,000 cells (in different phases of mitotic division)/replication/variant were counted in order to determine the mitotic index and to identify the cells with chromosomal aberrations and micronuclei. The slide examination was performed with the Oxion optical microscope (1000× magnification), equipped with a digital camera for image capture.
Cells have been investigated during the mitotic cell cycle. In this regard, the aim was to determine: (1) mitotic index (MI), (2) frequency of mitotic phases: percent of cells in prophase, percent of cells in metaphase, percent of cells in anaphase, percent of cells in telophase, (3) frequency of genetic abnormalities in mitotic cycle: in anaphase + telophase and in interphase, (4) frequency of genetic abnormalities types. The following calculations were performed and the mean per each variant was considered:
(1)
MI (%) = number of dividing cells/total cells (dividing and nondividing) × 100;
(2a)
cells in prophase (%) = number of prophase cells/total cells (dividing and nondividing) × 100;
(2b)
cells in metaphase (%) = number of metaphase cells/total cells (dividing and nondividing) × 100;
(2c)
cells in anaphase (%) = number of anaphase cells /total cells (dividing and nondividing) × 100;
(2d)
cells in telophase (%) = number of telophase cells/total cells (dividing and nondividing) × 100;
(3a)
cells with chromosomal aberrations from ana-telophases (%) = number of cells in aberrant ana-telophases/total cells (dividing and nondividing) × 100;
(3b)
cells with aberrant interphases (%) = number of cells with aberrant interphases/total cells (dividing and nondividing) × 100;
(4)
cells with different types of genetic abnormalities from total cells (%) = number of cells with a certain type of genetic abnormality/total cells (dividing and nondividing) × 100.

2.5. Statistical Analysis

All analyses were performed in triplicate and the obtained results were expressed as means ± standard deviation. The results were compared using IBM SPSS Statistics 21 software, one-way ANOVA and Duncan post-hoc multiple comparison test. The significance level was 0.05. The standard deviations (±SD) and correlation coefficients were established using the software Excel 2010.

3. Results

3.1. Germination Rate of Triticum aestivum Grains

Phytotoxicity was assessed by measuring the effects of grape marc on germination rate of wheat grains.
The extracts of Merlot and Sauvignon blanc grape marc had a low inhibitory influence on the germination rate of wheat grains, compared to the control. Figure 1 shows that germination rate of Merlot GME treated grains is lower compared to Sauvignon blanc GME treated grains, which decreased it discreetly.
In addition, the higher the GME concentration, the greater the inhibitory effect on the germination. Thus, the lowest germination rates are for M2 (81%), M3 (77.5%) and especially M4 (66%), statistically significant compared to the control (93.5%). The grains treated with Sauvignon blanc GME had a better germination rate than those treated with Merlot, but inferior to the control. Between the variants treated with Sauvignon blanc, the SB3 (85%) and SB4 (82.5%) determined the lowest germination rates.

3.2. Cytogenetic Investigations

3.2.1. Mitotic Index

The first cytogenetic parameter investigated was the mitotic index (MI), which represents the total number of dividing cells reported to the total number of cells observed in cell cycle. Figure 2 shows the percent of cells in interphase and in the division from root meristems of Triticum aestivum treated with different concentrations of Merlot (M) and Sauvignon blanc (SB) GME.
Similar to the germination rate, the MI decreases with the increase of GME concentration. Thus, compared to the control (25.33%), the lowest MI from all treatments is noticed for M4 (11.34%). Concerning SB GME treatments, the lowest MI was observed for SB4 (20.4%). In all treatments, there is an inverse proportionality between MI and the percent of cells in interphase. The control proved the highest MI, but the lowest percent of cells in interphase (74.67%), while in all the treated samples, the cells in interphase (%) increase when MI decreases. The highest percent of interphase cells is in the case of M4 (88.66%).
As proof that MI is a good indicator of plant growth, the correlation between this cytogenetic parameter (MI) and the seed germination rate is high and positive, as reflected by the correlation coefficient (R2 = 0.946), which is close to 1, the maximum value (Figure 3).

3.2.2. Frequency of Mitotic Phases

The percent of dividing cells in prophase, metaphase, anaphase, and telophase is shown in Table 1.
Treatments with grape marc extracts did not modify the normal frequency of the four phases of mitotic division. In all experimental variants, most cells are in prophase and telophase followed by cells in metaphase and anaphase.

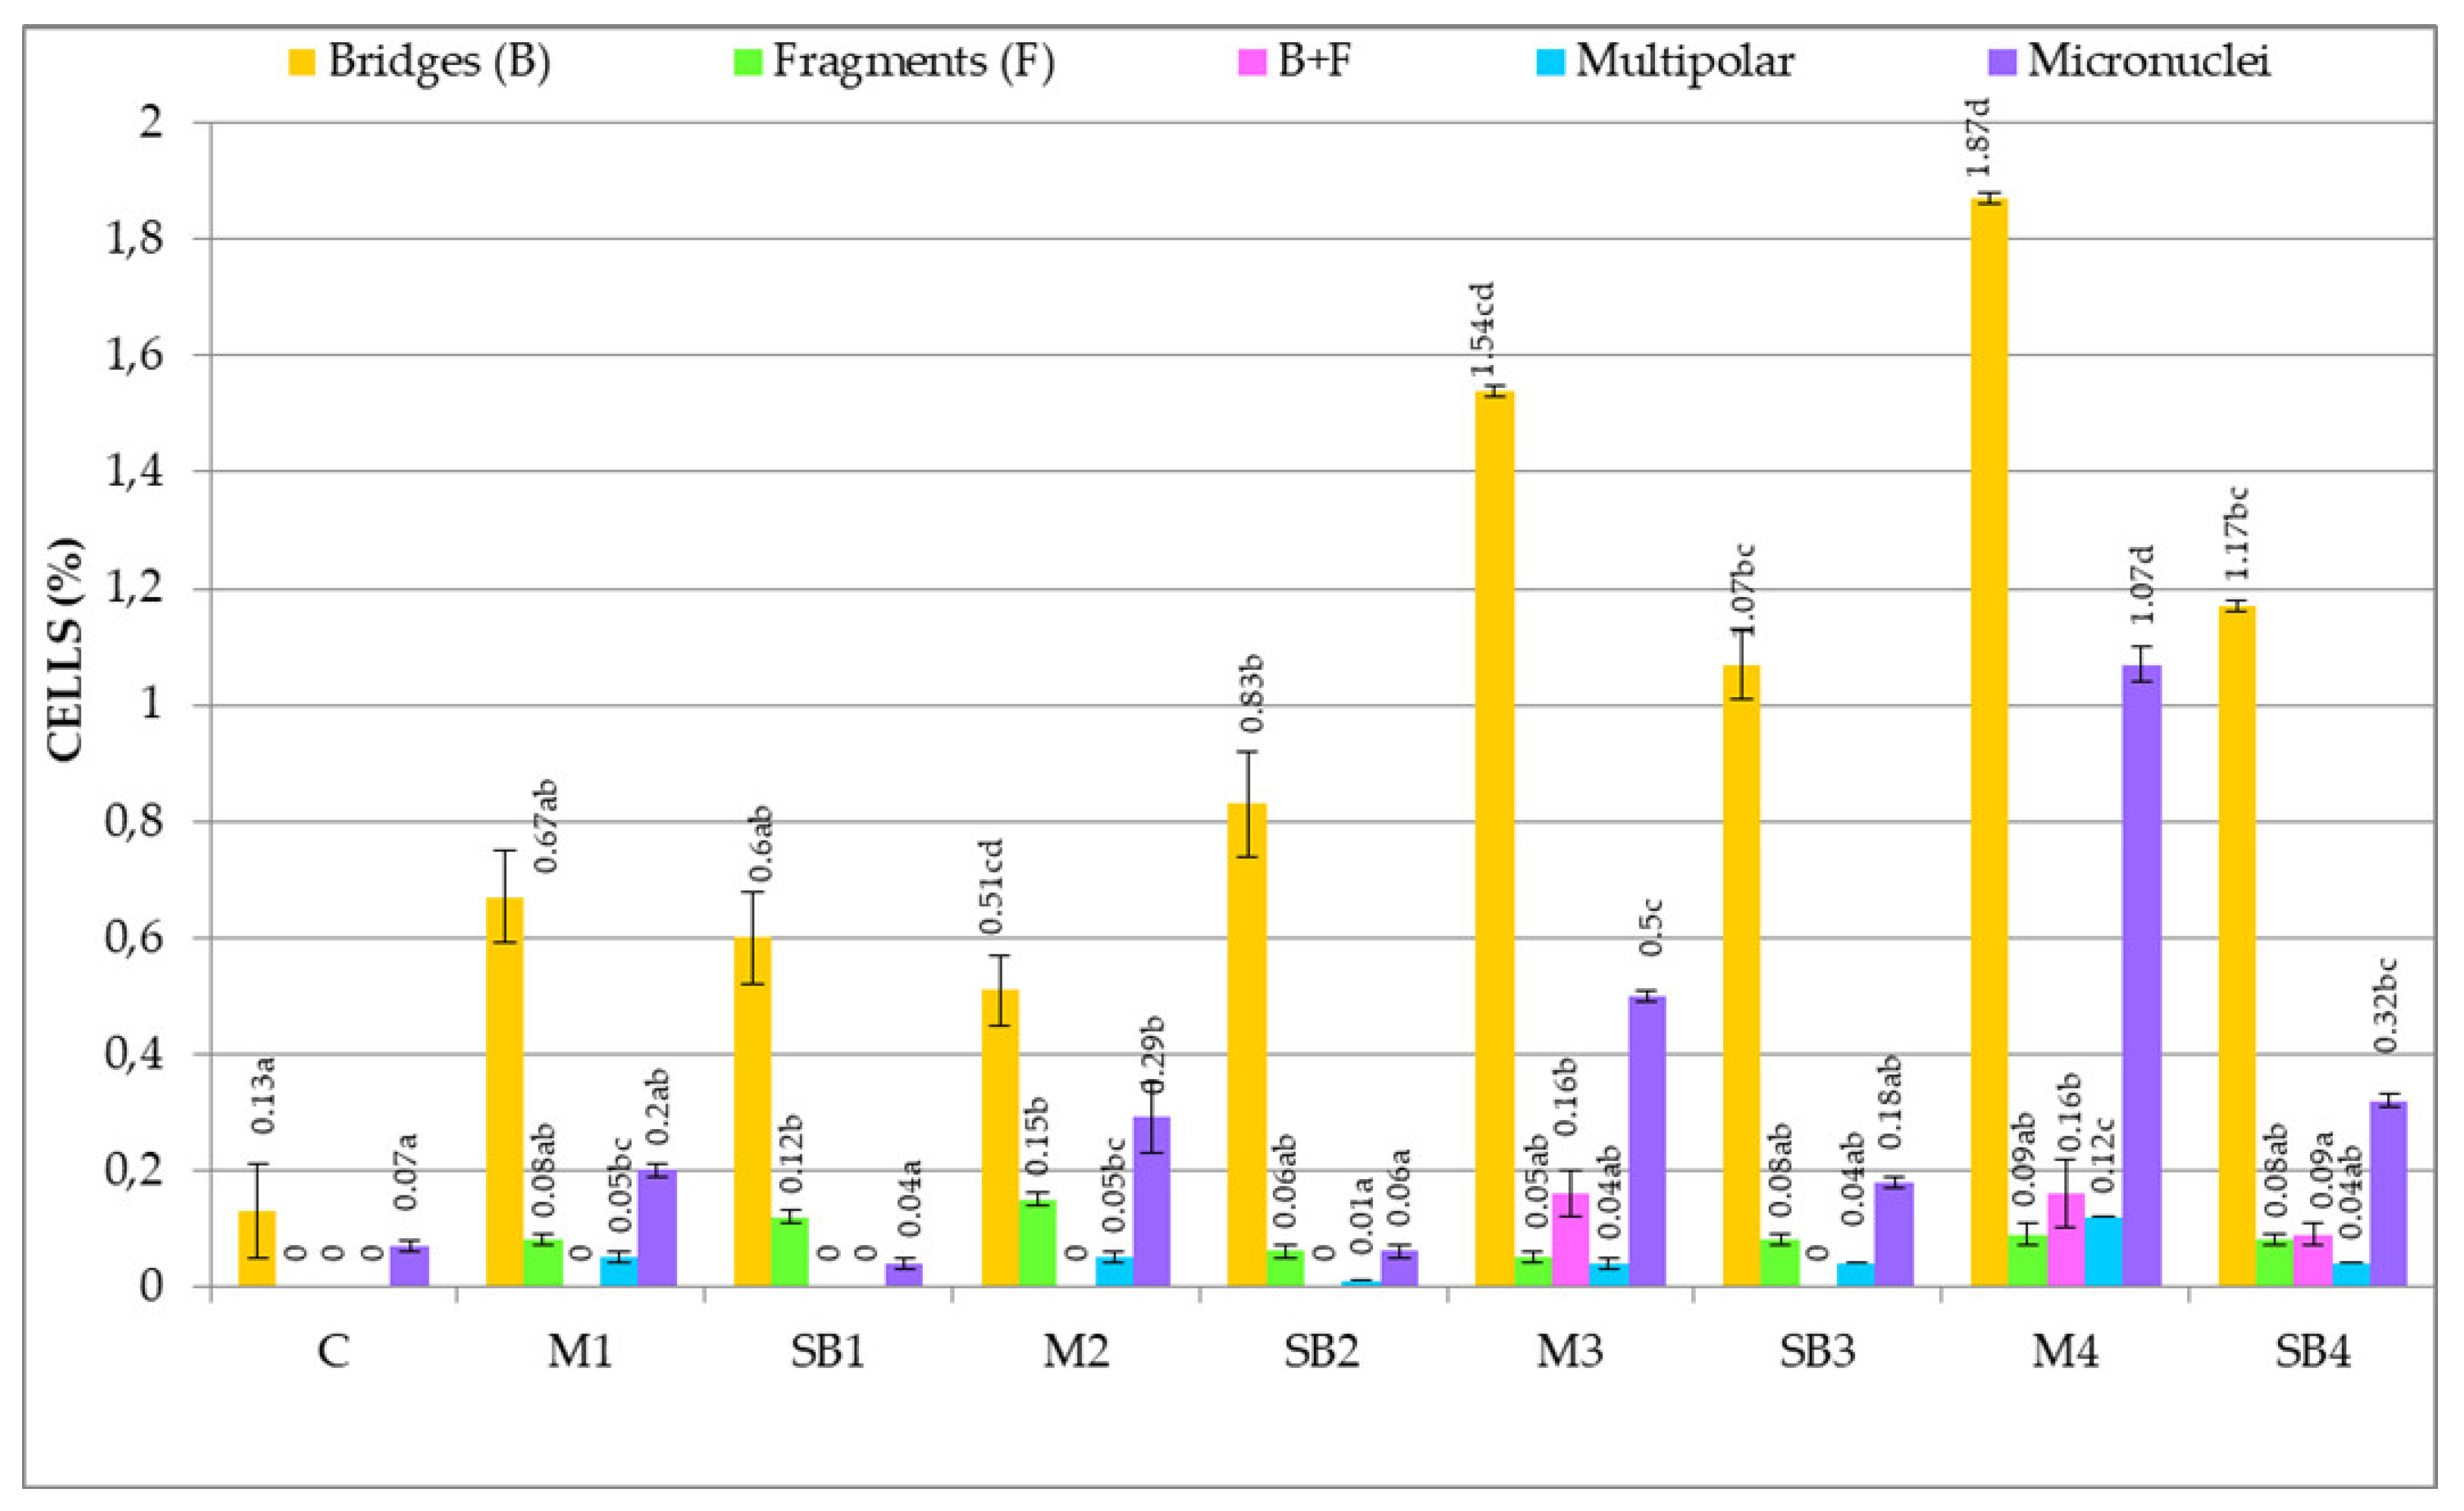
3.2.3. Genetic Abnormalities

The genotoxic potential of Merlot and Sauvignon blanc GME was assessed by quantifying cells with genetic abnormalities. In this sense, genetic abnormalities have been identified in: anaphase, telophases and interphases. Anaphase and telophase cells were noted A-T. Metaphase cells were not affected by GME treatments, so that all metaphases observed were normal, with bichromatid chromosomes arranged in so-called equatorial crowns. The frequency of genetic abnormalities in the three affected phases of mitotic cycle is shown in Table 2.
The control presented insignificant spontaneous genetic abnormalities, namely: 0.13% aberrant A-T and 0.07% aberrant interphases. Treatments with Merlot GME induced aberrant A-T, from which supraunitary: M2, M3, M4, especially M4 (2.24%). In case of Sauvignon blanc GME, only SB3 and SB4 have aberrant supraunitary A-T, namely: 1.2%, and, respectively, 1.37%. The aberrant cells in interphases are supraunitary only in the case of M4 treatments (1.07%).
The presence of some genetic abnormalities (even subunitary) in the meristem of wheat roots indicate the genotoxic potential of Merlot and Sauvignon blanc grape marc extracts.
The type of genetic abnormalities identified in the cells of wheat embryonic roots after Merlot and Sauvignon blanc GME treatments, as well as the frequency of these abnormalities are represented in Figure 4.
Figure 4 shows that genetic abnormalities induced by GME treatments are represented by 4 types of chromosomal aberrations and micronuclei.
Four types of chromosomal aberrations in A-T were induced by GME treatments, namely: chromosomal bridges, chromosomal fragments, associations between bridges and chromosomal fragments, multipolar ana-telophases. The most frequent chromosomal aberrations are bridges. From all treatments, the most bridges are in the case of M2 (1.51% cells reported to total cells/variant), M3 (1.54%), M4 (1.87%), SB3 (1.07%) and SB4 (1.17%). The chromosomal fragments are present in all variants (subunitary values), the higher values being: SB1 (0.12%) and M2 (0.15%). The associations between bridges and chromosomal fragments were identified only in 3 variants: M3, M4 and SB4, having low, insignificant values, namely: for M3: 0.16% cells reported to total cells/variant; for M4: 0.16% cells; for SB4: 0.09% cells. The multipolar ana-telophases were present in most variants, but had low, subunitary values reported to total cells/variant. M4 has the most multipolar A-T (0.12% cells).
The interphase abnormalities are represented by micronuclei, which are identified in all variants. Their frequency is largely subunitary, excepting M4 (1.07% cells reported to total cells/variant).
The control presents very few spontaneous chromosomal bridges (0.13% cells reported to total cells/variant) and micronuclei (0.07% cells).
The correlation between genetic abnormalities (%) and MI (%) is negative and high (R2= −0.892) (Figure 5). Similar result was obtained by other authors [35,36,37].
The correlation between micronuclei (%) and aberrant ana-telophases (%) is positive (R2 = 0.688) (Figure 6).
Figure 7 shows cells with different chromosomal aberrations and micronuclei induced by treatments with different concentrations of Merlot and Sauvignon blanc grape marc extracts.

4. Discussion

4.1. Germination Rate of Triticum aestivum Grains

In order to set the experiment, was chosen one of the most cultivated plant on Earth–wheat, which offers flexibility in conducting experiments and is known as a test plant. Wheat grains germinate easily, usually after 48 h of exposure to humidity. This is beneficial for research, as any deviation from the normal germination of wheat grains indicates the action of an exogenous factor.
The inhibition of germination under the influence of different phenolic compounds has been demonstrated. The inhibition degree of germination was different, depending on the type of phenolic compound and its concentration. William et al. (1982) found that the simultaneously administration of more phenolic compounds determined stronger effects than individually treatments, because of additive effects [38]. It was proven that the grape marc contains bioactive polyphenols, such as resveratrol, whose content is even higher than in wines [39]. The phenolic compounds of grape marc extract (0.025–0.2%) may be responsible to a certain extent, for the moderate inhibition of wheat grain germination and alteration of the mitotic cycle of sprouts in the present experiment. According to Özkan [40] grape marc extracts from white and red grapes, in concentration of 0.5%, 1% and 2.5% have a strong antibacterial effect on a wide range of pathogenic bacteria. This explains the use of grape extracts in the food industry for food preservation.
Olejar [41] demonstrated the negative impact of Sauvignon blanc grape marc polyphenols on grains germination and growth of Daucus carota and Zea mays plants. However, the grape marc depleted of polyphenols can be used successfully in plant cultivation [41].
The inhibitory effect of other polyphenol-rich pomace, such as rowanberry pomace extracts, or Psidium cattleianum pomace extract, has been demonstrated in various bacterial cells and human cell lines [42,43].

4.2. Mitotic Index

The influence of various exogenous factors on plants affects the mitotic index, which in turn directly influences growth and development [44].
Our research has shown a high and positive correlation between grains germination rate and MI. In fact, grains germination rate is the expression of MI. MI is a valuable indicator of the growth rate of plant and animal organisms.
The synthesis of DNA through the mitotic cycle ensures cell division, which is continuous in the meristematic areas of plant and animal organisms.
The moderate decrease in MI indicates the presence of unfavorable factors in the growth medium. In the present experiment, the Merlot and Sauvignon blanc GME proved to affect in a certain measure the MI.
Shehab [45,46] observed the depression of the mitotic index in Pulicaria cispa, Teucrium pilosum, and Anastatica hierochuntica in the presence of plant aqueous extracts rich in polyphenolic compounds.
Resveratrol, a powerful antioxidant abundant in the grape marc, has a strong inhibitory effect on the rate of mitotic division, depending on the concentration of this compound, but also on the characteristics of the target cells [47].
Teerarak [48] stated that Allium cepa was treated with extracts of Jasminum officinale var. grandiflorum leaves—containing large amounts of the glycoside oleuropein—had a diminished seeds germination rate, as well as a reduced mitotic index, and the appearance of abnormal cells.

4.3. Frequency of Mitotic Phases

The cells distribution within mitotic phases permits to study the influence of eventual factors on mitotic cycle development. It is known that in normal division, the prophase and telophase cells have the highest frequencies, while metaphase and anaphase cells, the shortest frequencies [49]. The dynamics of the cell cycle regulate many cellular processes, for the study of which it is necessary to apply the methods of collecting temporal information with fluorescent biosensors that distinguish the stages of the cell cycle [50,51].
Monitoring the phases of the cell cycle through automated real-time image analysis is suitable for studying the effect of inhibitory compounds used in blocking cancer cells in various mitotic phases [52].
Changing the frequency of cells in the mitotic phases may be determined by various causes. Quite a few such cases have been reported in the literature, as:
Teucrium pilosum extract induced accumulation of prophases to the detriment of the other three mitotic phases in Allium cepa. Disorders of mitotic phase distribution were accompanied by chromosomal abnormalities [45].
Cymbopogon proximus extract caused the decrease in the cell number in prophase and the increase of cell number in metaphase and anaphase in Vicia faba root meristems, in parallel with the induction of aberrant cells [53].
The change in normal cell distribution in the mitotic phases occurs frequently under the influence of heavy metals, such as Pb, Cd and Cr, which drastically reduce the number of cells in metaphase and anaphase, in addition to inducing chromosomal abnormalities. In this sense, the protective action of anthocyanin extracts (from red cabbage leaves) against the aggression of heavy metals on onion roots have been demonstrated [54].
Another factor influencing the distribution of the cells within mitotic phases is the circadian cycle. Thus, in Treculia africana (African bread fruit) was established that during the day, the intensity of mitotic division is higher compared to night [55].
Accumulations of cells in prophase, accompanied by a high number of chromosomal abnormalities were caused by aqueous extracts from leaves of Azadirachta indica (a medicinal plant), tested on Allium roots [56].

4.4. Genetic Abnormalities

At the same time with the investigation of the distribution of Triticum aestivum cells in the four main phases of mitotic division, were also identified aberrant cells.
Aberrant A-T and micronuclei are structural modifications in chromosomes. Under the influence of mutagenic factors (physical, chemical, biological), the phosphodiester bonds of DNA macromolecules can break at various points. This breakage causes chromosomal lesions. At the level of the lesion, the chromosomes break, resulting in fragments with centromeres and acentric fragments (without centromeres). A centromere-free and telomere-free fragment can fuse through its sticky ends and form a genetically inert chromosomal ring, which is resorbed into the myxoplasm.
The chromosomal fragments of the root meristem cells of Triticum aestivum indicates that Merlot and Sauvinon blanc grape marc extracts have the potential to break the phosphodiester bonds of DNA, thus inducing chromosomal deletions. The sticky ends of a fragment with centromere can fuse, resulting in a genetically active ring chromosome. A chromosome that has lost a telomere can attach in rupture to another chromosome that has centromere. This forms dicentric chromosomes, which are responsible for ana-telophase chromosomal bridges [57].
Merlot and Sauvignon blanc GME induced different types of bridges: single, multiple, whole or broken. At the concentrations of 0.1% and 0.2% GME, the bridges were mostly multiple and whole. Merlot and Sauvignon blanc GME are also responsible for mitotic spindle disturbance, altering the normal kinetics of monochromatid chromosomes in anaphase, inducing multipolar ana-telophases. Thus, through genetic material remodeling, appear chromosomal aberrations, also named chromosomal mutations, having phenotypical negative implications. More than A-T aberrant, Merlot and Sauvignon blanc GME induced micronuclei in wheat root meristem cells. Micronuclei can appear through two mechanisms. One of these mechanisms is the aneugenic effect of genotoxic agent. It concerns the centromere inhibition of the chromosome which cannot be included anymore in the main nucleus, becoming micronuclei. The aneugenic effect induces aneuploidy by unbalanced segregation of chromosomes in daughter cells. The second mechanism consists in the clastogen effect of the genotoxic agent, when the chromosome breaks and loses the centromere. A broken chromosome without centromere cannot interact with the mitotic spindle and become a micronucleus. Clastogenic effects are also materialized by chromosomal bridges, chromatin breaks, chromosomal rings, chromosome fragments [57]. No matter the micronuclei generating mechanism, they are genetically inactive and are resorbed in the myxoplasm [37,58,59,60,61,62,63].
In our study, the identification of micronuclei demonstrates that Merlot and Sauvignon blanc GME have aneugenic and clastogenic effects. The presence of micronuclei means a significant loss of genetic information. The micronuclei are an important indicator for testing the induction of DNA damage by chemicals used in human activity, radiations, pharmaceuticals, cosmetics [64]. The cytometry and specialized software are used to facilitate the rapid and accurate testing of micronuclei presence [65]. Micronuclei’s investigation is very important because they are involved in the first steps of malignant human cells development [66].
Some researchers [67,68,69] studied the molecular mechanism of the anticancer effect of plant polyphenols, which consist of DNA degradation of human cancer cells. Thus, Hadi et al. have proved that several phenolic compounds can bind both DNA and transition metal ions (such as Cu2+), generating a ternary complex (DNA-polyphenol-Cu2+). They studied the redox processes involving this ternary complex, consisting in the reduction of Cu2+ to Cu1+, whose reoxidation generates different reactive oxygen species (superoxide anion, hydrogen peroxide, hydroxyl radical, etc). The same authors proved that the polyphenol—Cu2+ system is capable of causing DNA degradation in cells, but also, polyphenols alone (in the absence of copper ions) are able to cause DNA breakage in cells. They concluded that the anticancer mechanism of plant polyphenols involves mobilization of endogenous copper, possibly chromatin-bound copper, and the consequent prooxidant action, inducing DNA breakage [69].
In the present study, we demonstrated that Merlot and Sauvignon blanc GME induced different levels of nuclear damage in healthy wheat meristematic cells. From this fact arises the question: «Do polyphenols induce DNA damage only in cancer cells?», which needs further research.
In our study, the presence of A-T aberrant and micronuclei in wheat meristematic cells represent the proof that Merlot and Sauvignon blanc GME have genotoxic potential.
All the nuclear abnormalities identified represent losses of genetic information, with negative consequences on wheat plant growth and development. These genetic abnormalities appeared after 48 h of contact of the embryonic roots with Merlot and Sauvignon blanc GME (in Petri dishes). It is possible that a longer time (over 48 h) of exposure to GME would increase the frequency of aberrant cells.
The phytotoxic effects of grape marc on wheat, proved by the present study agree with the findings of Sta [70], which proved that grape marc induces cell death in Vicia faba. The authors found that grape marc added to an herbicide (sulcotrione or Mikado), enhances the herbicidal effect through synergy. Addition of grape marc to herbicides (sulcotrione, or Mikado) resulted in different expression of genes usually associated with cell stress [70].
The results of the present study do not contradict the recognized beneficial effects of grape marc extracts in organisms, but point out that at certain concentrations, and at certain exposure times, they may have negative effects.

5. Conclusions

Our study provides thorough information on the interaction of grape marc aqueous extracts with germinating grains. A similar interaction may occur on fields, if winemaking waste is deposited on the soil, and it can exert an abiotic stress on the crops in the proximity. The results prove that Merlot and Sauvignon blanc grape marc extracts at concentrations between 0.025 and 0.2% have phytotoxic and genotoxic potential on Triticum aestivum.
The same concentration of the two grape marc extracts (Merlot and Sauvignon blanc) induce different degrees of damage on grains germination, mitotic index and cytogenetic parameters. Thus, Merlot extracts were slightly more aggressive, compared to Sauvignon blanc extracts.
As the grape marc concentration increases, the germination rate and mitotic index decrease moderately, while the percent of cells with chromosomal aberrations (bridges, fragments, associations between bridges and chromosomal fragments, multipolar ana-telophases) and micronuclei increase.
Based on the obtained results, we suggest that winemaking waste should not be stored unprocessed on the soil, as it has negative effects on the flora from the immediate proximity. We recommend further in-depth studies, in order to analyze the possibilities to valorize the grape marc as a bio-herbicide.

Author Contributions

Conceptualization, A.P. and S.P.; methodology, S.P. and A.P.; software, A.P.; validation, S.P.; formal analysis, A.P.; investigation, S.P. and A.P.; resources, A.P. and S.P.; data curation, S.P.; visualization, S.P.; writing—original draft preparation, S.P.; writing—review and editing, A.P.; supervision, A.P.; project administration, A.P.; funding acquisition, A.P. All authors have read and agreed to the published version of the manuscript.

Funding

Project AUF-ECO_RI_SRI_2021_20_USAMVIIBI_ZERODECHET “Horticultural wastes in the benefit of health and environment, a new approach to the ZEROWASTE principle” funded by the University Agency of Francophony (AUF) and project 2SOFT/1.2/83 “Intelligent valorisation of agro-food industrial wastes” funded by the European Union, within the program Cross border cooperation Romania—Republic of Moldova 2014–2020.

Institutional Review Board Statement

Not applicable.

Informed Consent Statement

Not applicable.

Data Availability Statement

Not applicable.

Acknowledgments

The authors want to thank Horticultural Research Center of the “Ion Ionescu de la Brad” University of Life Sciences, Iasi, Romania, Filimon Vasile Razvan, and Baetu Marius Mihai.

Conflicts of Interest

The authors declare no conflict of interest. The funders had no role in the design of the study; in the collection, analyses, or interpretation of data; in the writing of the manuscript, or in the decision to publish the results.

References

  1. Spigno, G.; Marinoni, L.; Garrido, G.D. State of the art in grape processing by-products. In Handbook of Grape Processing By-Products; Galanakis, C., Ed.; Academic Press: Cambridge, MA, USA, 2017; pp. 1–27. [Google Scholar]
  2. Dávila, I.; Robles, E.; Egüés, I.; Labidi, J.; Gullón, P. The biorefinery concept for the industrial valorization of grape processing by-products. In Handbook of Grape Processing By-Products; Galanakis, C., Ed.; Academic Press: Cambridge, MA, USA, 2017; pp. 29–53. [Google Scholar]
  3. Tylewicz, U.; Nowacka, M.; Martín-García, B.; Wiktor, A.; Caravaca, A.M.G. Target sources of polyphenols in different food products and their processing by-products. In Polyphenols: Properties, Recovery and Applications; Galanakis, C., Ed.; Woodhead Publishing: Sawston, UK, 2018; pp. 135–175. [Google Scholar]
  4. Cristea, E.; Sturza, R.; Jauregi, P.; Niculaua, M.; Ghendov Moșanu, A.; Patras, A. Influence of pH and ionic strength on the color parameters and antioxidant properties of an ethanolic red grape marc extract. J. Food Biochem. 2019, 43, e12788. [Google Scholar] [CrossRef] [PubMed]
  5. Fu, L.; Xu, B.T.; Xu, X.R.; Gan, R.Y.; Zhang, Y.; Xia, E.Q.; Li, H.B. Antioxidant capacities and total phenolic content s of 62 fruits. Food Chem. 2011, 129, 345–350. [Google Scholar] [CrossRef] [PubMed]
  6. Sant’Anna, V.; Brandelli, A.; Marczak, L.D.F.; Tessaro, I.C. Kinetic modeling of total polyphenol extraction from grape marc and characterization of the extracts. Sep. Purif. Technol. 2012, 100, 82–87. [Google Scholar] [CrossRef]
  7. Van Leeuwen, C.; Friant, P.; Chone, X.; Tregoat, O.; Koundouras, S.; Dubourdieu, D. Influence of climate, soil, and cultivar on terroir. Am. J. Enol. Vitic. 2004, 55, 207–217. [Google Scholar]
  8. Pereira, G.E.; Gaudillere, J.P.; van Leeuwen, C.; Hilbert, G.; Maucourt, M.; Deborde, C.; Moing, A.; Rolin, D. 1H NMR metabolite fingerprints of grape berry: Comparison of vintage and soil effects in Bordeaux grapevine growing areas. Anal. Chim. Acta 2006, 563, 346–352. [Google Scholar] [CrossRef]
  9. Alibante, A.; Lakka, A.; Bozinou, E.; Chatzilazarou, A.; Lalas, S.; Makris, D.P. Integrated Green Process for the Extraction of Red Grape Pomace Antioxidant Polyphenols Using Ultrasound-Assisted Pretreatment and beta-Cyclodextrin. Beverages 2021, 7, 59. [Google Scholar] [CrossRef]
  10. Cristea, E.; Sturza, R.; Patras, A. The influence of temperature and time on the stability of the antioxidant activity and colour parameters of grape marc ethanolic extract. Food Technol. 2015, 39, 96–104. [Google Scholar]
  11. Tanase, C.; Bujor, O.C.; Popa, V.I. Phenolic natural compounds and their influence on physiological processes in plants. In Polyphenols in Plants, 2nd ed.; Academic Press: Bucharest, Romania, 2019; pp. 45–58. [Google Scholar]
  12. Fuhrman, B.; Volkova, N.; Suraski, A.; Aviram, M. White wine with red wine-like properties: Increased extraction of grape skin polyphenols improves the antioxidant capacity of the derived white wine. J. Agric. Food Chem. 2001, 49, 3164–3168. [Google Scholar] [CrossRef]
  13. Ivanova, V.; Stefova, M.; Vojnoski, B.; Dörnyei, Á.; Márk, L.; Dimovska, V.; Stafilov, T.; Kilár, F. Identification of polyphenolic compounds in red and white grape varieties grown in R. Macedonia and changes of their content during ripening. Food Res. Int. 2011, 44, 2851–2860. [Google Scholar] [CrossRef]
  14. Rahbar, A.R.; Shakouri, M.M.; Shahidul Islam, M. Comparative effects of red and white grapes on oxidative markers and lipidemic parameters in adult hypercholesterolemic humans. Food Funct. 2015, 6, 1992–1998. [Google Scholar] [CrossRef] [PubMed] [Green Version]
  15. Gomes, T.M.; Toaldo, I.M.; Silva Haas, I.C.; Burin, V.M.; Caliari, V.; Luna, A.S.; Santos de Gois, J.; Bordignon-Luiz, M.T. Differential contribution of grape peel, pulp, and seed to bioaccessibility of micronutrients and major polyphenolic compounds of red and white grapes through simulated human digestion. J. Func. Foods 2019, 52, 699–708. [Google Scholar] [CrossRef]
  16. Jara-Palacios, M.J.; Hernanz, D.; Cifuentes-Gomez, T.; Escudero-Gilete, M.L.; Heredia, F.J.; Spencer, J.P.E. Assessment of white grape pomace from winemaking as source of bioactive compounds, and its antiproliferative activity. Food Chem. 2015, 183, 78–82. [Google Scholar] [CrossRef] [Green Version]
  17. Tian, Q.; Xu, Z.; Sun, X.; Deavila, J.; Du, M. Grape pomace inhibits colon carcinogenesis by suppressing cell proliferation and inducing epigenetic modifications. J. Nutr. Biochem. 2020, 84, 108443. [Google Scholar] [CrossRef]
  18. Yasui, Y.; Kim, M.; Oyama, T.; Tanaka, T. Colorectal carcinogenesis and suppression of tumor development by inhibition of enzymes and molecular targets. Curr. Enzym. Inhib. 2009, 5, 1–26. [Google Scholar] [CrossRef]
  19. Shan, B.E.; Wang, M.X.; Li, R.G. Quercetin inhibit human sw480 colon cancer growth in association with inhibition of cyclin d1 and surviving expression through Wnt/β-catenin signaling pathway. Cancer Invest. 2009, 27, 604–612. [Google Scholar] [CrossRef]
  20. Gómez-Alonso, S.; Collins, V.J.; Vauzour, D.; Rodríguez-Mateos, A.; Corona, G.; Spencer, J.P.E. Inhibition of colon adenocarcinoma cell proliferation by flavonols is linked to a G2/M cell cycle block and reduction in cyclin D1 expression. Food Chem. 2012, 130, 493–500. [Google Scholar] [CrossRef]
  21. Abdel-Moneim, E.; Shehata, A.M.; Alzahrani, S.O.; Shafi, M.E.; Mesalam, N.M.; Taha, A.E.; Swelum, A.A.; Arif, M.; Fayyaz, M.; Abd El-Hack, M.E. The role of polyphenols in poultry nutrition. J. Anim. Physiol. Anim. Nutr. 2020, 104, 1851–1866. [Google Scholar] [CrossRef]
  22. Kim, E.Y.; Pai, T.K.; Han, O. Effect of bioactive dietary polyphenols on zinc transport across the intestinal Caco-2 cell monolayers. J. Agr. Food Chem. 2011, 59, 3606–3612. [Google Scholar] [CrossRef] [PubMed] [Green Version]
  23. Ma, Q.; Kim, E.Y.; Lindsay, E.A.; Han, O. Bioactive dietary polyphenols inhibit heme iron absorption in a dose-dependent manner in human intestinal Caco-2 cells. J. Food Sci. 2011, 76, 143–150. [Google Scholar] [CrossRef] [Green Version]
  24. Acésio, N.A.; Carrijo, G.S.; Batista, T.H.; Damasceno, J.L.; Côrrea, M.B.; Tozatti, M.G.; Cunha, W.R.; Tavares, D.C. Assessment of the antioxidant, cytotoxic, and genotoxic potential of the Annona muricata leaves and their influence on genomic stability. J Toxicol. Environ. Health Part A 2017, 80, 1290–1300. [Google Scholar] [CrossRef] [PubMed]
  25. Rody, H.V.S.; Gontyo, D.C.; Coelho, M.V.P.; Ventrella, M.C.; Pádua, R.M.; Fietto, L.G.; Leite, V.J.P. Mutagenic activity and chemical composition of phenolic-rich extracts of leaves from two species of Ficus medicinal plants. Toxicol. Environ. Health Part A 2018, 81, 861–872. [Google Scholar] [CrossRef]
  26. Ramos, S.; Alia, M.; Bravo, L.; Goya, L. Comparative effects of food-derived polyphenols on the viability and apoptosis of a human hepatoma cell line (HepG2). J. Agric. Food Chem. 2005, 53, 1271–1280. [Google Scholar] [CrossRef]
  27. Ugartondo, V.; Mitjans, M.; Lozano, C.; Torres, J.L.; Vinardell, M.P. Comparative study of the cytotoxicity induced by antioxidant epicatechin conjugates obtained from grape. J. Agric. Food Chem. 2006, 54, 6945–6950. [Google Scholar] [CrossRef]
  28. Stagos, D.; Spanou, C.; Margariti, M.; Stathopoulos, C.; Mamuris, Z.; Kazantzoglou, G.; Magiatis, P.; Kouretas, D. Cytogenetic effects of grape extracts (Vitis vinifera) and polyphenols on mitomycin C-induced sister chromatid exchanges (SCEs) in human blood lymphocytes. J. Agric. Food Chem. 2007, 55, 5246–5252. [Google Scholar] [CrossRef] [PubMed]
  29. Fan, P.; Lou, H.X. Effects of polyphenols from grape seeds on oxidative damage to cellular DNA. Mol. Cell. Biochem. 2008, 267, 67–74. [Google Scholar] [CrossRef] [PubMed]
  30. Xia, E.Q.; Deng, G.F.; Guo, Y.J.; Li, H.B. Biological activities of polyphenols from grapes. Int. J. Mol. Sci. 2010, 11, 622–646. [Google Scholar] [CrossRef]
  31. Jitareanu, A.; Caba, I.C.; Trifan, A.; Padureanu, S.; Agoroaei, L. Triticum aestivum assay—A useful tool for environmental monitoring and toxicity assessment. Not. Bot. Horti Agrobot. Cluj-Napoca 2019, 47, 1005–1018. [Google Scholar] [CrossRef] [Green Version]
  32. Fiskesjö, G. The Allium test as a standard in environmental monitoring. Hereditas 1985, 102, 99–112. [Google Scholar] [CrossRef]
  33. Fiskesjö, G. Allium test I: A 2–3 day plant test for toxicity assessment by measuring the mean root growth of onions (Allium cepa L. ) Environ. Toxicol. Water Qual. 1993, 8, 461–470. [Google Scholar] [CrossRef]
  34. Aksoy, O.; Deveci, A. The investigation of the cytotoxic effects of some pesticides on soybean (Glycine max L.). Cytologia 2012, 77, 475–483. [Google Scholar] [CrossRef] [Green Version]
  35. Shehab, A.S. Cytological effects of medicinal plants in Qatar. I. Mitotic effect of water extract of Pulicaria crispa on Allium cepa. Cytologia 1979, 44, 607–613. [Google Scholar] [CrossRef] [PubMed] [Green Version]
  36. Türkoğlu, S. Genotoxicity of five food preservatives tested on root tips of Allium cepa L. Mutat. Res. 2007, 626, 4–14. [Google Scholar] [CrossRef]
  37. Nefic, H.; Musanovic, J.; Metovic, A.; Kurteshi, K. Chromosomal and nuclear alterations in root tip cells of Allium cepa L. induced by alprazolam. Med. Arch. 2013, 67, 388–392. [Google Scholar] [CrossRef] [PubMed] [Green Version]
  38. Williams, R.D.; Hoagland, R.E. The effects of naturally occurring phenolic compounds on seed germination. Weed Sci. 1982, 30, 206–212. [Google Scholar] [CrossRef]
  39. Ianni, A.; Martino, G. Dietary grape pomace supplementation in dairy cows: Effect on nutritional quality of milk and its derived dairy products. Foods 2020, 9, 168. [Google Scholar] [CrossRef] [Green Version]
  40. Özkan, G.; Sagdiç, O.; Baydar, G.N.; Kurumahmutoglu, Z. Antibacterial activities and total phenolic contents of grape pomace extracts. J. Sci. Food Agric. 2004, 84, 1807–1811. [Google Scholar] [CrossRef]
  41. Olejar, K.J.; Vandermeer, C.; Fedrizzi, B.; Kilmartin, P.A. A horticultural medium established from the rapid removal of phytotoxins from winery grape marc. Horticulturae 2019, 5, 69. [Google Scholar] [CrossRef] [Green Version]
  42. Medina, A.L.; Haas, L.I.R.; Chaves, F.C.; Salvador, M.; Zambiazi, R.C.; Silva, W.P.; Nora, L.; Rombaldi, C.V. Araçá (Psidium cattleianum Sabine) fruit extracts with antioxidant and antimicrobial activities and antiproliferative effect on human cancer cells. Food Chem. 2011, 128, 916–922. [Google Scholar] [CrossRef] [Green Version]
  43. Bobinaitė, R.C.; Grootaert, C.; Camp, J.V.; Šarkinas, A.P.R.; Liaudanskas, M.; Žvikas, V.; Viškelis, P.; Venskutonis, P.R. Chemical composition, antioxidant, antimicrobial and antiproliferative activities of the extracts isolated from the pomace of rowanberry (Sorbus aucuparia L.). Food Res. Int. 2020, 136, 109310. [Google Scholar] [CrossRef] [PubMed]
  44. Oliveira, C.; Ramos, S.J.; Siqueira, J.O.; Faquin, V.; Castro, E.M.; Amaral, D.C.; Techio, V.H.; Coelho, L.C.; Silva, P.H.P.; Schnug, E.; et al. Bioaccumulation and effects of lanthanum on growth and mitotic index in soybean plants. Ecotox. Environ. Saf. 2015, 122, 136–144. [Google Scholar] [CrossRef]
  45. Shehab, A.S. Cytological Effects of Medicinal Plants in Qatar. II. Mitotic effect of water extract of Teucrium pilosum on Allium cepa. Cytologia 1980, 45, 57–64. [Google Scholar] [CrossRef] [PubMed] [Green Version]
  46. Shehab, A.S.; Adam, Z.M. Cytological effects of medicinal plants in Qatar. III. Mitotic effect of water extract of Anastatica hierochuntica L. on Allium cepa. Cytologia 1983, 48, 343–348. [Google Scholar] [CrossRef] [Green Version]
  47. Pozo-Guisado, E.; Alvarez-Barrientos, A.; Mulero-Navarro, S.; Santiago-Josefat, B.; Fernandez-Salguero, P.M. The antiproliferative activity of resveratrol results in apoptosis in MCF-7 but not in MDA-MB-231 human breast cancer cells: Cell-specific alteration of the cell cycle. Biochem. Pharmacol. 2002, 64, 1375–1386. [Google Scholar] [CrossRef]
  48. Teerarak, M.; Laosinwattana, C.; Charoenying, P. Evaluation of allelopathic, decomposition and cytogenetic activities of Jasminum officinale L. f. var. grandiflorum (L.) Kob. on bioassay plants. Bioresour. Technol. 2010, 101, 5677–5684. [Google Scholar]
  49. Gavrilă, L. Genomica, 1st ed.; Enciclopedica: Bucharest, Romania, 2003; Volume 1, pp. 46–52. [Google Scholar]
  50. Easwaran, H.P.; Leonhardt, H.; Cardoso, M.C. Cell cycle markers for live cell analyses. Cell Cycle 2005, 4, 453–455. [Google Scholar] [CrossRef]
  51. Hahn, A.T.; Jones, J.T.; Meyer, T. Quantitative analysis of cell cycle phase durations and PC12 differentiation using fluorescent biosensors. Cell Cycle 2009, 8, 1044–1052. [Google Scholar] [CrossRef] [Green Version]
  52. Padfield, D.; Rittscher, J.; Thomas, N.; Roysam, B. Spatio-temporal cell cycle phase analysis using level sets and fast marching methods. Med. Image Anal. 2009, 13, 143–155. [Google Scholar] [CrossRef]
  53. Adam, Z.M.; Farah, O.R. Cytological effects of water extracts of medicinal plants in Egypt mitotic disturbances induced by water extract of Cymbopogon proximus (Halfa barr) on Vicia faba. Citologia 1989, 54, 489–492. [Google Scholar] [CrossRef] [Green Version]
  54. Glińska, S.; Bartczak, M.; Oleksiak, S.; Wolska, A.; Gabara, B.; Posmyk, M.; Janas, K. Effects of anthocyanin-rich extract from red cabbage leaves on meristematic cells of Allium cepa L. Roots treated with heavy metals. Ecotoxicol. Environ. Saf. 2007, 68, 343–350. [Google Scholar] [CrossRef]
  55. Osuji, J.O.; Owei, S.D. Mitotic index studies on ‘Treculia Africana’ Decne in Nigeria. Aust. J. Agric. Eng. 2010, 1, 25–28. [Google Scholar]
  56. Akaneme, F.I.; Amaefule, C.C. Evaluation of the cytotoxicity and genotoxicity of aqueous leaf extracts of Azardirachta indica A. Juss. using the Allium test. J. Med. Plants Res. 2012, 6, 3898–3907. [Google Scholar] [CrossRef] [Green Version]
  57. Khanna, N.; Sharma, S. Allium cepa root chromosomal aberration assay: A Review. Indian J. Pharm. Biol. Res. 2013, 1, 105–119. [Google Scholar] [CrossRef]
  58. Kharitonov, V.S.; Semenov, V.V.; Barabanshchikov, B.I. Purine receptor agonists protect the genome of plant and animal cells from clastogen damage. Bull. Exp. Biol. Med. 2001, 132, 666–669. [Google Scholar] [CrossRef] [PubMed]
  59. Vanhauwaert, A.; Vanparys, P.; Kirsch-Volders, M. The in vivo gut micronucleus test detects clastogens and aneugens given by gavage. Mutagenesis 2001, 16, 39–50. [Google Scholar] [CrossRef] [Green Version]
  60. Fenech, M. Cytokinesis-block micronucleus cytome assay. Nat. Protoc. 2007, 2, 1084–1104. [Google Scholar] [CrossRef] [Green Version]
  61. Leme, D.M.; Franceschi de Angelis, D.; Marin-Morales, M.A. Action mechanisms of petroleum hydrocarbons present in waters impacted by an oil spill on the genetic material of Allium cepa root cells. Aquat. Toxicol. 2008, 88, 214–219. [Google Scholar] [CrossRef] [PubMed]
  62. Trushin, M.V.; Ratushnyak, A.Y.; Arkharova, I.A.; Ratushnyak, A.A. Genetic alterations revealed in Allium cepa-test system under the action of some xenobiotics. World Appl. Sci. J. 2013, 22, 342–344. [Google Scholar]
  63. Bolzán, A.D. Using telomeric chromosomal aberrations to evaluate clastogen-induced genomic instability in mammalian cells. Chromosome Res. 2020, 28, 259–276. [Google Scholar] [CrossRef]
  64. Akaneme, F.I.; Iyioke, I.V. Mutagenic potentials of the sterilizing fluid—Purital on root tip mitosis of Allium cepa. Bio-Res. 2008, 6, 293–297. [Google Scholar]
  65. Rodrigues, M.A.; Probst, C.E.; Zayats, A.; Davidson, B.; Riedel, M.; Li, Y.; Venkatachalam, V. The in vitro micronucleus assay using imaging flow cytometry and deep learning. NPJ Syst. Biol. Appl. 2021, 7, 20. [Google Scholar] [CrossRef] [PubMed]
  66. Hintzsche, H.; Ulrike, H.U.; Poth, A.; Utesch, D.; Lott, J.; Stopper, H. Fate of micronuclei and micronucleated cells. Mutat. Res./Rev. Mutat. Res. 2017, 771, 85–98. [Google Scholar] [CrossRef] [PubMed]
  67. Burkitt, M.J.; Milne, L.; Nicotera, P.; Orrenius, S. 1,10-Phenanthroline stimulates internucleosomal DNA fragmentation in isolated rat-liver nuclei by promoting redox activity of endogenous copper ions. Biochem. J. 1996, 313, 163–169. [Google Scholar] [CrossRef]
  68. Azmi, A.S.; Bhat, S.H.; Hadi, S.M. Resveratrol–Cu(II) induced DNA breakage in human peripheral lymphocytes: Implications for anticancer properties. FEBS Lett. 2005, 579, 3131–3135. [Google Scholar] [CrossRef] [PubMed] [Green Version]
  69. Hadi, S.M.; Bhat, S.H.; Azmi, A.S.; Hanif, S.; Shamim, U.; Ullah, M. Oxidative breakage of cellular DNA by plant polyphenols: A putative mechanism for anticancer properties. Semin. Cancer Biol. 2007, 17, 370–376. [Google Scholar] [CrossRef] [PubMed]
  70. Sta, C.; Goujon, E.; Ferjani, E.; Ledoigt, G. Toxicity of sulcotrione and grape marc on Vicia faba cells. J. Agric. Food Chem. 2014, 62, 11777–11785. [Google Scholar] [CrossRef]
Figure 1. Germination rate of Triticum aestivum grains after 48 h of incubation with grape marc extracts. Different letters (a–e) denote significant differences, p < 0.05.
Agronomy 12 01371 g001
Figure 2. Cells in interphase (%) and division (%) in Triticum aestivum root meristems treated with grape marc extracts. Different letters (a–h) denote significant differences, p < 0.05.
Agronomy 12 01371 g002
Figure 3. Correlation between germination rate of grains and mitotic index.
Agronomy 12 01371 g003
Figure 4. Frequency of genetic abnormalities type in wheat root meristematic cells induced by Merlot and Sauvignon blanc grape marc extracts.
Agronomy 12 01371 g004
Figure 5. Correlation between genetic abnormalities (%) and mitotic index (%) in wheat root meristem cells treated with Merlot and Sauvignon blanc grape marc extracts.
Agronomy 12 01371 g005
Figure 6. Correlation between aberrant A-T and micronuclei in wheat root meristem cells treated with Merlot and Sauvignon blanc grape marc extracts.
Agronomy 12 01371 g006
Figure 7. Microphotographs with different types of genetic abnormalities in wheat root meristem cells induced by various concentrations of Merlot and Sauvignon blanc grape marc extracts: (a) multipolar anaphase with multiple whole bridges (b) early telophase with one whole and several broken multiple bridges; (c) telophase with a whole bridge and several broken bridges; (d) telophase with two whole bridges; (e) two telophases: one with whole bridge, one with two broken bridges; (f) telophase with two broken bridges; (gi) interphases with one micronucleus each; (j) interphase with two micronuclei (magnification: 1000×).
Agronomy 12 01371 g007aAgronomy 12 01371 g007b
Table 1. Mitotic phases of wheat root meristem cells exposed to different concentrations of Merlot and Sauvignon blanc grape marc extracts.
VariantMean Number of CellsMitotic Index (%)Cells in Prophase (%)Cells in Metaphase (%)Cells in Anaphase (%)Cells in Telophase (%)
Control10.46525.33 ± 0.65 h11.09 ± 0.89 cd4.34 ± 0.06 d2.43 ± 0.54 c7.47 ± 0.38 cde
M110.06022.17 ± 0.09 ef9.74 ± 0.45 bc4.22 ± 0.33 d2.14 ± 0.15 bc6.07 ± 0.78 bc
SB111.15624.00 ± 0.13 g10.97 ± 0.02 cd2.69 ± 0.24 b1.88 ± 0.24 bc8.46 ± 0.35 de
M210.58521.63 ± 0.18 de11.41 ± 0.35 d3.44 ± 0.04 c1.39 ± 0.08 ab5.39 ± 0.49 bc
SB210.57422.88 ± 0.06 f9.44 ± 0.04 b2.46 ± 0.03 b1.66 ± 0.08 bc9.32 ± 0.05 e
M310.50718.25 ± 0.23 b10.71 ± 0.27 bcd2.76 ± 0.12 b1.48 ± 0.11 bc3.30 ± 0.27 a
SB310.92321.01 ± 0.72 cd10.59 ± 0.71 bcd2.33 ± 0.03 b1.21 ± 0.08 ab6.88 ± 0.37 bcd
M410.71211.34 ± 0.56 a4.74 ± 0.35 a1.27 ± 0.15 a0.51 ± 0.06 a4.82 ± 0.66 ab
SB411.57320.40 ± 0.13 c10.84 ± 0.92 bcd2.38 ± 0.37 b1.84 ± 0.08 bc5.34 ± 0.23 ab
Data represent mean values ± standard deviation. Different letters (a–g) denote significant differences, p < 0.05.
Table 2. Frequency of genetic abnormalities in mitotic cycle of Triticum aestivum root meristem cells treated with Merlot and Sauvignon blanc grape marc extracts.
VariantCells in A-T (%)Cells in Interphase (%)
Normal A-T (%)Aberrant A-T(%)Normal Interphase (%)Aberrant Interphase (%)
Control9.77 ± 0.73 d0.13 ± 0.01 a74.67 ± 0.62 a0.07 ± 0.01 a
M17.41 ± 0.57 bc0.80 ± 0.06 b77.63 ± 0.08 d0.20 ± 0.03 ab
SB19.62 ± 0.11 cd0.72 ± 0.05 b75.96 ± 0.13 b0.04 ± 0.01 a
M25.07 ± 0.13 ab1.71 ± 0.09 cd78.08 ± 0.02 e0.29 ± 0.05 b
SB210.08 ± 0.09 d0.90 ± 0.04 b77.06 ± 0.07 c0.06 ± 0.01 a
M32.98 ± 0.42 a1.80 ± 0.04 cd81.25 ± 0.25 h0.50 ± 0.01 c
SB36.89 ± 0.48 b1.2 ± 0.02 bc78.81 ± 0.66 f0.18 ± 0.06 ab
M43.09 ± 0.64 a2.24 ± 0.11 d87.59 ± 0.42 i1.07 ± 0.07 d
SB45.81 ± 0.15 b1.37 ± 0.01 bcm79.28± 0.11 g0.32 ± 0.03 bc
Data represent mean values ± standard deviation. Different letters (a–i) denote significant differences, p < 0.05.
Publisher’s Note: MDPI stays neutral with regard to jurisdictional claims in published maps and institutional affiliations.

