Article

Energy, Economic, and Environmental Assessment of Sweet Potato Production on Plantations of Various Sizes in South China

1
Crops Research Institute, Guangdong Academy of Agricultural Sciences & Key Laboratory of Crop Genetic Improvement of Guangdong Province, Guangzhou 510640, China
2
Institute of Agricultural Resources and Environment, Guangdong Academy of Agricultural Sciences, Guangzhou 510640, China
3
School of Environment, Beijing Normal University, Beijing 100875, China
*
Author to whom correspondence should be addressed.
Agronomy 2022, 12(6), 1290; https://doi.org/10.3390/agronomy12061290
Submission received: 9 April 2022 / Revised: 25 May 2022 / Accepted: 25 May 2022 / Published: 28 May 2022

Abstract

:
Sweet potato (Ipomoea batatas L.) is an important starch-producing crop used worldwide. However, few studies have been conducted on the energy efficient, cost benefit, and greenhouse gas (GHG) emissions of sweet potato production. To address this issue, the data were collected using a questionnaire for face-to-face interviews of 78 sweet potato growers and 74 reference crop (i.e., rice, maize, and potato) growers in Guangdong province. Results revealed that sweet potato production exhibited the highest value of energy efficiency (0.83 kg MJ−1) and economic productivity (0.85 kg CNY−1) among four crops. The GHG emissions from sweet potato production (1165 kg CO2-eq ha−1) were significantly higher than GHG from rice and maize but lower than GHG from potatoes. Moreover, plantation size significantly (p < 0.05) affected inputs of labor, machinery, and diesel fuel and further affected the energy rate, energy efficiency, and GHG emissions of sweet potato production. Sweet potato production in small-size farms (<2.0 ha) exhibited the highest energy efficiency (0.97 kg MJ−1) and the lowest GHG emissions (1045 kg CO2-eq ha−1). Quartering assessments based on energy efficiency, economic productivity, and GHG emissions showed that fertilizers and labor were the major contributors to energy consumption, economic costs, and GHG emissions. Future efforts should be made to reduce fertilizer application and increase fertilizer use efficiency for sustainable sweet potato production.

1. Introduction

Sweet potato (Ipomoea batatas L.) plays an old and important role in food culture worldwide [1]. Sweet potato contains simple fermentable sugars (e.g., sucrose, glucose, and fructose), dietary fibers, and minimal amounts of proteins, lipids, and functional components [2,3], attributes that have contributed to its role as an important food crop in many developing countries. In addition, sweet potato has been considered a preferred starch-based feedstock for industrial production [4,5].
China, as the leading producer of sweet potatoes, had an annual production of 49 million tons (55% of the world’s production) in 2020 [6]. Sweet potato is cultivated in 27 provinces in China, and its large production regions are distributed in the southwest, east, and south of China. Sweet potatoes once served as the major food in China; in recent years, more than 70% of sweet potatoes have been used for industrial purposes. The proportion of sweet potato as a staple food has declined significantly compared with other crops, i.e., rice (Oryza sativa L.), maize (Zea mays L.), wheat (Triticum aestivum L.), and potato (Solanum tuberosum L.). However, the sweet potato can still be viewed as an emergency food crop when the staple food crops face supply deficit risks [7]. In addition, sweet potato-based bioethanol could ensure food security, satisfy the non-grain biofuel feedstock requirement, reduce petroleum dependency, and generates development opportunities in the agricultural and agro-industrial sectors [5,8]. To further improve the efficiency and sustainability of sweet potatoes, it is of great significance to comprehensively assess sweet potato production from an energy, economic, and environmental perspective.
Energy efficiency is an important factor in the assessment and optimization of a product [9,10]. Enhancement of energy efficiency in agriculture has been shown to save energy resources, improve farm profits, and protect the environment [11]. Economic analysis is also a vital factor that should be considered for promoting the sustainable development of agricultural systems [1,12]. Moreover, environmental performance, especially greenhouse gas (GHG) emissions, is a central worldwide environmental concern. The mitigation of GHG emissions from agricultural systems has been identified as an attractive strategy for stabilizing carbon dioxide emissions before 2030 [13,14]. To date, numerous studies have investigated energy, economic, or environmental consequences of agricultural production with a focus on cereal crops (e.g., rice, maize, and wheat) [15,16,17,18], horticultural crops (e.g., potato, tomato (Solanum lycopersicum), and apple (Malus domestica)) [9,19,20], and bioenergy crops (e.g., sweet sorghum (Sorghum bicolor L.), Jerusalem artichoke (Helianthus tuberosus L.), and fodder galega (Galega orientalis Lam.)) [12,21,22]. However, to our knowledge, few studies have been published on the energy balance, economic benefit, and environmental performance of sweet potato production. Furthermore, plantation size could affect energy consumption, inputs cost, and GHG emissions of crop production [11]. Nassiri and Singh [23] revealed that small-size farms had high energy efficiency as compared to larger farms for rice production. Wu et al. [14] found that plantation size was a factor in the use intensity of agricultural chemicals in China. However, this issue has not yet been sufficiently considered in sweet potato production.
Guangdong province has abundant solar radiation and water resources, creating favorable conditions for growing sweet potatoes throughout the entire year. The province was taken as a case study because Guangdong is a typical province of intensive sweet potato farming, with an annual production of 3.5 million tons, accounting for 6.6% of the crop in China [24]. Therefore, the specific objectives of this study were (i) to assess the energy and economic inputs and outputs and GHG emissions of sweet potato production per hectare in Guangdong, China; (ii) to analyze the effect of plantation size on energy, economic, and environmental performance of sweet potato production; and (iii) to propose operations where energy and cost savings could be realized by changing applied practices in order to increase the energy efficiency and economic productivity and reduce GHG emissions for sweet potato production. The findings of this study may not only provide support for the sustainable development of sweet potatoes but also provide an important reference for sweet potato production in other developing countries that have similar situations to Guangdong province of China.

2. Materials and Methods

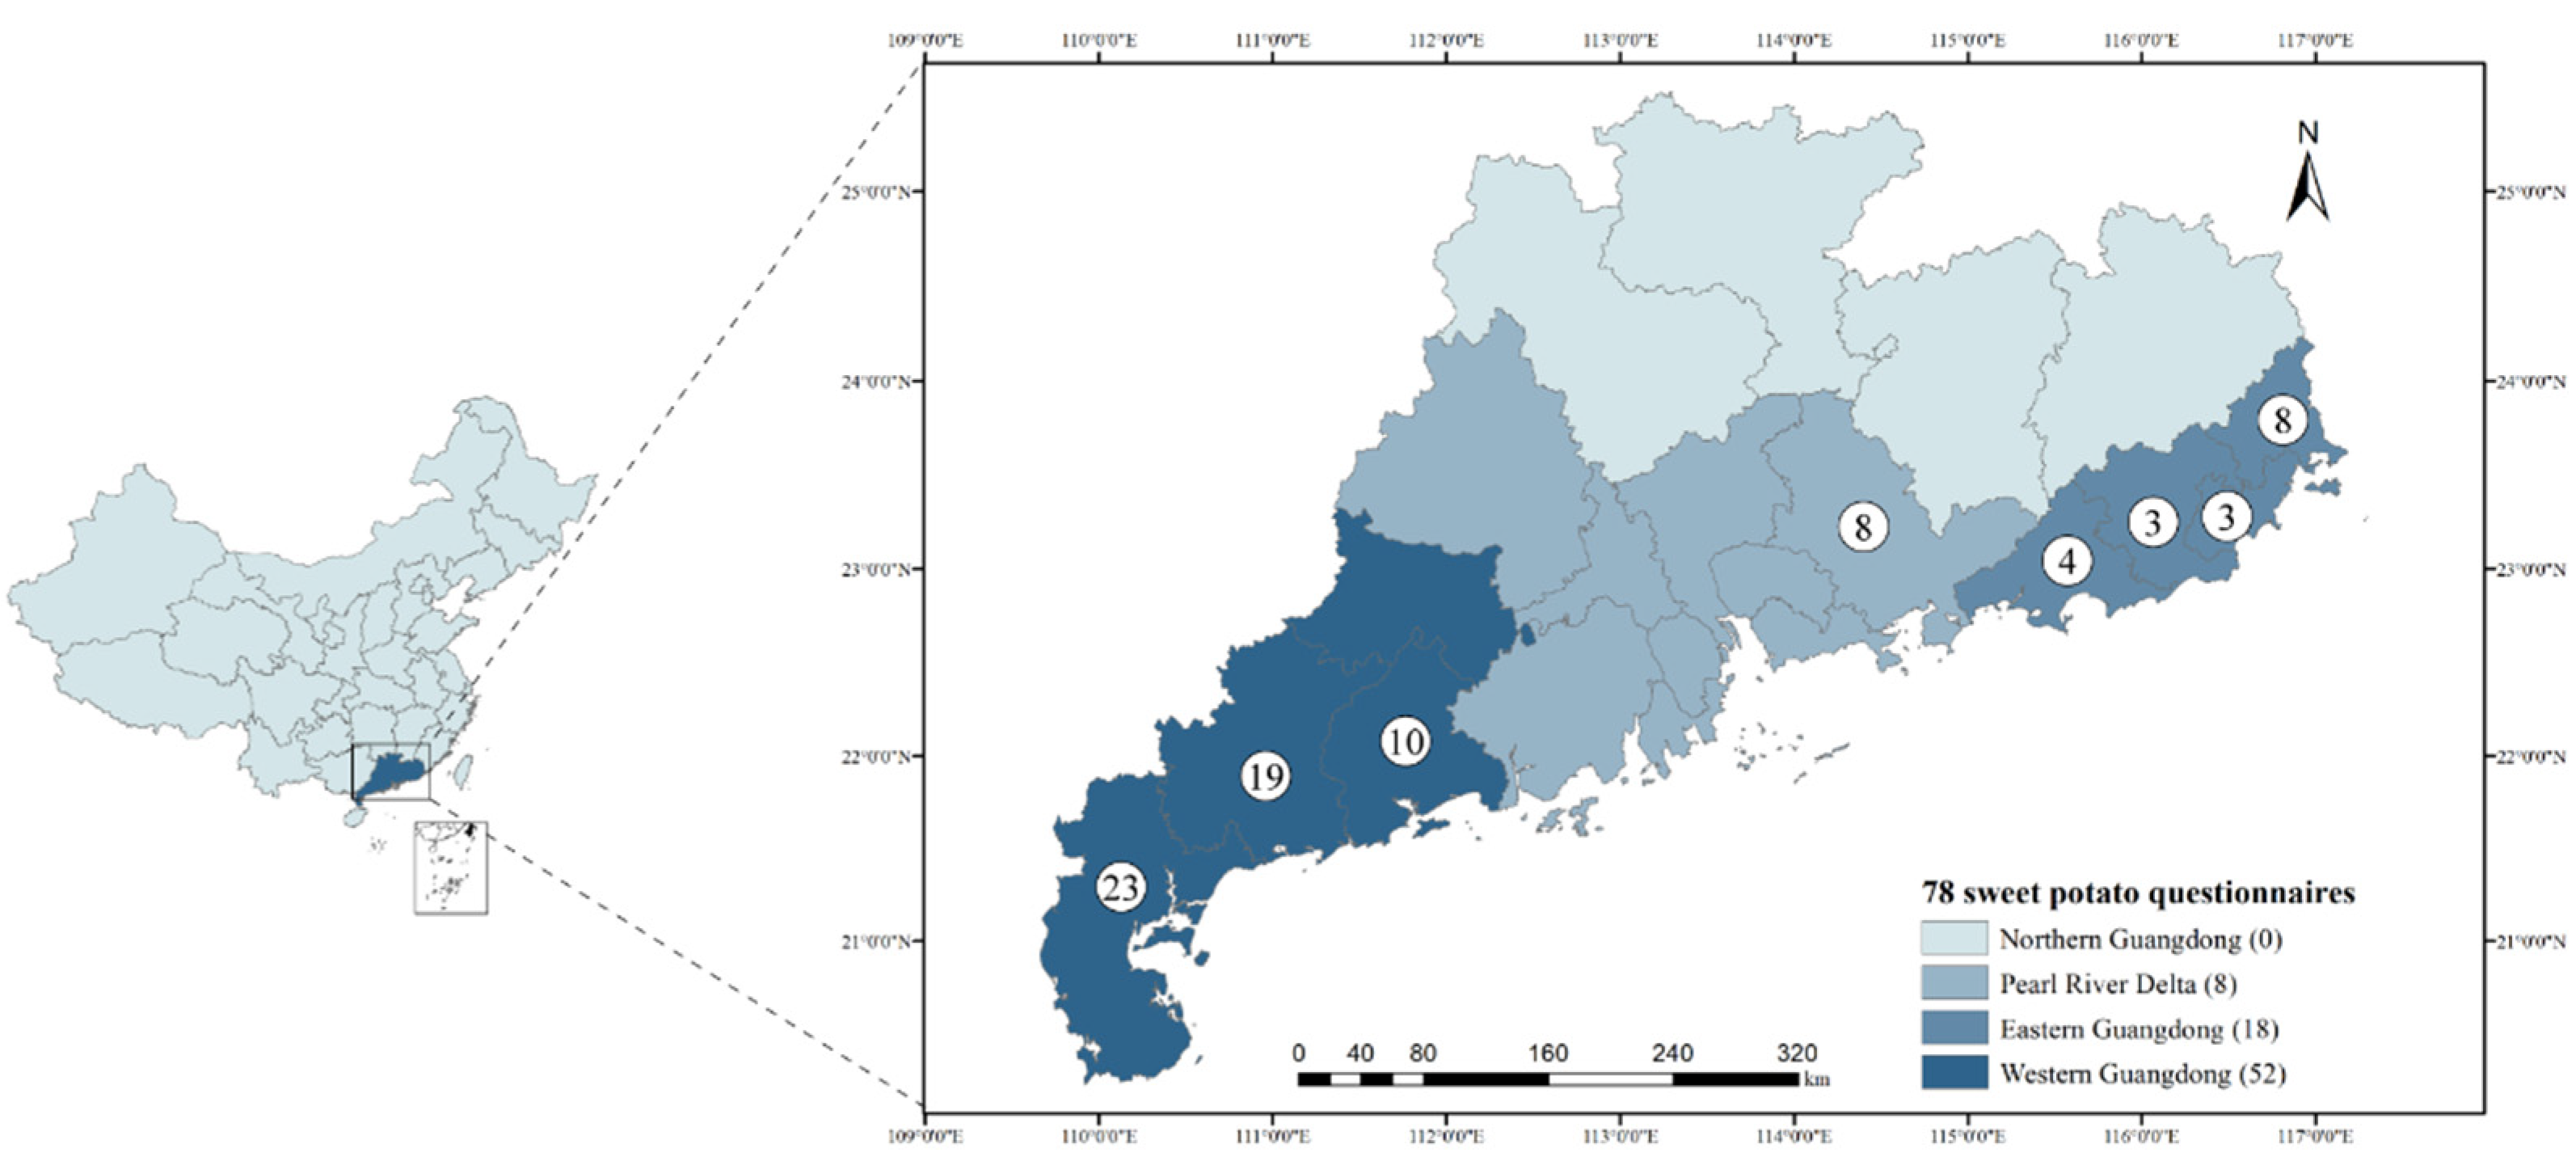
2.1. Survey Sites and Data Collection

Western Guangdong, Eastern Guangdong, and the Pearl River Delta are the main sweet potato-producing regions in Guangdong, accounting for approximately 90% of the province’s total production. Western Guangdong is the most representative sweet potato-producing area. Therefore, Western Guangdong (the cities of Maoming, Yangjiang, and Zhanjiang), Eastern Guangdong (the cities of Chaozhou, Jieyang, Shantou, and Shanwei), and the Pearl River Delta (the city of Huizhou) were selected as survey sites in the present study. Soil properties and climate characteristics of the production areas are presented in Table 1. Farms were selected randomly from villages in the area of study. According to a pre-survey feedback and literature reports [14,23], the plantation land area was assigned to three levels, i.e., small size (less than 2.0 ha), medium size (from 2.0 to 10.0 ha), and large size (more than 10.0 ha).
Face-to-face interviews were conducted in 2019 using a questionnaire to achieve input and output data for sweet potato production. Ultimately, a total of 78 fully answered and validated questionnaires were collected, comprising 52, 18, and 8 from the Western Guangdong, Eastern Guangdong, and the Pearl River Delta, respectively (Figure 1). The numbers of small-, medium-, and large-size farms were 35, 19, and 24, respectively. To standardize the feasibility and performance of sweet potato production, the input and output data of three main reference crops (i.e., rice, maize, and potato) were also collected from information provided by 74 local growers in this survey. The system boundary of sweet potato production and reference crop production included land preparation, sowing, growing, and harvesting (Figure 2). The functional unit was per hectare.

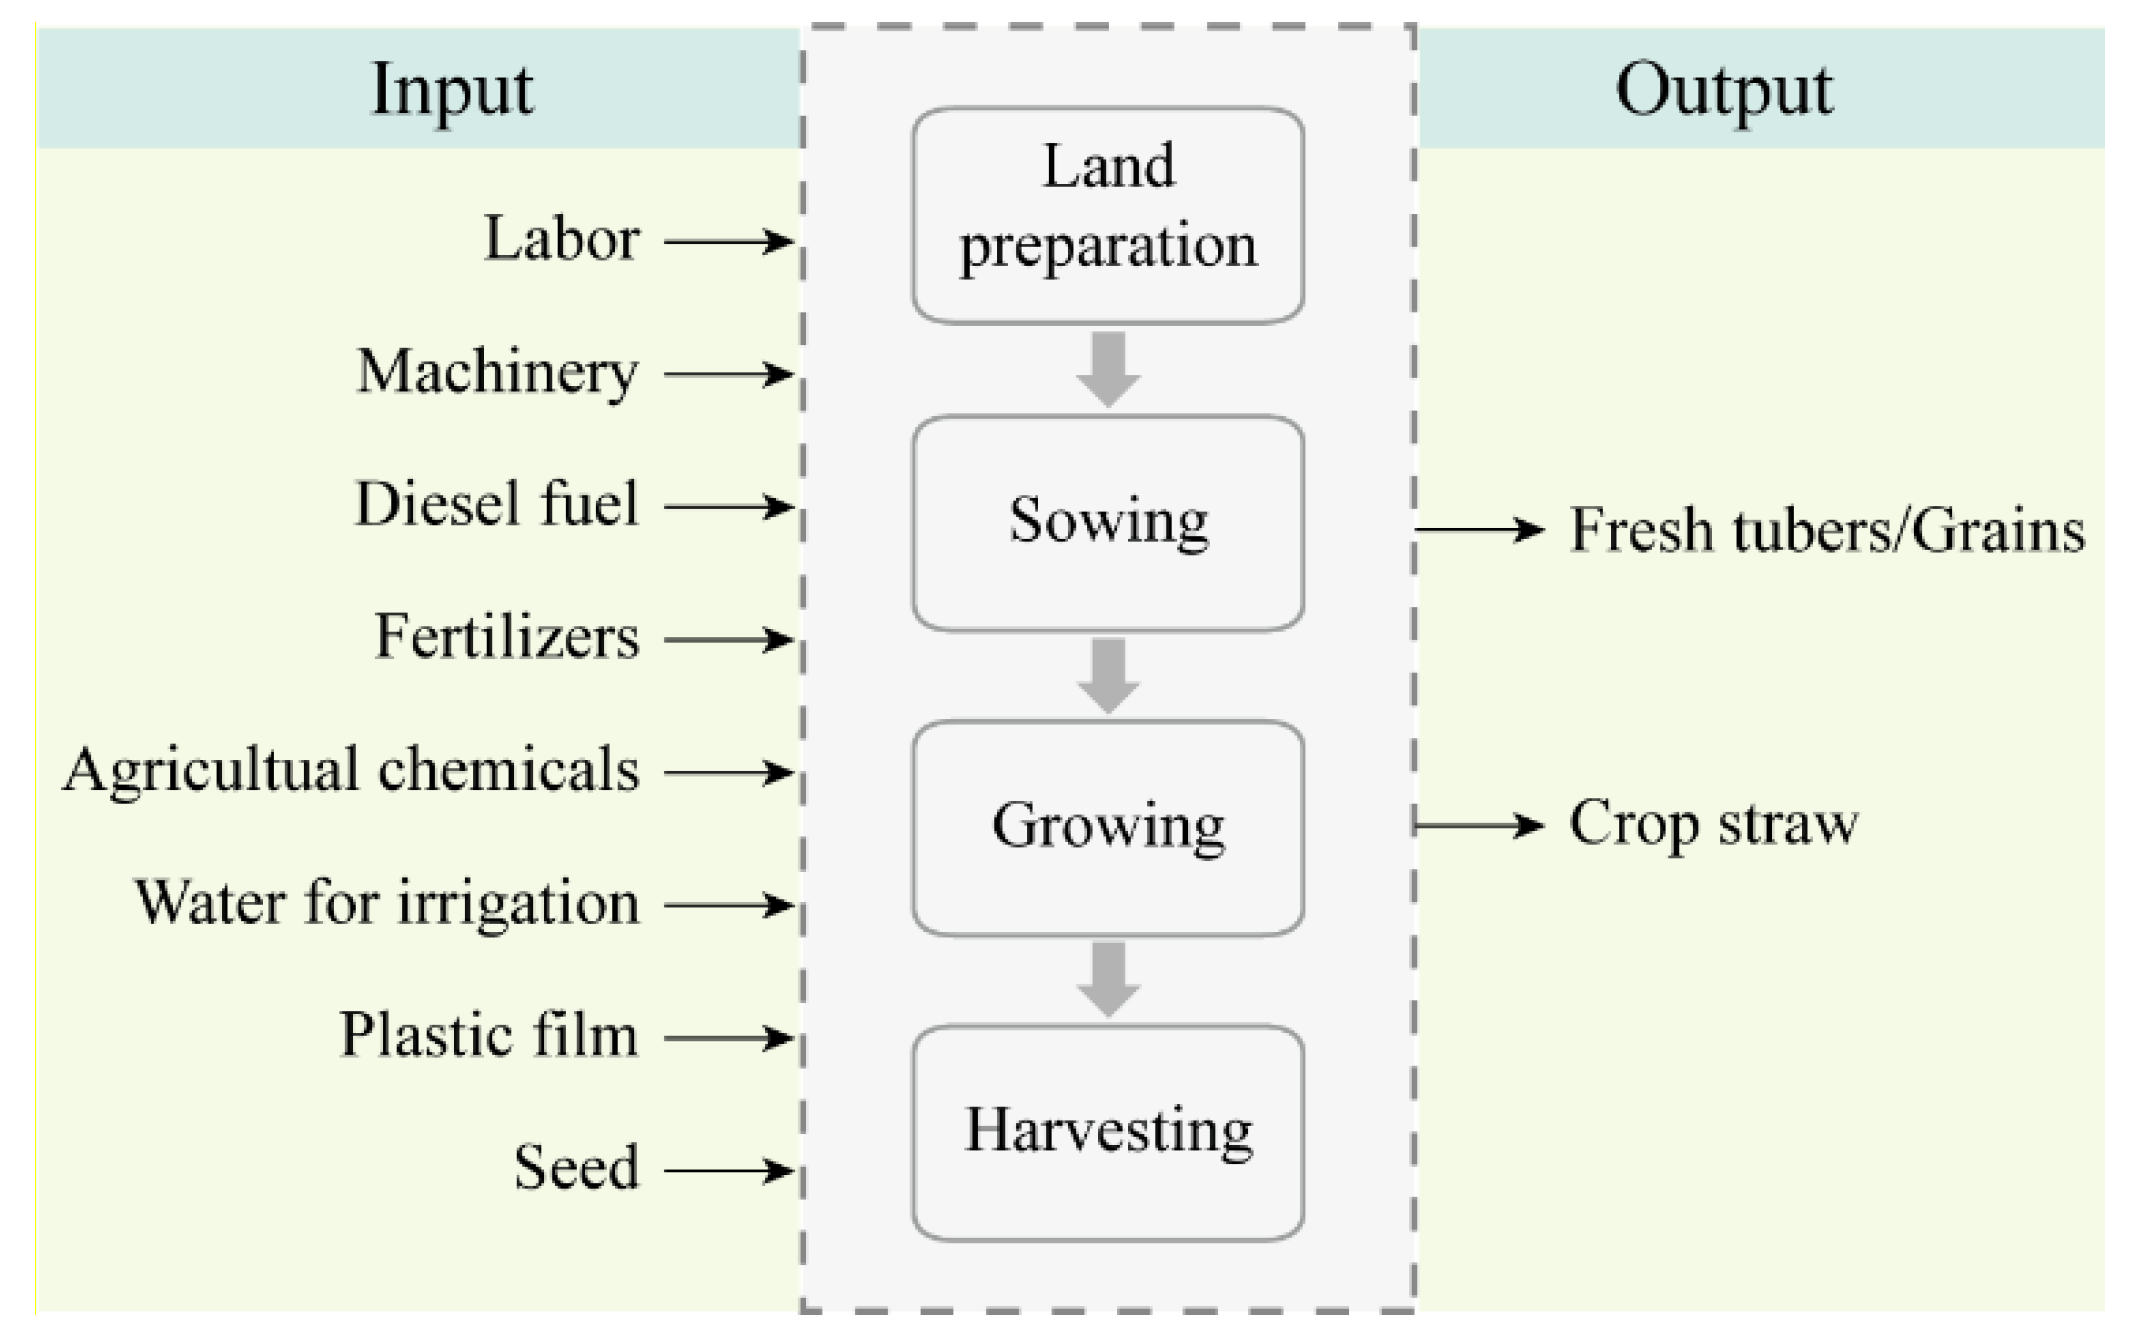
2.2. Energy Analysis

Energy inputs of crops included energy from labor, machinery, diesel fuel, fertilizers, agricultural chemicals, water for irrigation, plastic film, and seed. Energy outputs of root and tuber crops (sweet potato and potato) and cereal crops (rice and maize) consisted of energy production from fresh roots, tubers, grains, and the air-dried crop straw. The yield of crop straw was calculated by multiplying the root, tuber, or grain yield by the corresponding field residue index [25]. Input and output data were converted into common energy units with the appropriate coefficients of energy equivalence (Table 2). Net energy, energy rate, and energy efficiency were calculated for energy analysis according to Deng et al. [26], which are as follows:
Net   energy   ( MJ · ha 1 ) = energy   output energy   input
Energy   rate = energy   output ÷ energy   input
Energy   efficiency   ( kg · MJ 1 ) = fresh   root , tuber   or   grain   yield ÷ energy   input

2.3. Economic Analysis

Economic inputs were land rent, labor, machinery, diesel fuel, fertilizers, agricultural chemicals, water for irrigation, plastic film, and seed. The opportunity cost of family labor was also considered. Economic outputs were the total values of roots and tubers (sweet potato and potato) or grains (rice and maize), which were calculated by the product yields and market prices in 2019. A straw of the four crops was returned to the field (no sale), and the economic output of straw was zero in this study. For calculation of economic benefit, the net return, benefit/cost ratio, and economic productivity were determined using the following equations [12]:
Net   return   ( CNY · ha 1 ) = economic   output economic   input
Benefit / cos t   ratio = economic   output ÷ economic   input
Economic   productivity   ( kg · CNY 1 ) = root , tuber   or   grain   yield ÷ economic   input

2.4. GHG Emissions

The GHG emissions from the production and use of machinery, diesel fuel, fertilizers, agricultural chemicals, plastic film, and seeds were estimated. In this study, GHG emissions of carbon dioxide (CO2), methane (CH4), and nitrous oxide (N2O) were weighed as the GHG emission coefficients (CO2-equivalent) according to their global warming potential characterization factors of 1, 25, and 298, respectively, following IPCC’s 100-year estimates [34]. The GHG emission coefficients are given in Table 3. The GHG emissions of sweet potato and the reference crop production were calculated according to the equation below.
GHG   ( kg · CO 2 eq · ha 1 ) = i = 1 n Q i × C i
where Qi represents the quantity of input (i), and Ci indicates the GHG emission coefficient of input (i).

2.5. Quartering Assessment

First, 78 questionnaires on sweet potato production were categorized into four quartiles (1st, 2nd, 3rd, and 4th quartiles) based on energy efficiency, economic productivity, and GHG emissions [39,40]. Second, the mean values of the energy inputs, economic inputs, and GHG emissions for the 1st, 2nd, 3rd, and 4th quartiles were calculated, respectively. Finally, the different quartiles were compared according to different farm practices.

2.6. Statistical Analysis

All data collected were entered into Excel 2019 spreadsheets. Analysis of variance (ANOVA) was performed using SPSS 26.0 analytical software (IBM, SPSS Inc., Chicago, IL, USA) to assess the effects of crop species and plantation size on each parameter. Duncan’s test was used to assess the differences among means at the p < 0.05 level for each evaluated parameter.

3. Results

3.1. Input and Output
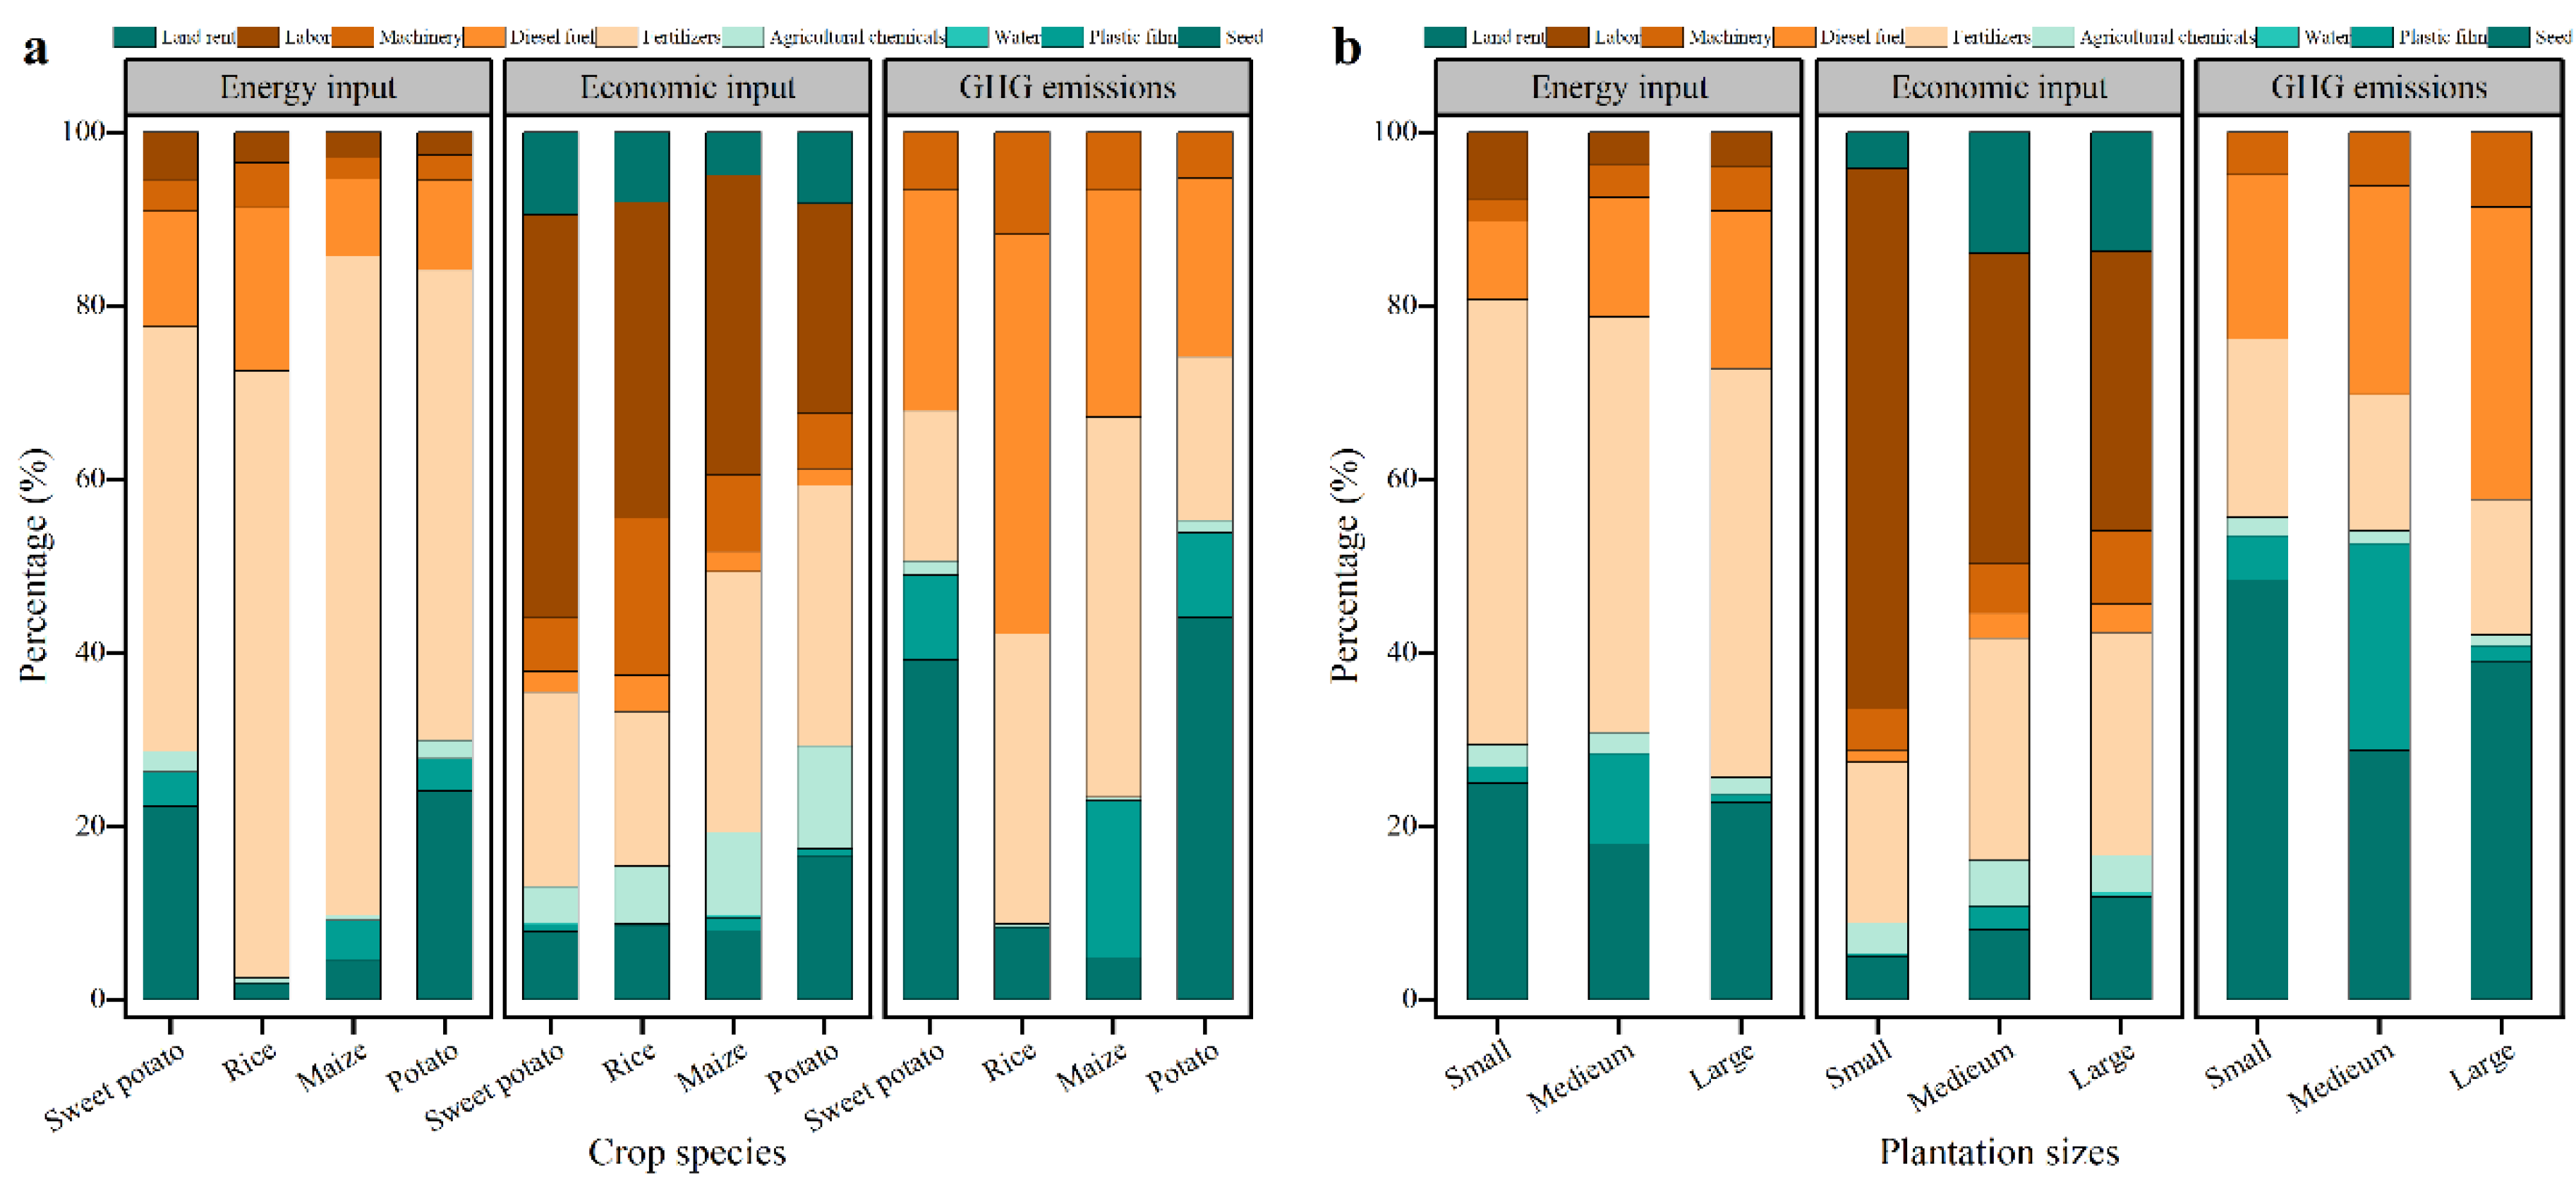
The agricultural input of root and tuber crops (sweet potato and potato) was higher than that of cereal crops (rice and maize), such as labor, machinery, fertilizers, agricultural chemicals, and seeds (Table 4). Sweet potato production required the most labor input compared with rice, maize, and potato, reaching 875 h ha−1 in Guangdong. Conversely, the yield of root and tuber crops was higher than that of cereal crops. In particular, potatoes exhibited the highest crop yield (35.08 t ha−1), followed by sweet potato, maize, and rice.
The inputs used in sweet potato production with different plantation sizes are illustrated in Table 4. The difference in agricultural inputs required for sweet potato production under the three plantation sizes was mainly reflected in labor, machinery, and diesel fuel, especially in the process of land preparation. The mean values of needed labor (working hours) were higher in small-size farms, whereas the mechanization time of medium- and large-size farms was longer than that of small-size farms. The mean quantities of fertilizers used for sweet potato production on small-size farms were less than on medium- and large-size farms. In a word, the highest tuberous root yield of sweet potato was found to reach 28.70 t ha−1 on medium-size farms, which was 6.03% and 21.95% higher than that of small and large farms, respectively.

3.2. Energy Balance

The total energy input of sweet potato production was 31.59 GJ ha−1 in Guangdong (Table 5), significantly (p < 0.05) higher than those of rice (20.07 GJ ha−1) and maize (30.40 GJ ha−1) but lower than that of potato (46.63 GJ ha−1). The fertilizers consumed 48.95% of the total energy input, followed by seed (22.39%) and diesel energy (13.32%) during the cultivation period of sweet potato (Figure 3a). As for fertilizers (15.46 GJ ha−1), the shares of nitrogen (N), phosphorus (P2O5), potassium (K2O), and farmyard manure occupied 62.79%, 8.16%, 12.28%, and 16.77%, respectively. The total energy output of sweet potato (167.14 GJ ha−1) was significantly lower than that of rice, maize, and potato. This is because the energy equivalence of sweet potato fresh tuberous root is low, even if its yield is high. The energy output of maize was the highest (294.35 GJ ha−1), resulting in significantly higher net energy (263.95 GJ ha−1) and energy rate (9.68) than the other three crops (p < 0.05). However, sweet potato had significantly higher energy efficiency (0.83 kg MJ−1) than other crops (Table 5).
The energy performance of sweet potato production was also analyzed considering plantation size (Table 5). Total energy input in small-size farms (27.85 GJ ha−1) was significantly lower than in medium-size farms (35.95 GJ ha−1) and large-size farms (33.58 GJ ha−1) because of the lower inputs of machinery and diesel fuel (p < 0.001). Whereas the energy input of labor in small-size farms was significantly (p < 0.05) higher than in the other two plantation sizes (Table 5, Figure 3b). In addition, the total energy output and net energy of sweet potato production in medium-size farms were slightly higher (p > 0.05) than in small-size farms and large-size farms. As a result, significant effects of plantation size were observed on energy rate and energy efficiency (p < 0.01). The above two energy indicators in small-size farms were the highest; the corresponding values were 6.16 and 0.97 kg MJ−1, respectively.

3.3. Economic Benefits

The total economic input of sweet potato production was 31,075 CNY ha−1, significantly (p < 0.05) lower than potato (42,582 CNY ha−1) but higher than rice and maize, mainly due to the significantly higher inputs of labor and fertilizer (Table 6). The cost of labor and fertilizer occupied 46.51% and 22.45% of sweet potato production, respectively (Figure 3a). The total economic output of sweet potato (90,470 CNY ha−1) was significantly higher than those of potato, maize, and rice. As a result, sweet potato was significantly profitable, with the highest net return (59,395 CNY ha−1), benefit/cost ratio (2.91), and economic productivity (0.85 kg CNY−1). In short, the economic benefits of the four crops ranked from highest to lowest were sweet potato > potato > maize > rice.
Non-significant effects were exerted by plantation size on input and output of the economy and economic benefits (i.e., net return, benefit/cost ratio, and economic productivity) in sweet potato production (Table 6). The total economic input of sweet potatoes was slightly higher in large-size farms (32,009 CNY ha−1) than in small-size (31,062 CNY ha−1) and medium-size farms (29,919 CNY ha−1). In small-size farms, the economic input of labor was significantly (p < 0.05) higher than that in medium-size and large-size farms by 80.97% and 87.48%, respectively. Conversely, economic inputs of land rent, machinery, and diesel fuel in small-size farms were significantly lower than in medium-size and larger-size farms (Table 6, Figure 3b). The small-size farms had the highest values of net return (67,539 CNY ha−1) and benefit/cost ratio (3.17), followed by medium-size farms and large-size farms. The economic productivity in medium-size farms was the highest (0.96 kg CNY−1).

3.4. GHG Emissions

Total GHG emissions from sweet potato production was 1165 kg CO2-eq ha−1, significantly (p < 0.05) higher than for rice and maize but lower than for potato (Table 7). GHG emissions from fertilizers, agricultural chemicals, and seeds were significantly different (p < 0.05) among the four crops. Seeds were the key contributor to total GHG emissions in sweet potato production (Figure 3a), accounting for 41.97%, followed by fertilizers (40.77%). Similarly, GHG emissions from reference crop production were also dominated by fertilizers.
GHG emissions from machinery and diesel fuel were positively correlated with plantation size (Table 7, Figure 3b). For instance, GHG emissions from machinery and diesel fuel increased from 49 and 51 kg CO2-eq ha−1 in small-size farms to 118 and 123 kg CO2-eq ha−1 in large-size farms. Overall, GHG emissions from sweet potato production in small-size farms were the lowest (1045 kg CO2-eq ha−1), whereas emissions from large-size farms were the highest (1263 kg CO2-eq ha−1).

3.5. Benefits from the Quartering Assessment and Corresponding Key Factors

Significant differences in the energy inputs, economic inputs, and GHG emissions of sweet potato production were found among the four quartiles (Figure 4). The energy inputs, economic inputs, and GHG emissions in the 1st quartile were 25.14 GJ ha−1, 22,073 CNY ha−1, and 784 kg CO2-eq ha−1, respectively; these were 13–33%, 33–37%, and 23–52% lower than those in the 2nd, 3rd, and 4th quartiles, respectively. Specifically, as for energy performance, fertilizers were the main reason for the lowest energy input in the 1st quartile (Figure 4a). The application of N, P2O5, K2O, and farmyard manure in the 1st quartile were 105, 65, 125, and 1871 kg ha−1, respectively. As for economic performance, labor was the key factor related to economic inputs. The amount of labor used in the 1st quartile was significantly lower than in other quartiles (Figure 4b). As for environmental performance, the differences in GHG emissions between the 1st quartile and the other three quartiles were mainly related to fertilizers (Figure 4c). Overall, high energy efficiency and economic productivity with low GHG emissions could be achieved by adopting the inputs scheme of efficient farms (i.e., 1st quartile).

4. Discussion

4.1. Energy and Environment Perspective of Sweet Potato Production

From the energy point of view, sweet potato and potato production were characterized by lower energy rates but higher energy efficiency compared with the values for rice and maize. This result of energy efficiency can be explained by the high fresh yield of root and tuber crops compared to cereal crops. Owing to the lack of similar research concerning the energy use of sweet potato production, the results were compared with other reference crops. Calculation of energy rate and energy efficiency are well documented in the literature for crops such as rice (5.30–9.00 and 0.17–0.32 kg MJ−1) [23], potato (1.71 and 0.47 kg MJ−1) [35], and maize (1.68–12.03 and 0.12–0.57 kg MJ−1) [41]. In short, crop species, cultivation regime, and environmental factors (e.g., soil and climate) determine energy inputs and energy outputs and ultimately affect energy performance [21,42,43].
In this study, we observed that GHG emission mitigation could be achieved through optimizing agricultural inputs during the period of sweet potato cultivation. As demonstrated by optimizing management patterns of sweet potato production (1st quartile), the fertilizers (mainly N) were responsible for the major portion of GHG emissions. Hosseinzadeh-Bandbafha et al. [44] also reported that GHG emissions of peanut (Arachis hypogaea L.) farms could be reduced by 58.79 kg CO2-eq ha−1 by optimizing the energy inputs (i.e., diesel fuel and N). These findings align with previous studies in that GHG emissions in crop production are dominated by fertilizer consumption [35,43]. Although fertilizer application provides greater crop yield and income stability [45,46], excessive chemical fertilizer does not produce a higher yield but can pollute the environment [35,47]. As Cui et al. [48] reported, science-based management practices are effective in reducing N use without compromising crop yields. Overall, the present results highlight the finding that the prevention of excessive chemical fertilizers use could maintain and/or increase tuberous root yields of sweet potatoes with lower GHG emissions, thereby avoiding trade-offs between crop yield and environmental costs [13,44,49].
Plantation size significantly affected inputs of labor, machinery, and diesel fuel and further affected the energy efficiency and GHG emissions of sweet potato production in this study. We found that the small-size farms (<2.0 ha) were more advantageous than medium- and large-size farms in terms of energy efficiency and GHG emissions in sweet potato production. These advantages of small-size farms in agricultural production may largely depend on the level of field operation, suitable planting density, and timely management, as well as low energy equivalence of labor [16,50]. Moreover, several technology training and guidance on sweet potato cultivation for small farms were organized by technicians of the China Agricultural Research System (sweet potato) and Agricultural Technology Extension Center in Guangdong province every year. Similar results have been reported by Nassiri and Singh [23] and Taki et al. [51], who concluded that smaller farms (<2.0 ha) had high energy efficiency compared to larger farms. However, Zhang et al. [11] demonstrated that the expansion of plantation size could benefit maize sustainable production when matched with technical innovation and machinery coordination. The authors also emphasized that supporting smallholder farmers to increase their resource use efficiency is necessary because small-size farms are more common in China.

4.2. Economic Perspective of Sweet Potato Production

From an economic point of view, sweet potato production is of interest to growers because economic benefits are higher than that of reference crops (i.e., rice, maize, and potato). The benefit/cost ratio of sweet potato in this study was superior to findings reported in other previous studies, e.g., 0.86 for cotton (Gossypium spp.) [27], 1.88 for potato [9], 2.76 for maize [22], and 2.31 for Jerusalem artichoke [12]. Although economic benefit may be affected by market price fluctuations related to supply and demand or the prices of production means [10], sweet potato can be regarded as an important cash crop for the central and local governments to implement poverty relief strategies in China. Moreover, in this study, no significant effects were exerted by plantation size on economic benefits. The slightly better economic benefits of small-size farms (<2.0 ha) are mainly due to reasonable and low chemicals input and part of free land rent (self-owned). Similarly, an inverse plantation area-productivity relationship was revealed in most small-sized farms for crop production in Northern China [11]. Wang et al. [52] also indicated that the conventional smaller farms (<6.7 ha) had the better revenue at the point of yield-based profit in grain production.
Sweet potato cultivation was labor intensive compared with rice and maize. It is known that a higher labor input increases total cultivation costs [22,50]. This result was similar to those obtained by Fang et al. [12], i.e., that costs of labor and fertilizer exceeded half of the total cultivation cost per unit of land. Although the efficiency of manual labor is much lower than the efficiency of mechanization, manual labor is irreplaceable in meticulous farming practices, e.g., apical bud removal, vine lifting, and weed control. These management practices adopted by manual laborers ultimately contribute to maximizing the yield of sweet potatoes.

4.3. Practical Implications of This Study

Sustainable development of sweet potatoes in Guangdong is of great significance to maintaining a supply and demand balance of the sweet potato market in China. As the amount of rainfall in Guangdong is high, and as chemical fertilizers may be washed away by runoff, the amount of fertilizer and date of fertilization should be considered to avoid the indiscriminate use of chemical fertilizers. Moreover, nitrates rather than ammonium have a greater leaching tendency [53], and such ammonium N sources may be more efficient for sweet potato production in the tropics and subtropics (such as Guangdong). As indicated in this study, the combination of new high-productivity variety and science-based cultivation techniques is urgently required during sweet potato production. Future research should focus on decreasing agricultural inputs (especially optimizing fertilizer quantity) while substantially increasing the productivity of sweet potatoes in an environmentally sustainable way [35,54]. Field experiments are also needed to systematically evaluate the direct GHG emissions during the growth of sweet potatoes.
A cost-saving cropping pattern will be attractive because labor costs are continually increasing in China. Reduced labor input after the replacement of labor with mechanization can ensure the timeliness of farm-related activities and increase farm output in terms of productivity [12,16]. For the mechanization and large-scale production of sweet potatoes, favorable policies (e.g., capital subsidies, low-cost financing, and tax incentives) and advanced agronomic management techniques are particularly of significance in promoting the intensive development of sweet potatoes. To further increase economic benefits, it is still necessary to organize technicians to provide scientific guidance to sweet potato farmers in China and other developing countries. Furthermore, sweet potatoes for bioenergy production or functional products should be embraced in view of the rich carbohydrate content and associated health benefits [55,56].

5. Conclusions

Economic-strategic and environmental sustainability aspects appear to be important for the sustainable production of sweet potatoes. In the present study, sweet potato production exhibited significantly higher energy efficiency and economic productivity than those of reference crops (i.e., rice, maize, and potato). Small-size farms (<2.0 ha) had an advantage over medium- and large-size farms in terms of energy efficiency and GHG emissions in sweet potato production, whereas there were no significant differences in economic benefits among the plantation sizes. Furthermore, the improvement of energy use and reduction in GHG emissions at a low cost can be achieved by optimizing agricultural inputs (reducing fertilizer application and labor use) in current sweet potato farming. In short, this study provides valuable information regarding the energy, economic, and environmental aspects of sweet potato production, as well as may help to make high-level decisions on poverty alleviation via the cultivation of sweet potatoes in other regions of the planet.

Author Contributions

Conceptualization and methodology, C.T. and Z.W.; investigation, C.T., Y.L., J.C. and Z.W.; formal analysis, X.M. and Y.Y.; data curation, C.T.; writing—original draft preparation, C.T.; writing—review and editing, Y.L., B.J. and Y.Y.; funding acquisition, C.T. and Z.W. All authors have read and agreed to the published version of the manuscript.

Funding

This work was supported by the Guangdong Modern Agro-industry Technology Research System (2019KJ111; 2021KJ111), the China Agricultural Research System of MOF and MARA, and the Special Fund for Scientific Innovation Strategy-construction of High-Level Academy of Agriculture Science (R2019YJ-YB2001).

Institutional Review Board Statement

Not applicable.

Informed Consent Statement

Not applicable.

Data Availability Statement

Data are presented in the article.

Acknowledgments

We gratefully acknowledge the innovation team members of Guangdong Modern Agro-industry Technology Research System; Institute of Agricultural Sciences, Shantou; Agricultural Technology Extension Center, Gaozhou, Huidong, Lufeng, and Maoming; Agrotechnical Station of Hongfeng Town; Guangdong Yunhua Agriculture Co., Ltd., and Guangdong Zhiwulong Biotechnology Co., Ltd. for their time and collaboration in completing the survey.

Conflicts of Interest

The authors declare no conflict of interest.

References

  1. De Albuquerque, T.M.R.; Sampaio, K.B.; de Souza, E.L. Sweet potato roots: Unrevealing an old food as a source of health promoting bioactive compounds—A review. Trends Food Sci. Technol. 2019, 85, 277–286. [Google Scholar] [CrossRef]
  2. Ferrari, M.D.; Guigou, M.; Lareo, C. Energy consumption evaluation of fuel bioethanol production from sweet potato. Bioresour. Technol. 2013, 136, 377–384. [Google Scholar] [CrossRef] [PubMed]
  3. Wang, S.; Nie, S.; Zhu, F. Chemical constituents and health effects of sweet potato. Food Res. Int. 2016, 89, 90–116. [Google Scholar] [CrossRef] [PubMed]
  4. Virgínio e Silva, J.O.; Almeida, M.F.; da Conceição Alvim-Ferraz, M.; Dias, J.M. Integrated production of biodiesel and bioethanol from sweet potato. Renew. Energy 2018, 124, 114–120. [Google Scholar] [CrossRef]
  5. Ziska, L.H.; Runion, G.B.; Tomecek, M.; Prior, S.A.; Torbet, H.A.; Sicher, R.C. An evaluation of cassava, sweet potato and field corn as potential carbohydrate sources for bioethanol production in Alabama and Maryland. Biomass Bioenergy 2009, 33, 1503–1508. [Google Scholar] [CrossRef]
  6. FAOSTAT. Statistics Division of Food and Agriculture Organization of the United Nations. 2021. Available online: http://www.fao.org/faostat/zh/#data/QC (accessed on 16 October 2021).
  7. Iese, V.; Holland, E.; Wairiu, M.; Havea, R.; Patolo, S.; Nishi, M.; Hoponoa, T.; Bourke, R.M.; Dean, A.; Waqainabete, L. Facing food security risks: The rise and rise of the sweet potato in the Pacific Islands. Glob. Food Secur. 2018, 18, 48–56. [Google Scholar] [CrossRef]
  8. Wang, M.; Shi, Y.; Xia, X.; Li, D.; Chen, Q. Life-cycle energy efficiency and environmental impacts of bioethanol production from sweet potato. Bioresour. Technol. 2013, 133, 285–292. [Google Scholar] [CrossRef]
  9. Mohammadi, A.; Tabatabaeefar, A.; Shahin, S.; Rafiee, S.; Keyhani, A. Energy use and economical analysis of potato production in Iran a case study: Ardabil province. Energy Convers. Manag. 2008, 49, 3566–3570. [Google Scholar] [CrossRef]
  10. Stolarski, M.J.; Krzyaniak, M.; Tworkowski, J.; Zauski, D.; Szczukowski, S. Camelina and crambe production—Energy efficiency indices depending on nitrogen fertilizer application. Ind. Crops Prod. 2019, 137, 386–395. [Google Scholar] [CrossRef]
  11. Zhang, W.; Qian, C.; Carlson, K.M.; Ge, X.; Wang, X.; Chen, X. Increasing farm size to improve energy use efficiency and sustainability in maize production. Food Energy Secur. 2021, 10, e271. [Google Scholar] [CrossRef]
  12. Fang, Y.R.; Liu, J.A.; Steinberger, Y.; Xie, G.H. Energy use efficiency and economic feasibility of Jerusalem artichoke production on arid and coastal saline lands. Ind. Crops Prod. 2018, 117, 131–139. [Google Scholar] [CrossRef]
  13. Chen, X.; Xu, X.; Lu, Z.; Zhang, W.; Yang, J.; Hou, Y.; Wang, X.; Zhou, S.; Li, Y.; Wu, L.; et al. Carbon footprint of a typical pomelo production region in China based on farm survey data. J. Clean. Prod. 2020, 277, 124041. [Google Scholar] [CrossRef]
  14. Wu, Y.; Xi, X.; Tang, X.; Luo, D.; Gu, B.; Lam, S.K.; Vitousek, P.M.; Chen, D. Policy distortions, farm size, and the overuse of agricultural chemicals in China. Proc. Natl. Acad. Sci. USA 2018, 115, 7010–7015. [Google Scholar] [CrossRef] [PubMed] [Green Version]
  15. Jankowski, K.J.; Dubis, B.; Sokólski, M.M.; Załuski, D.; Bórawski, P.; Szempliński, W. Productivity and energy balance of maize and sorghum grown for biogas in a large-area farm in Poland: An 11-year field experiment. Ind. Crops Prod. 2020, 148, 112326. [Google Scholar] [CrossRef]
  16. Soni, P.; Sinha, R.; Perret, S.R. Energy use and efficiency in selected rice-based cropping systems of the Middle-Indo Gangetic Plains in India. Energy Rep. 2018, 4, 554–564. [Google Scholar] [CrossRef]
  17. Wang, S.; Yang, L.; Su, M.; Ma, X.; Sun, Y.; Yang, M.; Zhao, P.; Shen, J.; Zhang, F.; Goulding, K.; et al. Increasing the agricultural, environmental and economic benefits of farming based on suitable crop rotations and optimum fertilizer applications. Field Crops Res. 2019, 240, 78–85. [Google Scholar] [CrossRef]
  18. Xiong, L.; Liang, C.; Ma, B.; Shah, F.; Wu, W. Carbon footprint and yield performance assessment under plastic film mulching for winter wheat production. J. Clean. Prod. 2020, 270, 122468. [Google Scholar] [CrossRef]
  19. Ozkan, B.; Ceylan, R.F.; Kizilay, H. Energy inputs and crop yield relationships in greenhouse winter crop tomato production. Renew. Energy 2011, 36, 3217–3221. [Google Scholar] [CrossRef]
  20. Taghavifar, H.; Mardani, A. Prognostication of energy consumption and greenhouse gas (GHG) emissions analysis of apple production in West Azarbayjan of Iran using Artificial Neural Network. J. Clean. Prod. 2015, 87, 159–167. [Google Scholar] [CrossRef]
  21. Dubis, B.; Jankowski, K.J.; Sokólski, M.M.; Załuski, D.; Bórawski, P.; Szempliński, W. Biomass yield and energy balance of fodder galega in different production technologies: An 11-year field experiment in a large-area farm in Poland. Renew. Energy 2020, 154, 813–825. [Google Scholar] [CrossRef]
  22. Liu, H.; Ren, L.; Spiertz, H.; Zhu, Y.; Xie, G.H. An economic analysis of sweet sorghum cultivation for ethanol production in North China. GCB Bioenergy 2015, 7, 1176–1184. [Google Scholar] [CrossRef] [Green Version]
  23. Nassiri, S.M.; Singh, S. Study on energy use efficiency for paddy crop using data envelopment analysis (DEA) technique. Appl. Energy 2009, 86, 1320–1325. [Google Scholar] [CrossRef]
  24. National Bureau of Statistics, China. Available online: https://data.stats.gov.cn (accessed on 20 May 2021).
  25. Fang, Y.R.; Wu, Y.; Xie, G.H. Crop residue utilizations and potential for bioethanol production in China. Renew. Sustain. Energy Rev. 2019, 113, 109288. [Google Scholar] [CrossRef]
  26. Deng, J.; Ni, H.; Zhang, Z.; Usman, S.; Yang, X.; Shen, Y.; Li, Y. Designing productive, energy-efficient, and environmentally friendly production systems by replacing fallow period with annual forage cultivation on the Loess Plateau of China. J. Clean. Prod. 2021, 320, 128660. [Google Scholar] [CrossRef]
  27. Yilmaz, I.; Akcaoz, H.; Ozkan, B. An analysis of energy use and input costs for cotton production in Turkey. Renew. Energy 2005, 30, 145–155. [Google Scholar] [CrossRef]
  28. Luo, S.M. Agroecology; Agriculture Press: Beijing, China, 2000; pp. 447–478. (In Chinese) [Google Scholar]
  29. Kizilaslan, H. Input–output energy analysis of cherries production in Tokat Province of Turkey. Appl. Energy 2009, 86, 1354–1358. [Google Scholar] [CrossRef]
  30. Meul, M.; Nevens, F.; Reheul, D.; Hofman, G. Energy use efficiency of specialised dairy, arable and pig farms in Flanders. Agric. Ecosyst. Environ. 2007, 119, 135–144. [Google Scholar] [CrossRef]
  31. Zangeneh, M.; Omid, M.; Akram, A. A comparative study on energy use and cost analysis of potato production under different farming technologies in Hamadan province of Iran. Energy 2010, 35, 2927–2933. [Google Scholar] [CrossRef]
  32. West, T.O.; Marland, G. A synthesis of carbon sequestration, carbon emissions, and net carbon flux in agriculture: Comparing tillage practices in the United States. Agric. Ecosyst. Environ. 2002, 91, 217–232. [Google Scholar] [CrossRef]
  33. Cao, Z.H.; Huang, Y.L.; Hao, J.M. Multi-suitability comprehensive evaluation of crop straw resource utilization in China. Res. Environ. Sci. 2017, 31, 179–186. (In Chinese) [Google Scholar]
  34. Eggleston, S.; Buendia, L.; Miwa, K.; Ngara, T.; Kiyoto, T. IPCC Guidelines for National Greenhouse Gas Inventories; Institute for Global Environmental Strategies (IGES) for the IPCC: Hayama, Japan, 2006. [Google Scholar]
  35. Pishgar-Komleh, S.H.; Ghahderijani, M.; Sefeedpari, P. Energy consumption and CO2 emissions analysis of potato production based on different farm size levels in Iran. J. Clean. Prod. 2012, 33, 183–191. [Google Scholar] [CrossRef]
  36. CLCD 0.8, Chinese Life Cycle Database. Integrated Knowledge for our Environment. Chengdu, China. Available online: http://www.ike-global.com (accessed on 16 February 2022).
  37. Lal, R. Carbon emission from farm operations. Environ. Int. 2004, 30, 981–990. [Google Scholar] [CrossRef] [PubMed]
  38. Ecoinvent, Version 3.1; Competence Centre of the Swiss Federal Institute of Technology: Zürich, Switzerland, 2013; Available online: https://ecoinvent.org (accessed on 16 February 2022).
  39. Wang, J.; Zhang, L.; He, X.; Zhang, Y.; Wan, Y.; Duan, S.; Xu, C.; Mao, X.; Chen, X.; Shi, X. Environmental mitigation potential by improved nutrient managements in pear (Pyrus pyrifolia L.) orchards based on life cycle assessment: A case study in the North China Plain. J. Clean. Prod. 2020, 262, 121273. [Google Scholar] [CrossRef]
  40. Zhang, S.; Gao, P.; Tong, Y.; Norse, D.; Lu, Y.; Powlson, D. Overcoming nitrogen fertilizer over-use through technical and advisory approaches: A case study from Shaanxi Province, northwest China. Agric. Ecosyst. Environ. 2015, 209, 89–99. [Google Scholar] [CrossRef]
  41. Juárez-Hernández, S.; Usón, S.; Pardo, C.S. Assessing maize production systems in Mexico from an energy, exergy, and greenhouse-gas emissions perspective. Energy 2019, 170, 199–211. [Google Scholar] [CrossRef]
  42. Arrieta, E.M.; Cuchietti, A.; Cabrol, D.; González, A.D. Greenhouse gas emissions and energy efficiencies for soybeans and maize cultivated in different agronomic zones: A case study of Argentina. Sci. Total Environ. 2018, 625, 199–208. [Google Scholar] [CrossRef] [Green Version]
  43. Stolarski, M.; Krzyzaniak, M.; Kwiatkowski, J.; Tworkowski, J.; Szczukowski, S. Energy and economic efficiency of camelina and crambe biomass production on a large-scale farm in north-eastern Poland. Energy 2018, 150, 770–780. [Google Scholar] [CrossRef]
  44. Hosseinzadeh-Bandbafha, H.; Nabavipelesaraei, A.; Khanali, M.; Ghahderijani, M.; Chau, K. Application of data envelopment analysis approach for optimization of energy use and reduction of greenhouse gas emission in peanut production of Iran. J. Clean. Prod. 2018, 172, 1327–1335. [Google Scholar] [CrossRef]
  45. Tan, Y.; Wu, D.; Bol, R.; Wu, W.; Meng, F. Conservation farming practices in winter wheat–summer maize cropping reduce GHG emissions and maintain high yields. Agric. Ecosyst. Environ. 2019, 272, 266–275. [Google Scholar] [CrossRef]
  46. Zhang, Y.; Wang, H.; Lei, Q.; Luo, J.; Lindsey, S.; Zhang, J.; Zhai, L.; Wu, S.; Zhang, J.; Liu, X.; et al. Optimizing the nitrogen application rate for maize and wheat based on yield and environment on the Northern China Plain. Sci. Total Environ. 2018, 618, 1173–1183. [Google Scholar] [CrossRef]
  47. Ju, X.T.; Xing, G.X.; Chen, X.P.; Zhang, S.L.; Zhang, L.J.; Liu, X.J.; Cui, Z.L.; Yin, B.; Christie, P.; Zhu, Z.L.; et al. Reducing environmental risk by improving N management in intensive Chinese agricultural systems. Proc. Natl. Acad. Sci. USA 2009, 106, 3041–3046. [Google Scholar] [CrossRef] [PubMed] [Green Version]
  48. Cui, Z.; Zhang, H.; Chen, X.; Zhang, C.; Ma, W.; Huang, C.; Zhang, W.; Mi, G.; Miao, Y.; Li, X.; et al. Pursuing sustainable productivity with millions of smallholder farmers. Nature 2018, 555, 363–366. [Google Scholar] [CrossRef] [PubMed]
  49. Esengun, K.; Erdal, G.; Gündüz, O.; Erdal, H. An economic analysis and energy use in stake-tomato production in Tokat province of Turkey. Renew. Energy 2007, 32, 1873–1881. [Google Scholar] [CrossRef]
  50. Hatirli, S.A.; Ozkan, B.; Fert, C. Energy inputs and crop yield relationship in greenhouse tomato production. Renew. Energy 2006, 31, 427–438. [Google Scholar] [CrossRef]
  51. Taki, M.; Soheili-Fard, F.; Rohani, A.; Chen, G.; Yildizhan, H. Life cycle assessment to compare the environmental impacts of different wheat production systems. J. Clean. Prod. 2018, 197, 195–207. [Google Scholar] [CrossRef] [Green Version]
  52. Wang, X.; Chen, Y.; Sui, P.; Yan, P.; Yang, X.; Gao, W. Preliminary analysis on economic and environmental consequences of grain production on different farm sizes in North China Plain. Agric. Syst. 2017, 153, 181–189. [Google Scholar] [CrossRef]
  53. Henry, J.B.; Vann, M.C.; Lewis, R.S. Agronomic practices affecting nicotine concentration in flue-cured tobacco: A Review. Agron. J. 2019, 111, 3067–3075. [Google Scholar] [CrossRef] [Green Version]
  54. Gan, Y.; Liang, C.; Chai, Q.; Lemke, R.L.; Campbell, C.A.; Zentner, R.P. Improving farming practices reduces the carbon footprint of spring wheat production. Nat. Commun. 2014, 5, 5012. [Google Scholar] [CrossRef] [Green Version]
  55. Mau, J.L.; Lee, C.C.; Yang, C.W.; Chen, R.W.; Zhang, Q.F.; Lin, S.D. Physicochemical, antioxidant and sensory characteristics of bread partially substituted with aerial parts of sweet potato. LWT-Food Sci. Technol. 2020, 117, 108602. [Google Scholar] [CrossRef]
  56. Tang, C.C.; Ameen, A.; Fang, B.P.; Liao, M.H.; Chen, J.Y.; Huang, L.F.; Zou, H.D.; Wang, Z.Y. Nutritional composition and health benefits of leaf-vegetable sweet potato in South China. J. Food Compos. Anal. 2021, 96, 103714. [Google Scholar] [CrossRef]
Figure 1. Distribution of sample sites for the face-to-face questionnaire survey during 2019 in Guangdong. The number is expressed as the sample size of the questionnaire.
Agronomy 12 01290 g001
Figure 2. System boundary of sweet potato and reference crops (i.e., rice, maize, and potato) production.
Agronomy 12 01290 g002
Figure 3. The percentage of each input source to the total energy inputs, economic inputs, and greenhouse gas (GHG) emissions under different crop species (a) and plantation sizes of sweet potato (b).
Agronomy 12 01290 g003
Figure 4. The means of energy inputs (a), economic inputs (b), and GHG emissions (c) per hectare in the sweet potato production of the four quartiles (1st, 2nd, 3rd, and 4th quartiles). The different lowercase letters indicate significant differences within the four quartiles at the p < 0.05 level. Bars represent standard errors.
Agronomy 12 01290 g004
Table 1. Location, soil, and climate characteristics of sampled farms for sweet potato production in this study.
ParameterWestern GuangdongEastern GuangdongPearl River Delta
MaomingYangjiangZhanjiangChaozhouJieyangShantouShanweiHuizhou
Longitude110°37′−111°17′111°44′−112°18′109°48′−110°46′116°53′−116°63′116°11′−116°13′116°44′115°36′−116°09′114°49′−114°55′
Latitude21°31′−22°12′21°46′−21°56′20°31′−21°30′23°41′−23°66′23°00′−23°18′23°34′22°53′−22°56′22°49′−23°04′
Elevation (m)10−5100−2010−500−100−105−100−1010−50
Soil pH a5.105.655.335.305.155.555.795.20
Soil organic matter (g kg−1) a17.7115.4914.0214.4813.5823.7919.1420.23
Total nitrogen (g kg−1) a1.181.080.870.930.931.381.201.33
Available phosphorus (mg kg−1) a133.7346.76147.75114.6861.0868.6128.33268.79
Available potassium (mg kg−1) a144.3145.5071.9588.2599.13134.5068.4467.88
Exchangeable calcium (mg kg−1) a321.50291.78249.86333.90247.60752.2338.54312.46
Sunshine (h) b1628.551607.701811.601761.851973.051958.801922.551418.80
Precipitation (mm) b1464.552800.051655.551487.551399.951331.501663.801525.80
Relative humidity (%) b77.8282.4185.8077.3482.6275.6578.1578.68
Average temperature (°C) b23.8623.2123.8421.9322.4623.4123.2421.75
Diurnal temperature difference (°C) b6.186.076.258.716.466.225.719.64
Accumulated temperature (≥15 °C) b3089.852862.703069.002423.952599.802945.052860.652352.95
a denotes average value of soil samples at a depth of 0–30 cm was collected from sweet potato fields during the survey. b denotes average value of meteorological indicators for 2018 and 2019 collected from local meteorological stations.
Table 2. Energy equivalents of the input and output in sweet potato, potato, rice, and maize production.
ParameterUnitEnergy Equivalent (MJ Unit−1)Reference
Input
Laborh1.96[27]
Machineryh142.70[20]
Diesel fuelL36.55[28]
Fertilizers
a-Nitrogen (N)kg92.05[28]
b-Phosphorus (P2O5)kg13.39[28]
c-Potassium (K2O)kg9.20[28]
d-Farmyard manurekg0.30[29]
Agricultural chemicals
a-Herbicideskg214.00[30]
b-Insecticides kg278.00[30]
c-Fungicideskg276.00[30]
Waterm31.02[31]
Plastic filmkg51.93[28]
Seed
a-Sweet potato/potatokg3.60[16,31]
b-Ricekg14.70[23]
c-Maizekg53.36[32]
Output
Sweet potato/potato root/tuberkg3.60[16]
Sweet potato/potato strawkg14.10[33]
Rice grainkg14.70[23]
Rice strawkg14.06[33]
Maize grainkg16.53[28]
Maize strawkg14.36[28]
Table 3. The GHG emissions coefficient of agricultural inputs.
ParameterUnitGHG Coefficient (kg CO2-eq Unit−1)Reference
MachineryMJ0.07[35]
Diesel fuelL0.74[36]
Fertilizers
a-Nitrogen (N)kg1.76[36]
b-Phosphorus (P2O5)kg1.49[36]
c-Potassium (K2O)kg0.57[36]
d-Farmyard manureMg0.20[36]
Agricultural chemicals
a-Herbicideskg6.30[37]
b-Insecticides kg5.10[37]
c-Fungicideskg3.90[37]
Plastic filmkg0.58[38]
Seed
a-Sweet potato/potatokg0.25[38]
b-Ricekg2.02[38]
c-Maizekg1.49[38]
CLCD, Chinese Life Cycle Database.
Table 4. Input and output of different crops production (including sweet potato, rice, maize, and potato) and different plantation sizes of sweet potato production in Guangdong.
ParameterCrop SpeciesPlantation Size
Sweet Potato
(n = 78)
Rice
(n = 55)
Maize
(n = 10)
Potato
(n = 9)
<2.0 ha
(n = 35)
2.0–10.0 ha
(n = 19)
>10.0 ha
(n = 24)
Input
Labor (h ha−1)8753564566341111669693
Machinery (h ha−1)8.27.35.29.44.99.711.8
Diesel fuel (L ha−1)1151037313268136166
Fertilizers (kg ha−1)
a-Nitrogen (N)122128205196117134120
b-Phosphorus (P2O5)1038517218186129108
c-Potassium (K2O)186117198201177220171
d-Farmyard manure37311454969667233336555830
Agricultural chemicals (kg ha−1)
a-Herbicides2.810.120.002.902.973.072.36
b-Insecticides0.160.190.350.900.140.190.19
c-Fungicides0.430.180.300.450.350.590.41
Water (m3 ha−1)209271851148
Plastic film (kg ha−1)230273310725
Seed (kg ha−1)195726253117193217962123
Output
Fresh root/tuber/grain a (kg ha−1)26,375663410,04235,08327,06428,69723,531
Air-dried straw b (kg ha−1)5120670089386810525455714568
a The fresh roots/tubers and cereal grains contained moisture of about 80% and 15%, respectively. b The air-dried straw contained moisture between 25% and 30%.
Table 5. Energy input and output of different crops production (including sweet potato, rice, maize, and potato) and different plantation sizes of sweet potato production in Guangdong.
ParameterCrop SpeciesPlantation Size
Sweet Potato
(n = 78)
Rice
(n = 55)
Maize
(n = 10)
Potato
(n = 9)
ANOVA<2.0 ha
(n = 35)
2.0–10.0 ha
(n = 19)
>10.0 ha
(n = 24)
ANOVA
Input (MJ ha−1)31,58820,07330,39946,627***27,85135,95133,582**
Labor17156998941243***217813111358***
Machinery117010487471337ns69613821692***
Diesel fuel4209377326864812ns250649726088***
Fertilizers15,46314,03623,10925,271***14,26817,20815,823ns
Agricultural chemicals746128181994***730873669ns
Water2092719ns51149***
Plastic film1218014021731ns5123731260**
Seed7047380135311220***695664637643ns
Output (MJ ha−1)167,140191,729294,350222,325***171,508181,857149,119ns
Fresh root/tuber/grain 94,95097,521166,003126,300***97,431103,31184,713ns
Air-dried straw 72,19094,208128,34796,025***74,07778,54664,406ns
Net energy (MJ ha−1)135,552171,656263,951175,698***143,657145,906115,537ns
Energy rate5.299.559.684.77***6.165.064.44**
Energy efficiency (kg MJ−1)0.830.330.330.75***0.970.800.70**
ns: non-significant; **: significant at p < 0.01; ***: significant at p < 0.001.
Table 6. Economic input and output of different crop production (including sweet potato, rice, maize, and potato) and different plantation sizes of sweet potato production in Guangdong.
ParameterCrop SpeciesPlantation Size
Sweet Potato
(n = 79)
Rice
(n = 55)
Maize
(n = 10)
Potato
(n = 9)
ANOVA<2.0 ha
(n = 35)
2.0–10.0 ha
(n = 19)
>10.0 ha
(n = 24)
ANOVA
Input (CNY ha−1)31,07515,77519,60642,582***31,06229,91932,009ns
Land rent295312729753500**130741724388***
Labor14,4535748677610,323***19,33710,68510,314***
Machinery1912285817152687**147817202697*
Diesel fuel735659469840ns4378681063***
Fertilizers69762810588212780***576176538212ns
Agricultural chemicals1289104918804993***108815681360ns
Water55267552ns1430134***
Plastic film2560270333ns9980550***
Seed2447135515657073***154124183791***
Output (CNY ha−1)90,47020,44232,71879,558***98,60183,64984,013ns
Net return (CNY ha−1)59,395466713,11236,976***67,53953,73052,004ns
Benefit/cost ratio2.911.301.671.87***3.172.802.62ns
Economic productivity (kg CNY−1)0.850.420.510.82***0.870.960.73ns
ns: non-significant; *: significant at p < 0.05; **: significant at p < 0.01; ***: significant at p < 0.001.
Table 7. GHG emissions of different crop production (including sweet potato, rice, maize, and potato) and different plantation sizes of sweet potato production in Guangdong.
ParameterCrop SpeciesPlantation Size
(kg CO2-eq ha−1)Sweet Potato
(n = 78)
Rice
(n = 55)
Maize
(n = 10)
Potato
(n = 9)
ANOVA<2.0 ha
(n = 35)
2.0–10.0 ha
(n = 19)
>10.0 ha
(n = 24)
ANOVA
Machinery82735294ns4997118***
Diesel fuel85765497ns51101123***
Fertilizers475418729733**435555471ns
Agricultural chemicals202325***212317ns
Plastic film1401619ns6423**
Seeds4895238779***483449531ns
Total11656218921747***104512671263**
ns: non-significant; **: significant at p < 0.01; ***: significant at p < 0.001.
Publisher’s Note: MDPI stays neutral with regard to jurisdictional claims in published maps and institutional affiliations.

