Article

Population Genetic Structure and Geometric Morphology of Codling Moth Populations from Different Management Systems

by
Martina Kadoić Balaško
1,2,*,
Renata Bažok
1,
Katarina M. Mikac
2,
Hugo A. Benítez
3,4,
Manuel J. Suazo
5,
João Paulo Gomes Viana
6,
Darija Lemic
1 and
Ivana Pajač Živković
1
1
Department of Agricultural Zoology, University of Zagreb Faculty of Agriculture, Svetošimunska 25, 10000 Zagreb, Croatia
2
Centre for Sustainable Ecosystem Solutions, School of Earth, Atmospheric and Life Sciences, Faculty of Science, Medicine and Health, University of Wollongong, Wollongong 2522, Australia
3
Laboratorio de Ecología y Morfometría Evolutiva, Centro de Investigación de Estudios Avanzados del Maule, Universidad Católica del Maule, Talca 3466706, Chile
4
Centro de Investigación en Recursos Naturales y Sustentabilidad (CIRENYS), Universidad Bernardo O’Higgins, Avenida Viel 1497, Santiago 8370993, Chile
5
Instituto de Alta Investigación, CEDENNA, Universidad de Tarapacá, Casilla 7 D, Arica 1000000, Chile
6
Department of Crop Sciences, University of Illinois at Urbana-Champaign (UIUC), AW-101 Turner Hall, 1102 South Goodwin Avenue, Urbana, IL 61801-4798, USA
*
Author to whom correspondence should be addressed.
Agronomy 2022, 12(6), 1278; https://doi.org/10.3390/agronomy12061278
Submission received: 23 April 2022 / Revised: 19 May 2022 / Accepted: 25 May 2022 / Published: 26 May 2022

Abstract

:
Codling moth (CM), Cydia pomonella L., is an important pest of apples worldwide. CM resistance to insecticides is a serious problem in apple production. For effective management and control, monitoring of resistant CM populations is absolutely necessary. Therefore, in this study, we investigated whether it is possible to find a reliable pattern of differences in CM populations related to the type of apple control method. The genetic results showed low estimated value of the pairwise fixation index, FST = 0.021, which indicates a lack of genetic differentiation and structuring between the genotyped populations. Different approaches were used to analyze the genetic structure of codling moth populations: Bayesian-based model of population structure (STRUCTURE), principal component analysis (PCA), and discriminant analysis of principal components (DAPC). STRUCTURE grouped the CM genotypes into two distinct clusters, and the results of PCA were consistent with this. The DAPC revealed three distinct groups. However, the results showed that population genetic differentiation between organic and integrated orchards was not significant. To confirm the genetic results, the forewing morphology of the same CM individuals was examined using geometric morphometric techniques based on the venation patterns of 18 landmarks. The geometric results showed higher sensitivity and separated three distinct groups. Geometric morphometrics was shown to be a more sensitive method to detect variability in genotypes due to pest control management. This study shows the possibility of using a novel method for a strategic integrated pest management (IPM) program for CM that is lacking in Europe.

Graphical Abstract

1. Introduction

Codling moth (CM) (Cydia pomonella L.) is a serious pest of apple production in Croatia and globally [1,2,3,4]. Apples are grown on about 4.7 million hectares of land, with an average yield of 18 tons/hectare, corresponding to a global quantity of 87 million tons of apples/year [5]. The larvae of CM cause the greatest damage to apple production. Larvae eat fruit flesh and seeds, and produce holes in the fruit full of larval feces called “larval droppings” [6]. Without the use of chemical control, the larvae can affect a 30–50% decline in an apple crop during the growing season [7]. Chemical treatments are the main method of controlling CM in integrated apple production [8]. Seventy percent of CM pest control is dependent on insecticides [9]. CM is a plastic species that has successfully adapted to different habitats and has also developed resistance to different groups of synthetic insecticides [10,11]. The first documented case of resistance was in 1928 in the United States against arsenates [12]. In Europe, the first case of resistance to diflubenzuron was documented in 1990 in southeastern France and Italy [13]. Ever since, more events of resistance have been progressively reported in almost all major apple-growing regions [10,14,15,16].
CM populations are now resistant to 22 different active chemical compounds, and 193 cases of resistance have been recorded [17]. The use of chemical insecticides in the last 30 years has altered the development of resistance [18,19,20,21,22,23,24]. An additional problem occurred during the 1990s regarding cross-resistance development, as CM simultaneously became resistant to numerous groups of pesticides [25,26]. Since 2005, resistance to the widely used isolate CpGV-M has also been reported in several European countries [27,28,29,30,31,32].
CM resistance to insecticides is an increasing problem in apple production. Reliable data on resistance are necessary for successful resistance management. In order to keep management recommendations, it is important to continue the monitoring processes in light of changing conditions or new data gained [23]. Resistant populations need to be continuously studied to suppress the further spread of resistance. Hence, there is a need for new control tools and a new approach to CM management.
A multidisciplinary approach is imperative to developing effective pest management strategies. One component of this is understanding the population dynamics of insect pests and their genetic structure [33]. To define a proper integrated pest management strategy for CM and other insects, understanding the population genetic structure and dispersal patterns of species and population is required at the field and landscape scales [34].
Several molecular markers (AFLPs, microsatellites, allozymes, among others) have been used to study modification in the structure of CM populations [3,9,15,26,34,35,36,37,38,39,40]. Franck et al. [3] studied CM populations from treated and untreated orchards in Europe and South America (France and Chile) and reported that there was no significant genetic differentiation by country but found that insecticide treatment had some effect on allelic richness. Pajač et al. [26] used microsatellite markers to compare the genetic structure of treated and untreated populations CM in Croatia. The authors demonstrated that differences in genetic structure between populations were low; however, natural populations of CM had the most average number of alleles and the highest number of unique alleles compared with the handled populations. Frank and Timm [39] also used microsatellite markers to study CM genetic structure and gene flow in biologically and chemically treated apple orchards. These authors discovered less genetic variation between populations but significant genetic variation within individuals. Chen and Dorn [40] used microsatellite markers to examine genetic differentiation and the extent of gene flow among eight field populations. They found significant genetic differentiation between populations even when they were less than 10 km apart. These results are consistent with those of Timm et al. [38], Thaler et al. [9], and Duan et al. [41] and provide evidence for CM population differentiation at small spatial scales, even within the same bioregion. Men et al. [42] first investigated the genetic diversity and structure of the CM population in China from 12 apple orchards. They used eight microsatellite loci and observed sequential loss of genetic diversity and significant structuring associated with dispersal. Li et al. [43] confirmed Men et al.’s [42] results and found that the genetic diversity of populations from northeastern China was similar to that of native CM populations in Europe. Kuyulu and Genç [44] found low genetic differentiation among nine CM populations in Turkey, and Basoalto et al. [45] found low genetic differentiation among 34 populations (FST = 0.03) in Chile. Cichón et al. [46] used 13 microsatellite markers for 22 locations in Chile and Argentina and found significant genetic differentiation among populations (FST = 0.085).
Analyzing the geometric characteristics of the morphology (geometric morphometric tools) is a demonstrated monitoring tool for studying inter and intraspecific variation and is a useful tool to show forewing shape and size differences among codling moth populations [47]. It is well known that metric traits (wing shape and size) are the first morphological traits to change under the influence of environmental and genetic factors [48,49]. Over the last 20 years, geometric morphometric (GM) has been used to study the genetic variability of different insect species [50,51,52,53,54,55]. In CM populations, GM methods have been used to reveal differences between CM forewings and hindwings as a function of the season (overwintering vs. summer), geographical location, and sex [56]. Pajač Živković et al. [57] investigated the relationship between integrated and organic CM populations using GM, but on a limited number of moths. Nevertheless, the authors discovered population changes associated with different types of apple production.
GM, which uses phenotypic size and shape analysis, is a technique that can be used to reveal differences in forewing shape and size among populations of CM. Similar to single nucleotide polymorphisms (SNPs), which are genetic biomarkers, GM can be used as a phenotypic biomarker. Combining genetic and morphometric monitoring has been used to study other pest insects with success [58]. Moreover, studies suggest that the data generated are more precise when both methods are used in combination [50,59,60,61,62].
Here, we report on the combined use of genetic and geometric morphometric techniques to determine differences in field populations of CM related to the type of apple control method. The hypothesis of this study was that by combining genetic and morphological markers, it would be possible to identify CM populations based on control management to help improve the ongoing surveillance of CM populations. Through innovation and the use of novel methods (such as single nucleotide polymorphisms and geometric morphometrics), it may be possible to develop reliable strategies for monitoring CM populations in the field.

2. Materials and Methods

2.1. Collection Sites and Sampling

Adult male CM individuals were collected across 2 years (2017 and 2018) from mid-April to early September in apple orchards in continental (northern and eastern) Croatia (Figure 1) using funnel traps Csalomon® VARL (Plant Protection Institute, Budapest, Hungary) with the pheromone lure with rubber. Nine populations were collected from organic orchards (Garešnica, Veliko Polje, Vukovar, Donje Orešje, Jazbina, Šašinovec, Kravarići Barbarski, Beloslavec, and Zagreb) and nine populations from orchards with integrated pest management (IPM) practices (Veliki Zdenci, Dugo Selo Lukačko, Zdenci, Tovarnik, Lovas, Velika Mlaka, Čehovec, Kloštar Ivanić, and Obreška). A total of 18 field populations and 1 laboratory-reared sample (insecticide-free) were studied (Table 1). Laboratory-reared susceptible populations were obtained from the Entomos AG part of Andermatt Holding AG (Le Lieu, Switzerland).
The selected orchards represent typical apple farming in Croatia, and trees were 15–20 years old. According to the EU standard directive, pest management in integrated orchards includes pest monitoring and threshold-based applications [63]. The IPM orchard was systematically treated with different insecticides. The insecticides used in the orchards of IPM were: chlorpyrifos-ethyl (organophosphate insecticides), alpha-cypermethrin, deltamethrin (pyrethroids), lufenuron, methoxyfenozide (insect growth regulators), thiacloprid, acetamiprid (neonicotinoids), emamectin benzoate (avermectins), and chlorantraniliprole (diamides). The insecticides were applied 10 to 15 times during the growing season by spray treatments. The resistance of European populations to pesticides that are used in orchards in commercial apple production has been confirmed by Reyes et al. [13,64]. The populations collected in the organic orchards were not treated with chemicals and were mainly controlled by maintaining high functional biodiversity (assemblages of beneficial insects). No mating disruption, Cydia pomonella granulovirus (CpGV), nematodes, entomopathogenic fungi, or nets were used in the organic orchards. In this research, all CM populations were collected in Croatia. We used the same populations for the genetic and morphometric analyses.

2.2. DNA Extraction and SNPs Genotyping

A total of 94 C. pomonella males were sampled in this study. DNA was extracted from the whole-body tissue using the Qiagen DNeasy Blood and Tissue Kit (QIAGEN, Hilden, Germany) following the manufacturer’s protocol. The forewings from all individuals were removed and preserved for morphometric analysis. DNA quality and concentration were determined using a spectrophotometer (BioSpec-nano Micro-volume). After quality control, the samples were sent for commercial genotyping at Diversity Array Technology Pty Ltd. (DArT, Canberra, Australia) [65].

2.3. Geometric Morphometric Sample Preparation

The genotyped CM adults were also examined using GM techniques, and analyses based on forewing veins were performed. In total, 363 CM forewings were analyzed. Eighteen landmarks were digitized and defined by vein junctions (Figure 2) or vein terminations following the protocol of Pajač Živković et al. [57].

2.4. Data Analysis

2.4.1. SNP Quality Control

Genetic data were analyzed using the packages adegenet v2.1.5. [66], SNPrelate v1.6.4. [67], and dartR v1.9.1.1. [68] developed for the R Environment for Statistical Computing [69]. The SNP data set was subject to a filtering process to remove potentially erroneous SNPs. We used the following criteria: call rate < 90% (i.e., SNPs that had 10% missing genotypes or greater) were removed from the data set, SNPs with reproducibility < 95% were excluded, minor allele frequencies (MAF) > 0.01, and monomorphic SNPs and secondaries were excluded. The following estimates of the parameters of genetic diversity were calculated for each population using the package SNPRelate: number of different alleles (A), number of private alleles (P), observed heterozygosity (Ho), and expected heterozygosity (He).

2.4.2. Population Genetics Analyses

Pairwise FST were calculated between CM populations (i.e., organic, integrated, and laboratory populations) using the gl.fst.pop command in dartR package. Deviation from the Hardy–Weinberg equilibrium (HWE) was estimated for each population using the gl.report.hwe command as implemented in the R package dartR [68]. Using the function gl.basic.stats in dartR, we estimated the overall basic population genetics statistics per locus, such as the observed (HO) heterozygosity, (FIS) inbreeding coefficient per locus, and FST corrected for the number of individuals.
The Bayesian approach implemented in STRUCTURE v 2.3.4 [70] was used to find the probable number of genetic clusters. Genetic clusters (K) were set between 1 and 20 (one more than the total number of populations for the complete data set), and a series of 10 replicate runs for each prior value of K was analyzed. This analysis was comprised of independent runs consisting of a burn-in of 10,000 iterations followed by 100,000 Markov chain Monte Carlo iterations. Default parameters in STRUCTURE were set with an admixture model of ancestry and the correlated allele frequency model assumed. The number of genetic clusters was calculated using the ΔK method in Structure Harvester software [71].
Further analysis of population structures was conducted using the discriminant analysis of principal components (DAPC) implemented in the R package “adegenet” [66]. Principal component analysis (PCA) was performed to determine genetic similarities and dissimilarities present within the data set using the package “SNPrelate” [67]. Discriminant analysis of principal component (DAPC) was also employed to find the population structures.

2.4.3. Geometric Morphometrics
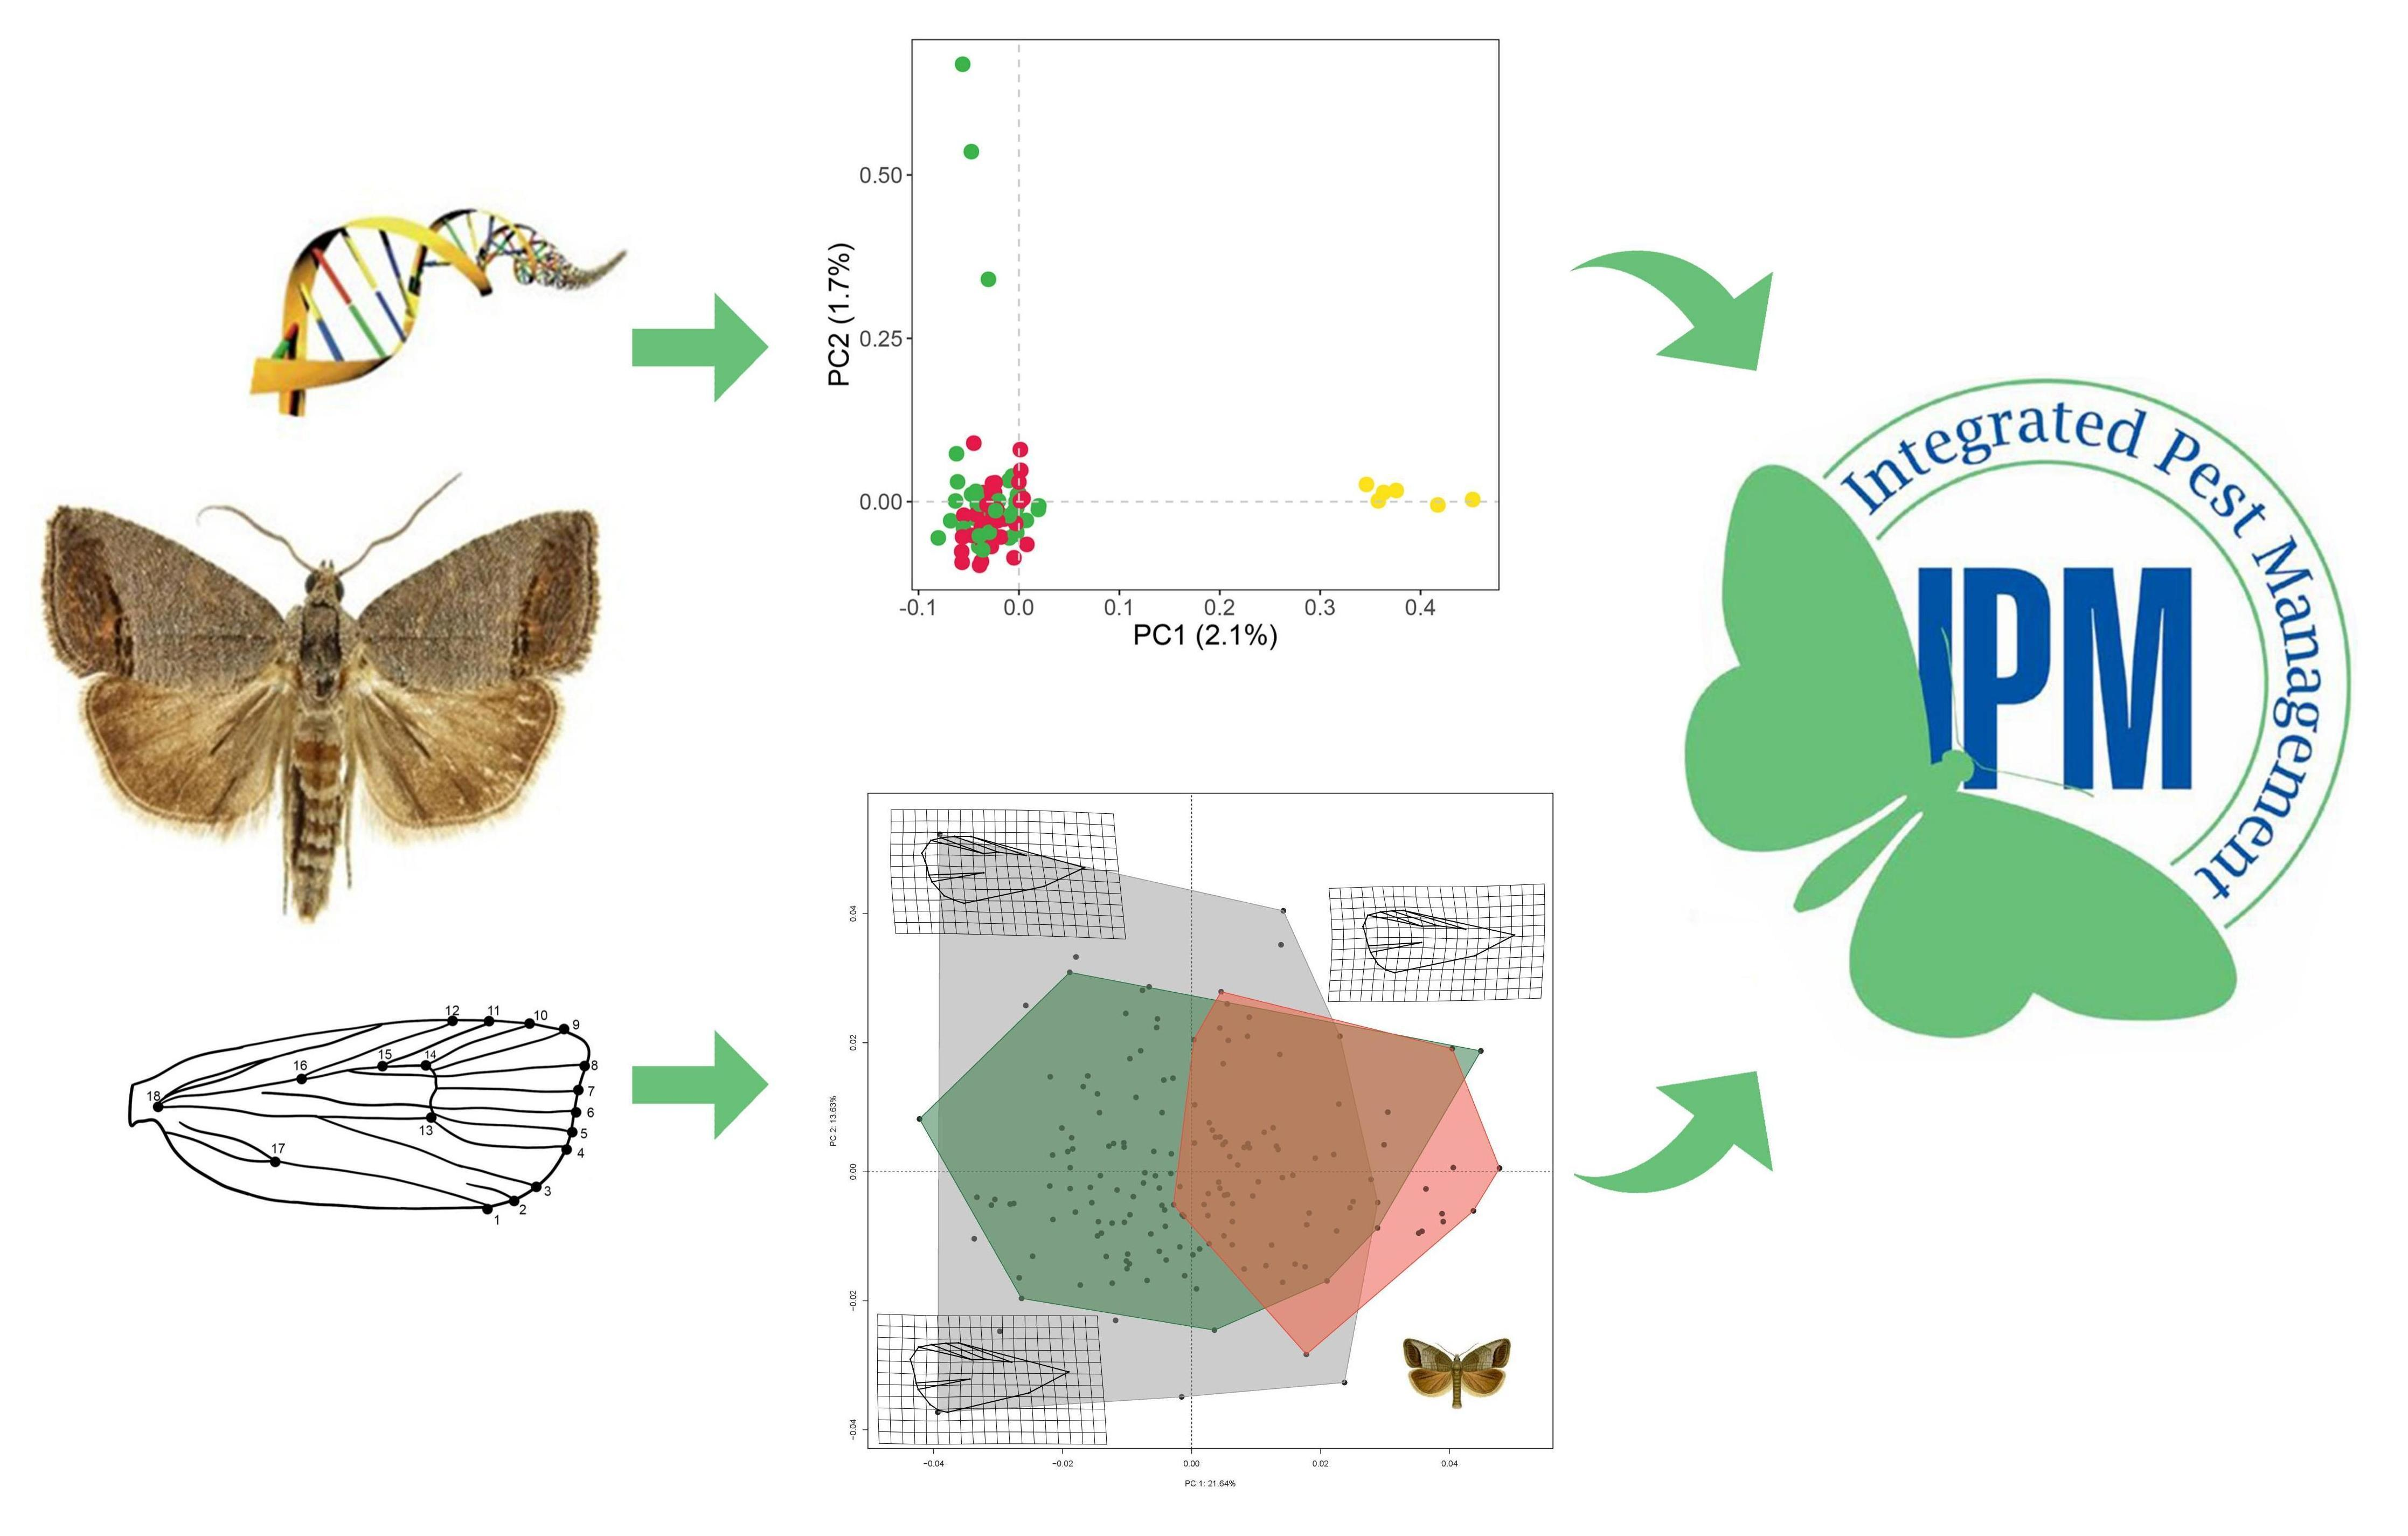
The established 18 landmarks for the CM [57] were digitized using tpsDIG v.2.16 [72]. Statistical analyses were performed using a coding environment in R using geomorph 4.0 R package [73] and package gmShiny [74]. Landmark coordinates were determined, and shape information was extracted using a full Procrustes fit [75]. Principal component analysis (PCA) was used to visualize forewing shape variations in relation to the pest management practice [76]. PCA was based on the covariance matrix of individual forewing shapes. To visualize the average change in populations from integrated and organic orchards, a covariance matrix of the average data was created [77]. It is important to state that PCA was performed to determine the overall variability among the studied populations, where the percentage of variation between axes (PCs) represents the different dimensions of the shape space. To detect statistical differences between organic and integrated wing shape differences, we performed a Procrustes ANOVA. Finally, to confirm whether size had an allometric effect, a multivariate regression of shape versus centroid size was performed [78].

3. Results

3.1. Genetic Data

3.1.1. Population Diversity Metrics

An initial set of 57,392 SNPs were detected in the 94 genotyped CM samples. However, 52,513 SNPs were removed during the quality control steps (reproducibility, discarding monomorphic markers, call rate, minor allele frequencies, and removing secondaries). For final analyses, 4879 SNPs were retained.
Values of genetic diversity obtained across all loci were: low observed heterozygosity (Ho):0.130 and low genetic diversity estimated by expected heterozygosity (He):0.159, a moderate observed inbreeding coefficient (FIS = 0.221), and a low overall value of the genetic structure (FST = 0.021) estimated for the three types of populations. The average Ho per population ranged from 0.104 (laboratory) to 0.147 (organic), while the average He ranged from 0.118 (laboratory) to 0.180 (organic and laboratory) (Table 2). Across all populations, we found a low level of genetic diversity.
Moderate genetic differentiation was found between the laboratory and field populations. No differentiation was found between the two field-sampled populations. Population pairwise estimates of FST between the integrated and organic populations were 0.001, integrated vs. laboratory was 0.140, and organic vs. laboratory 0.135.

3.1.2. Genetic Structure

The PCA shows strong patterns of structure between the laboratory and field populations (Figure 3).
STRUCTURE analysis indicated ΔK = 2 as the most likely number of clusters or populations present within the sampled CM individuals (Figure 4). Results from STRUCTURE assigned moths to two clusters (Figure 5).
The DAPC showed the patterns of genetic structure in CM (Figure 6). The genotypes were grouped into three clusters (i.e., laboratory population, organic orchards, and integrated field orchards).

3.2. Geometric Morphometrics

A Procrustes ANOVA showed highly significant differences between organic and integrated populations (F: 8.68, p < 0.001, Figure 7). After incorporating the laboratory population into the analysis, the Procrustes ANOVA also showed highly significant differences between the three analyses groups (F: 8.24, p < 0.001, Figure 7).
Most of the total shape variation (21.6%) was explained by the PC1, while the PC2 explained 13.6% of the total shape variation.
Principal variation was noted in landmarks 16, 17, and 18 at the left extreme of the wing, where expansion and contraction of the wing occur during flight (Figure 8). These results can be explained by the management practice (organic vs. integrated cultivation) and may indicate that there is variability in the genotype due to pest control management.
A multivariate regression did not show differences in wing size among the different populations. Therefore, a correction for allometry was not needed. Finally, the results from GM showed that populations from organic orchards are phenotypically similar to the laboratory population than to those from the integrated orchards.

4. Discussion

The aim of integrated production is to promote and care for human health by the production of high-quality fruits without residuals of pesticides. Environmentally friendly and area-wide IPM strategies must be developed to accomplish this aim. Suppressing and preventing the further spread of resistance is a prerequisite for successful and sustainable apple production in Europe. We monitored field CM populations to detect differences related to the type of apple control method and to identify specific biotypes. Our genetic results showed low levels of genetic diversity in the populations investigated in Croatia as well as the laboratory population. Those results are in accordance with the results from Pajač et al. [57]. The output revealed two genetic clusters, which were confirmed by PCA analysis, namely, the laboratory population and the integrated and organic populations (which were combined). However, the DAPC analysis showed three groups: organic orchards, integrated orchards, and the laboratory population (Figure 6). This result can be explained by the basic difference between PCA and DAPC analyses. PCA aims to summarize the overall variability among individuals, which includes both the divergence between groups (i.e., structured genetic variability) and the variation occurring within groups; that is why it is not appropriate to obtain a clear picture of between-population variation. On the other hand, DAPC attempts to summarize the genetic differentiation between groups while overlooking within-group variation and providing better population structure. In DAPC, data are first transformed using PCA, and, subsequently, clusters are identified using discriminant analysis (DA) [79].
However, the detected changes associated with different control methods in this study were very small, and this needs further investigation. In previous studies, markers such as microsatellites were unable to show differences in the population genetic structure of CM populations in Croatia [80] or elsewhere in Europe [3]. Nevertheless, these authors did note the suspected influence of insecticide treatment on CM allelic richness.
High-throughput sequencing can provide us with deeper insight into the molecular mechanisms of resistance [81]. Thanks to a denser and more uniform distribution within genomes and a large number of SNPs (thousands to millions), we can generate a large amount of information in a single sequencing run, which is less time-consuming and less expensive than previous markers. In addition, SNP markers provide us with broader genome coverage and higher quality data than microsatellites or mtDNA [82]. However, resistance occurrence is dynamic, and resistance mechanisms can change over time. Resistance constantly occurs in insect populations and can even develop within a season [83]. Resistance depends on the number of treatments, the number of generations an insect can produce, and the treated organism itself [83]. Belinato and Martins [84] stated that “insecticide resistance is an adaptive trait in which a set of genes are favorably selected to maintain the insect alive and able to reproduce under an environment exposed to pesticides.” It is known that different gene groups are involved in resistance [85]. This makes it difficult to determine and predict which populations will become resistant and when [86,87]. Some argue that it is, therefore, more effective to use morphometric markers to identify minor (and recent) genetic changes than to use genetic markers to identify major changes in the genome [49,50].
The metric properties of organisms, in our work, the wing morphology of CM, were the first morphological characters to change as influenced by environmental and genetic factors [48,49]. GM methods are used to study the smaller changes in population structure [77,88,89], and that is why GM can be used to detect and describe the changes in phenotype that occur under the influence of the genotype.
In our study, using GM methods, we differentiated integrated from organic CM populations based on wing shape. Populations from the organic orchards significantly differed in wing shape in comparison with integrated CM populations. Our data showed that the CM organic population was morphologically similar to the susceptive laboratory population, which had a differing wing shape in comparison with the integrated population. Individuals from the organic orchards had expansion and contraction of the forewing in landmarks 16, 17, and 18, making the wings more elongated and narrower. These results are consistent with that of Pajač Živković et al. [57], who found the same pattern of CM forewings from organic orchards in Croatia. Elongated wings are more aerodynamic and are an important trait needed for the migratory movement of insects (e.g., western corn rootworm) [90].
Mikac et al. [91] suggested that such phenotypic differences in wing shape and size have implications for dispersal and long-distance movement of resistant and nonresistant insects, as wing morphology is a crucial element in an insect’s dispersal ability [92]. A study by Pajač Živković et al. [57] was the first to demonstrate significant differences in wing shape of lepidopterans in relation to resistance. In their study, CM populations from organic orchards showed the least wing deformation and were, therefore, reported to be the better fliers and dispersers compared with CM from integrated populations, which were found to be inferior fliers. According to our results, individuals from organic orchards were also found to be better fliers, which means that they are likely responsible for the expansion of the population. Intense selection pressure exerted by decades of pesticide use to control the species has altered the structural integrity of CM wings, making them less efficient at dispersal. This result suggests that the development of resistance could affect the fitness of the organism itself. That is, when the organism becomes resistant, it simultaneously loses other biological traits [84]. Despite the fact that resistant individuals are less capable of long flights, they still represent a pool of new genes, which means that they can transfer the resistance to their offspring. This research should also be conducted on CM females to confirm whether resistance equally affects both sexes since females are responsible for population expansion and enlargement in CM [26]. According to Schumacher et al. [93], some individuals are able to disperse over several kilometers in the field; even distances of up to 11 km have been reported. According to several studies on CM and insecticide resistance, larger females are more resistant than smaller males [21,34,94] and, therefore, it is likely that this sex and morphotype combination is responsible for spreading resistant alleles throughout apple production areas. In this scenario, it does not matter if resistant males remain in a given area because it is the females that ultimately transfer the resistant genes to new areas via dispersal and offspring. According to Foster [95] and Liu [96], only by monitoring, characterizing, and predicting the occurrence and spread of resistance can we hope to use existing chemical agents in a sustainable manner. Therefore, it is very important to find effective monitoring tools that can serve as reliable biomarkers to detect changes and specific biotypes.

5. Conclusions

Our study has shown that geometric morphometrics is a reliable, accurate, and cost-effective technique for detecting population changes associated with different types of apple production. However, in our study, SNP markers did not show enough power to detect changes among CM populations. Further investigations that include biotests for detecting resistant populations could provide us with more results related to the detection and monitoring of resistant variants. Early detection of resistance will enable the implementation of insect resistance management (IRM) strategies and, thus, contribute to the implementation of antiresistance strategies for CM.

Author Contributions

Conceptualization, M.K.B., D.L. and K.M.M.; methodology, M.K.B., I.P.Ž., H.A.B. and D.L.; software, J.P.G.V. and M.J.S.; validation, M.K.B., D.L. and J.P.G.V.; formal analysis, M.K.B., H.A.B., J.P.G.V. and M.J.S.; investigation, M.K.B., D.L., I.P.Ž. and M.J.S.; resources, R.B.; data curation, M.K.B., D.L. and K.M.M.; writing—original draft preparation, M.K.B., H.A.B. and D.L.; writing—review and editing, K.M.M., R.B., J.P.G.V. and I.P.Ž.; visualization, M.K.B., H.A.B. and J.P.G.V.; supervision, R.B., K.M.M. and D.L.; project administration, R.B.; funding acquisition, R.B. All authors have read and agreed to the published version of the manuscript.

Funding

This research was funded by the Croatian Science Foundation through the project “Monitoring of Insect Pest Resistance: Novel Approach for Detection, and Effective Resistance Management Strategies” (MONPERES) (IP-2016-06-7458) and the “Young Researchers’ Career Development Project Training of New Doctoral Students” (DOK-01-2018) and the Open Access Publication Fund of the University of Zagreb Faculty of Agriculture.

Data Availability Statement

Data available on the request from the corresponding author.

Acknowledgments

We thank all colleagues and students for their help in collecting the moths and preparing the wings of the moths for geometric morphometry.

Conflicts of Interest

The authors declare no conflict of interest.

References

  1. Ciglar, I. Integrirana Zaštita Voćaka i Vinove Loze, 1st ed.; Zrinski: Čakovec, Croatia, 1998; pp. 82–87. [Google Scholar]
  2. Ciglar, I.; Barić, B.; Tomšić, T.; Šubić, M. Suzbijanje jabukovog savijača (Cydia pomonella) metodom konfuztje. Agron. Glas. Glas. Hrvat. Agron. Društva 2000, 62, 85–93. [Google Scholar]
  3. Franck, P.; Reyes, M.; Olivares, J.; Sauphanor, B. Genetic architecture in codling moth populations: Comparison between microsatellite and insecticide resistance markers. Mol. Ecol. 2007, 16, 3554–3564. [Google Scholar] [CrossRef]
  4. Voudouris, C.C.; Franck, P.; Olivares, J.; Sauphanor, B.; Mamuris, Z.; Tsitsipis, J.A.; Margaritopoulos, J.T. Comparing the genetic structure of codling moth Cydia pomonella (L.) from Greece and France: Long distance gene–flow in a sedentary pest species. Bull. Entomol. Res. 2012, 102, 185–198. [Google Scholar] [CrossRef]
  5. Food and Agriculture Organization of the United Nations. FAO STAT. Available online: http://www.fao.org/faostat/en/#data/QC/visualize (accessed on 31 March 2022).
  6. Maceljski, M. Poljoprivredna Entomologija, 2nd ed.; Zrinski: Čakovec, Croatia, 2002; pp. 302–309. [Google Scholar]
  7. Kovačević, Ž. Applied Entomology; University of Zagreb: Zagreb, Croatia, 1952; pp. 312–319. [Google Scholar]
  8. Sauer, A.J. Novel Types of Resistance of Codling Moth to Cydia pomonella Granulovirus. Ph.D. Thesis, Technische Universität, Darmstadt, Germany, 2017. [Google Scholar]
  9. Thaler, R.; Brandstätter, A.; Meraner, A.; Chabicovski, M.; Parson, W.; Zelger, R.; Dalla Via, J.; Dallinger, R. Molecular phylogeny and population structure of the codling moth (Cydia pomonella) in Central Europe: II. AFLP analysis reflects human–aided local adaptation of a global pest species. Mol. Phylogenet. Evol. 2008, 48, 838–849. [Google Scholar] [CrossRef]
  10. Sauphanor, B.; Brosse, V.; Bouvier, J.C.; Speich, P.; Micoud, A.; Martinet, C. Monitoring resistance to diflubenzuron and deltamethrin in French codling moth populations (Cydia pomonella). Pest Manag. Sci. Former. Pest. Sci. 2000, 56, 74–82. [Google Scholar] [CrossRef]
  11. Mota-Sanchez, D.; Wise, J.C.; Poppen, R.V.; Gut, L.J.; Hollingworth, R.M. Resistance of codling moth, Cydia pomonella (L.) (Lepidoptera: Tortricidae), larvae in Michigan to insecticides with different modes of action and the impact on field residual activity. Pest Manag. Sci. Former. Pest. Sci. 2008, 64, 881–890. [Google Scholar] [CrossRef]
  12. Hough, W.S. Relative resistance to arsenical poisoning of two codling moth strains. J. Econ. Entomol. 1928, 21, 325–329. [Google Scholar] [CrossRef]
  13. Reyes, M.; Franck, P.; Charmillot, P.J.; Ioriatti, C.; Olivares, J.; Pasqualini, E.; Sauphanor, B. Diversity of insecticide resistance mechanisms and spectrum in European populations of the codling moth, Cydia pomonella. Pest Manag. Sci. Former. Pest. Sci. 2007, 63, 890–902. [Google Scholar] [CrossRef]
  14. Thwaite, W.G.; Williams, D.G.; Hately, A.M. Extent and significance of azinphos–methyl resistance in codling moth in Australia. Pest Control Sustain. Agric. 1993, 93, 166–168. [Google Scholar]
  15. Sauphanor, B.; Bouvier, J.C.; Brosse, V. Spectrum of insecticide resistance in Cydia pomonella (Lepidoptera: Tortricidae) in Southeastern Franc. J. Econ. Entomol. 1998, 91, 1225–1231. [Google Scholar] [CrossRef]
  16. Reuveny, H.; Cohen, E. Resistance of the codling moth Cydia pomonella (L.) (Lep Tortricidae) to pesticides in Israel. J. Appl. Entomol. 2004, 128, 645–651. [Google Scholar] [CrossRef]
  17. Arthropod Pesticide Resistance Database (APRD). Cydia pomonella-Shown Resistance to Active Ingredient(s). Available online: https://www.pesticideresistance.org/display.php?page=species&arId=407 (accessed on 30 March 2022).
  18. Sauphanor, B.; Cuany, A.; Bouvier, J.C.; Brosse, V.; Amichot, M.; Bergé, J.B. Mechanism of resistance to deltamethrin in Cydia pomonella (L.) (Lepidoptera: Tortricidae). Pest. Biochem. Physiol. 1997, 58, 109–117. [Google Scholar] [CrossRef]
  19. Stara, J.; Nad’ova, K.; Kocourek, F. Insecticide resistance in the codling moth [Cydia pomonella]. J. Fruit Ornam. Plant Res. 2006, 14, 99–106. [Google Scholar]
  20. Voudouris, C.C.; Sauphanor, B.; Franck, P.; Reyes, M.; Mamuris, Z.; Tsitsipis, J.A.; Vontas, J.; Margaritopoulos, J.T. Insecticide resistance status of the codling moth Cydia pomonella (Lepidoptera: Tortricidae) from Greece. Pest. Biochem. Physiol. 2011, 100, 229–238. [Google Scholar] [CrossRef]
  21. Reyes, M.; Barros–Parada, W.; Ramírez, C.C.; Fuentes–Contreras, E. Organophosphate resistance and its main mechanism in populations of codling moth (Lepidoptera: Tortricidae) from Central Chile. J. Econ. Entomol. 2015, 108, 277–285. [Google Scholar] [CrossRef]
  22. Yang, X.Q.; Zhang, Y.L. Investigation of insecticide–resistance status of Cydia pomonella in Chinese populations. Bull. Entomol. Res. 2015, 105, 316–325. [Google Scholar] [CrossRef]
  23. Bosch, D.; Rodríguez, M.A.; Avilla, J. Monitoring resistance of Cydia pomonella (L.) Spanish field populations to new chemical insecticides and the mechanisms involved. Pest Manag. Sci. 2018, 74, 933–943. [Google Scholar] [CrossRef] [Green Version]
  24. Ju, D.; Mota-Sanchez, D.; Fuentes-Contreras, E.; Zhang, Y.L.; Wang, X.Q.; Yang, X.Q. Insecticide resistance in the Cydia pomonella (L.): Global status, mechanisms, and research directions. Pest. Biochem. Physiol. 2021, 178, 104925. [Google Scholar] [CrossRef]
  25. Dunley, J.E.; Welter, S.C. Correlated insecticide cross–resistance in azinphosmethyl resistant codling moth (Lepidoptera: Tortricidae). J. Econ. Entomol. 2000, 93, 955–962. [Google Scholar] [CrossRef]
  26. Pajač, I.; Barić, B.; Šimon, S.; Mikac, K.M.; Pejić, I. An initial examination of the population genetic structure of Cydia pomonella (Lepidoptera, Tortricidae) in Croatian apple orchards. J. Food Agric. Environ. 2011, 9, 459–464. [Google Scholar]
  27. Asser–Kaiser, S.; Fritsch, E.; Undorf–Spahn, K.; Kienzle, J.; Eberle, K.E.; Gund, N.A.; Reineke, A.; Zebitz, C.P.W.; Heckel, D.G.; Huber, J.; et al. Rapid emergence of baculovirus resistance in codling moth due to dominant, sex–linked inheritance. Science 2007, 317, 1916–1918. [Google Scholar] [CrossRef] [PubMed]
  28. Schmitt, A.; Bisutti, I.L.; Ladurner, E.; Benuzzi, M.; Sauphanor, B.; Kienzle, J.; Zingg, D.; Undorf-Spahn, K.; Fritsch, E.; Huber, J.; et al. The occurrence and distribution of resistance of codling moth to Cydia pomonella granulovirus in Europe. J. Appl. Entomol. 2013, 137, 641–649. [Google Scholar] [CrossRef]
  29. Schulze-Bopp, S.; Jehle, J.A. Development of a direct test of baculovirus resistance in wild codling moth populations. J. Appl. Entomol. 2013, 137, 153–160. [Google Scholar] [CrossRef]
  30. Zichová, T.; Stará, J.; Kundu, J.K.; Eberle, K.E.; Jehle, J.A. Resistance to Cydia pomonella granulovirus follows a geographically widely distributed inheritance type within Europe. Biocontrol 2013, 58, 525–534. [Google Scholar] [CrossRef]
  31. Sauer, A.J.; Fritsch, E.; Undorf–Spahn, K.; Nguyen, P.; Marec, F.; Heckel, D.G.; Jehle, J.A. Novel resistance to Cydia pomonella granulovirus (CpGV) in codling moth shows autosomal and dominant inheritance and confers cross–resistance to different CpGV genome groups. PLoS ONE 2017, 12, e0179157. [Google Scholar]
  32. Sauer, A.J.; Schulze–Bopp, S.; Fritsch, E.; Undorf–Spahn, K.; Jehle, J.A. A third type of resistance to Cydia pomonella granulovirus in codling moths shows a mixed Z–linked and autosomal inheritance pattern. Appl. Environ. Microbiol. 2017, 83, e01036-17. [Google Scholar] [CrossRef] [Green Version]
  33. Blommers, L.H. Integrated pest management in European apple orchards. Ann. Rev. Entomol. 1994, 39, 213–241. [Google Scholar] [CrossRef]
  34. Fuentes–Contreras, E.; Espinoza, J.L.; Lavandero, B.; Ramírez, C.C. Population genetic structure of codling moth (Lepidoptera: Tortricidae) from apple orchards in central Chile. J. Econ. Entomol. 2008, 101, 190–198. [Google Scholar] [CrossRef]
  35. Pashley, D.P.; Bush, G.L. The use of allozymes in studying insect movement with special reference to the codling moth Laspeyresia Pomonella. In Movement of Highly Mobile Insects, Concepts and Methodology in Research, 1st ed.; Rabb, R.L., Kennedy, G.G., Eds.; North Carolina State University Press: Raleigh, NC, USA, 1979; pp. 333–341. [Google Scholar]
  36. Franck, P.; Guérin, F.; Loiseau, A.; Sauphanor, B. Isolation and characterization of microsatellite loci in the codling moth Cydia pomonella L. (Lepidoptera, Tortricidae). Mol. Ecol. Notes 2005, 5, 99–102. [Google Scholar] [CrossRef]
  37. Zhou, Y.H.; Gu, H.N.; Dorn, S. Isolation of microsatellite loci in the codling moth Cydia pomonella (Lepidoptera, Tortricidae). Mol. Ecol. Notes 2005, 5, 226–227. [Google Scholar] [CrossRef]
  38. Timm, A.E.; Geertsema, H.; Warnich, L. Gene flow among Cydia pomonella (Lepidoptera, Tortricidae) geographic and host populations in South Africa. J. Econ. Entomol. 2006, 99, 341–348. [Google Scholar] [CrossRef] [PubMed]
  39. Franck, P.; Timm, A.E. Population genetic structure of Cydia pomonella: A review and case study comparing spatiotemporal variation. J. Appl. Entomol. 2010, 134, 191–200. [Google Scholar] [CrossRef]
  40. Chen, M.H.; Dorn, S. Microsatellites reveal genetic differentiation among populations in an insect species with high genetic variability in dispersal, the codling moth, Cydia pomonella (L.) (Lepidoptera: Tortricidae). Bull. Entomol. Res. 2010, 100, 75–85. [Google Scholar] [CrossRef] [PubMed] [Green Version]
  41. Duan, X.; Li, Y.; Men, Q.; Zhang, M.; Qiao, X.; Harari, A.; Chen, M. Limited gene flow among Cydia pomonella (Lepidoptera: Tortricidae) populations in two isolated regions in China: Implications for utilization of the SIT. Fla. Entomol. 2016, 99, 23–29. [Google Scholar] [CrossRef] [Green Version]
  42. Men, Q.L.; Chen, M.H.; Zhang, Y.L.; Feng, J.N. Genetic structure and diversity of a newly invasive species, the codling moth, Cydia pomonella (L.) (Lepidoptera: Tortricidae) in China. Biol. Invasions 2013, 15, 447–458. [Google Scholar] [CrossRef]
  43. Li, Y.; Duan, X.; Qiao, X.; Li, X.; Wang, K.; Men, Q.; Chen, M. Mitochondrial DNA revealed the extent of genetic diversity and invasion origin of populations from two separate invaded areas of a newly invasive pest, Cydia pomonella (L.) (Lepidoptera: Tortricidae) in China. Bull. Entomol. Res. 2015, 105, 485–496. [Google Scholar] [CrossRef]
  44. Kuyulu, A.; Genç, H. Genetic diversity of codling moth Cydia pomonella L. (Lepidoptera: Tortricidae) populations in Turkey. Turk. J. Zool. 2020, 44, 462–471. [Google Scholar] [CrossRef]
  45. Basoalto, A.; Ramírez, C.C.; Lavandero, B.; Devotto, L.; Curkovic, T.; Franck, P.; Fuentes-Contreras, E. Population genetic structure of codling moth, Cydia pomonella (L.) (Lepidoptera: Tortricidae), in different localities and host plants in Chile. Insects 2020, 11, 285. [Google Scholar] [CrossRef]
  46. Cichón, L.I.; Soleño, J.; Garrido, S.A.; Guiñazú, N.; Montagna, C.M.; Franck, P.; Olivares, J.; Musleh, S.; Rodríguez, M.A.; Fuentes-Contreras, E. Genetic structure of Cydia pomonella populations in Argentina and Chile implies isolating barriers exist between populations. J. Appl. Entomol. 2021, 145, 911–921. [Google Scholar] [CrossRef]
  47. Hood, C.S. Geometric morphometric approaches to the study of sexual size dimorphism in mammals. Hystrix 2000, 11, 77–90. [Google Scholar]
  48. Levine, E.; Oloumi–Sadeghi, H. Western corn rootworm (Coleoptera, Chrysomelidae) larval injury to corn grown for seed production following soybeans grown for seed production. J. Econ. Entomol. 1996, 89, 1010–1016. [Google Scholar] [CrossRef]
  49. Bouyer, J.; Ravel, S.; Dujardin, J.P.; De Meeüs, T.; Vial, L.; Thévenon, S.; Guerrini, L.; Sidibé, I.; Solano, P. Population structuring of Glossina palpalis gambiensis (Diptera: Glossinidae) according to landscape fragmentation in the Mouhoun river, Burkina Faso. J. Med. Entomol. 2007, 44, 788–795. [Google Scholar] [CrossRef] [PubMed] [Green Version]
  50. Camara, M.; Caro–Riano, H.; Ravel, S.; Dujardin, J.P.; Hervouet, J.P.; De MeEüs, T.; Bouyer, J.; Solano, P. Genetic and morphometric evidence for population isolation of Glossina palpalis gambiensis (Diptera: Glossinidae) on the Loos islands, Guinea. J. Med. Entomol. 2006, 43, 853–860. [Google Scholar] [CrossRef] [PubMed]
  51. Lemic, D.; Benítez, H.A.; Püschel, T.A.; Gašparić, H.V.; Šatvar, M.; Bažok, R. Organic morphology of the sugar beet weevil Croatian populations: Evaluating the role of environmental conditions on body shape. J. Comp. Zool. 2016, 260, 25–32. [Google Scholar]
  52. Benítez, H.A.; Lemic, D.; Püschel, T.A.; Gašparić, H.V.; Kos, T.; Barić, B.; Bažok, R.; Živković, I.P. Fluctuating asymmetry indicates levels of disturbance between agricultural productions: An example in Croatian population of Pterostichus melas melas (Coleptera: Carabidae). Zool. Anz. 2018, 276, 42–49. [Google Scholar] [CrossRef]
  53. Pajač Živković, I.; Lemic, D.; Mešić, A.; Barić, B.; Órdenes, R.; Benítez, H.A. Effect of fruit host on wing morphology in Drosophila suzukii (Diptera: Drosophilidae): A first view using geometric morphometrics. Entomol. Res. 2018, 48, 262–268. [Google Scholar] [CrossRef]
  54. Lemic, D.; Benítez, H.A.; Bjeliš, M.; Órdenes–Claveria, R.; Ninčević, P.; Mikac, K.M.; Živković, I.P. Agroorganic effect and sexual shape dimorphism in medfly Ceratitis capitata (Diptera: Tephritidae) an example in Croatian populations. Zool. Anz. 2020, 288, 118–124. [Google Scholar] [CrossRef]
  55. Lemic, D.; Bjeliš, M.; Ninčević, P.; Živković, I.P.; Popović, L.; Gašparić, H.V.; Benitez, H.A. Medfly phenotypic plasticity as a prerequisite for invasiveness and adaptation. Sustainability 2021, 13, 12510. [Google Scholar] [CrossRef]
  56. Khaghaninia, S.; Mohammadi, S.A.; Sarafrazi, A.M.; Iraninejad, K.H.; Ebrahimi, E.; Zahiri, R. An analysis of seasonal dimorphism in codling moths, Cydia pomonella, from Iran using geometric morphometrics. Bull. Insectol. 2014, 67, 43–50. [Google Scholar]
  57. Pajač Živković, I.; Benitez, H.A.; Barić, B.; Drmić, Z.; Kadoić Balaško, M.; Lemic, D.; Dominguez Davila, J.H.; Mikac, K.M.; Bažok, R. Codling moth wing morphology changes due to insecticide resistance. Insects 2019, 10, 310. [Google Scholar] [CrossRef] [Green Version]
  58. Lemic, D.; Mikac, K.M.; Kozina, A.; Benitez, H.A.; McLean, C.M.; Bažok, R. Monitoring techniques of the western corn rootworm are the precursor to effective IPM strategies. Pest Manag. Sci. 2016, 72, 405–417. [Google Scholar] [CrossRef] [PubMed]
  59. Garnier, S.; Magniez-Jannin, F.; Rasplus, J.Y.; Alibert, P. When morphometry meets genetics: Inferring the phylogeography of Carabus solieri using Fourier analyses of pronotum and male genitalia. J. Evol. Biol. 2005, 18, 269–280. [Google Scholar] [CrossRef] [PubMed]
  60. Ortego, J.; Aguirre, M.P.; Cordero, P.J. Fine–scale spatial genetic structure and within population male–biased gene–flow in the grasshopper Mioscirtus wagneri. Evol. Ecol. 2011, 25, 1127–1144. [Google Scholar] [CrossRef]
  61. Francuski, L.; Milankov, V.; Ludoški, J.; Krtinić, B.; Lundström, J.O.; Kemenesi, G.; Ferenc, J. Genetic and phenotypic variation in central and northern European populations of Aedes (Aedimorphus) vexans (Meigen, 1830) (Diptera, Culicidae). J. Vector Ecol. 2016, 41, 160–171. [Google Scholar] [CrossRef] [Green Version]
  62. Henriques, D.; Chávez–Galarza, J.; SG Teixeira, J.; Ferreira, H.; Neves, J.C.; Francoy, T.M.; Pinto, M.A. Wing geometric morphometrics of workers and drones and single nucleotide polymorphisms provide similar genetic structure in the Iberian honey bee (Apis mellifera iberiensis). Insects 2020, 11, 89. [Google Scholar] [CrossRef] [Green Version]
  63. EUR-Lex. Directive 2009/128/EC of the European Parliament and of the Council of 21 October 2009 establishing a framework for Community action to achieve the sustainable use of pesticides (Text with EEA relevance). Off. J. Eur. Union Spec. Ed. Croat. 2009, 15, 253–268. [Google Scholar]
  64. Reyes, M.; Franck, P.; Olivares, J.; Margaritopoulos, J.; Knight, A.; Sauphanor, B. Worldwide variability of insecticide resistance mechanisms in the codling moth, Cydia pomonella L. (Lepidoptera: Tortricidae). Bull. Entomol. Res. 2009, 99, 359–369. [Google Scholar] [CrossRef] [Green Version]
  65. Kilian, A.; Wenzl, P.; Huttner, E.; Carling, J.; Xia, L.; Blois, H.; Caig, V.; Heller–Uszynska, K.; Jaccoud, D.; Hopper, C.; et al. Diversity arrays technology. A generic genome profiling technology on open platforms. Methods Mol. Biol. 2012, 888, 67–89. [Google Scholar]
  66. Jombart, T.; Ahmed, I. Adegenet 1.3–1.new tools for the analysis of genome–wide SNP data. Bioinformatics 2011, 27, 3070–3071. [Google Scholar] [CrossRef] [Green Version]
  67. Zheng, X.; Levine, D.; Shen, J.; Gogarten, S.M.; Laurie, C.; Weir, B.S. A high–performance computing toolset for relatedness and principal component analysis of SNP data. Bioinformatics 2012, 28, 3326–3328. [Google Scholar] [CrossRef] [Green Version]
  68. Gruber, B.; Unmack, P.J.; Berry, O.F.; Georges, A. dartr: An r package to facilitate analysis of SNP data generated from reduced representation genome sequencing. Mol. Ecol. Resour. 2018, 18, 691–699. [Google Scholar] [CrossRef] [PubMed]
  69. R Core Team, R. A Language and Environment for Statistical Computing; R Foundation for Statistical Computing: Vienna, Austria, 2021. [Google Scholar]
  70. Evanno, G.; Regnaut, S.; Goudet, J. Detecting the number of clusters of individuals using the software STRUCTURE: A simulation study. Mol. Ecol. 2005, 14, 2611–2620. [Google Scholar] [CrossRef] [PubMed] [Green Version]
  71. Earl, D.A.; Vonholdt, B.M. STRUCTURE harvester. A website and program for visualizing STRUCTURE output and implementing the Evanno method. Conserv. Genet. Resour. 2012, 4, 359–361. [Google Scholar] [CrossRef]
  72. Rohlf, F.J. TpsDig2, Digitize Landmarks and Outlines, Version 2.17 (Program). 2016. Available online: http://life.bio.sunysb.edu/morph (accessed on 20 September 2021).
  73. Adams, D.C.; Otárola-Castillo, E. Geomorph: An R package for the collection and analysis of geometric morphometric shape data. Methods Ecol. Evol. 2013, 4, 393–399. [Google Scholar] [CrossRef]
  74. Baken, E.K.; Collyer, M.L.; Kaliontzopoulou, A.; Adams, D.C. geomorph v4.0 and gmShiny: Enhanced analytics and a new graphical interface for a comprehensive morphometric experience. Methods Ecol. Evol. 2021, 12, 2355–2363. [Google Scholar] [CrossRef]
  75. Klingenberg, C.P. nMorphoJ, An integrated software package for geometric morphometrics. Mol. Ecol. Resour. 2011, 11, 353–357. [Google Scholar] [CrossRef]
  76. Jolliffe, I.T. Choosing a subset of principal components or variables. Princ. Compon. Anal. 2002, 2, 111–149. [Google Scholar]
  77. Klingenberg, C.P. Visualizations in geometric morphometrics. How to read and how to make graphs showing shape changes. Hystrix 2013, 24, 15–24. [Google Scholar]
  78. Monteiro, L.R. Multivariate regression models and geometric morphometrics: The search for causal factors in the analysis of shape. Syst. Biol. 1999, 48, 192–199. [Google Scholar] [CrossRef] [Green Version]
  79. Jombart, T.; Devillard, S.; Balloux, F. Discriminant analysis of principal components: A new method for the analysis of genetically structured populations. BMC Genet. 2010, 11, 94. [Google Scholar] [CrossRef] [Green Version]
  80. Pajač, I.; Barić, B.; Mikac, K.M.; Pejić, I. New insights into the biology and ecology of Cydia pomonella from apple orchards in Croatia. Bull. Insectol. 2012, 65, 185–193. [Google Scholar]
  81. Torres, A.Q.; Valle, D.; Mesquita, R.D.; Schama, R. Gene family evolution and the problem of a functional classification of insect Carboxylesterases. Reference Module in Life Sciences; Elsevier: Amsterdam, The Netherlands, 2018. [Google Scholar]
  82. Morin, P.A.; Luikart, G.; Wayne, R.K. SNPs in ecology, evolution and conservation. Trends Ecol. Evol. 2004, 19, 208–216. [Google Scholar] [CrossRef]
  83. Denholm, E.I.; De, G.J.; Williamson, M.S. Insecticide resistance on the move. Science 2002, 297, 2222–2223. [Google Scholar] [CrossRef]
  84. Belinato, T.A.; Martins, A.J. Insecticide resistance and fitness cost. In Insecticides Resistance; Trdan, S., Ed.; IntechOpen: London, UK, 2016; pp. 243–261. [Google Scholar]
  85. Grigoraki, L.; Pipini, D.; Labbe, P.; Chaskopoulou, A.; Weill, M.; Vontas, J. Carboxylesterase gene amplifications associated with insecticide resistance in Aedes albopictus: Geographical distribution and evolutionary origin. PLoS Negl. Trop. Dis. 2017, 11, e0005533. [Google Scholar] [CrossRef] [Green Version]
  86. Saavedra–Rodriguez, K.; Strode, C.; Flores Suarez, A.; Fernandez Salas, I.; Ranson, H.; Hemingway, J.; Black IV, W.C. Quantitative trait loci mapping of genome regions controlling permethrin resistance in the mosquito Aedes aegypti. Genetics 2008, 180, 1137–1152. [Google Scholar] [CrossRef] [PubMed] [Green Version]
  87. Faucon, F.; Dusfour, I.; Gaude, T.; Navratil, V.; Boyer, F.; Chandre, F.; Sirisopa, P.; Thanispong, K.; Juntarajumnong, W.; Poupardin, R.; et al. Identifying genomic changes associated with insecticide resistance in the dengue mosquito Aedes aegypti by deep targeted sequencing. Genome Res. 2015, 25, 1347–1359. [Google Scholar] [CrossRef] [PubMed] [Green Version]
  88. Adams, D.C.; Rohlf, F.J.; Slice, D.E. A field comes of age: Geometric morphometrics in the 21st century. Hystrix 2013, 24, 7–14. [Google Scholar]
  89. Benítez, H.A.; Püschel, T.A. Modelando la varianza de la forma: Morfometría geométrica aplicaciones en biología evolutiva. Int. J. Morphol. 2014, 32, 998–1008. [Google Scholar] [CrossRef] [Green Version]
  90. Mikac, K.M.; Douglas, J.; Spencer, J.L. Wing shape and size of the western corn rootworm (Coleoptera: Chrysomelidae) is related to sex and resistance to soybean–maize crop rotation. J. Econ. Entomol. 2013, 106, 1517–1524. [Google Scholar] [CrossRef]
  91. Mikac, K.M.; Lemic, D.; Benítez, H.A.; Bažok, R. Changes in corn rootworm wing morphology are related to resistance development. J. Pest Sci. 2019, 92, 443–451. [Google Scholar] [CrossRef] [Green Version]
  92. DeVries, P.J.; Penz, C.M.; Hill, R.I. Vertical distribution, flight behaviour and evolution of wing morphology in Morpho butterflies. J. Anim. Ecol. 2010, 79, 1077–1085. [Google Scholar] [CrossRef] [PubMed]
  93. Schumacher, P.; Weyeneth, A.; Weber, D.C.; Dorn, S. Long flights in Cydia pomonella L. (Lepidoptera: Tortricidae) measured by a flight mill: Influence of sex, mated status and age. Physiol. Entomol. 1997, 22, 149–160. [Google Scholar] [CrossRef]
  94. Varela, L.G.; Welter, S.C.; Jones, V.P.; Brunner, J.F.; Riedl, H. Monitoring and characterization of insecticide resistance Codling moth (Lepidoptera: Tortricidae) in four Western States. J. Econ. Entomol. 1993, 86, 1–10. [Google Scholar] [CrossRef]
  95. Foster, S. Insecticide Resistance and Its Implications for Potato Production in the UK; British Potato Council. Available online: http://www.potato.org.uk (accessed on 25 November 2021).
  96. Liu, N. Pyrethroid Resistance in Insects, Genes, Mechanisms, and Regulation. In Insecticides–Advances in Integrated Pest Management, 1st ed.; Perveen, F., Ed.; InTech: Shanghai, China, 2012; pp. 457–468. [Google Scholar]
Figure 1. Sampling sites of Cydia pomonella in Croatian orchards: red, integrated orchard; green, organic orchard.
Agronomy 12 01278 g001
Figure 2. Position of 18 landmarks type 1 on a Codling moth forewing (adapted with permission from Ref. [57]. 2019, Pajač Živković, I.).
Agronomy 12 01278 g002
Figure 3. Principal component analysis (PCA) based on 4879 SNPs. Color and sign code: red, populations from integrated orchards (INT); green, populations from organic orchards (ECO); yellow, laboratory population (NONRE).
Agronomy 12 01278 g003
Figure 4. Results from Structure Harvester analysis reveal the most likely value of K based on STRUCTURE results.
Agronomy 12 01278 g004
Figure 5. STRUCTURE analysis of 94 CM genotypes using SNP markers.
Agronomy 12 01278 g005
Figure 6. Discriminant analysis of principal components (DAPC) based on 4879 SNPs. Color and sign code: red, populations from integrated orchards (INT); green, populations from organic orchards (ECO); yellow, laboratory population (NONRE).
Agronomy 12 01278 g006
Figure 7. Principal component analysis of the average forewing shape among different populations from integrated orchard, organic orchard, and laboratory populations of Cydia pomonella: red, integrated orchard; green, organic orchard; gray, laboratory population.
Agronomy 12 01278 g007
Figure 8. Average wing shape between different orchard populations. The middle wing represents the overall shape with the different averaged populations: red, integrated orchard (INT); green, organic orchard (ECO); gray: laboratory population (NON).
Agronomy 12 01278 g008
Table 1. Number of CM individuals used for geometric morphometric and SNPs analyses: n, sample size.
Codling Moth PopulationAdults Single Nucleotide
Polymorphism Genotyped (n)
Geometric Morphometric Wings (n)
Organic orchards4444
Integrated orchards4424
Laboratory population699
Table 2. Detailed allelic diversity estimates of Cydia pomonella.
PopulationnApHoHe
Integrated44901014430.1390.180
Organic44916319310.1470.180
Laboratory667461870.1040.118
Overall942491935610.1300.159
n, number of samples; A, number of different alleles; p, number of private alleles; Ho, observed heterozygosity; He, expected heterozygosity.
Publisher’s Note: MDPI stays neutral with regard to jurisdictional claims in published maps and institutional affiliations.

