1. Introduction
At present, great attention is paid to the sustainability of agricultural operations. In particular, safeguarding water resources is a priority that must consider not only its rational use but also the preservation of its integrity. It is thus essential to limit the spillage of pollutants into the ground since they largely flow into groundwater with harmful consequences both for organisms and for the entire food chain.
One of the most critical operations is the phytosanitary treatment of plants. Quick and precise application of pesticides is particularly difficult on tree crops, such as orchards and vineyards, where the irregular shape and width of the canopy make it difficult to target the scheduled dose.
Precise agriculture approaches can bring a significant contribution to this topic, supporting the design of innovative smart variable-dose sprayers, and adjusting the phytosanitary product dosage on the basis of the leaf area. Such an approach leads to a double benefit: economic (optimizing the product costs) and environmental (avoiding unnecessary dispersion of product). The optimization of the dosage also brings other valuable advantages, e.g., the reduction of working times, total energy demand (thus lowering the carbon footprint) or of sprayer water payload with a positive effect on soil compaction.
The research proposed in this paper aims to develop a prototype of a smart sprayer, allowing real-time characterization of the canopy profile for variable rate distribution of phytosanitary treatments in vineyards and orchards. The target is to develop a suitable control system based on optical sensors, to be installed on commercial sprayers operating at standard field conditions and at a working speed as high as 3 m/s. The system has to control the opening of up to ten spray nozzles according to the estimated canopy volume or to the presence/absence of leaves on the treated plant wall.
Following these constraints and also focusing on the economy of the control system, various solutions have been identified, aimed both at the study of measurement techniques for precision agriculture and at the development of prototypes of innovative sprayers. Systems for leaf detection are analyzed on the basis of qualitative tests carried out on an indoor synthetic vineyard in order to homogenize testing conditions under a controlled environment.
The main contribution of this work is the provision of an algorithm that, through the images acquired by a monocular (rather than 3D) camera, is able to ascertain the presence of leaves in the row to be treated and, therefore, to control a series of sprayers in an ON/OFF way. The proposed method, based on a Structure from Linear Motion (SfLM) approach, has been implemented on a low-cost embedded system and tested in both laboratory and in open-field conditions.
2. Related Work
The present paper focuses on the development of a mapping system based on an off-the-shelf RGB camera, allowing the on-the-go identification of the profile of the plant canopy and of the presence of leaves for real-time variable volume distribution in spraying operations. In this way, a suitable dose, sized on the actual leaf area, can be ensured at the different growing stages of the plants. Information from other spectral bands (e.g., red edge or near-infrared) has not been considered presently but could be easily integrated as additional information on the health status of the leaves.
In [
1], some typical approaches to tune the dosage on the basis of the plant canopy geometry are reported; more specifically, ref. [
2] focuses on Leaf Wall Area (LWA), a parameter that can be dynamically quantified and used as a feedback for real-time control of the sprayer dose. In our work, LWA is taken as the reference parameter for distribution tuning. Indeed, the leaf area is normally highly correlated to the overall volume of the canopy and to the total leaf area, especially in vineyard training systems, as already demonstrated by previous works [
3,
4]. For this reason, measuring the horizontally projected area occupied by the leaves is a simple approach for on-off control of nozzles, easily implementable in most commercial sprayer control units.
The pros and cons of different technologies, ranging from low-cost ultrasonic devices to infrared transceiver systems, from RGB to infrared or multispectral sensors, from time-of-flight to diffraction grating-based depth cameras, from stereoscopic vision systems to LIDAR, have been considered in [
1,
5,
6,
7]. Infrared and ultrasonic sensors are the oldest and simplest approaches. They are suitable for determining the average characteristics of the canopy and identifying large openings [
5]. Infrared sensors are scarcely influenced by temperature and humidity and provide measurements independent of atmospheric conditions. Devices with different fields of view (FoV) exist, but their detection distance is limited and is influenced by the characteristics of the plant or the ambient light intensity [
5]. Ultrasonic sensors are robust, low cost and easy to implement; on the other hand, they have a wide emission angle which limits the resolution and accuracy of the measurements [
1], particularly if the target surface is not flat and perpendicular to the sensor. They also suffer from interference when different sensors are used close to each other [
7]. A more recent type of proximity sensor is time-of-flight (ToF) sensors, but they unfortunately present disadvantages similar to the ones of ultrasonic and infrared sensors. Finally, all these types of proximity sensors provide a spatially limited measurement (spot) and require measurement times that may not be sufficient to correctly and continuously sample the vegetation in real-time in accordance with the speed of the agricultural vehicle. However, in the proposed comparison work, one of these solutions was taken into consideration in order to evaluate the potential of a simple system.
Light detection and ranging (LIDAR) measures distances through laser pulses; the most commonly used, also for their lower cost, is 2-D (two-dimensional) LIDAR. Specifically, ToF LIDAR measures the time a laser pulse takes to bounce off the target and return to the sensor; the more accurate but expensive phase-shift LIDAR measures the phase difference between the transmitted and reflected wave of the laser beam [
1]. Compared to ultrasonic or ToF sensors, the measurement area is much smaller (typically within 1°). A 2-D LIDAR exploits a rotating mirror to measure in polar coordinates all the distances within a plane or a sector; repeating the measurements by moving and referencing the device in the third unmeasured dimension, it is possible to obtain the 3D cloud points [
1,
5]. LIDAR permits a more accurate characterization of the crop, estimating its volume, leaf area or height. LIDAR, being insensitive to ambient light, can be used both during the day and night, but it is sensitive to dust, fog and water [
7]; distance measurement errors can occur if the target area is obstructed or has concavities.
In [
8], the authors show how a 2-D LIDAR, placed at the height of 1.6 m and vertically oriented on a tractor that moves between the vineyard rows at a speed of 1 km/h, can measure tree area index (TAI) and from this estimate the leaf area index (LAI). With the same configuration, ref. [
9] measured, using tracers, the drifting spray that passes through the vineyard wall with different working parameters of the sprayer and correlating this data to the readings obtained with a LIDAR on board a tractor that moves at 1.25 m/s: the results show how, from a LIDAR sensor, it is easy to estimate the drift of the spray although the true drift area depends on the droplet size.
The paper [
10] proposes a prototype that continuously controls a variable dose sprayer by estimating the volume of the canopy of trees. Ultrasonic sensors and a LIDAR are tested and compared, showing preliminary results about the controller’s effectiveness (canopy volume related to sprayer output) using a LIDAR. However, the proposed system is too slow for real-time applications. In [
11], the authors present the design, development and implementation of a semi-autonomous mobile robotic platform equipped with LIDARs that measure the canopy volume, paired with six crop sensors that measure the vegetative index (VI); they adopt a combination of two LIDARs, one facing the ground and one towards the sky, obtaining redundant measurements but with a different point of view: in such a way, by analyzing the pair of measurements, it is possible to filter out data (e.g., in the presence of a concavity) or improve the accuracy of the measurement.
Although these works refer to contexts identical to the case study, their operating speeds are much lower than our constraints.
Image sensors, unlike range sensors, provide several spatially distinct measurements in a single acquisition: the redundancy of the data present in subsequent acquisitions allows an accurate reconstruction of the profile or volume to be measured, even for relatively fast motion. The monocular vision system consists of an image sensor and an optic that allows a portion of the scene to be focussed on. Depending on the type of sensor and some optical filters, it is able to acquire images in the visible spectrum (in color or in grayscale) or in a specific spectrum band (infrared, ultraviolet).
More complex multispectral sensors can be used to acquire images simultaneously in different bands. Combined with a suitable iris aperture, these sensors have a high dynamic range of the measurable luminous flux, making them suitable for use in outdoor ambient light. The information of interest is obtained through suitable image processing carried out with heuristic algorithms or convolutional neural networks (CNN).
Under the hypothesis of being able to recognize the vegetation just by its green color, some works are proposed that use a monocular camera followed by segmentation algorithms based on color recognition. In [
12], an automatic threshold algorithm for separating canopy from the sky, based on edge detection, is proposed. The authors of [
13] propose a foliage detection algorithm (FDA) followed by a grape detection algorithm (GDA): the FDA operates in the RGB color space and allows a first outline of the acquired image, while they propose three variants of the GDA based on the recognition of textures once the edges of the image have been extracted. A target sprayer for orchards that identifies the crown by extracting the green color in the HSV color space followed by a morphological erosion operation, aiming the camera upwards at an angle of 30° to capture the entire crown while having the sky as a background, is described in [
14]. With a similar approach, the authors of [
15] placed the camera facing the sky near the ground and analyzed the correlation between the leaf area of the vineyard measured by the segmented image with its volume or using a professional instrument for measuring LAI [
16], whose operating principle is the measurement of UV-blue (320–490 nm band) instead of green. The segmentation based on color information always suffers from the context, typically of the same color (grass of the ground or adjacent rows). They obviate this by pointing the camera upwards instead of orthogonal to the wall to be analyzed. This, however, reduces the vertical resolution and limits the use of several nozzles.
In [
17], a monocular monochrome camera with two different optical band-pass filters was used. The system acquires both UV and NIR bands; the segmentation is obtained by looking for the optimal threshold of the histogram of gray values of the images: vegetation is highlighted by working in the near-infrared band. In fact, to analyze the vigor level of a plant, the NDVI (Normalized Difference Vegetation Index) is often used, calculated as the ratio between the difference and the sum of the radiations reflected in the near-infrared and in the visible red. Still, based on color segmentation using a camera in the visible band, ref. [
18] trivially used a magenta canvas behind the vineyard row to improve the contrast and determine the green leaf’s positions. The proposed system is difficult to adopt in real applications but could be considered to extract the ground truth in a laboratory setting.
Another class of promising vision systems concerns sensors that allow the estimation of the distance information on a full image based on stereoscopic twin cameras, time-of-flight or structured light cameras. Stereoscopic systems are formed by two identical monocular systems in a fixed configuration. Given the geometric characteristics of the system, a matching algorithm can estimate the distance of the objects. The detail of the depth map depends on the resolution of the starting images; moreover, a high detail requires long processing times, and distance estimation is not possible for areas not covered by both cameras.
Structured light camera methods [
19] consist of an image sensor combined with a structured light source, typically a projector that emits visible or UV light: the camera acquires the distorted pattern reflected by the surface and calculates its shape. Time-of-flight cameras project a pulsed light on the scene; the device, composed of several time-of-flight sensors, measures the time taken to receive the light pulse, thus estimating the distance for each point of the scene. Typically these sensors present a resolution lower than LIDAR but allow the shape of an extended area in a very short time to be evaluated simultaneously. Relative to the ambient brightness, considering working outdoors in full sunlight, stereo systems are more robust, cheaper and can reach higher resolutions than depth cameras, although the latter are quickly improving in performance. For these reasons, ToF cameras have not been taken into consideration in this work.
In [
20,
21], a consumer device, the Kinect [
22], was proposed for LAI estimation and for controlling the dose of sprayers. Its RGB-D camera has proven to provide precise estimations of canopy volume in vineyards, highly correlated to the results from manual measurements on the canopy; on the other hand, insufficient performances were achieved in the early stages when leaves are too small (<5 cm
2) or in the daytime, when intense sunlight might blind the sensor.
In [
23], the authors carried out a comparison of short-range leaf measurements with ToF cameras and stereoscopic vision systems, highlighting how stereo systems are more robust to strong sunlight, allow high-resolution measurement and are suitable for measuring non-close objects, albeit suffering from correspondence problems.
Ref. [
24] presents a 3-D reconstruction method based on the collection of multiple frames by a monocular camera: pixel to pixel comparison of images from different positions allows the reconstruction of a dense point-cloud representation of the scene. Similarly, ref. [
25] proposes structure from motion (SfM) reconstruction of vineyard on the basis of video frames collected by an inexpensive monocular camera moving along the rows: an algorithm operating on a combination of shape and color eventually classifies branches, leaves and fruits.
The references and methods reported above constitute a comprehensive state-of-the-art; on the other hand, the reported experiments and results are hardly comparable since they were achieved under different environmental conditions and different vineyard characteristics and management practices. For this reason, most of the relevant techniques have been here compared in a standardized condition, set up in an indoor environment and featuring a 1.5 × 7 m vine canopy.
3. Materials and Methods
As mentioned above, the aim of the present work is twofold: analyzing the performances of current state-of-the-art methods and using the achieved results in order to develop and test a prototype of a new measuring system allowing real-time canopy characterization.
Some constraints have been considered in our project:
the sprayer system, composed of approximately ten nozzles, is controlled in on-off modes
the target speed for the system is set to 3 m/s
the canopy/leaves detector is to be installed in a fixed position in the sprayer-tractor system
the tractor moves through the vineyard rows at a fixed distance from the plants.
Once the surface to be treated is quantified, it has to be divided and analyzed into separate portions, corresponding to the number of nozzles to be controlled. The percentage of area occupied by the leaves in each portion then has to be used in order to control the opening frequency for each of the nozzles [
21]. The product saving resulting when treatments are avoided on bare shoots is related both to sensor and sprayer system resolution (i.e., to the number of controlled nozzles). In the first part of the experimentation, the performances of four different leaf detectors were analyzed in a laboratory setting in order to have a set of reference performance values. The first one was based on an optical barrier system, the second one adopted LIDAR for direct distance measurement, while the remaining two were instead based on 2-D vision systems: one adopting a stereoscopic RGB-D camera for distance measurement, and, eventually, the proposed solution based on a monocular camera and an ad-hoc motion detection algorithm. The optical barrier-based system was realized using an infrared illuminator and an array of IR receivers to detect the interruption of the light beams by the leaves. The other systems were based instead on the evaluation of the distance of targets from the sensor and thus identified the wall’s vegetation from the knowledge of its approximate distances.
A model of a synthetic vineyard was set up in the laboratory. The leaf wall was about 1.5 m high and 7 m long, realized using plastic vine leaves arranged in patches. The sensors under testing were mounted on a cart bound to a rail support that moves parallel to the vineyard. The size of the model was realistic, and the chosen distribution of the synthetic leaves was similar to the vegetation in late Spring; the trolley, being moved by hand and considering the limited length of the model, cannot reach a constant speed comparable to the one of an agricultural machine. The four systems under test have been mounted on the mobile cart and the raw data have been gathered via a PC. The cart was equipped with a rotary encoder to accurately evaluate its position. In this way, the data can be combined into a panoramic image and compared to the ground truth.
The fundamental novelty of this work are:
the proposal and the performance analysis of a possible infrared barrier system for the determination of the LWA
a low-effort algorithm able to estimate the depth map from the frames provided by a simple monocular camera whose displacement is known (Structure from Linear Motion)
the numeric validation of the prototype and the comparison of all the methods under test, using a well-defined ground truth generated using a synthetic vineyard.
3.1. Ground Truth for Comparing Systems
In order to quantitatively measure the detection error of the different techniques under test, the ground truth has been realized. Following the suggestion of [
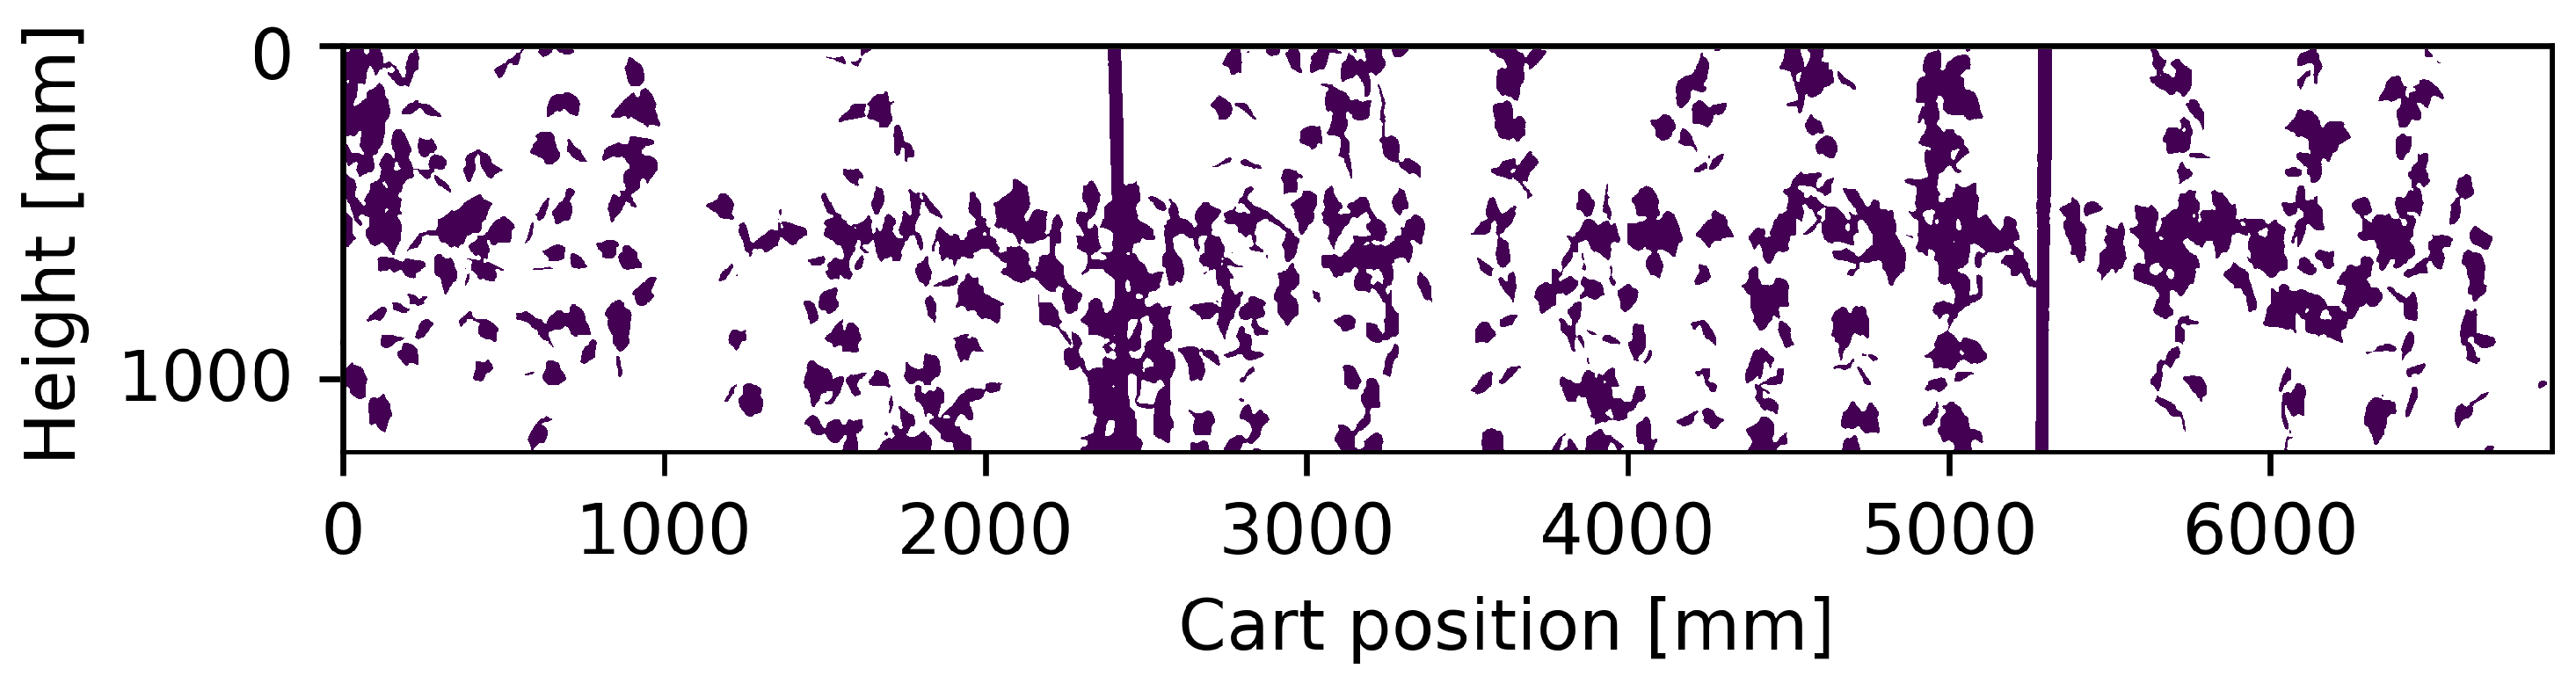
18], a series of images with an artificial purple background placed behind the synthetic vineyard has been acquired. In such a way, a simple segmentation based on the presence/absence of the green color can easily provide a true reference.
Figure 1 shows the panoramic image of the synthetic vineyard developed using the acquired sequence of images and their position measured by the encoder. Furthermore, the acquisition of the frames with a suitable purple background allows an effective segmentation based on color differences, as depicted in
Figure 2.
It is worth noting that all the panoramic images reported in the paper were built up by combining just the central portion (vertical bands) of the contiguous images acquired during the movement of the cart. For each pair of subsequent images, the displacement in pixels was evaluated: this value was used to define the band position, its dimension and the size of the borders [
26]. The use of a magenta background, i.e., a color extraneous to the profile to be analyzed, allowed an easy segmentation of the vineyard: the panoramic image was slightly blurred with an 11 × 11 kernel Gaussian filter to reduce noise, and the leaves mask has been identified as the complementary of the areas with 260° < hue < 340° and with a saturation above 20%.
All the datasets collected by means of the different techniques here investigated have been aligned, taking advantage of the reference positions defined by the cart position information. In the case of the IR barrier system or LIDAR, a suitable size of the light beam intercepting the vineyard plan was estimated, scaling this area in pixels to build the panoramic image with the data collected by the system being analyzed. The data collected and aligned with each system are then binarized according to the most suitable criterion for that system to estimate the lateral surface of the vineyard.
Finally, each representation of the vineyard profile was compared with the ground truth, classifying the areas correctly recognized as true-positive (
) where leaves are present and as true-negative (
) where they are absent, classifying the errors as false-positive (
) where the leaves are absent but are identified or false-negatives (
) where the leaves are present but are not identified. Counting in this way the errors and the correct recognition of the leaves, it was possible to calculate the true-positive rate (
), false-positive rate (
) and accuracy (
) indices that allow numerical comparison of the performance of the various methods proposed, according to the formulas reported in (
1)–(
3). In this phase of the study, the data processing time was neglected, considering only the influence of the movement speed on the obtainable sampling spatial resolution.
3.2. System Based on Infrared Barrier
The use of infrared (IR) radiation for distance measurement involves difficulties as the amplitude of the reflected light is a non-linear function dependent on the reflectance of the affected surface [
27], and a large amplification of the electrical signal generated by the receiver is required for distance measurements of several tens of centimeters. On the other hand, the infrared system can be fast and inexpensive if used for a barrier measurement to identify only whether or not a known light signal is received by reflection or on the optical axis.
Commercial sensors of this type, often called photocells, are widely used in the market to detect objects within their control field. Since the receiving transducer is sensitive to all infrared radiations, these types of sensors use a frequency-modulated light source so that the receiver can distinguish the signal of interest from the other infrared sources present in the environment, first of all, solar radiation.
For simple installation regardless of alignment, the devised system consists of a single extended IR source to be placed on one side of the vineyard wall with a combined array of receivers to be placed on the other side. In particular, by evaluating the correlation of the measuring data with LAI or volume of the canopy, the receiver array should be placed above the vineyard wall by positioning the source at the base pointing towards the other: in this way, installation is simplified and the receiving sensors capture less contribution of sunlight. A wide beam source of illumination is assumed so that it can reach all the receivers with a rough alignment; vice versa, the beam opening of the receivers should be as small as possible so as to perform a spatially concentrated measurement, thus being able to use many receivers close together.
Integrated receivers widely used in remote control receivers were chosen (CHQ1838 [
28]) for laboratory tests: they hook onto a 38 kHz IR optical carrier modulated in on-off-keying (OOK) and integrate the necessary optical detection with an automatic gain circuit, demodulation stage with output buffer. Standard IR LED sources were used, having an illumination angle of 60° and irradiation in the order of 20 mW/cm
2 each, with a control on the current of the LEDs to calibrate their irradiation: excessive illumination causes the scattering rays to reach the receiver with sufficient power to activate it erroneously. For the prototype, a periodic sending of a train of 10 pulses, modulated at 38 kHz, lasting 0.7 ms, followed by a pause of 18 ms, has been used; a control logic has been created for each receiver, synchronous with the transmitter, which counts the impulses received for each train and considered the line of sight free from obstacles (leaves) if at least half is received. The proposed prototype samples a vertical line every 33 ms (30 Hz).
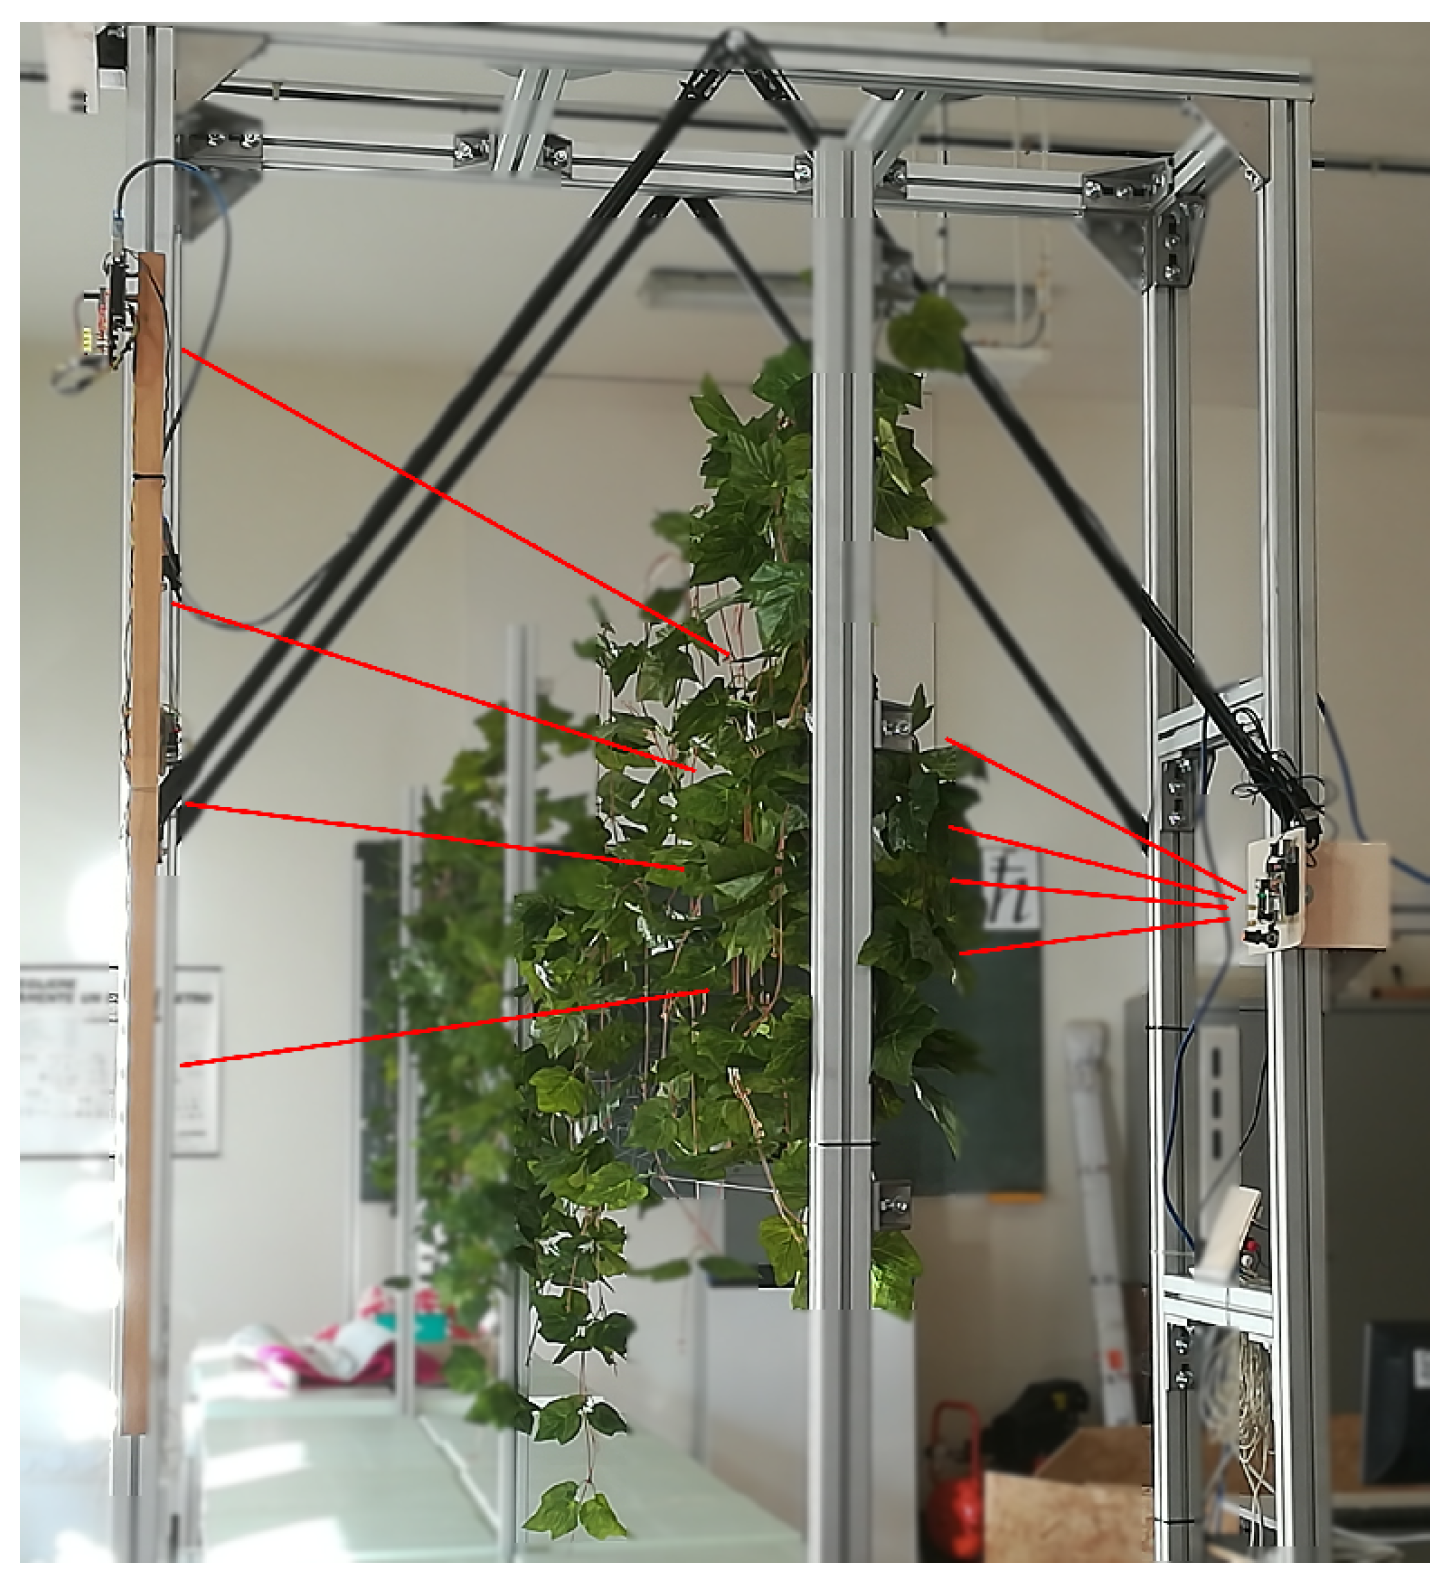
In particular, four receivers were used for the test;
Figure 3 shows the sensors installed on the mobile cart around the synthetic vineyard. Given the location of the receivers and of the transmitter, a geometric transformation has been applied to the data to create a panoramic image aligned with the reference; for the test, the opening of the measuring beam on the vineyard plane was considered almost point-like to consider only ideal direct rays, approximating the measurements to a spot of a few centimeters in order to compare them with the ground truth.
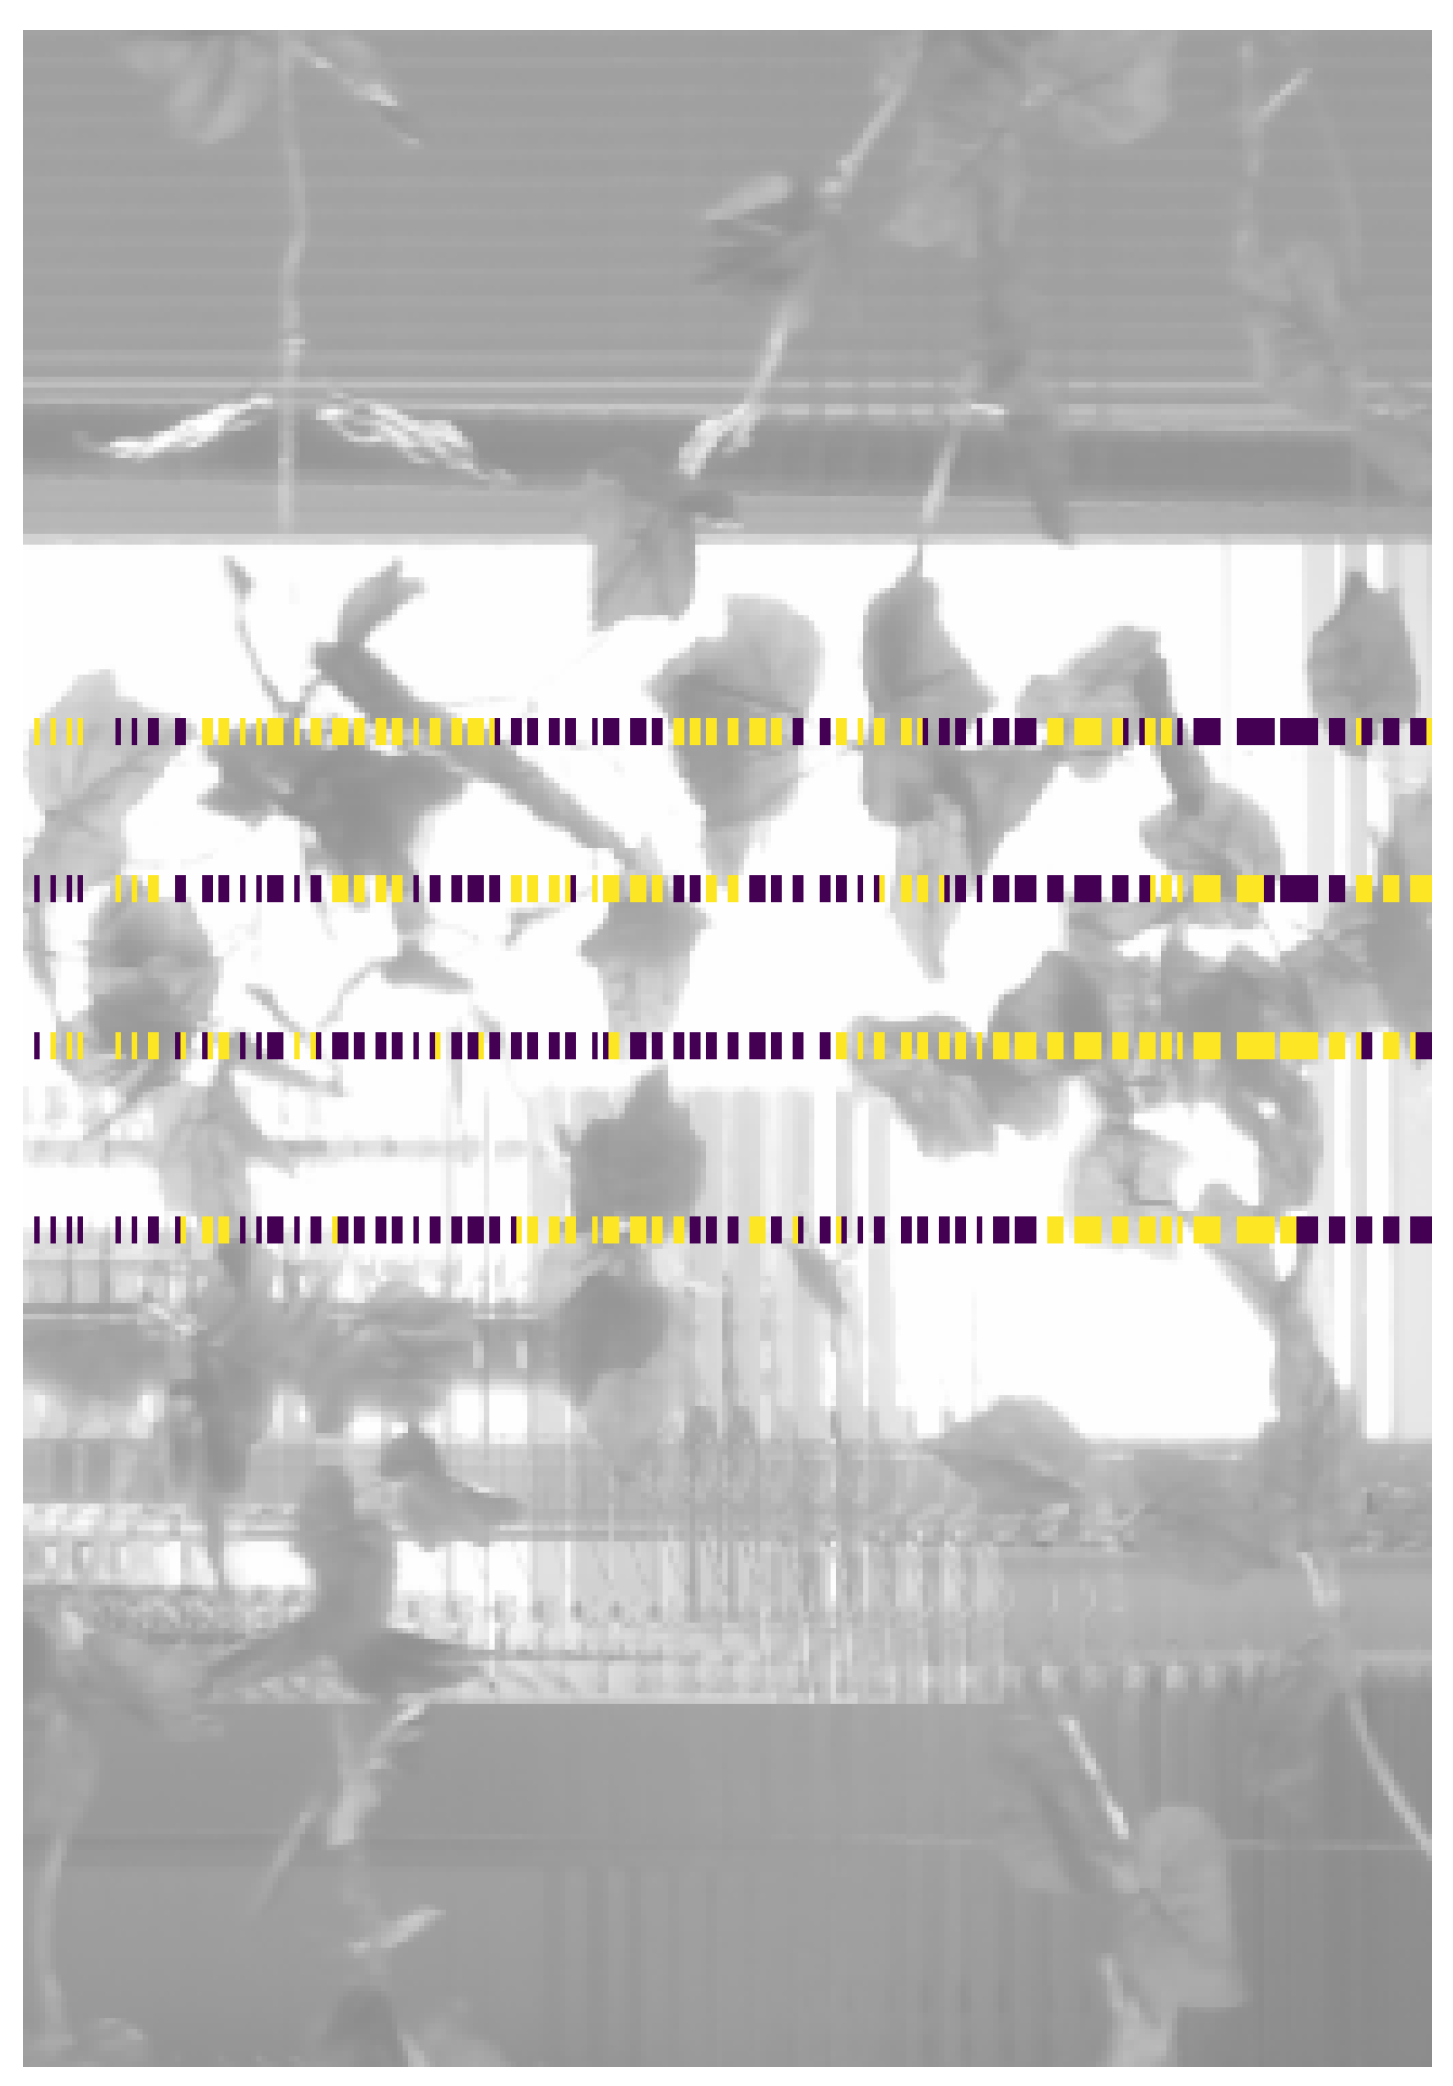
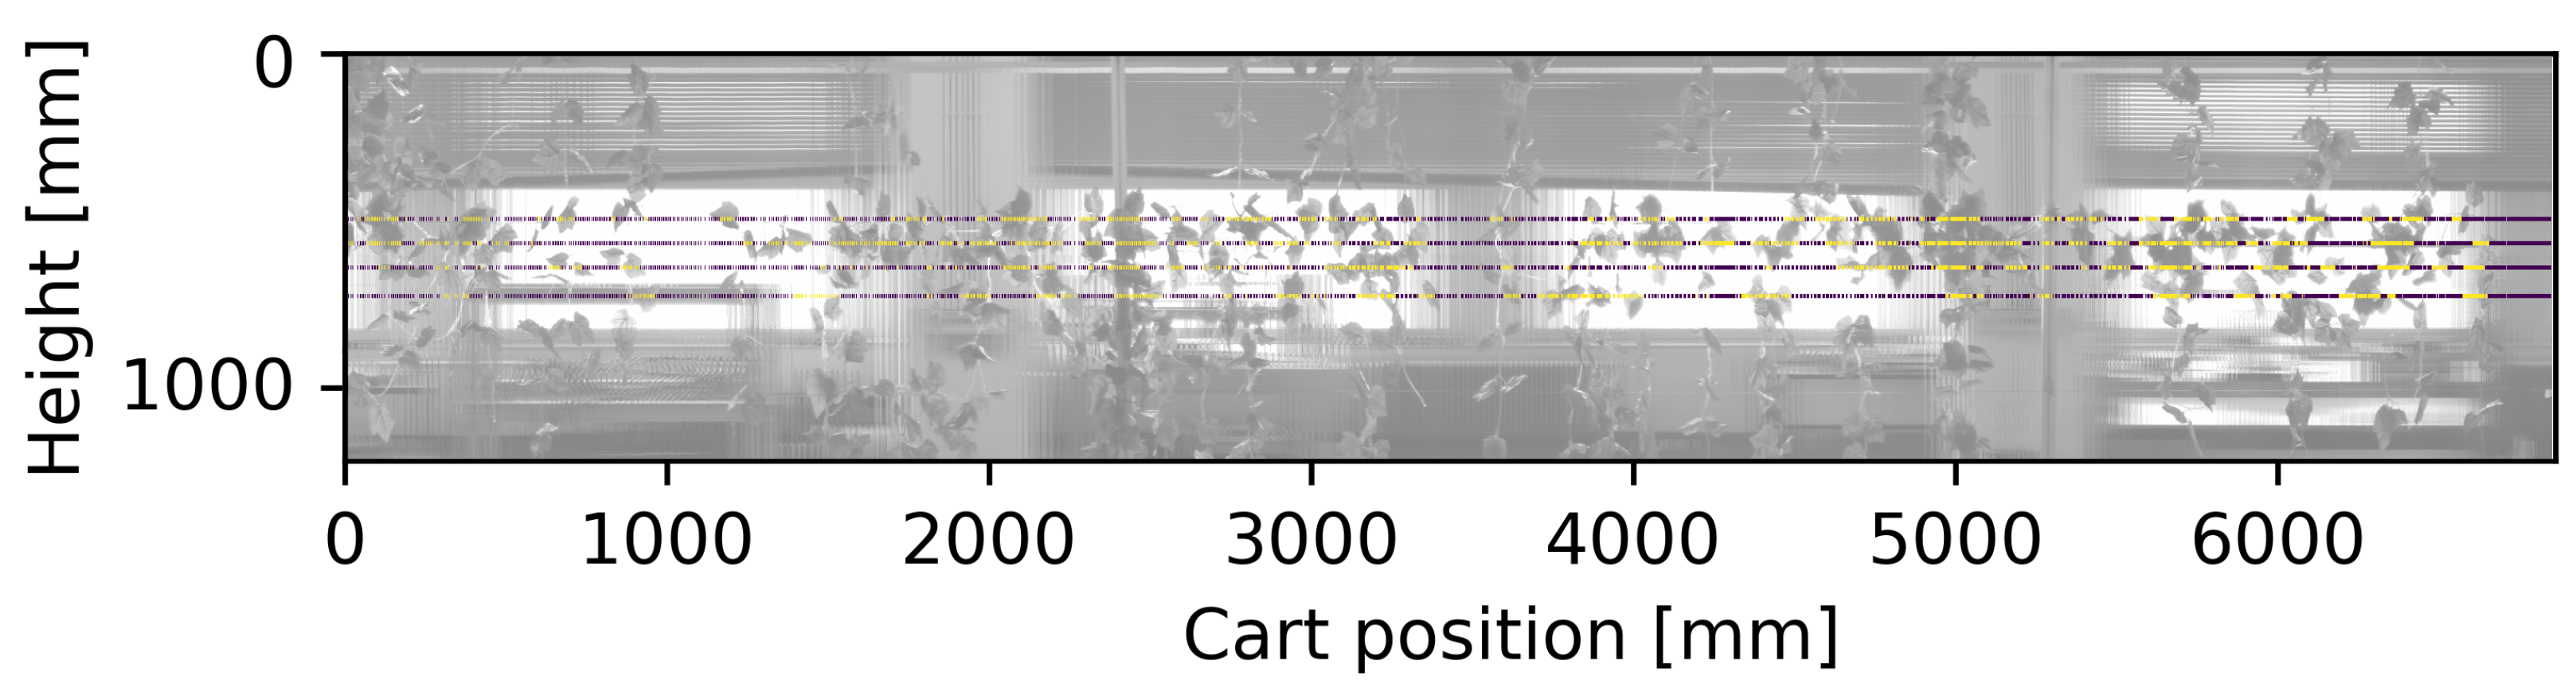
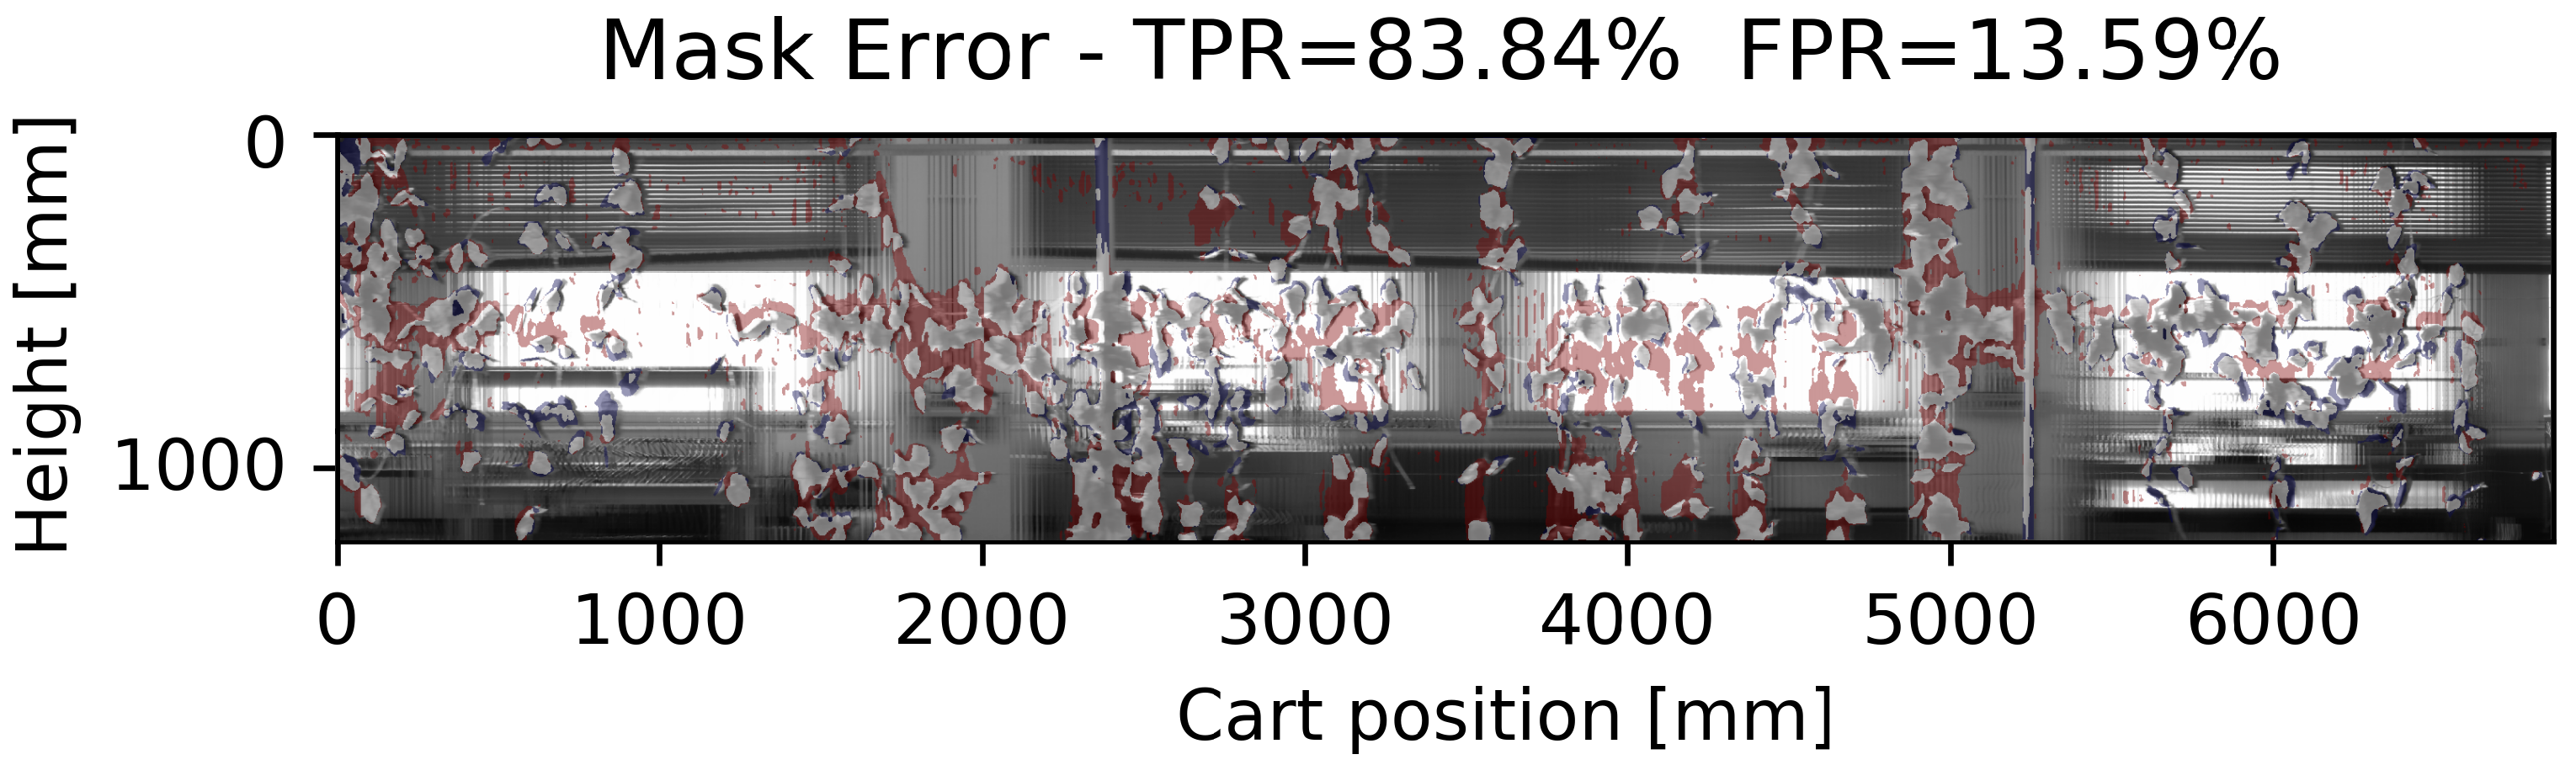
Figure 4 shows the collected data superimposed on a detail of the image of the synthetic vineyard, while
Figure 5 shows the data collected for the entire length of the vineyard.
Numerically, comparing the data shown in
Figure 5 with the ground truth (2), in the best case of 350 lines/m, i.e., sampled at 30 Hz at a speed of 0.1 m/s, we obtain a TPR of 83% with an FPR of 13%. Increasing the speed, for example, to 0.6 m/s, the measurement resolution passes to 60 lines/m bringing the indices to 56% for TPR and 25% for FPR.
The simplicity of realization of an economic system is highlighted, whose vertical measurement resolution is equal to the number of sensors used. With the proposed components and solution, the sampling frequency of the system is a few tens of Hertz: taking into account that each sample describes an area on the vineyard’s wall of a few tens of square centimeters, a continuous description of the wall at a speed over about half a meter per second is not possible. Moreover, in the external environment, sunlight could make these types of sensors unusable and would require infrared sources with levels of irradiation that could be critical for visual safety.
3.3. System Based on LIDAR
As proposed in several of the papers reported in the Introduction, LIDAR can be used to estimate the volume or lateral area of the vineyard wall. With a single device, in this case, it can be installed in the center of the tractor or sprayer, i.e., approximately in the center of the row, it is possible to collect a large number of distance measurements along a vertical plane covering both walls of the row. Depending on its type, the 2D LIDAR can have different angular resolutions and coverage angles, with measurement ranges from some centimeters to a few meters.
The vineyard wall occupies only a part of the planar circular sector covered by the LIDAR. The measurements that refer to the portion of sky or ground are discarded: this involves a considerable waste of time and, as the LIDAR moves while measuring, a non-uniformly spaced sampling. Therefore, it may be useful to choose LIDARs that subtend limited measurement angles or with a high scanning frequency or devices that simultaneously conduct several equally out of phase measurements. These choices involve a higher cost of equipment. In the following laboratory test proposed, a cheap 2D LIDAR (Robotis LDS-01 [
29]) was used that scans at 360°, with a resolution of 1°, at a frequency of 5 Hz. The LIDAR was mounted on the cart so that it scans the vertical plane orthogonal to the vineyard wall and to the ground, thus measuring a vertical band (or line, considering the width of the beam is very small compared to the context) of the vineyard wall. As anticipated, only about a hundred out of 360 readings per revolution subtend the part to be analyzed, resulting in a waste of data and introducing dead times between successive useful scans.
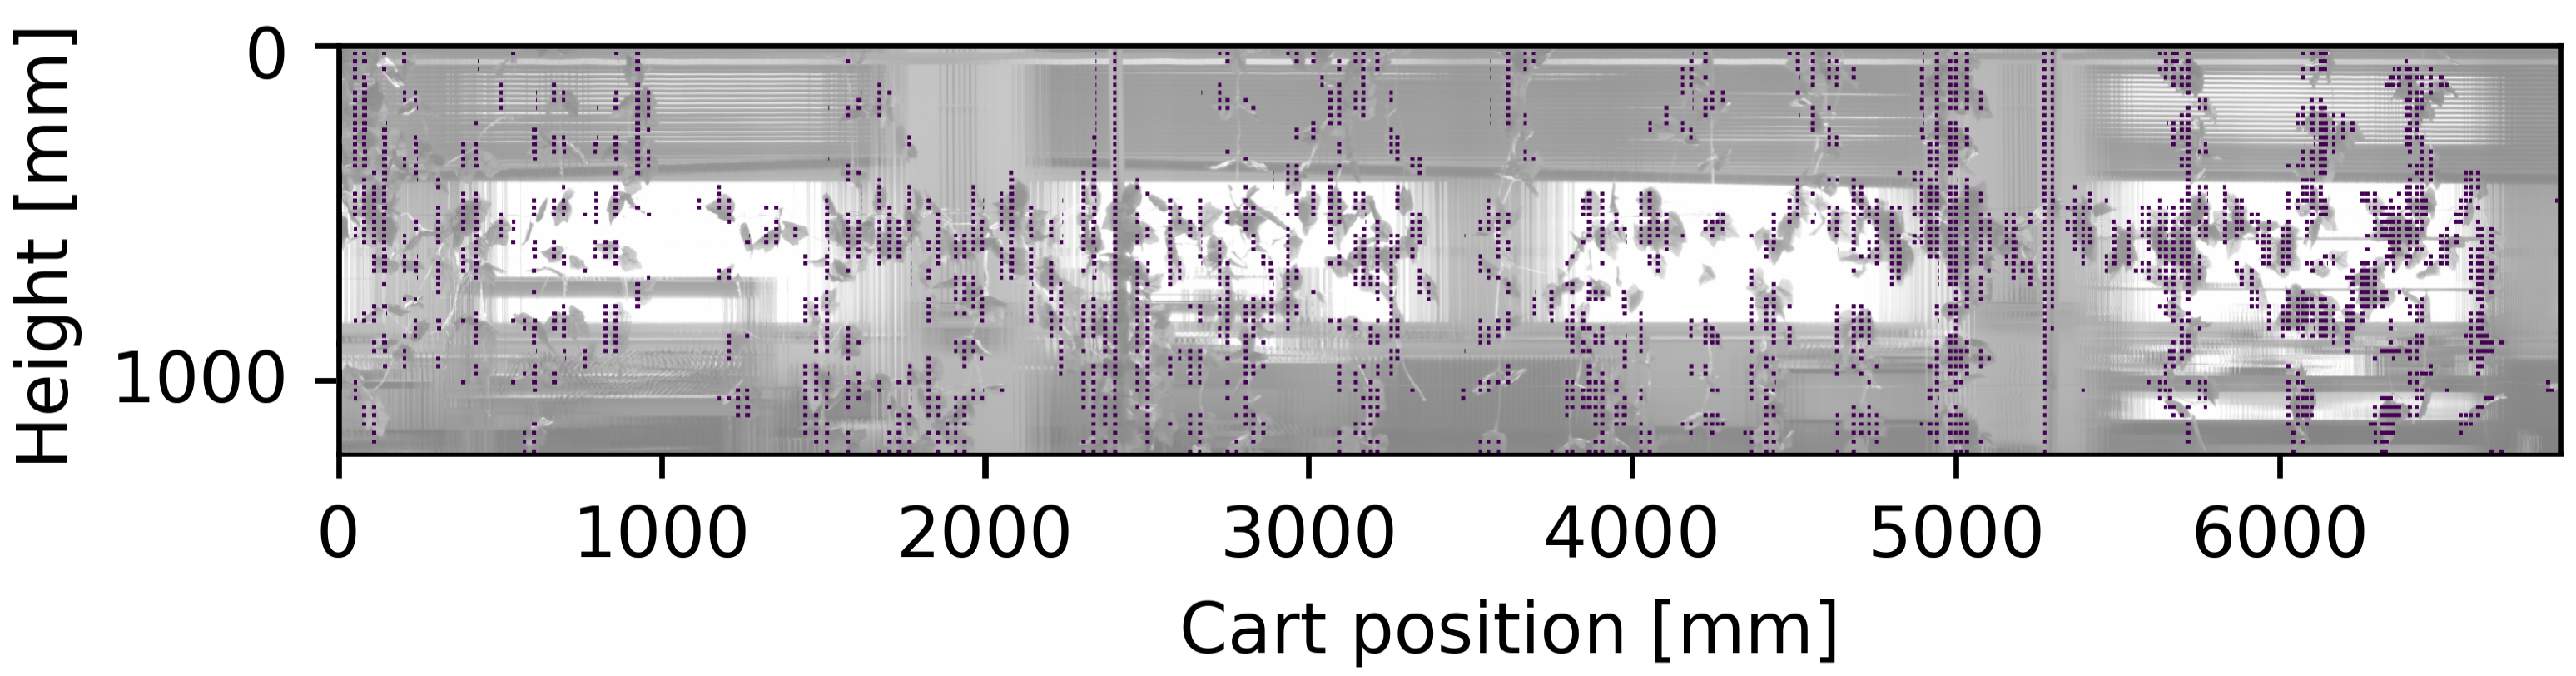
Moving the cart slowly with respect to the scanning time, it was possible to map the vineyard wall shape by accumulating successive distance measures. The rotary scanning combined with the displacement of the LIDAR results in the spatially distributed measurements in a spiral with a pitch proportional to the displacement speed: taking into account that many measurements will be discarded, the vineyard wall is scanned along segments with increasing inclination and spacing as the speed of the cart increases. Through a geometric transformation, the panoramic image is created (
Figure 6, captured at 0.1 m/s), reporting the measured distances and attributing to each measurement the area on the vineyard wall plane of a cone with an aperture equal to the scanning resolution, which is a spot of a few centimeters. Finally, knowing the distance of the LIDAR from the vineyard wall and setting a thickness to it, its profile shape was estimated by binarizing the distance map by placing a double threshold (minimum and maximum distance of leaves from LIDAR) on the read values, as shown in
Figure 7.
In our laboratory tests with the chosen LIDAR it was possible to have a vertical resolution of about 80 samples: the measurements show a TPR of 87% and FPR of 22% with a cart speed of 0.1 m/s, which implies about 50 vertical lines per meter (
Figure 7), and fall to 79% TPR and 29% FPR with a speed of 0.6 m/s, which corresponds to about 8 vertical lines per meter.
Compared to the solution using infrared sensors, the LIDAR has a much lower spatial sampling density, even with the limited speeds at which the model can be tested; on the other hand, the accuracy of the available measures is greater and does not significantly degrade with speed. The proposed solution is simple to install and capable of measuring both sides of a row with a single device. The information is easy to process and it is robust against outdoor light. However, the sampling frequency versus speed is the limiting factor of LIDAR; also, the cost could become high compared to other proposed technologies.
3.4. System Based on RGB-D Camera
Another proposed system based on distance measurement involves the use of an RGB-D camera which acquires two images, one in visible color and one representing the depth map of the scene. In particular, the Intel Realsense D435 [
30] camera was used, which measures the distance through a pair of dedicated monochromatic sensors with the aid of an IR illuminator (stereoscopic technique), combined with a color sensor sensitive only to visible radiation: with it, it is possible to obtain high frame rate and high-resolution pairs of aligned images in the visible and the corresponding representation of the depth. The distance is calculated by stereoscopy through a disparity map method. The camera employs global shutter sensors (so that images acquired in motion do not suffer from artifacts due to circular scanning) with an optimal field of view (FoV) for the specific application.
The depth data that the camera produces is treated in a similar way to what is proposed with LIDAR, or the depth image is binarized by setting a lower and upper threshold for the distances of interest. With this device, there are two advantages: the most important is the possibility of having a continuous mapping of distances even at speeds of a few meters per second or, in the case of low speed, there is a large number of points measured several times in successive frames, whose data can be discarded or averaged; another advantage is the availability of the corresponding aligned color image, which can also be segmented (as reported in the works in the Introduction based on colors [
13,
14,
15], shapes [
12] or using classifiers [
25]) to increase the information available to more precisely recognize only the leaves.
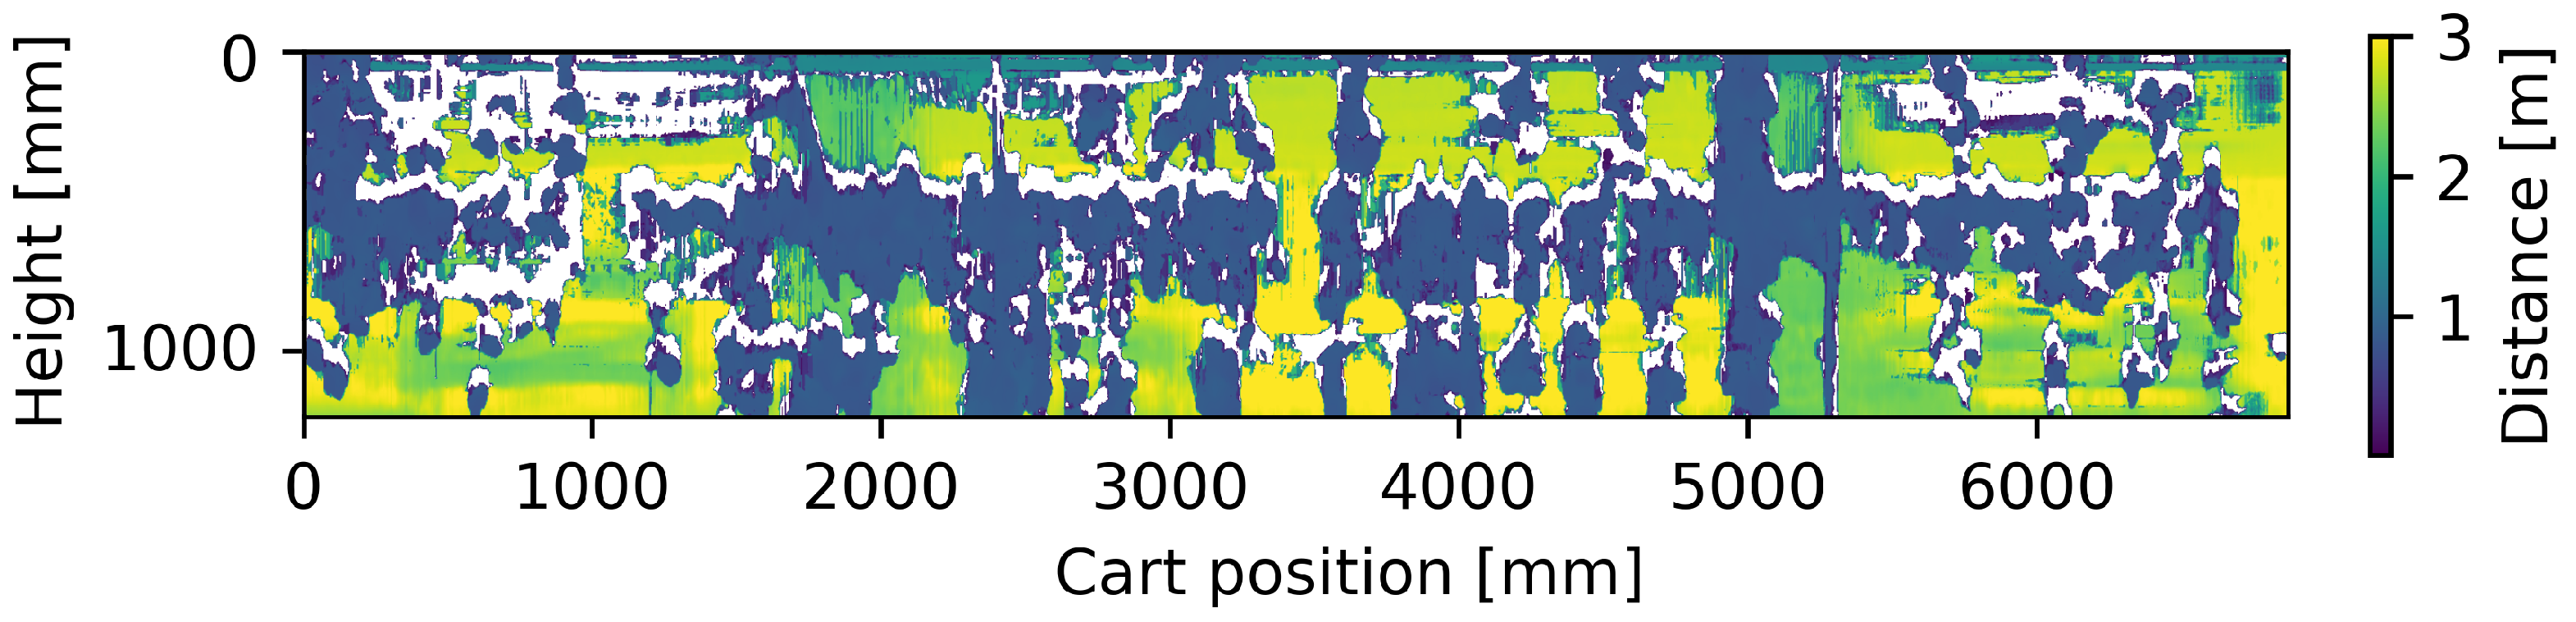
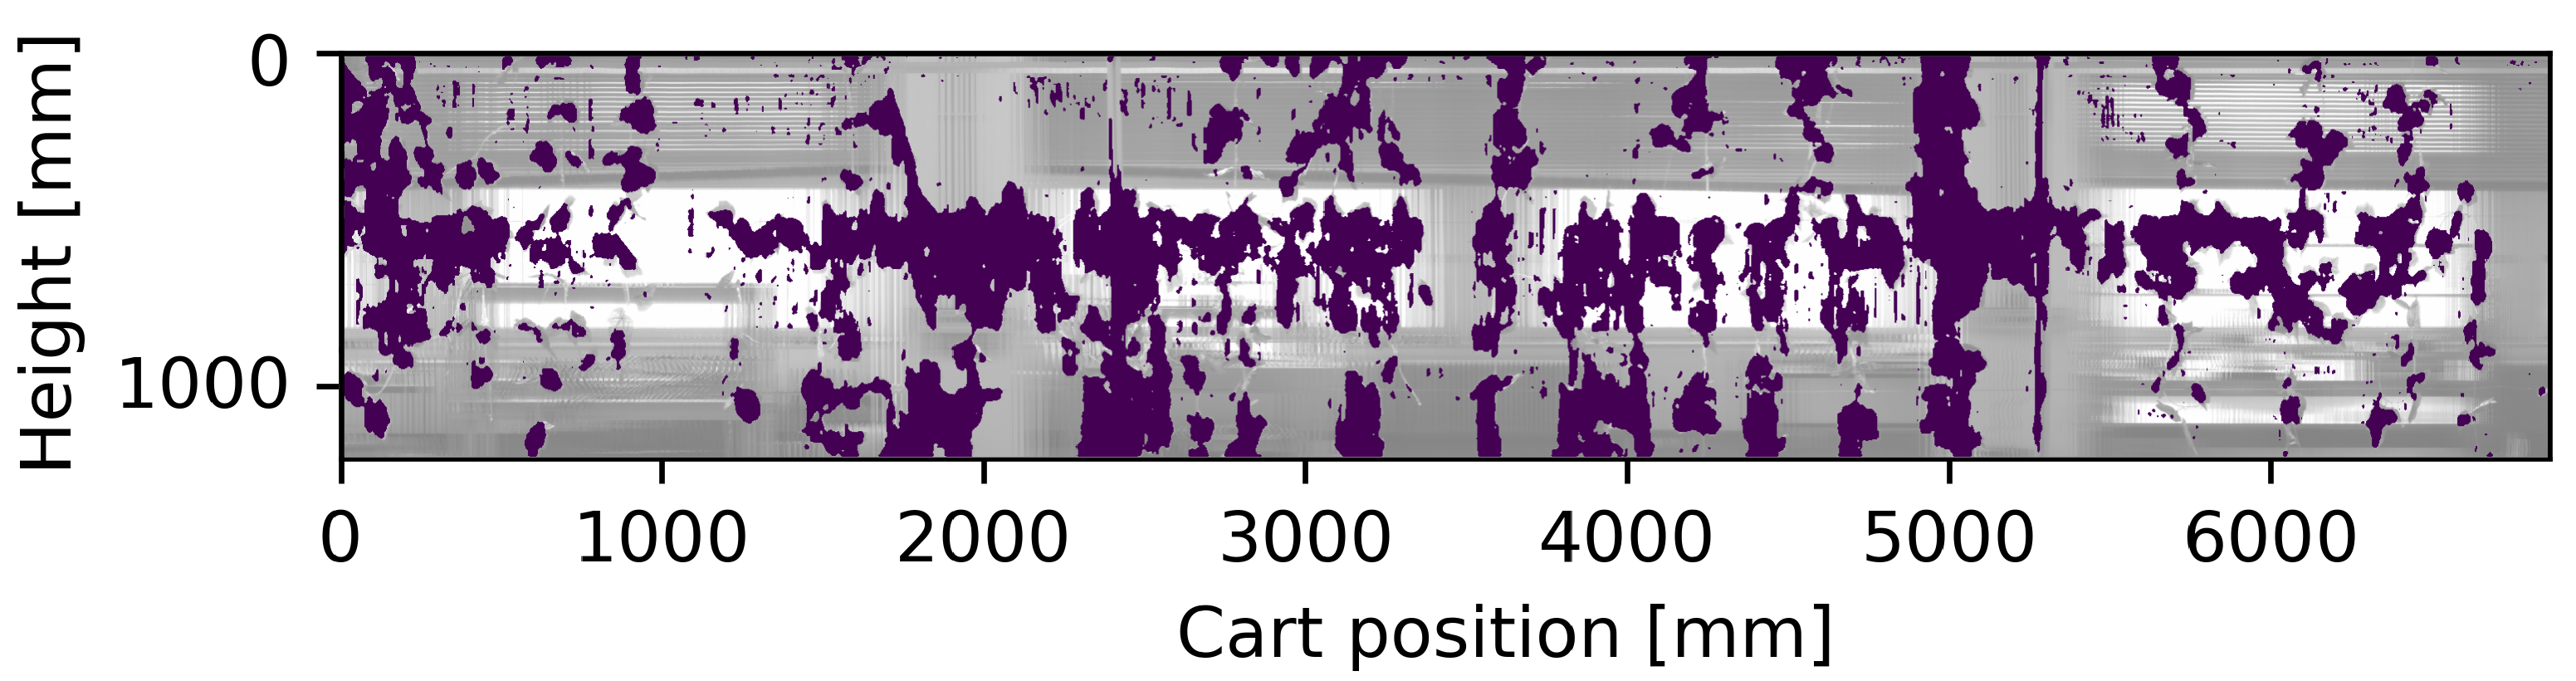
With the same strategy adopted for the ground truth, the depth images were treated in order to generate the panoramic image of the vineyard model (
Figure 8), from which the binary profile of the vineyard was then extracted by applying the double thresholding (
Figure 9).
For the tests carried out, the camera was placed in such a way as to capture the entire height of the vineyard model, resulting in a resolution of the panoramic depth map of about 600 pixels per meter vertically and 400 horizontally. In this case, the map is spatially continuous, and the test results are practically invariant with speed, at least until the frame rate chosen for a given cart speed ensures that adjacent or overlapping vertical portions of the vineyard are captured between consecutive frames. Some areas present undefined values, shown in white in
Figure 8: these measures are all on the same side of the vegetation and are due to the occlusion of the contours for one of the two stereo sensors causing an underestimation of the leaf area. As can be seen in detail in
Figure 10, the measurements report a TPR of 84% and FPR of 14% with respect to the reference ground truth with a cart speed of both 0.1 m/s and 0.6 m/s; moreover, this system ensures a complete mapping of the area to be measured.
The proposed system is compact, easy to install in the middle of the row, provides a mapping of the surface even if the system is still; it is possible to increase the accuracy of the identification of the leaves by also weighing the information from the RGB camera, and it can be used for real-time applications at assumed machine speeds. On the other hand, the solution requires hardware with adequate resources to manage the generated video streams, a certain commercial dependence on the few manufacturers of RGB-D cameras, the need to develop an interface software and, since one device per side of the vineyard row has to be used, the overall cost of the system may become significant.
3.5. System Based on Structure from Linear Motion (SfLM)
The algorithm proposed to estimate the presence or absence of vegetation through a monocular camera takes its cue from a 3-D camera strategy [
24,
25]: in the latter, the estimation distances come from a pair of images acquired simultaneously by two separate cameras placed at a known distance one from the other. The same strategy can, however, also be adopted using a single camera that is translated horizontally and acquires a couple of images in two different positions. The only difference between the two systems lies in the fact that in the first case, the distance between the twin cameras is known a priori, while in the second one, the distance could be not constant and, in any case, it must be estimated through a suitable detection system.
Estimating the distance of an object from the acquisition system requires only the evaluation of its shift in the two different images: the nearer the object, the greater its shift.
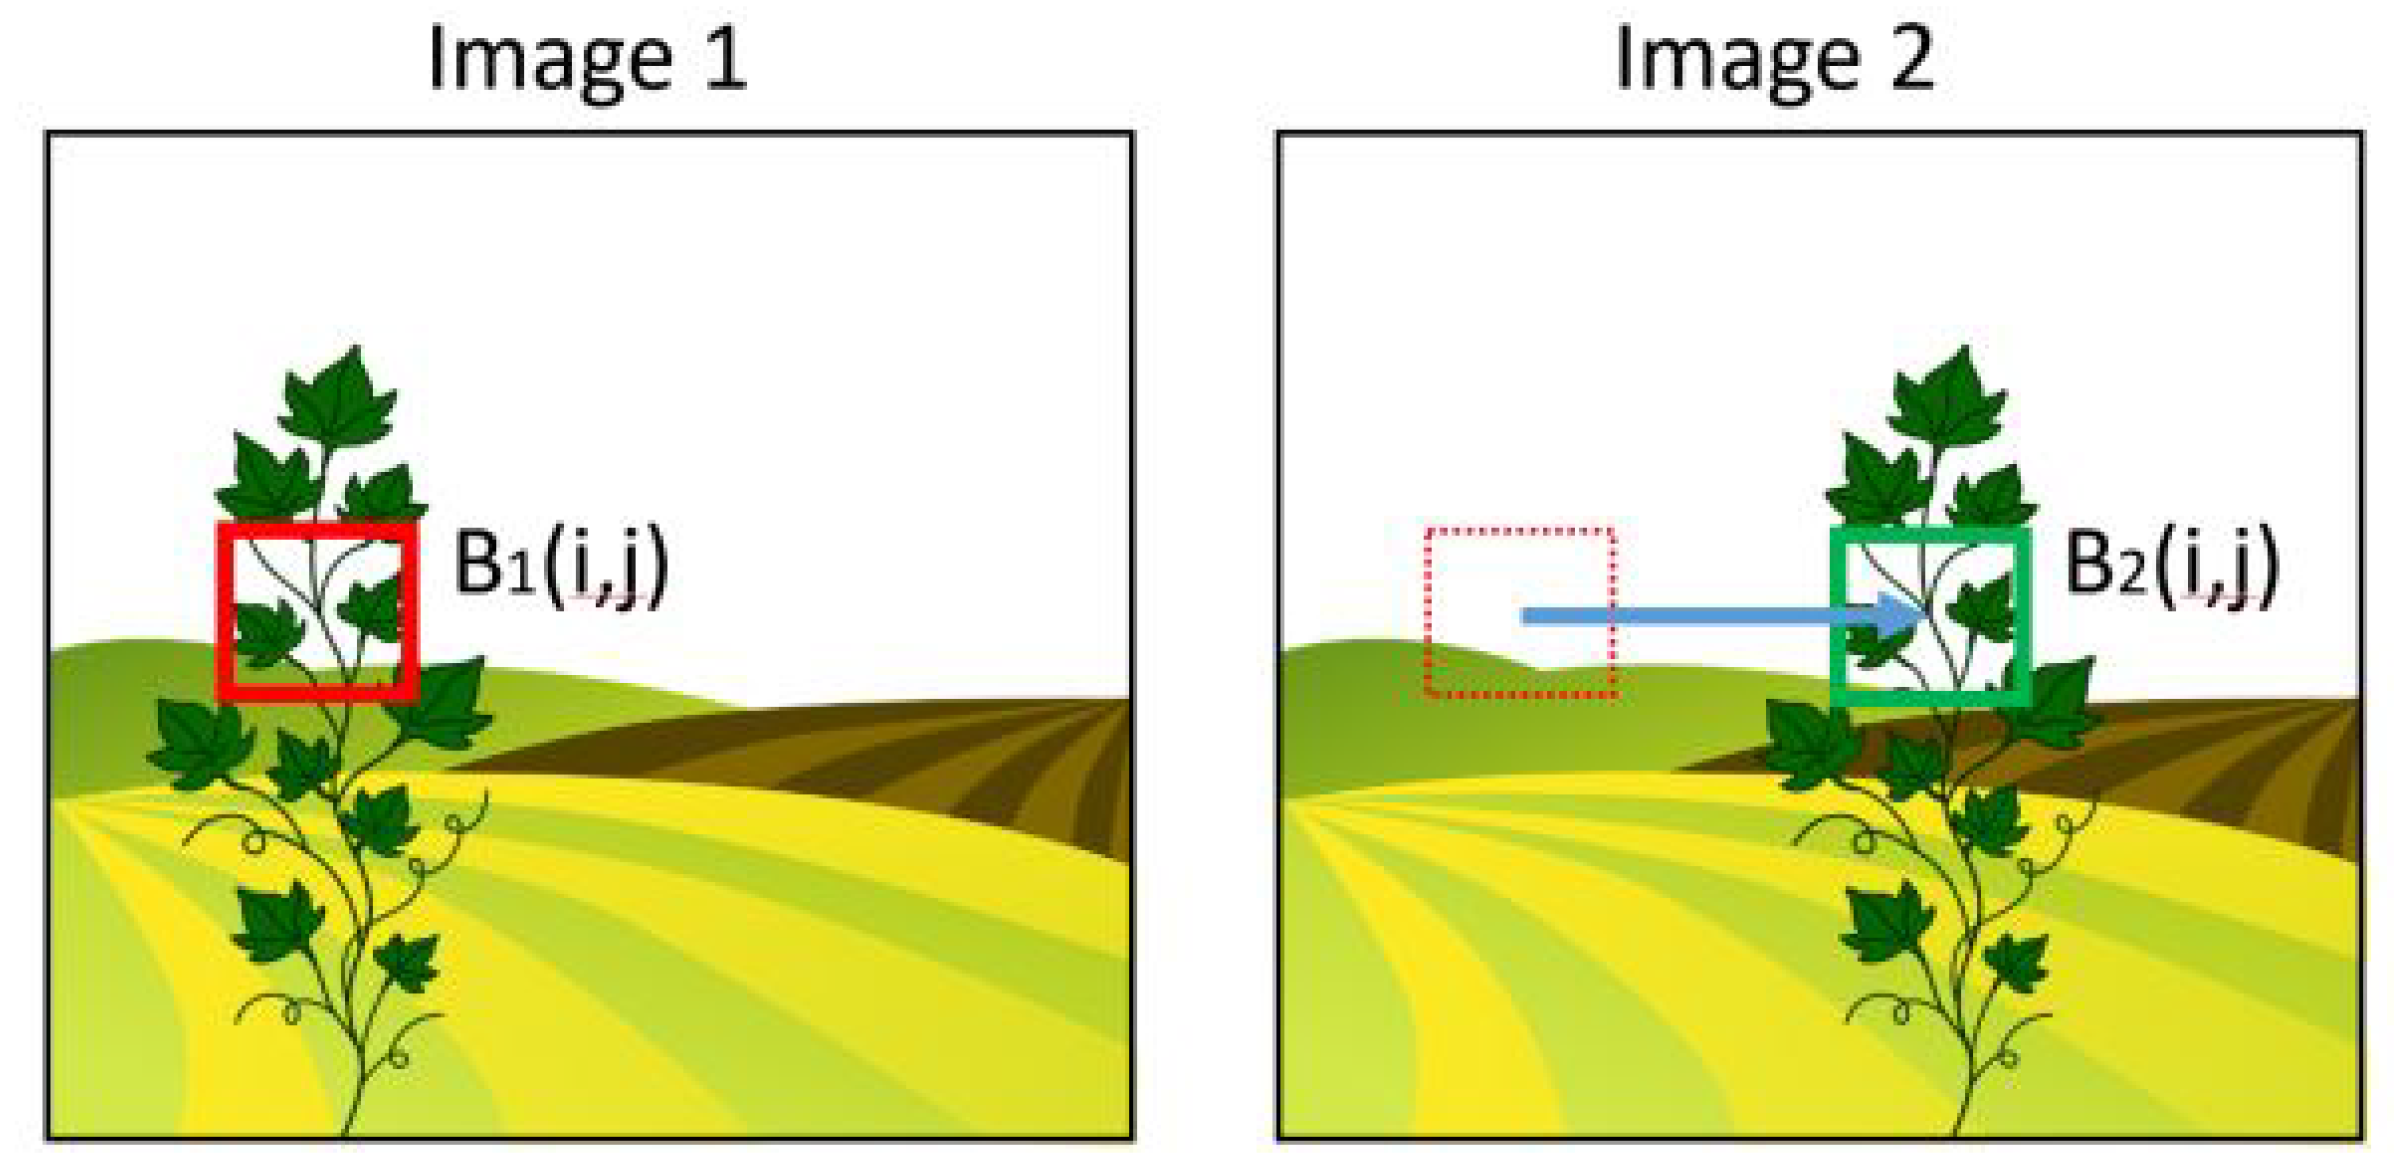
To evaluate an object shift in a pair of images, the most used algorithm usually is block-matching [
31]. This method takes a block of pixels of dimension
located in a certain position on the first image and compares it with similar blocks extracted from the second image in order to find the most similar, as exemplified in
Figure 11. The shift between them will provide the sought for displacement.
This system is very effective but extremely demanding. In fact, it requires the nesting of several different loops: assuming that the similarity between the blocks is evaluated through the MAE (mean absolute error), it is necessary to cycle among all the pixels composing the block, then the operation must be repeated for all the possible displacements and eventually it must be looped for all the blocks of interest.
However, the specificity of the case in which we operate provides many constraints that can lead to great simplifications useful to speed up the operation:
First of all, as a first approximation, the two images are shifted only horizontally (and in a known direction); thus it is possible to limit the search exclusively considering movements in the horizontal forward direction.
Furthermore, since we just want to evaluate the presence or absence of vegetation elements placed at a barely known distance, we could limit the search to shifts within an expected range.
The points to analyze can also obviously be limited only to a part of the image: the pixels we analyze are located only in a vertical central band of the image corresponding to the area covered by the sprinklers and are organized in a regular grid with a given pitch.
Moreover, as a further simplification, partially related to the fact that the shift to estimate is approximately horizontal, we suggest using, instead of the
between 2D blocks, its approximation in
limited to estimate just a horizontal shift by converting the previously input blocks into 1D signals. This signal is a sort of projection of the 2D data on its abscissa obtained just by averaging all the pixels along the columns and evaluating the horizontal displacement (see
Figure 12).
In such a way, the number of nesting loops were considerably reduced, and, consequently, the computational effort is limited too.
From the shift estimation and knowing the characteristics of the lens, the time acquisition difference between the two frames and the speed of the agricultural vehicle, it is possible to estimate the distance of the framed subjects from the camera.
Moreover, to limit the noise, post-processing using a median filter is very useful for removing the disturbing elements. The distance values obtained through this procedure, compared with two parameters that set the minimum and the maximum possible distance of the target, provide a binary map that highlights the presence or absence of vegetation in the established distance range.
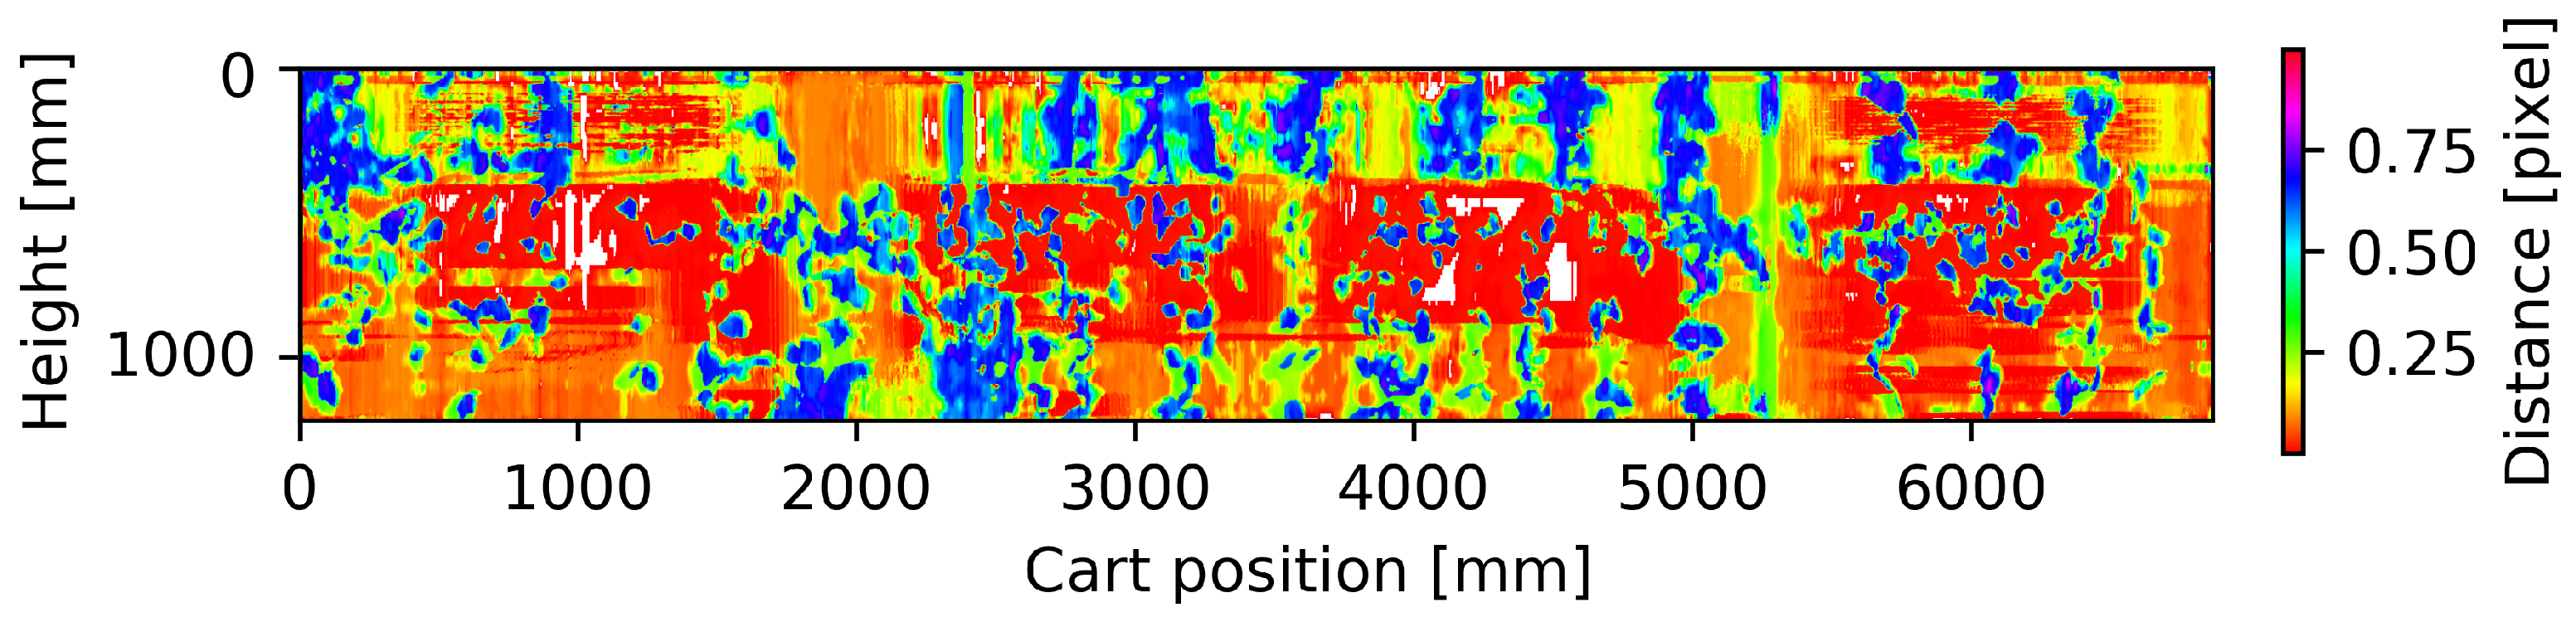
The estimated distances, organized in a panoramic photo and its corresponding binary map that will be adopted by the dispensers to control sprinkler activation are shown in
Figure 13 and
Figure 14.
In our case, the choices we made were the following: the images considered in our tests were of 480 × 640 pixels arranged in a portrait format. Each image is divided into horizontal bands of 16-pixel height on which the projections are calculated. To improve the resolution, these bands are overlapped with a stride of 4 pixels. The matching is performed on vectors 16 samples long overlapped with a stride of 4 pixels. The points of interest are limited only to the pixels belonging to a central area of the image 200 pixels wide.
Similar to the use of the RGB-D camera, the depth map is spatially continuous, at least until the frame rate chosen for a given cart speed, ensures that 30–40% of vertical overlapping portions of the vineyard are captured between consecutive frames. The measurements report a TPR of 83% and FPR of 19% with respect to the reference ground-truth, with a cart speed of both 0.1 m/s and 0.6 m/s and a map resolution of 160 samples vertical and approximately 100 samples per meter in horizontal; moreover, this system ensures a complete mapping of the area to be measured. Note that these results are comparable to what was obtained with the RGB-D camera, albeit with a lower mapping resolution.
The proposed system has several advantages: it is compact, easy to install in the middle of the row, and provides a mapping of the surface only when the system moves, and the resolution of the depth map depends both on the acquired resolution and on the parameters chosen for the matching algorithm, it is possible to increase the accuracy of the identification of the leaves by also weighing the information from the color channel (if not using a monochrome camera) and, with adequate hardware, it can be used for real-time applications at assumed machine speeds. In the future, the algorithm can also be evaluated on images acquired in other optical bands, such as in the near-infrared, in order to also obtain information on the health of the plant: this data combined with the depth map would allow an even more precise or variable dosage. On the other hand, the solution requires hardware with adequate resources to manage the generated video streams, writing the code or hardware implementation of the proposed algorithm, using one device per side of the vineyard row and probably a medium–high-range camera.
4. Results and Discussion
The proposed methods were evaluated on a static vineyard model, with an area (1.5 m high and 7 m long), which is, in general, sufficient to allow detection and management of variability in typical field conditions. The vine setting was realized in a controlled environment in order to allow the development of the described systems and conduction of comparative measurements on the same reference: in this way, all natural variations of contours were minimized. As explained in the previous paragraphs, for each proposed method, a panoramic image was generated with the collected measurements, defining their size and aligning them spatially to the image taken as reference. Then, each image was binarized by applying criteria suited to the proposed measurement system in order to identify the areas in which the leaves are estimated on the vineyard wall. Finally, each binary map has been compared, with Boolean operators, with the reference, the ground truth, having classified the areas correctly recognized as true-positive (TP) where there are leaves and as true-negative (TN) where they are absent, classifying the errors as false-positive (FP) where the leaves are absent but are identified or false-negatives (FN) where the leaves are there but are not identified. Having counted in this way, the errors and the correct recognition of the leaves, the indices of the true-positive rate (TPR), the false-positive rate (FPR) and the accuracy were calculated in order to numerically compare the proposed systems at two different cart speeds.
Table 1 shows the measured indices characterizing the systems performed on the model in the laboratory with the cart moving at 0.1 and 0.6 m/s. Repeated measurements at different times have brought comparable results, with differences within one percentage point. Uncertainties can be attributed to the slack of the manual handling of the cart.
The resolution with which the maps have been defined is about 1 cm per pixel. A non-quantifiable part of the errors reported could be due to an alignment error during the construction of the panoramic map or an erroneous assignment of the size of the measured area. In any case, the resolution with which these tests were proposed is appropriate to estimate the lateral area (LAI) and certainly excessive for the final purpose of the system, since considering a real operating situation of the sprayer, a nozzle has a coverage of a few decimetres. As we discuss in the next chapter, the resolution required of the system is much lower than what is proposed, from which either a wider zonal measurement is carried out, or the measurements of a region can be suitably combined.
Observing the results of the measurements at the lowest cart speed, the greatest accuracy in estimating the lateral area is achieved by the infrared barrier system, albeit evaluated with a small number of sensors and the stereoscopic system. However, as already anticipated, both the IR barrier and the LIDAR systems have a limited resolution and frequency of measurement. This implies large unmeasured areas that increase with the dragging speed: for this reason, we consider these systems unsuitable for use on a sprayer, at least with the proposed technology. From an economic point of view, the IR barrier solution could be more advantageous, but, on the other hand, from the mechanical point of view, all the other proposed systems are simpler to install because they require a single sensor with reduced dimensions.
Imaging-based solutions, on the other hand, allow a uniform mapping of the framed field with continuity even as the speed increases: in the tests proposed at the two speeds, the results are numerically almost identical. To ensure continuous mapping as the cart speed varies, in the stereoscopic system, it is sufficient that the frame rate adopted allows the acquiring of successive images at most with only one edge in common, while the structure from linear motion (SfLM) system needs images with a large overlap area. The latter solution requires, for the same FoV and speed, a higher frame rate. However, these systems produce a greater data flow and, therefore, require greater hardware resources; the SfLM system also requires adequate computing resources for real-time distance estimation. From the results of the proposed tests, it is highlighted that the SfLM system has comparable performance indices of the stereoscopic system even if its mapping of the distances has a lower resolution. Finally, it should be remembered that the vision systems proposed also provide color information, which can be used for better discrimination of the regions of interest.
In our opinion, the SfLM solution offers more degrees of freedom because it is not linked to specific hardware (it is possible to use any camera and any programmable device for processing information) and it is possible to select the parameters of the matching algorithm, for example, choosing the size, shape and spacing of the blocks to be analyzed according to the objects to be recognized. By adapting the hardware to work at higher frame rates, the SfLM system can operate at any speed or distance from the profile to be segmented. It is, therefore, possible to adapt the proposed system to application contexts other than the vineyard case study, such as orchards or greenhouse crops, agriculture or warehouse shelving or drone mapping; each application context will have its own operational constraints that will lead to different code solutions.
4.1. Proposed Control System Based on SfLM: Analysis on Video Sequences
Due to the peculiarities described above, it was decided to develop a prototype control system based on the SfLM algorithm. Video sequences were acquired in the real working conditions and environment of the controller in order to simulate the input video stream to evaluate and tune the proposed algorithm.
The test sequences were captured with a digital single-lens reflex (DSLR) mounted on a tractor that runs through a row of vineyards at a constant speed with a focal length such as to fully capture the height of the vineyard wall; given the absence of particular constraints, it was appropriate that the DSLR shot the row perpendicularly at a distance of about 1.5 m. More sequences were acquired at speeds between 4 and 12 km/h and at different vegetative stages, i.e., April, May and June, to evaluate the robustness of the algorithm at various stages of vegetation. All sequences were recorded in full-HD resolution at 50 fps, so by their decimation, it is possible to obtain movies with lower resolution and/or with a lower frame rate in order to evaluate the necessary amount of input information.
The output of the control system consists of a number of digital signals, which control the opening or closing of vertically arranged nozzles; the proposed control strategy consists of determining in the framed field the area subtended by each sprayer and opening its flow when the area occupied by the foliar vegetation exceeds a user-defined threshold, expressed for simplicity as a percentage. This percentage value depends on the vegetative state: it will be in the order of a dozen when the leaves start to appear and will grow when the leaves are completely formed.
The identification of the area subtended by the leaves passes from segmentation based on the distance of the depth map processed by the SfLM algorithm. Given the distance of the camera from the vineyard, considered constant during work, it is possible to choose the segmentation distance thresholds by defining the average thickness of the leaf wall. For a better segmentation of the leaf part only, it is possible to apply a second masking based on the green color. Therefore, having binarized the depth map obtained from the pairs of consecutive frames, the area occupied by the vegetation is calculated as the ratio between valid pixels with respect to the total pixels subtended by the nozzle: if this value exceeds the threshold defined by the user, the corresponding nozzle will be activated. As the camera and nozzles will be spaced apart, an appropriate system of temporal alignment between the data and activations must be provided according to the speed of the tractor.
The proposed SfLM algorithm needs two frames with an overlap. Since the operations of estimating the depth map and calculating the corresponding outputs take place cyclically, it was considered appropriate to synchronize the system outputs with the acquisition frame rate and limit the calculation of the depth map to a single vertical band of the acquired frame in order to avoid calculating redundant data. With this last simplification, the required common area between the two frames can be very limited: by reducing the area of interest on which the depth map is calculated, it is possible to work at a higher speed of movement with the same frame rate or at lower frame rates if speed is fixed. Setting the size of the nozzle jet on the wall, with geometric considerations with respect to the field framed by the camera, the width of the depth map is quantified. This band defines the minimum common area between successive frames, allowing calculation of the minimum frame rate as a function of the maximum speed of movement expected.
The proposed control system was described with a high-level language and evaluated on a desktop PC, simulating the input stream with the video sequences collected in the vineyard. The optimization of the parameters of the control algorithm took place in a qualitative way by superimposing on the videos an animation with the calculated depth map, with the foliar profile identified or by highlighting the areas that would be sprayed until the desired result was obtained.
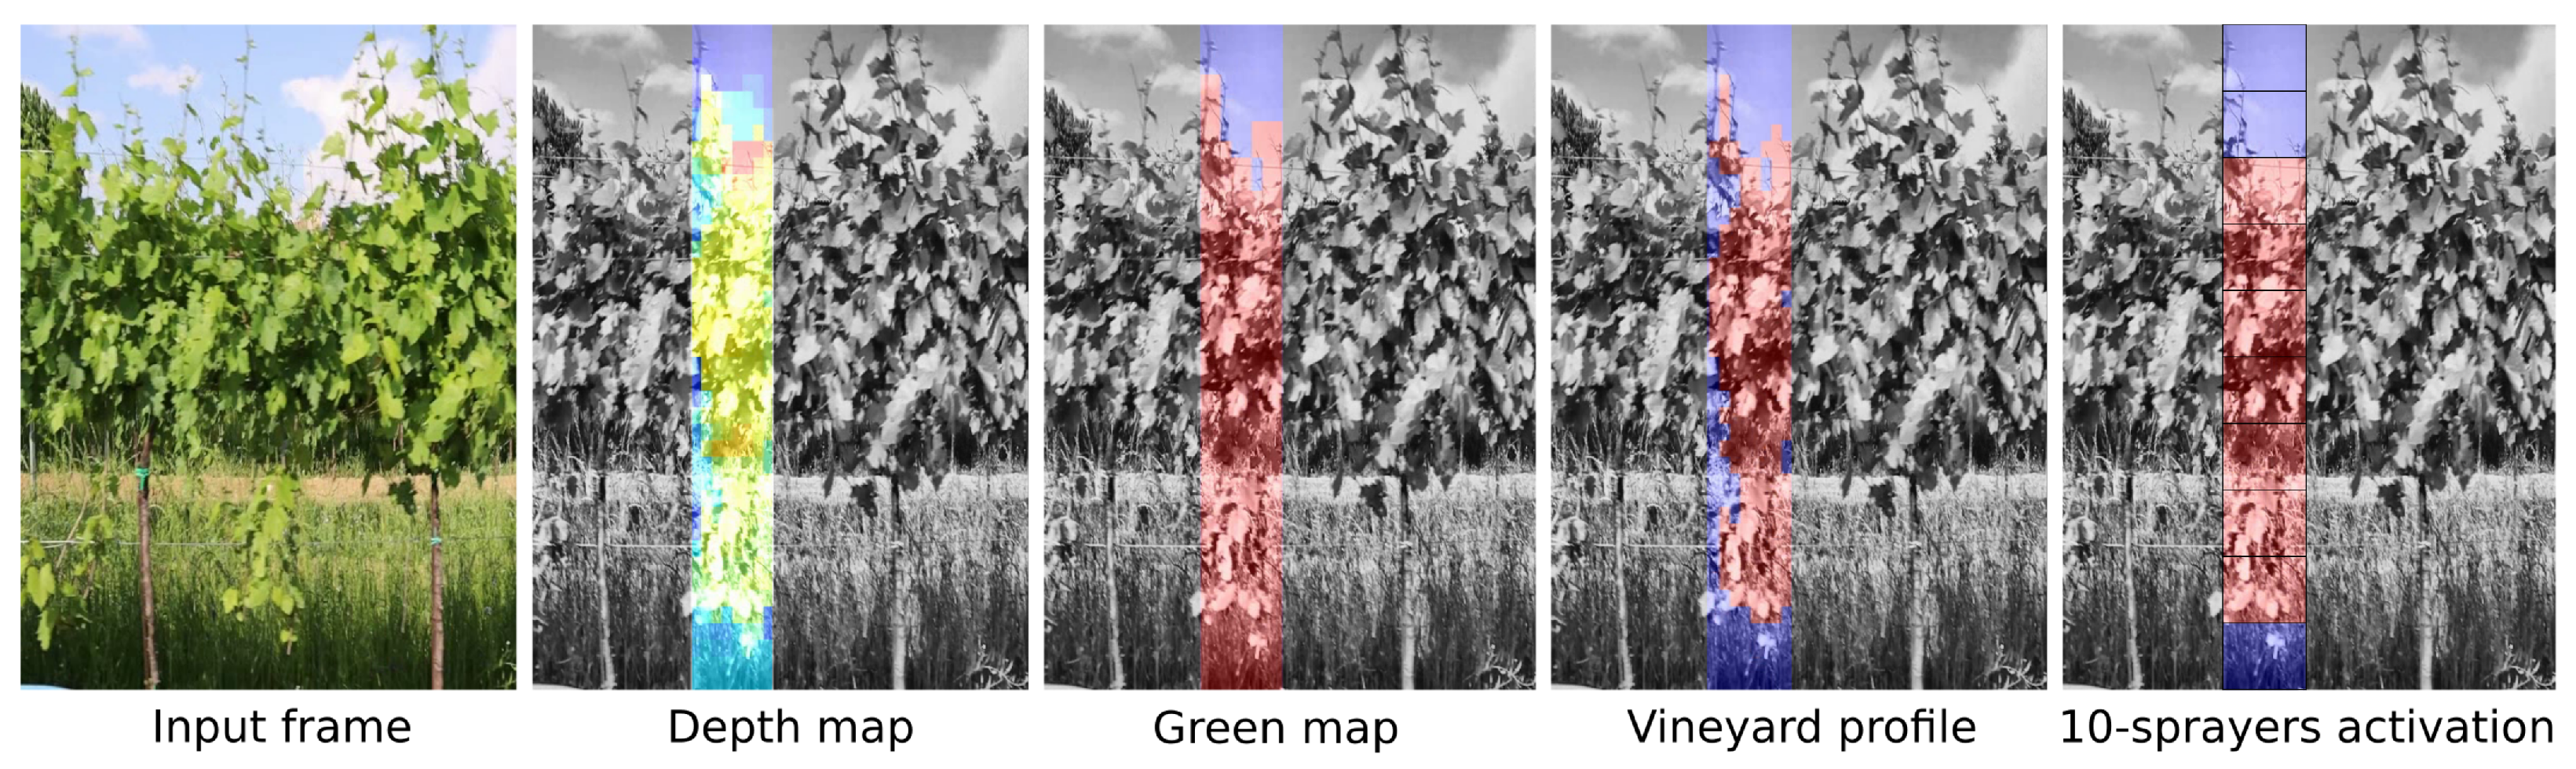
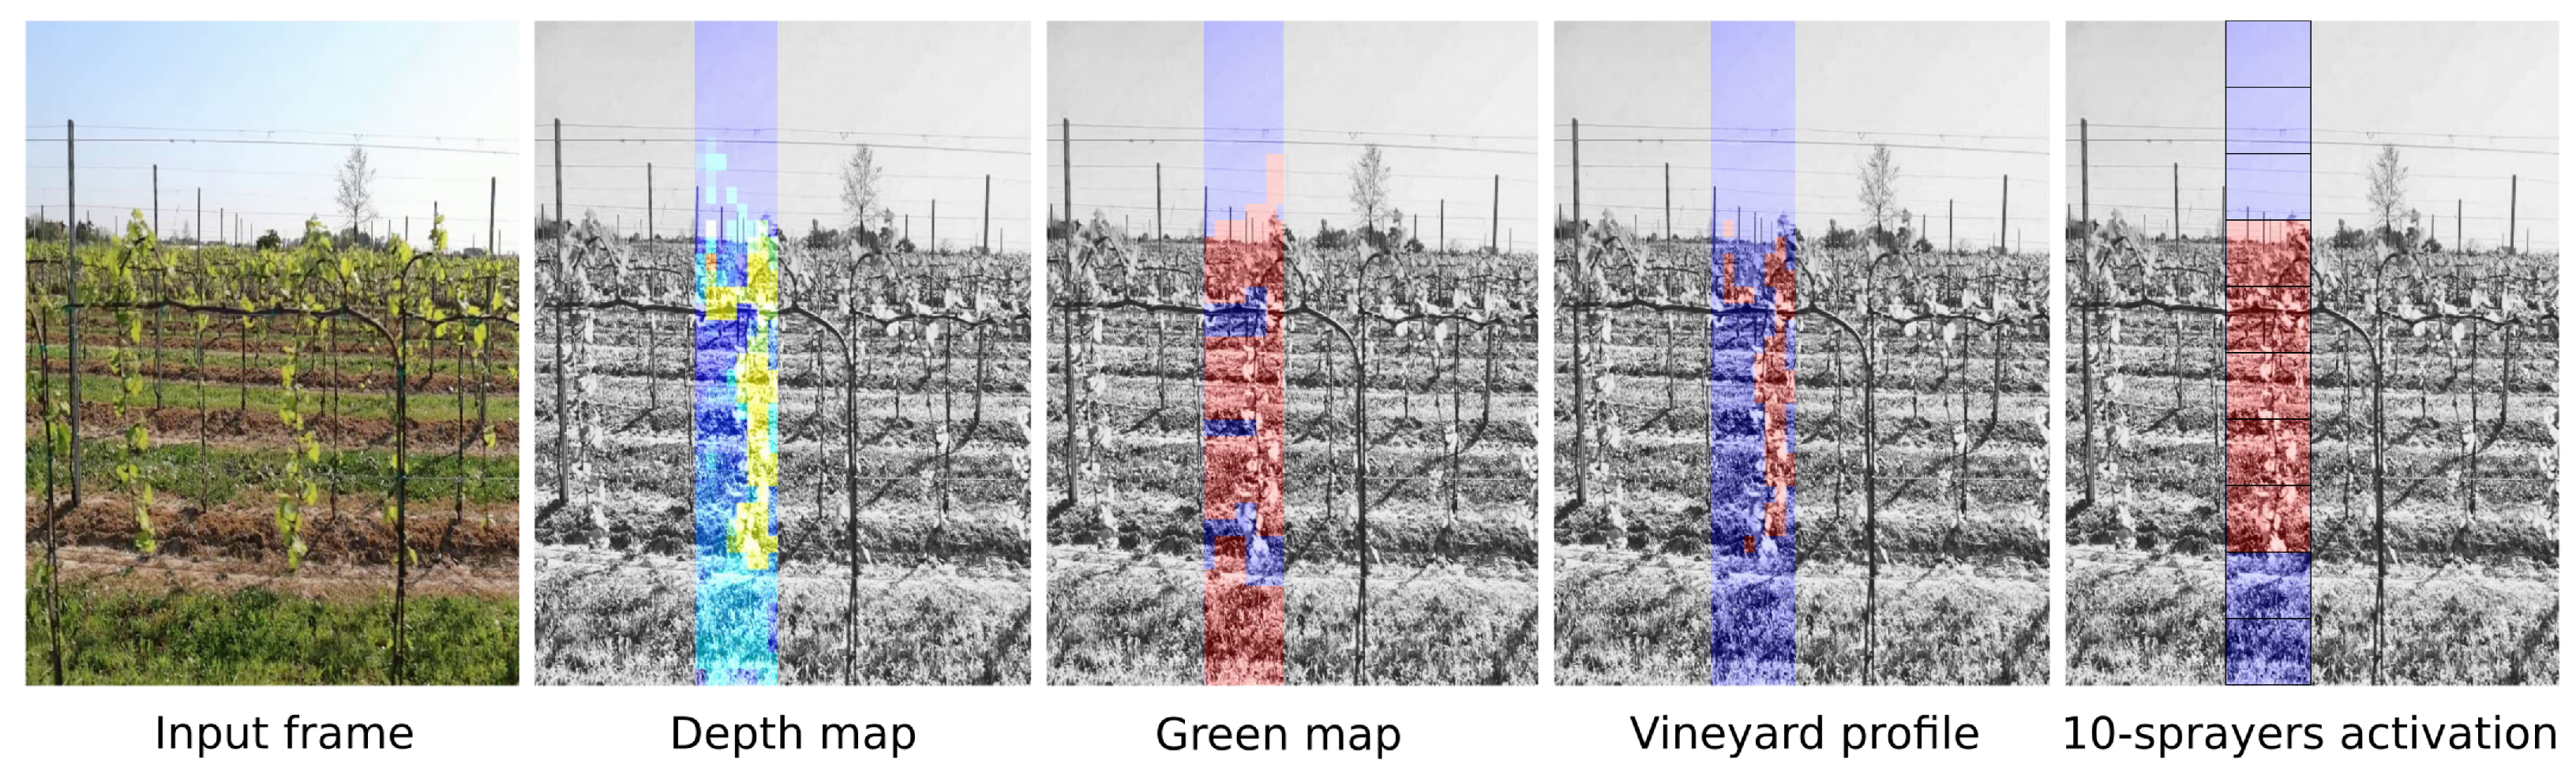
Figure 15 and
Figure 16 show two sample frames of the collected videos, one acquired in mid-April and one in June; next to them are represented, superimposed in transparency, the intermediate maps calculated with the simplified algorithm proposed for the prototype: depth map followed by binary maps of green areas, of the estimated vineyard profile and the areas to be treated.
To operate up to 3 m/s and to control up to ten equally spaced nozzles along the height of the wall to be treated, a video stream having a resolution of 640 × 480 pixel at 15 fps with block matching on 20 × 20 pixel blocks spaced on a 10-pixel pitch grid proved to be adequate. The optimal functioning of the system occurs a few weeks after the buds hatch when the leaves become several centimeters in diameter. Recognizing only the buds, for the very first vegetative phase, requires the use of higher video resolutions with a consequent increase in the computational load.
Since the aspect ratio of the video stream provides redundant information in the longitudinal axis and the area covered by the sprayers is limited, the analysis is carried out on a single vertical band, with the advantage of limiting the computational load: from geometric considerations, an appropriate width of this strip is chosen in order to guarantee a continuous mapping of the vineyard even at the maximum predetermined speed, and that is of a consistent width with respect to the spray coverage.
4.2. Proposed Measures
In the comparative study of LWA measurement methods carried out in the laboratory, the ability of the vision system to correctly identify the shape of the profile was highlighted and measured. The LWA was strongly quantified in order to control the few nozzles that dose the product, often controlled with a conservative approach from the point of view of the treatment, i.e., we want to ensure the spray for the underlying LWA of the nozzle up to 20%. The system aims at ensuring adequate treatment combined with product savings in open areas. Traditional spraying systems without dosage control spray the product continuously during work, so to estimate the product savings achievable with our control system, the integration of the activations over time is proposed.
The measurement of the opening times is carried out when the system is in motion or is operating: at the end of the work, the opening time of each nozzle is normalized with respect to the total working time, thus obtaining statistics of the operation of each nozzle. Compared to a traditional machine where the operation rate is 100%, as it sprays continuously, it is easy to estimate the expected savings, both globally and for each nozzle. A fluid-dynamic study of the control system has not been dealt with presently: even considering the system losses and the transient behavior of the jet, we expect the time intervals provided by our system for the activation of the valves to provide a reliable prediction of the achieved phytosanitary product savings.
With an adequate time interval on which to conduct the statistics, the overall savings value can be used, for example, as an indicator of the return on investment per season, while the statistics for each nozzle provide clear information on the areas that did not require treatment and, therefore, unnecessary product dispersion was avoided. In order to characterize the efficiency of different possible configurations of the system, it is possible with the proposed measure to compare the savings obtainable on the same vineyard by varying the number of nozzles used.
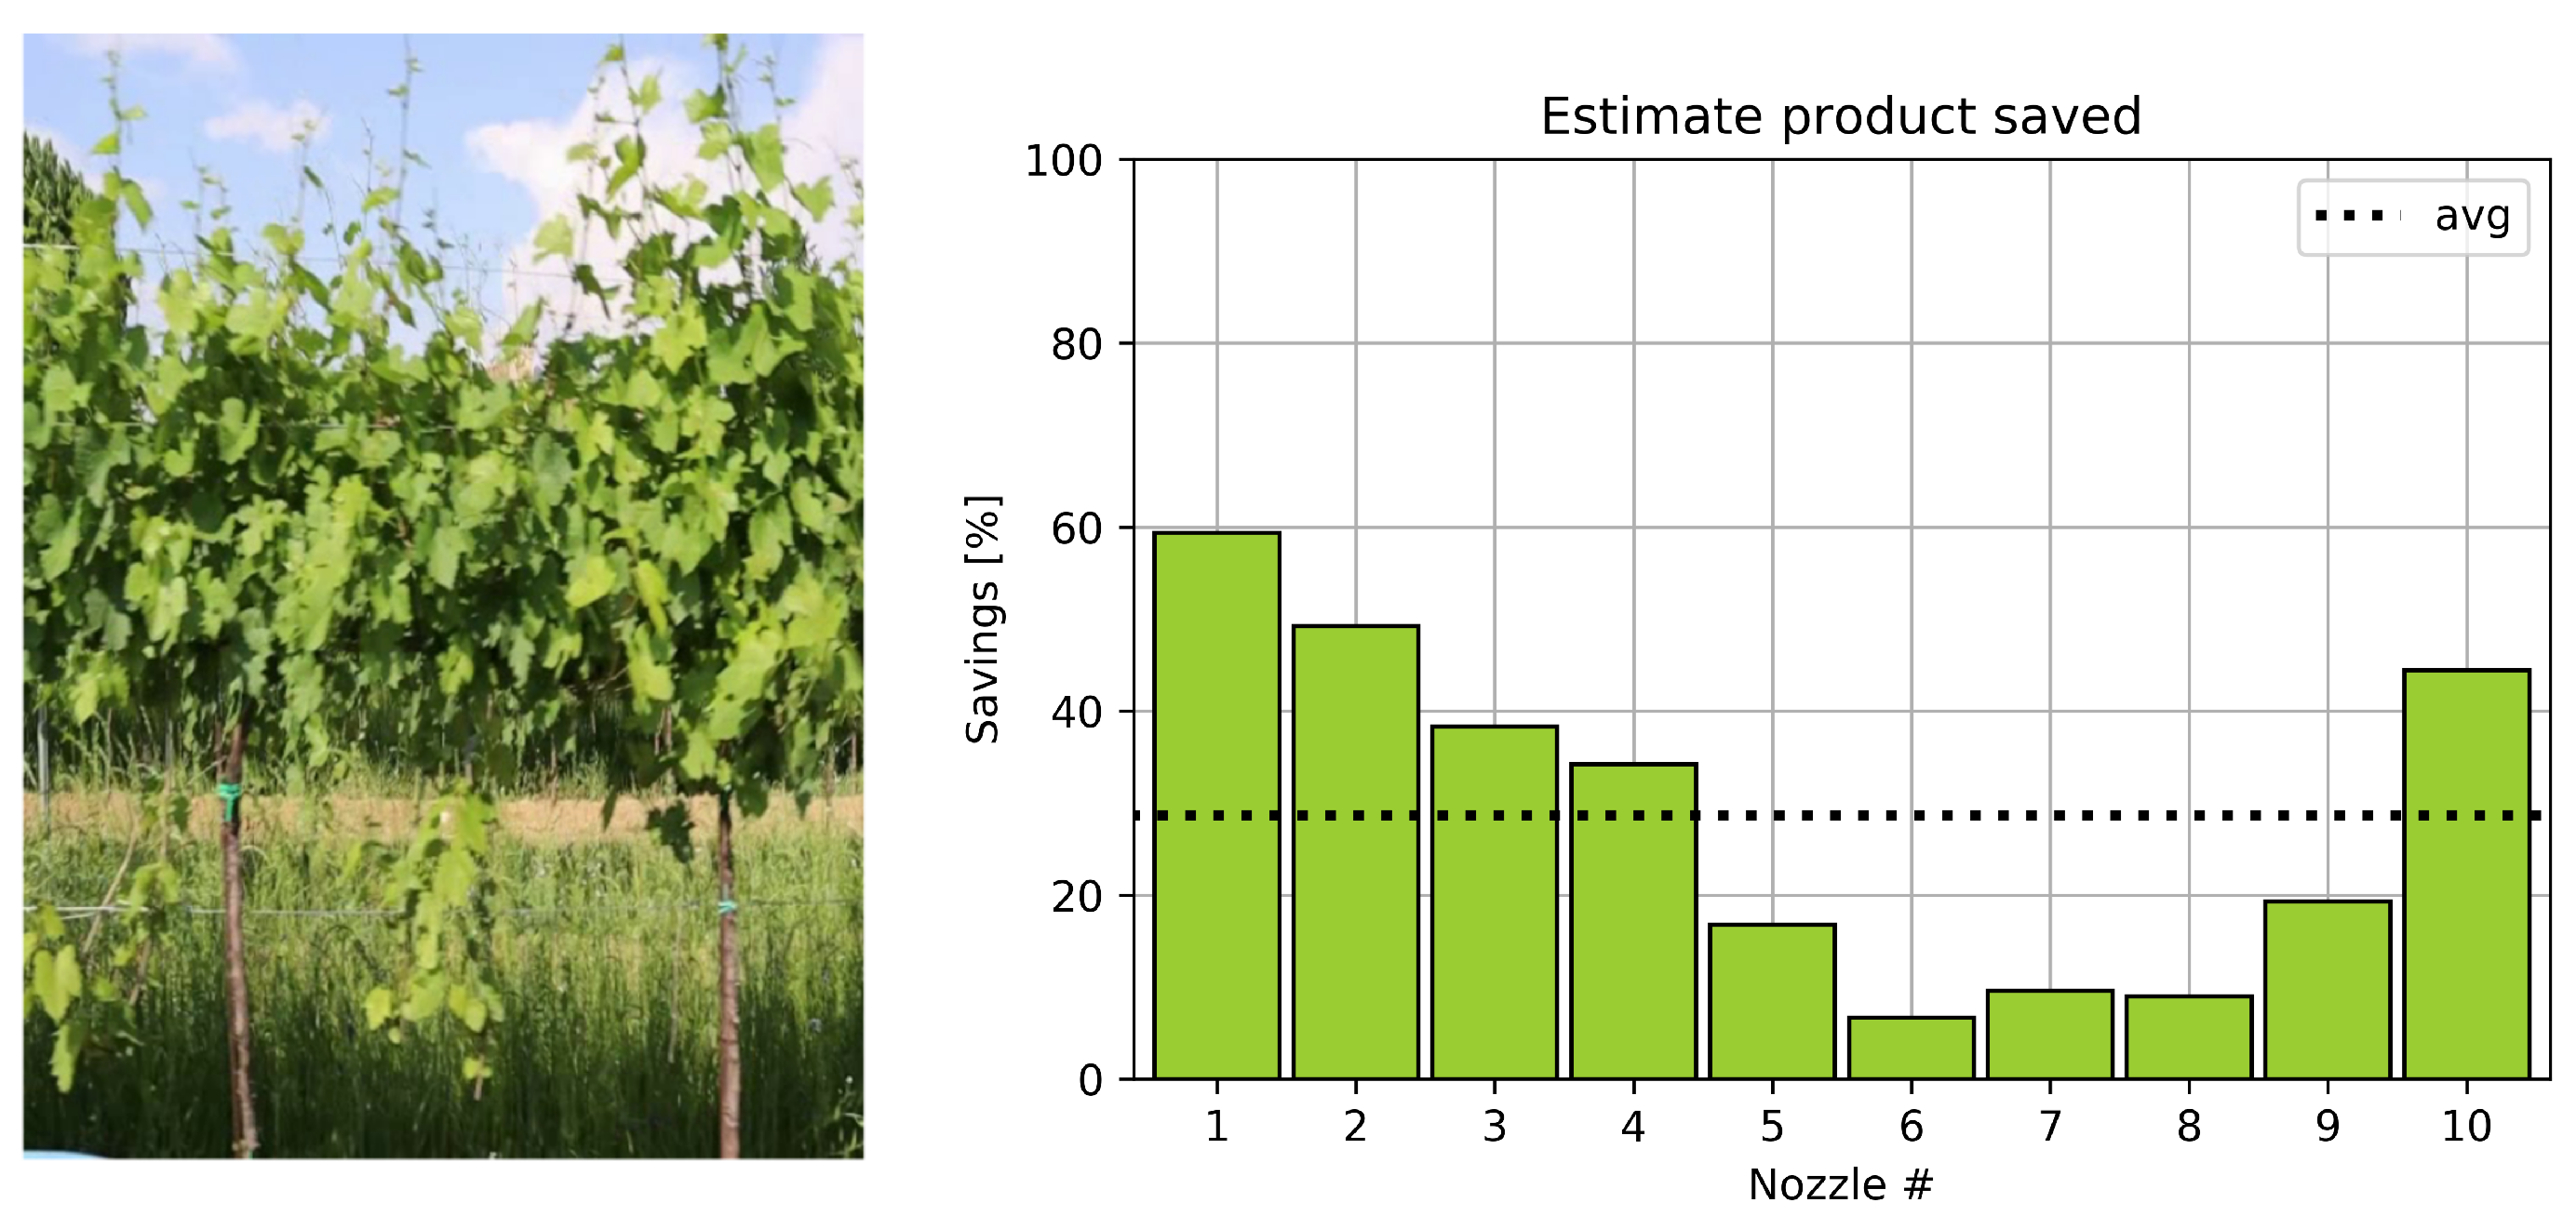
Figure 17 and
Figure 18 show the time each nozzle was open/closed calculated on two video sequences. This parameter is strictly related to the saving of the product with respect to the classical case in which all the nozzles are maintained open the whole time. The video sequences refer to movies lasting about 5 min with a system speed of 2 m/s, with the use of ten nozzles.
Figure 17, referring to mid-April, shows a considerable saving of product in the upper part of the wall (nozzles 9–10) and discrete at the base (nozzles 1–3), where the leaves are actually sparse. On the other hand, in
Figure 18, referring to June, where the leaf part is well developed, it is possible to see a saving, even if lower than in the previous example, mainly in the lower part. With reference to the two video sequences taken into consideration, an overall product saving of 50% in mid-April and 29% in June is expected.
4.3. Development of Prototype
The proposed control system based on SfLM was implemented on a Single Board Computer (SBC) following the results of the video sequencing study. The goal was to develop a dosing controller prototype able to operate in real-time.
The SBCs taken into consideration were Odroid XU4 [
32] and RaspberryPi4 [
33], combined with a global shutter camera with a USB interface or CSI bus for Raspberry. The prototype code was described in Python language on Linux ARM kernels, using open-source libraries such as Video4Linux and, on Python side, Numpy, Scipy and OpenCv. Having already defined the parameters of the SfLM algorithm and defined the controller code in the analysis phase on the PC, it remains that the specifications are statisfied to operate in real-time. Strong attention has been paid to managing the memory and data format of the video stream and intermediate data, looking for the most efficient method and library for the matrix computation in terms of time consumption, together with the possible simplification of the algorithm and setting the number of iterations for each cycle in order to respect the timing.
In particular, to make the number of operations at each cycle identical while maintaining the same resolution of the results, the parameters of the matching algorithm have been made dynamic with the variation of the system speed, applying the preset calculation resources to the only useful portion of the frame to be analyzed.
For both hardware considered, Odroid XU4 and Raspberry Pi4, it was possible to create a software configuration able to process the video stream in real-time according to the analyzed specifications and to control, with the right time delays, the outputs of the sprinklers.
The prototype of the control system was finally qualitatively tested in the field using, in the first analysis, LED light indicators to simulate the activations of the solenoid valves that will control the respective nozzles. Further, in this phase, an a posteriori qualitative analysis was carried out. The prototype was mounted on a cart of suitable mass, pulled by a tractor along a vineyard, with ten signaling LEDs arranged in correspondence with the areas to be treated; perpendicular to the LEDs that simulate the sprinklers, another camera was placed to record the activation sequence during the field tests. The tests were conducted both at various constant speeds and with acceleration and deceleration phases.
The new videos collected were visually evaluated frame by frame to estimate the correct functioning of the device or if the LEDs were turned on only when there was a fair amount of vegetation around them, observing, at the end of the prototype development, an excellent correlation of activations up to speeds of 10 km/h. From a cumulative analysis of the activations during a test session in the field, the product-saving graph was consistent with the vegetative state of the leaf profile of the vineyard. In subsequent work, we will evaluate an automatic annotation method of the captured vineyard and the activated LEDs in order to perform a quantitative analysis of the correctness of the activations over an entire work session.
The punctual and precise measurement of speed is fundamental, not only for the correct calculation of activations but above all, as anticipated, for managing their delays. In the real experiments of the prototype in the field, errors of alignment between the predictions and the activations are evident in all those cases in which the speed variations (starts and stops, accelerations) are not correctly taken into account. Particular attention should, therefore, be paid to the speed measurement system, preferring reading systems based on encoders, which provide instantaneous measures, compared to GPS probes, and providing redundant measurements to be able to mediate or eliminate inconsistent measures.
4.4. Future Developments
As described in the previous paragraphs, the tests carried out are limited to qualitative assessments and consequently lack systematicity; they only had the purpose of validating the functioning of the prototype.
The two main aspects of our future work will concern the quantitative evaluation of the error of the outputs, which passes from the creation of a ground-truth of the video sequences to be analyzed and the punctual verification of the activation logic of each nozzle, and then the systematic evaluation of the system, referencing and evaluating the measurements by month and by whole season, across type of vine, tractor speed, ambient light condition and number of sprayers used.
The validation process of the proposed sprayer control will be based on the analysis of the video that records the activations (LED) while the prototype travels through the vineyard, whose reference profile will have to be estimated with a different method in order to assess whether the prototype has correctly activated the nozzle in the area to which it refers. With this numerical solution, it will be possible to estimate both the saved product and the amount of the error, i.e., whether there is a missed or an excess dosage caused by an incorrect recognition of the vineyard profile. In other work, such as [
34], they instead propose to use water-sensitive paper behind the foliage to be treated to highlight and evaluate areas and the extent of drift; that is, the dispersion of the product.
Further aspects of future investigation could concern the optimal number of nozzles to be used, a number which is probably heavily dependent on the application field, or their flow modulation, instead of simple on-off control, according to the extension of the leaf apparatus with respect to the action area of the nozzle. Another aspect of the investigation may concern the validation of the health status of the plant with respect to the information that can be extracted using cameras with sensors that work not only in the visible band, for example, by considering cameras without low-pass filters, and, consequently, also sensitive to near-infrared; by demonstrating sufficient correlation to typical diseases, it would be possible to improve the identification of the area to be treated, allowing an even more precise variable dosage.


 ,
, 


