
Management of Al3+ Residue in the Soil by Mapping Soil Capability in Retaining and Transporting Al3+ in the Farmland of Trang Bom District, Vietnam

 ,
,
Abstract
:1. Introduction
2. Materials and Methods
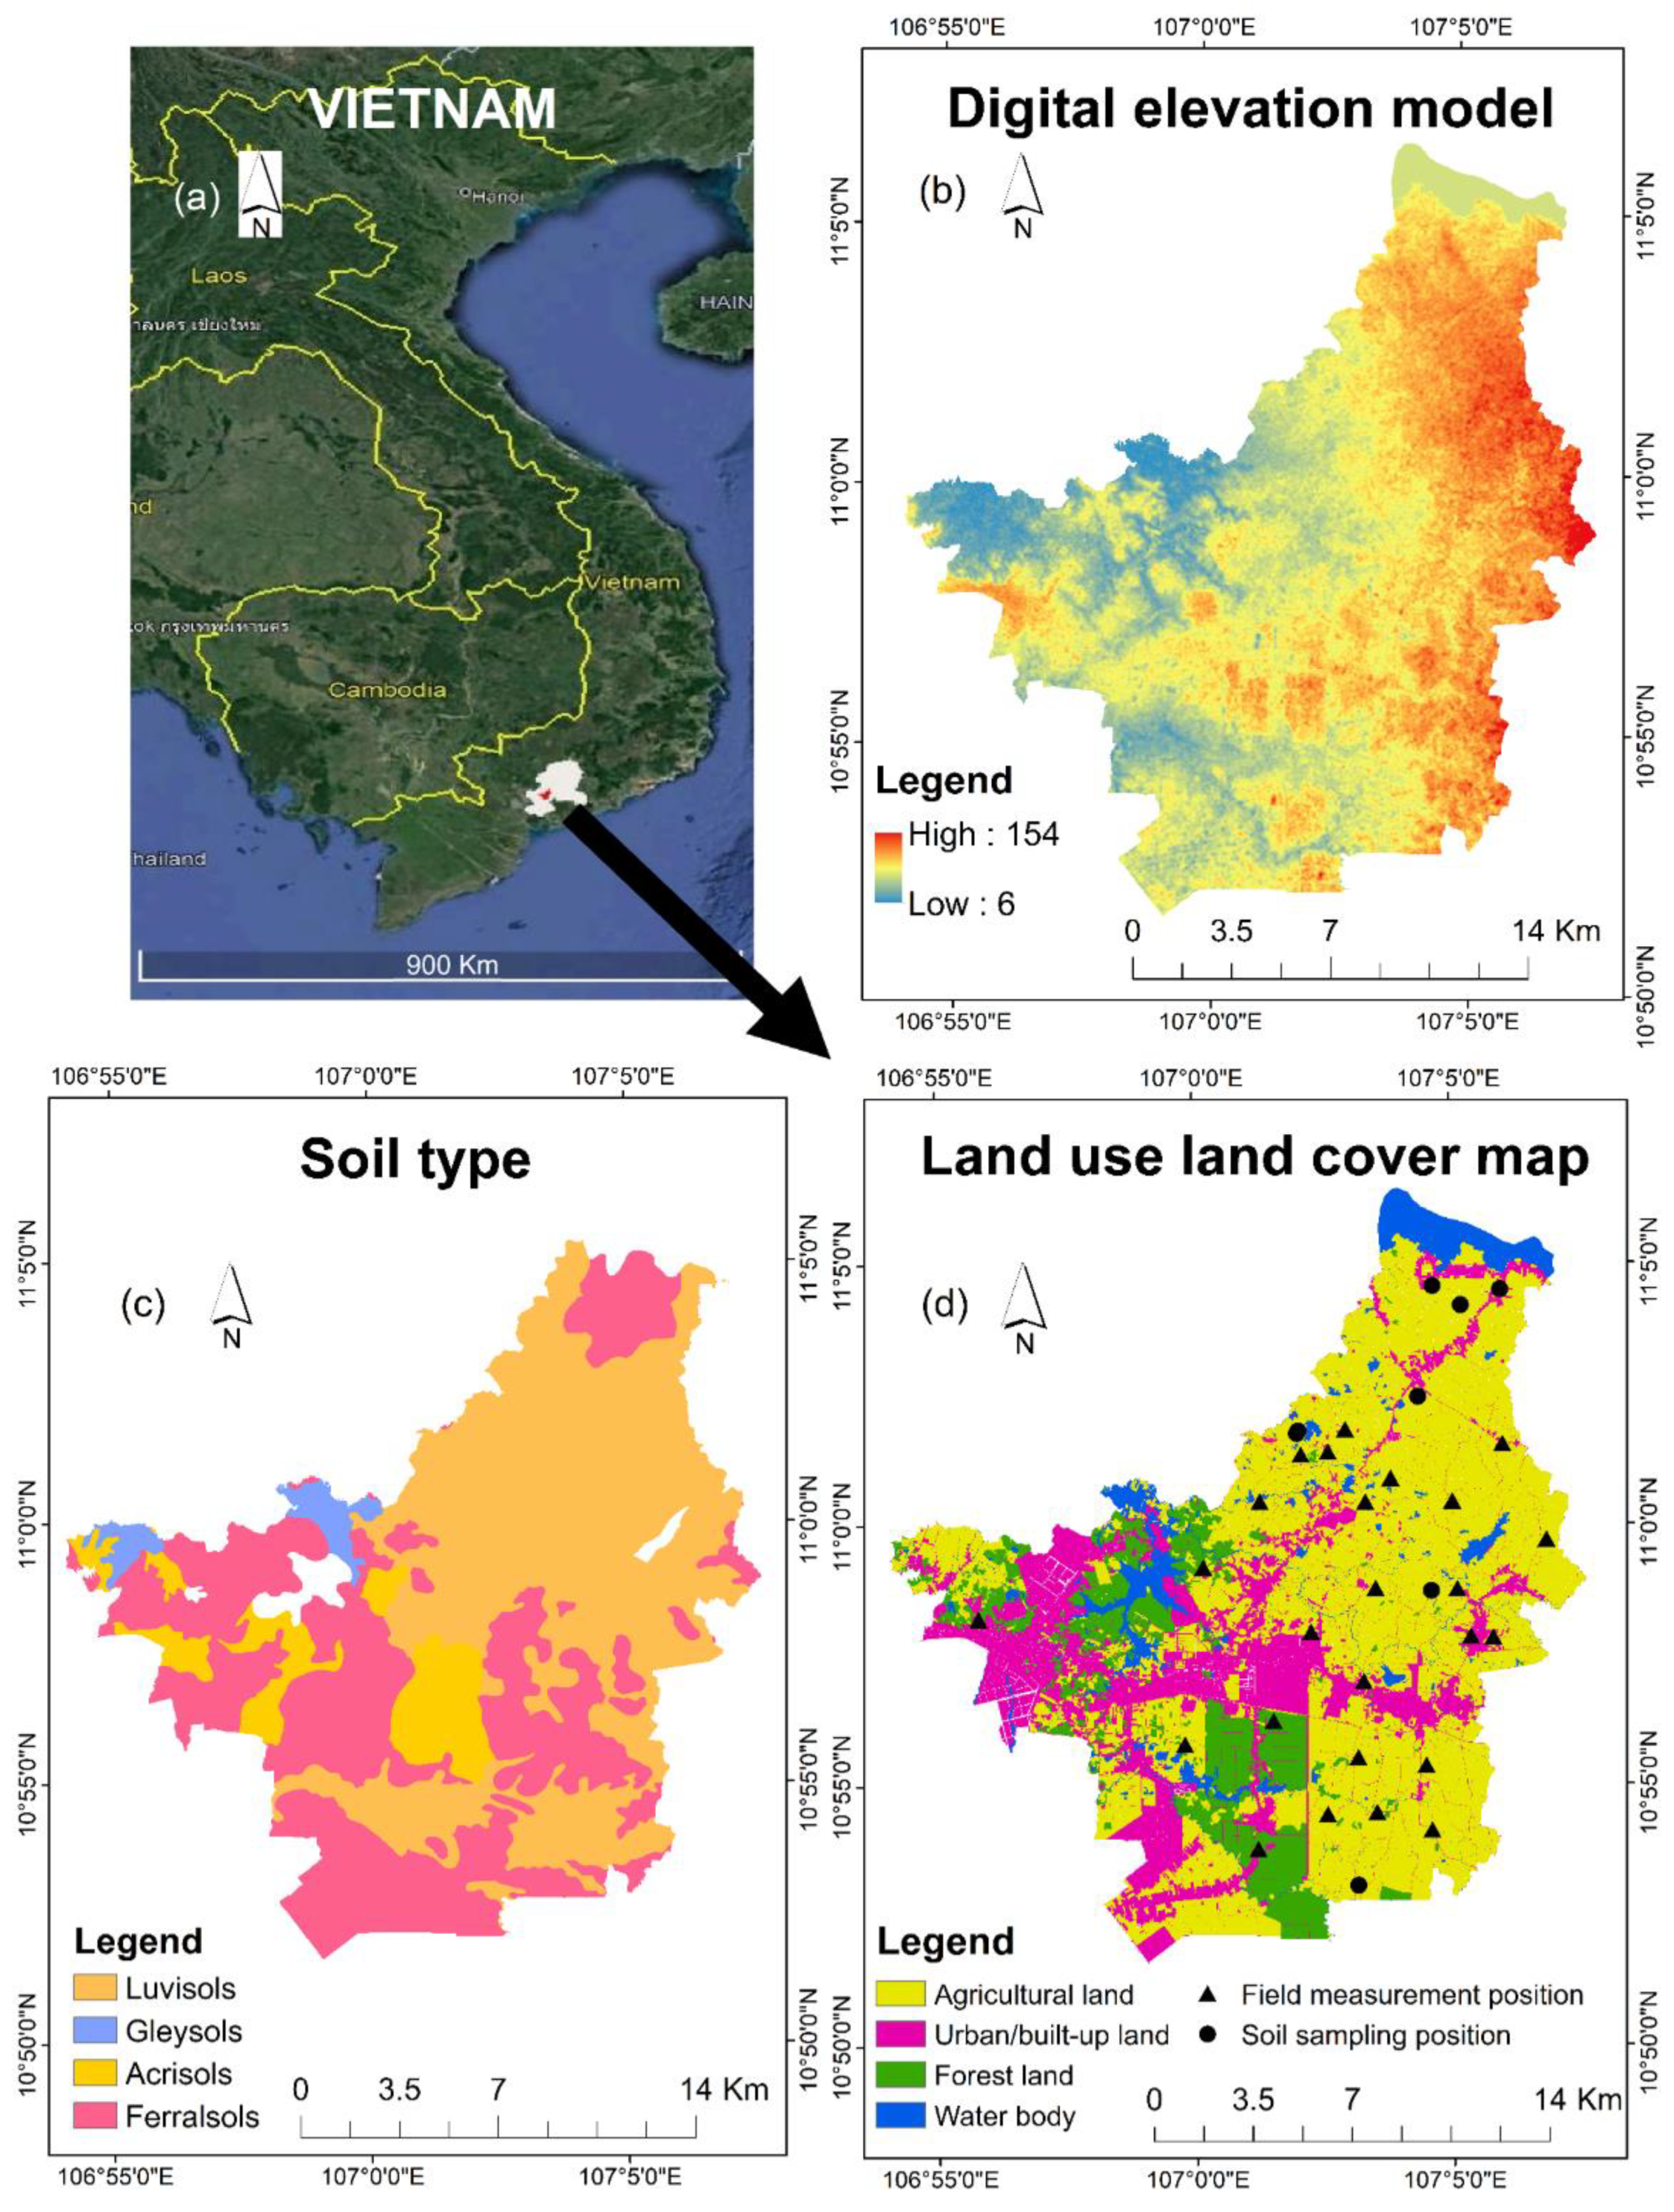
2.1. Study Area
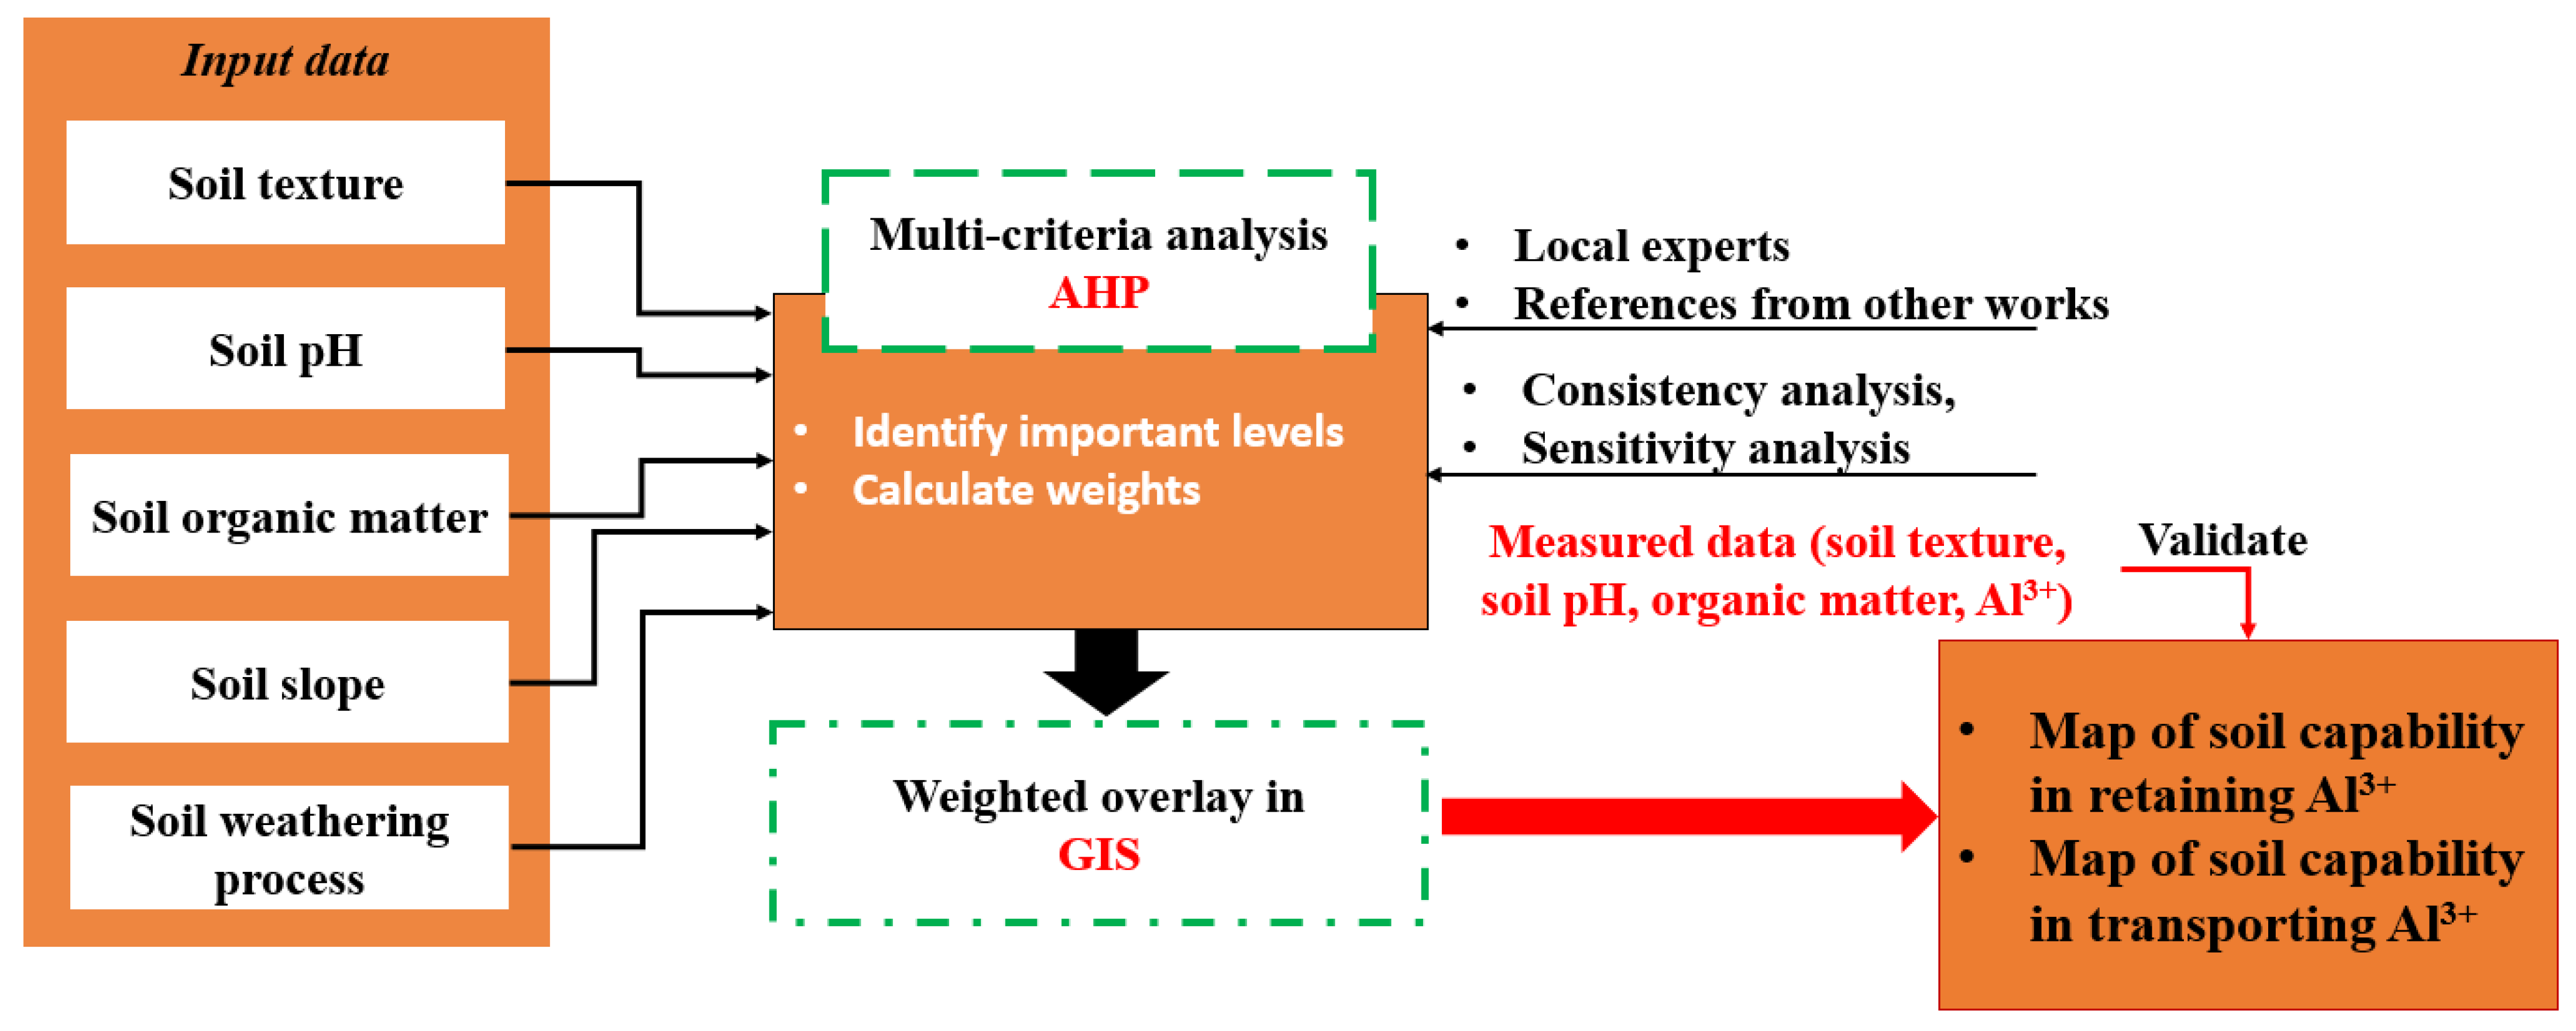
2.2. GIS-Based Multicriteria Analysis
2.2.1. Calculation Method for Soil Capability in Retaining and Transporting Al3+
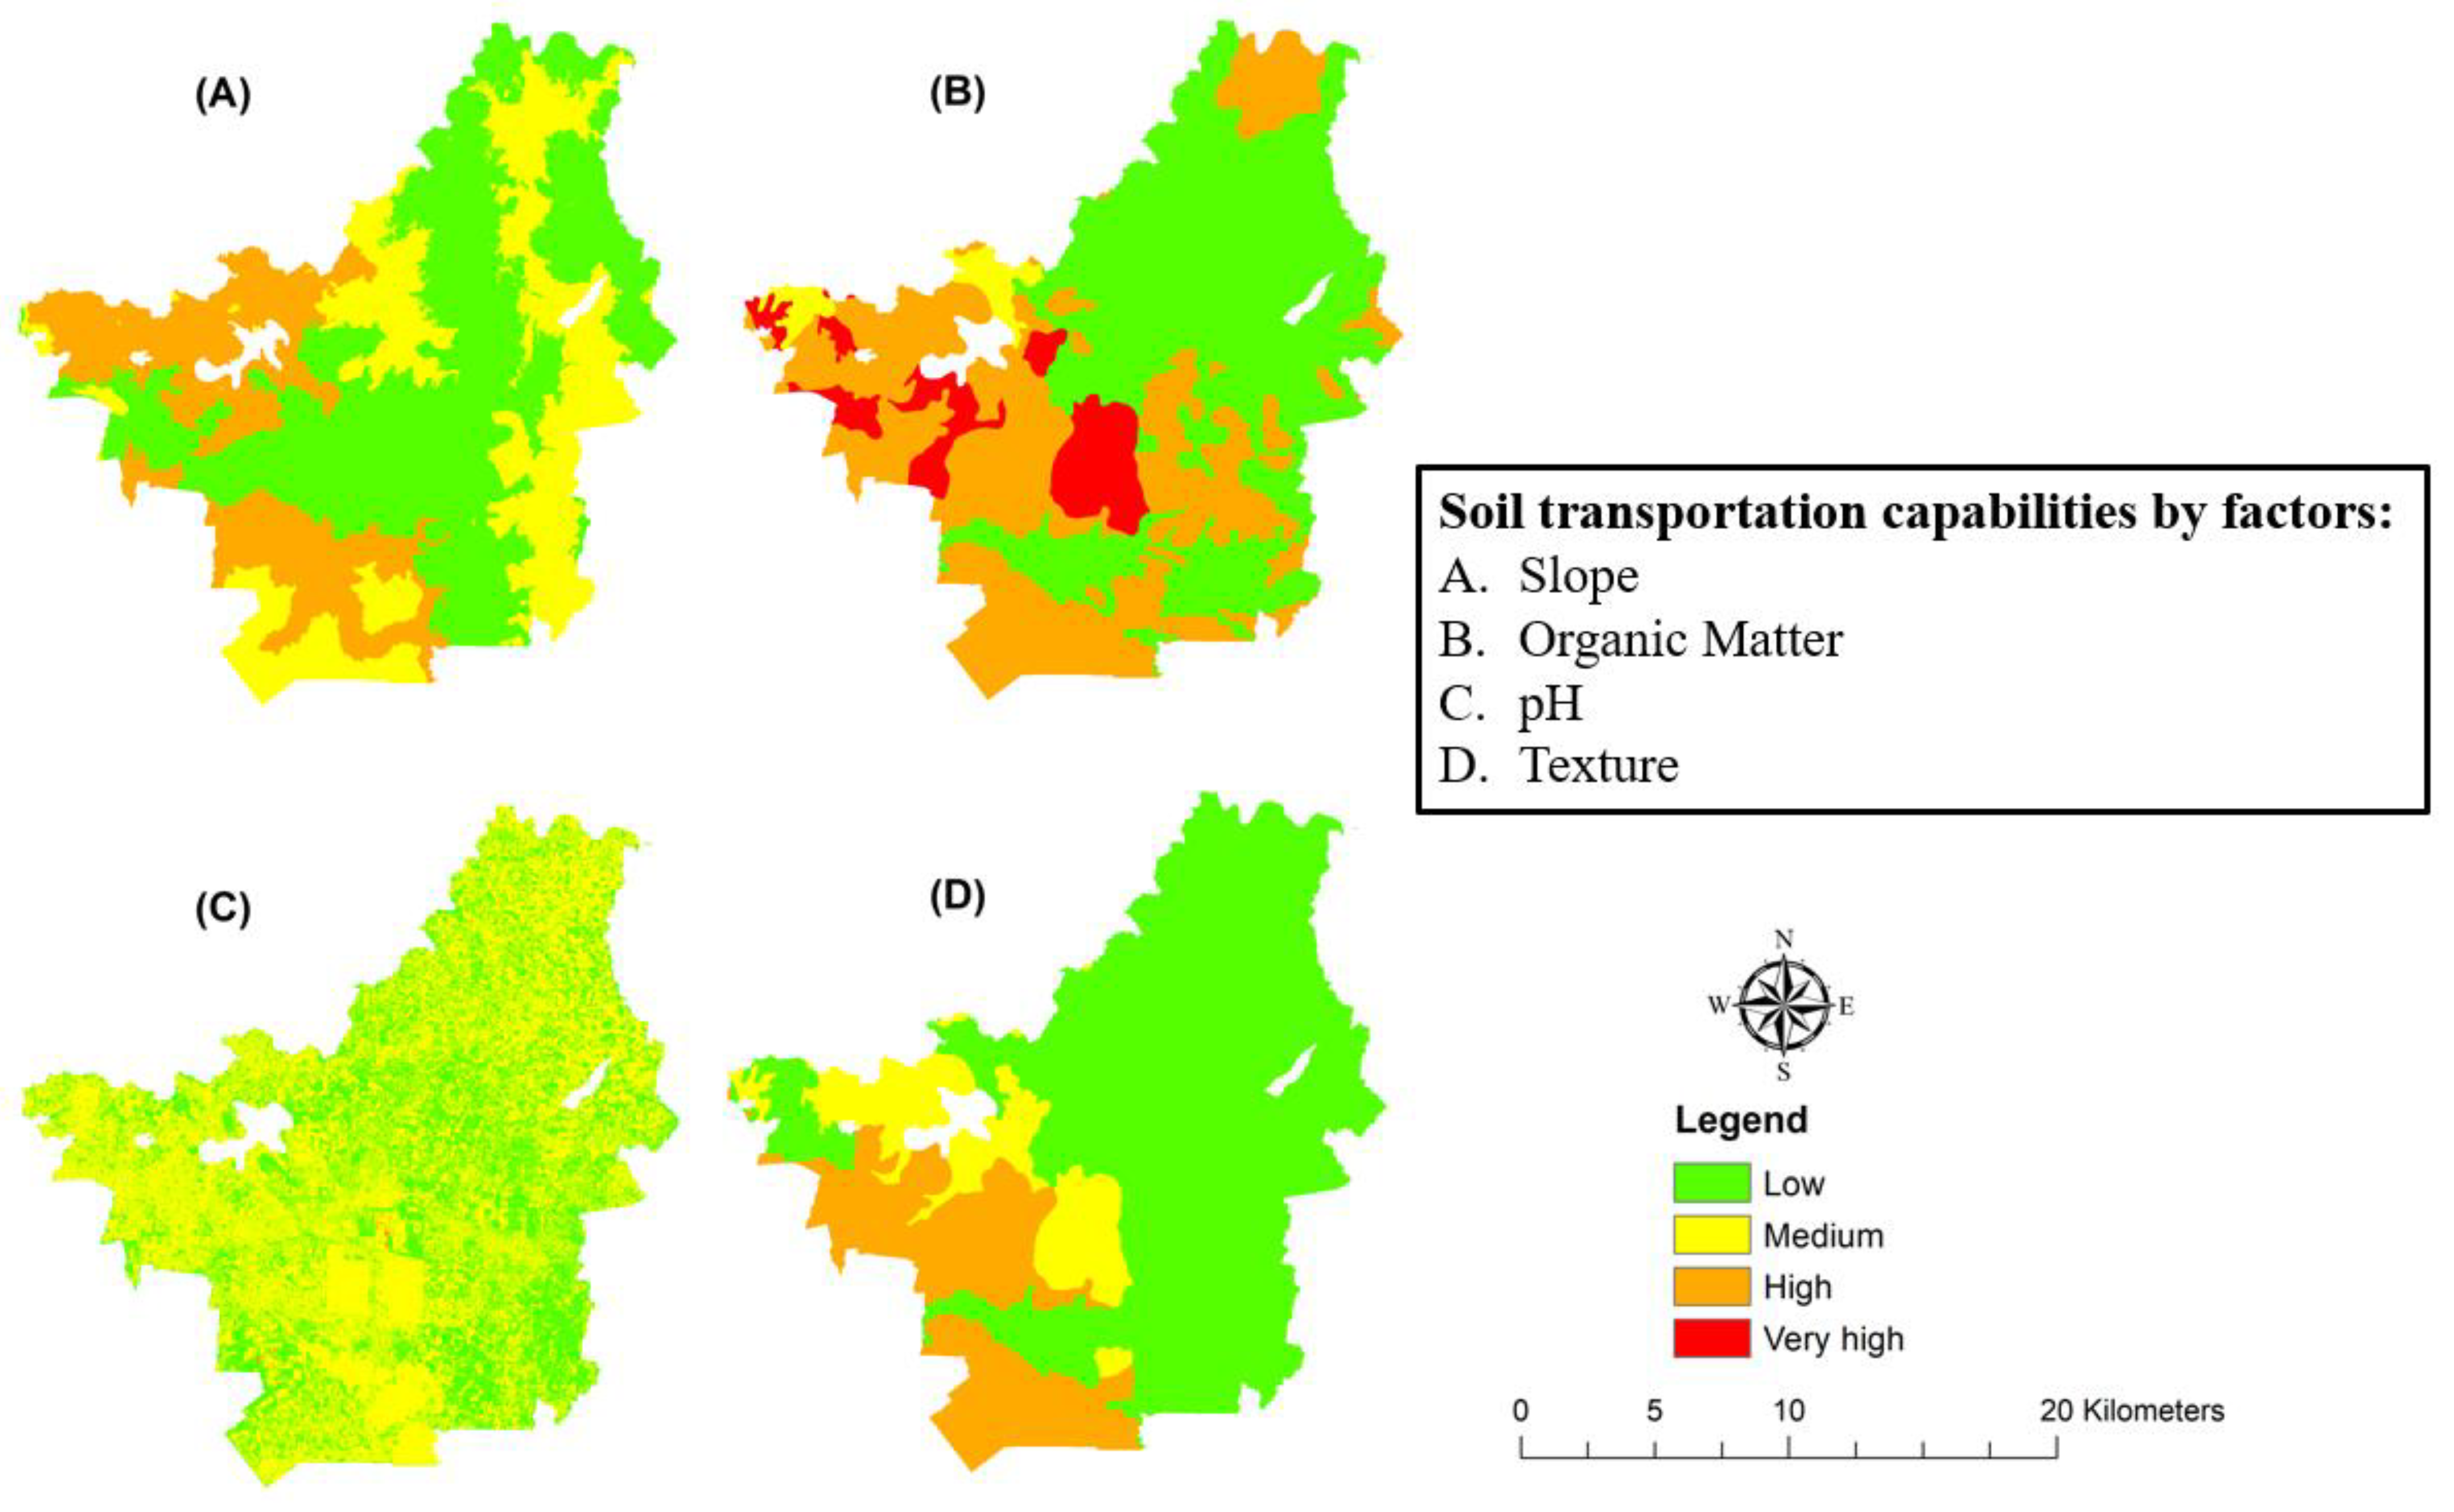
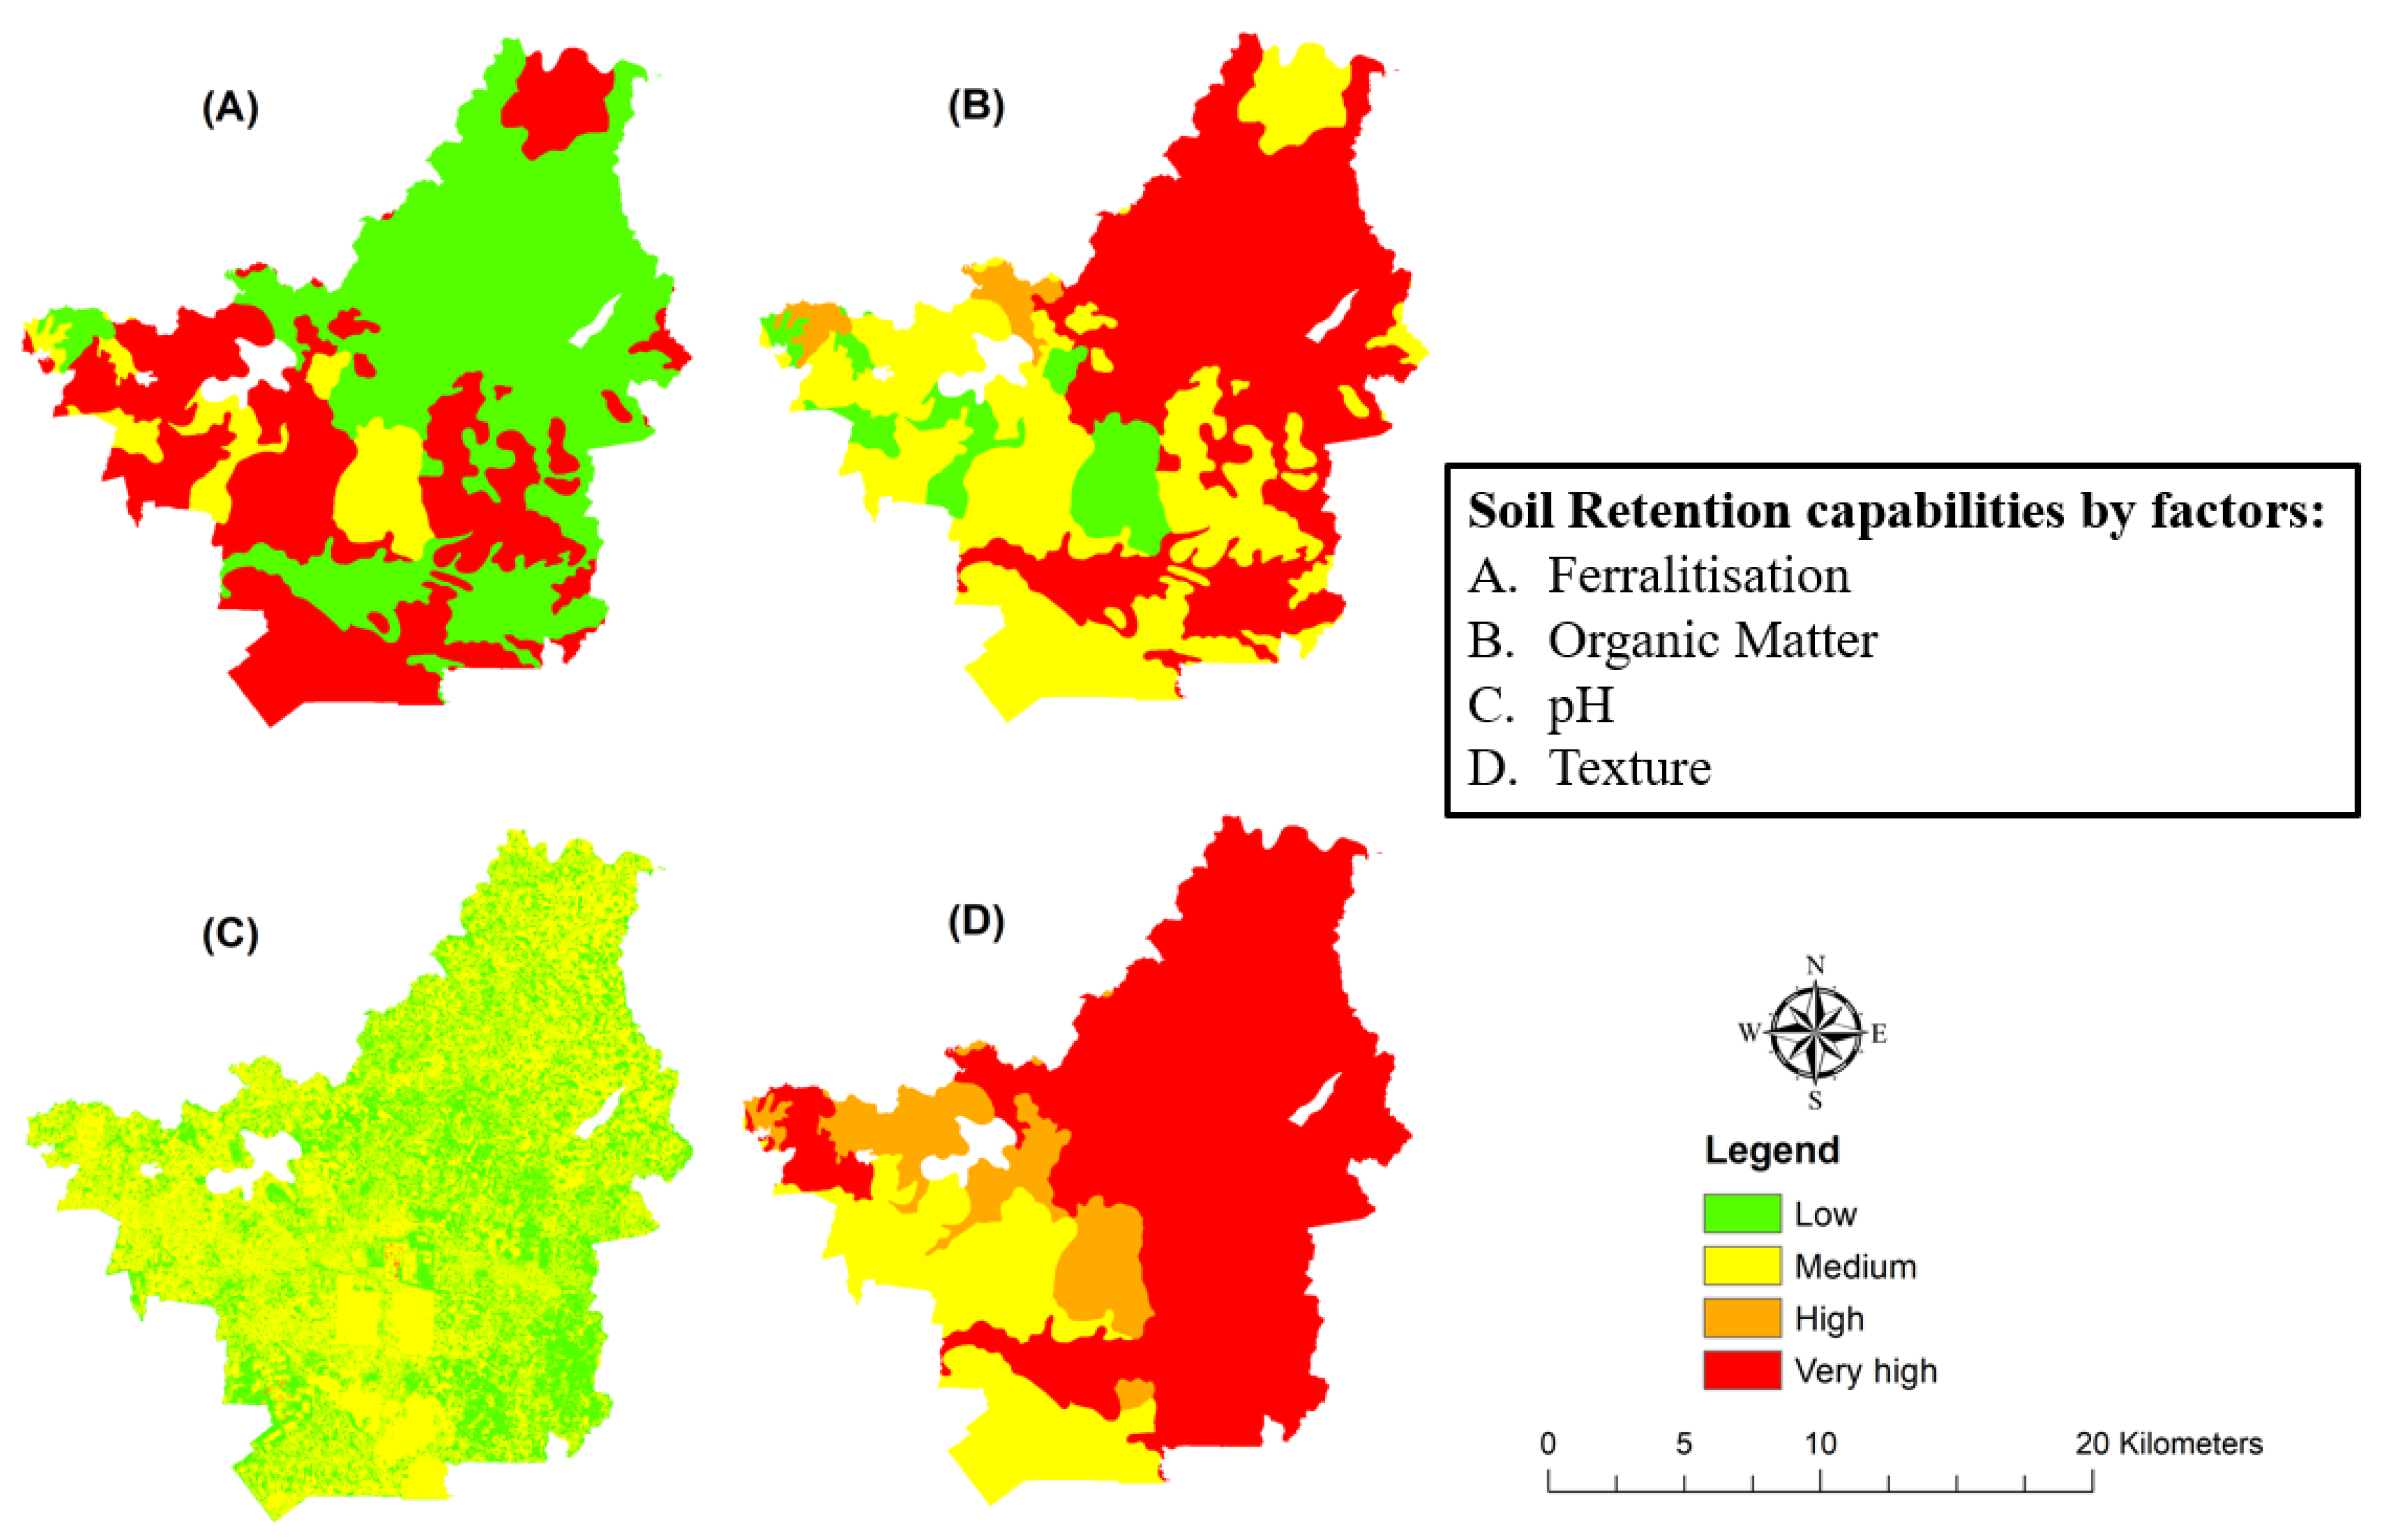
2.2.2. Determination of Influencing Factors
2.3. Data Sources and Data Processing
2.3.1. Collected Data
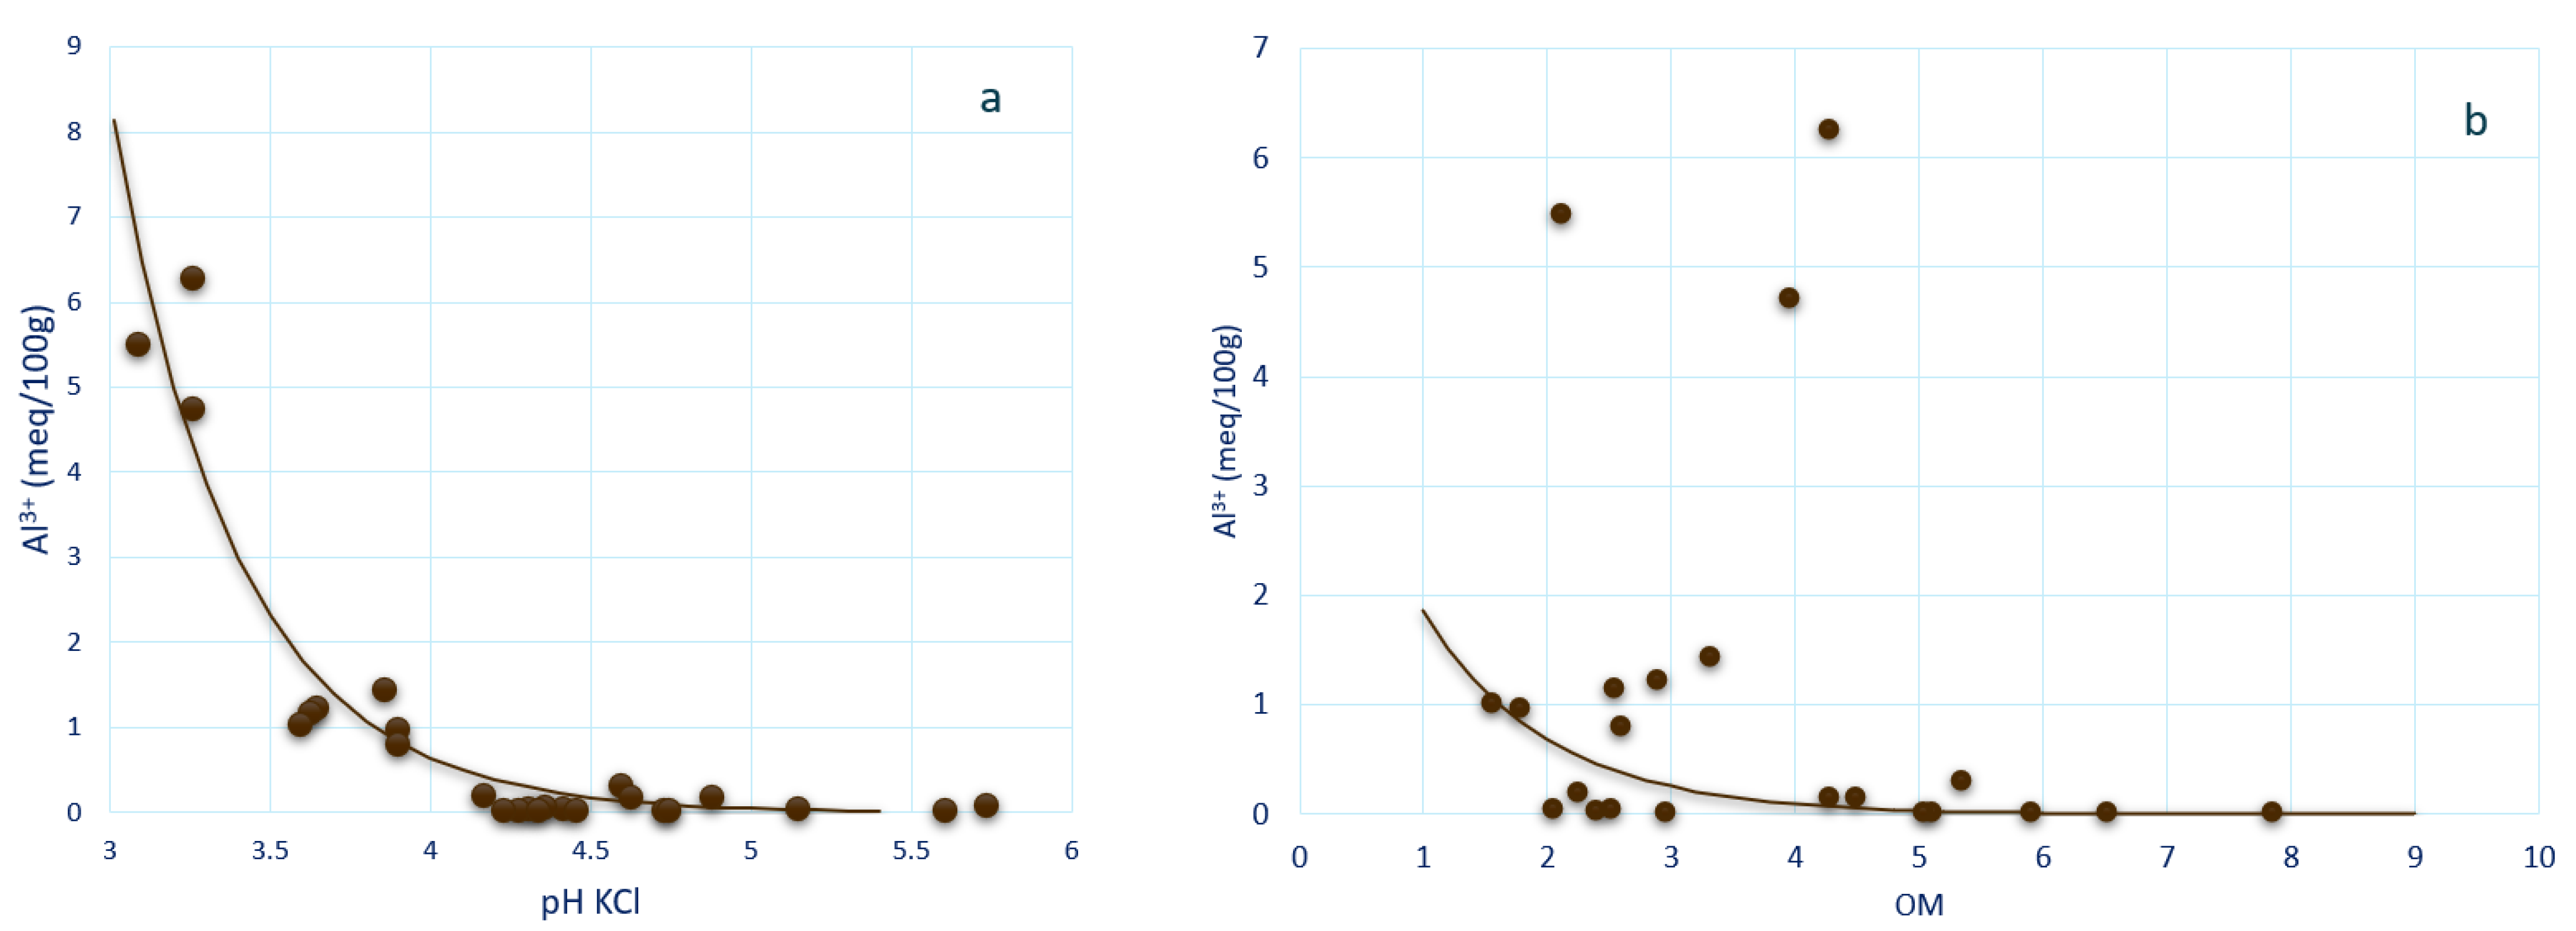
2.3.2. Field Measurement Data
2.4. Sensitivity Analysis and Map Validation
3. Results
3.1. Calculation of Soil Capability in Retaining and Transporting Al3+
3.1.1. Factors Standardization and Criteria Weights
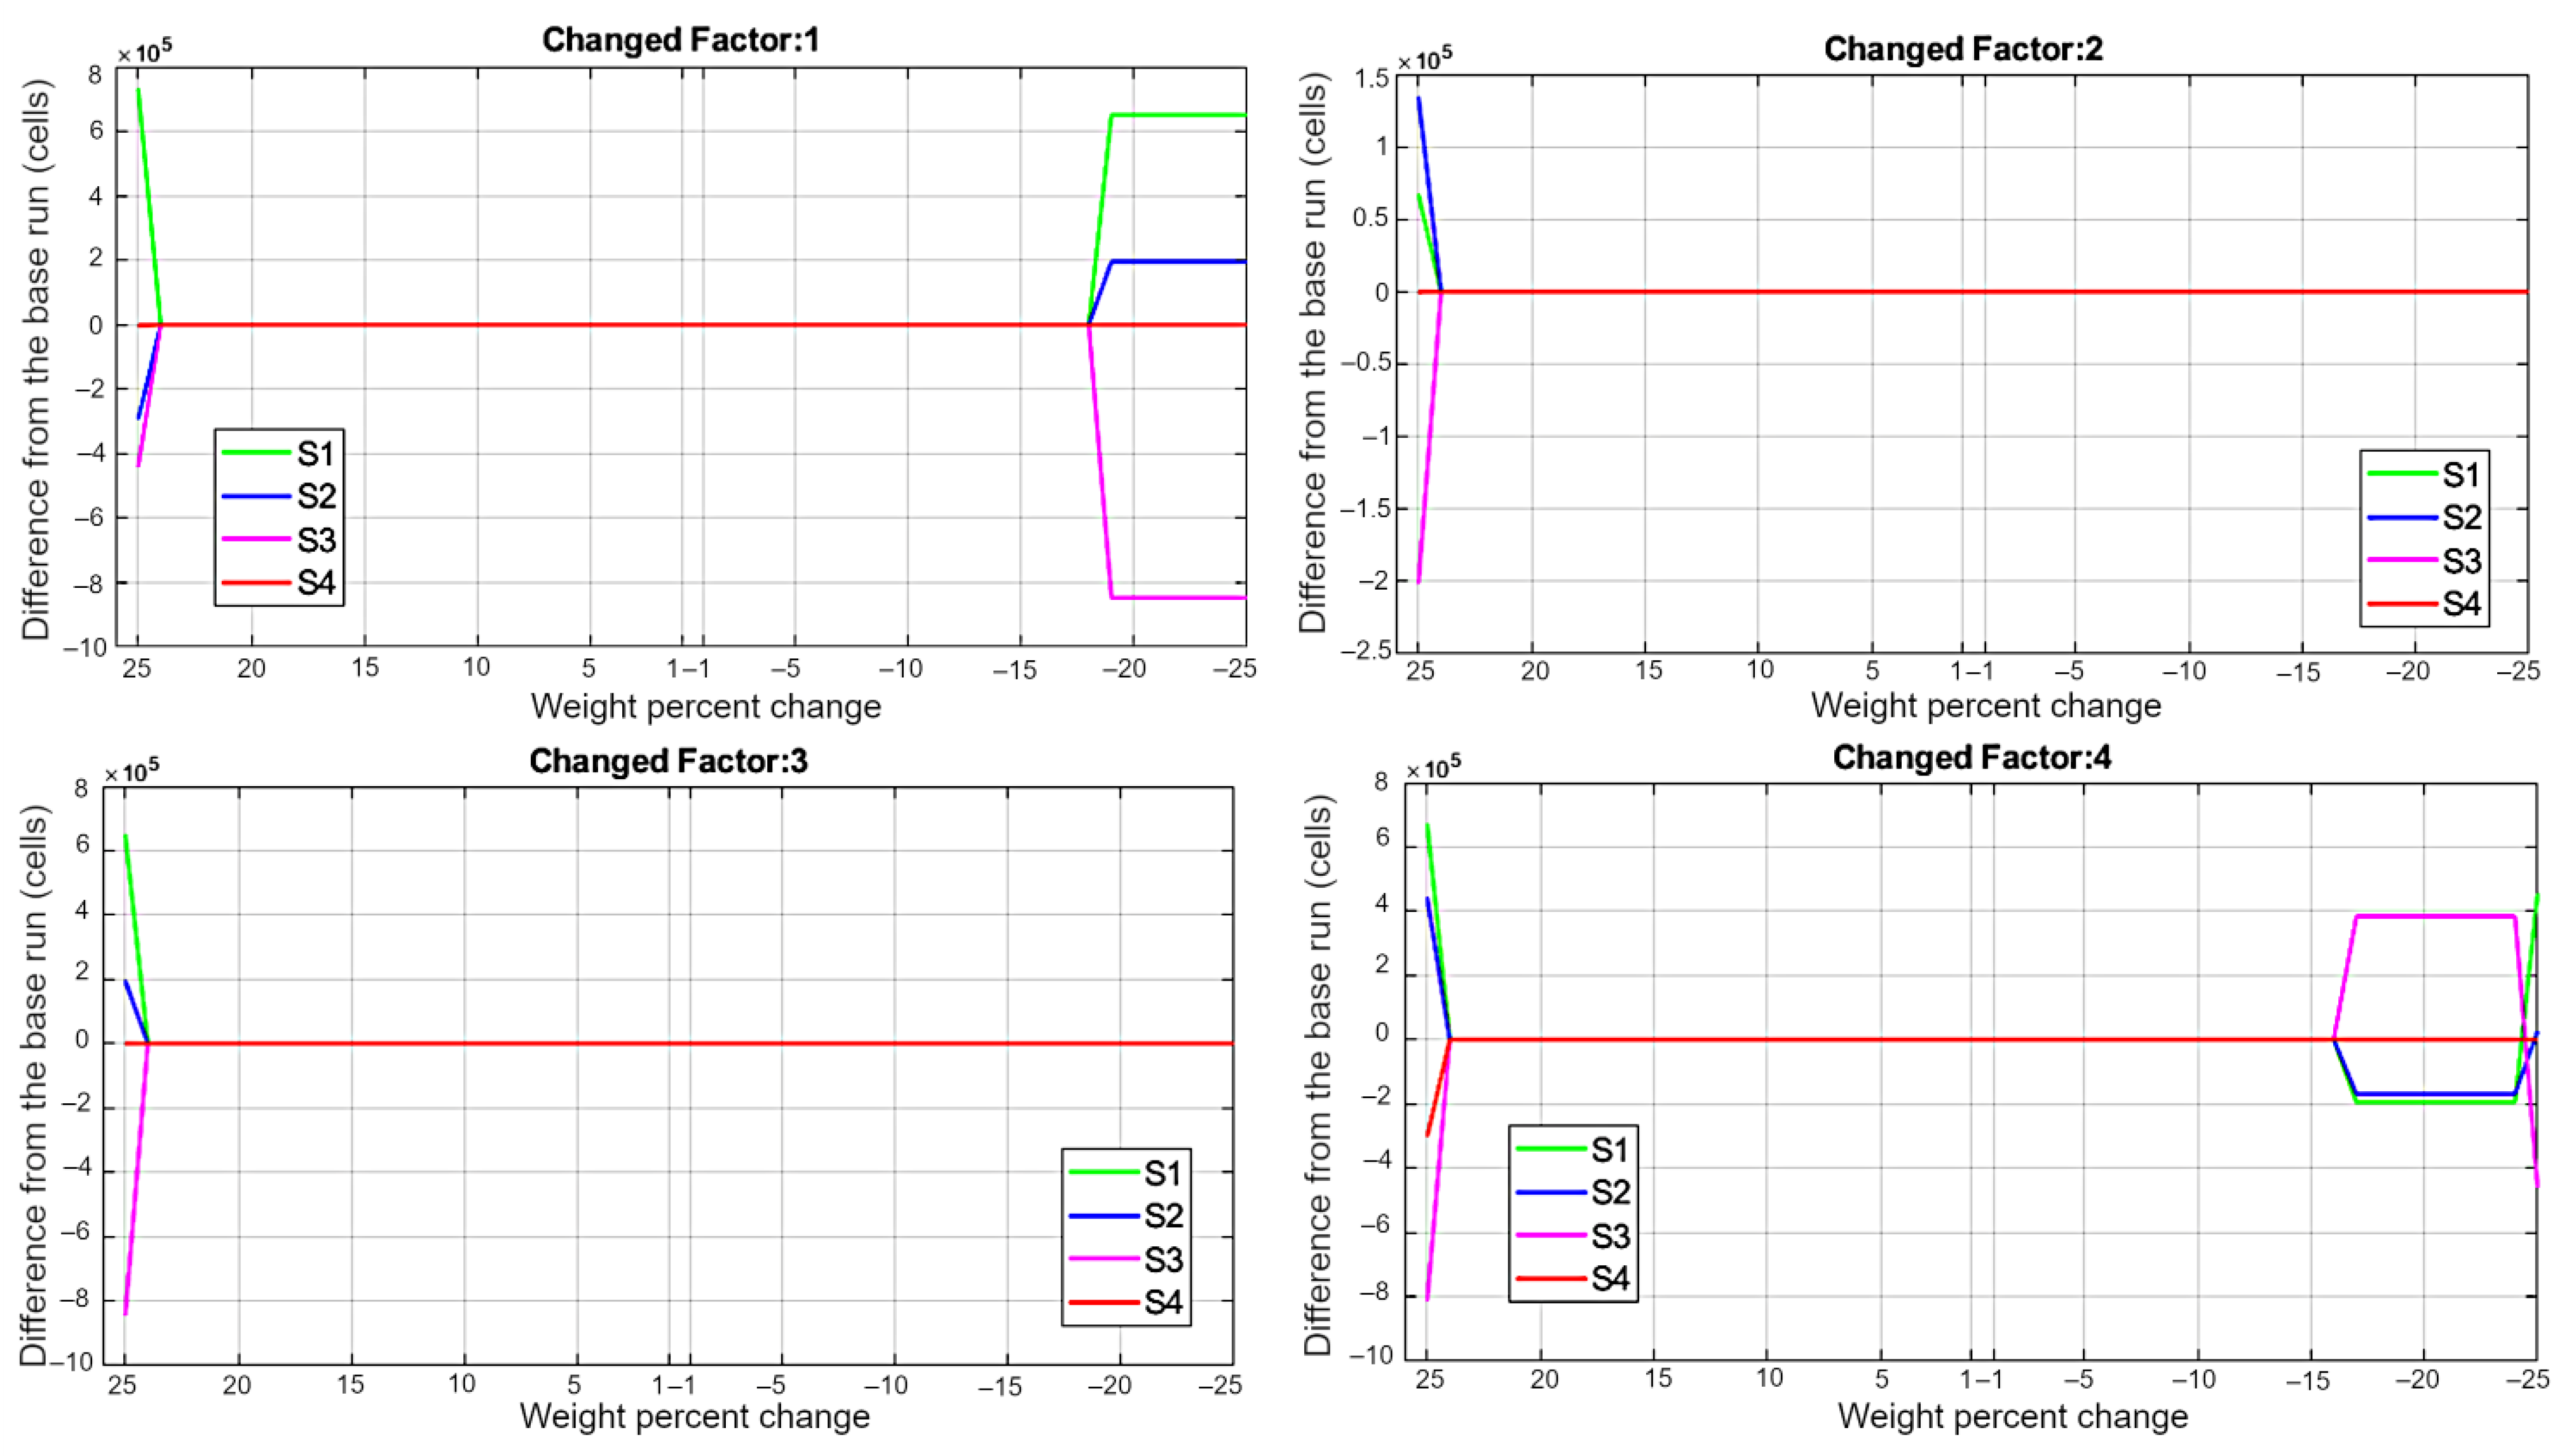
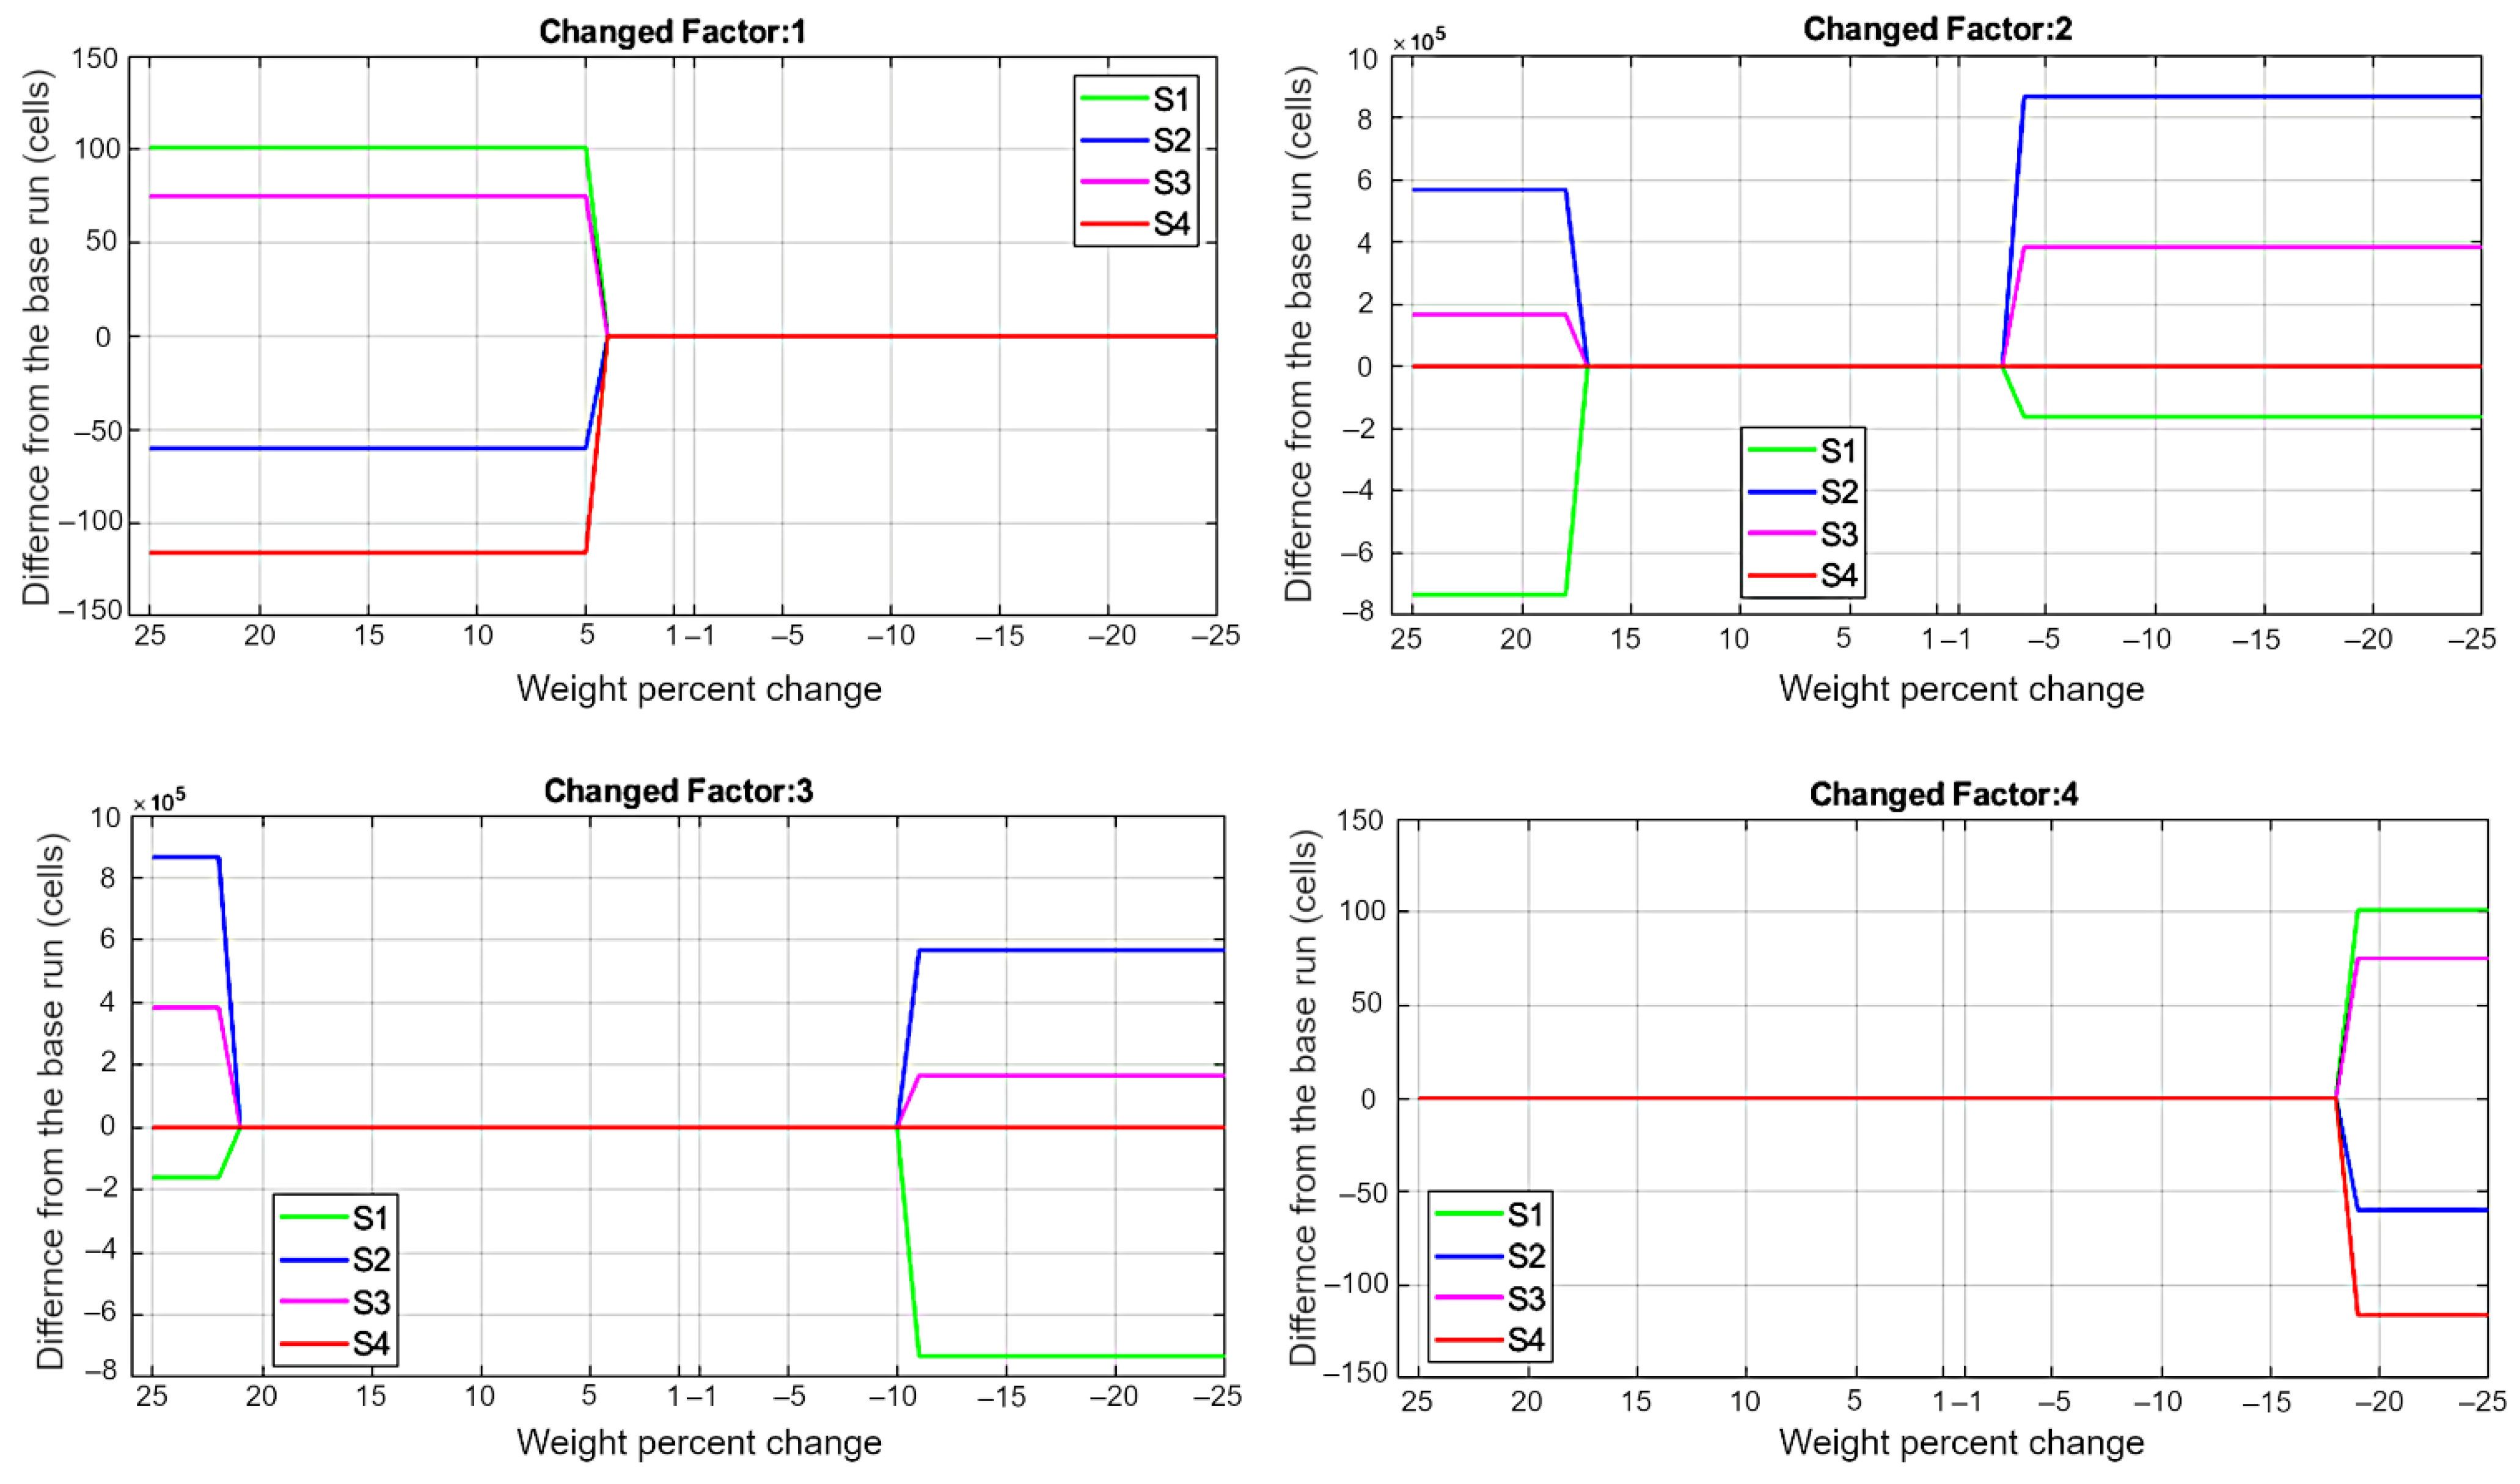
3.1.2. Sensitivity analysis
- For soil retention capability, the factors soil pH and soil texture are more sensitive than the factors of soil weathering and organic matter (cf. Table 4 and Figure 4). Soil pH and soil texture cause significant capability classes modification from the base map (which used weight values from Table 3); the number of cells changed (cell size 100 m2) from the base map are 650,708, 195,402, 846,259, and 149 for S1, S2, S3, and S4 when their weights decreased or increased outside the range (−18%, +23%) for pH factor, and the differences amount to 673,378, 443,563, 814,192, and 302,723 cells when their weights decreased or increased outside the range (−16%, +23%) for the factor soil texture.
- For the soil capability in transporting Al3+, the soil texture and slope are the most sensitive factors; the weight of the factor soil texture causes significant changes to the soil transportation levels (the number of changed cells reached up to 733,149, 567,986, 166,706, and 116) compared to the base map, when its weight decreased or increased outside the range (−2%, +16%) from the base weight value. For the soil slope, the changed cells reached up to 733,037, 568,009, 166,582, and 116 when its weight decreased or increased outside the range (−10%, +21%) from the base weight value. The factors pH and organic matter in turn also made changes to the soil transportation levels when their weights fell outside the ranges (−25%, +4%) for pH and (−17%, +25%) for organic matter, but the cell differences were not so large (cf. Figure 5).


| Changed Factor | Percent Change (%) from Base Value Which Keeps the Model Stable | Range of Weight Values Which Keeps the Model Stable | Range of Weight Values Which Keeps the Model Stable and Satisfies CR < 0.1 | |
|---|---|---|---|---|
| Retention Capability | pH | (−18, +23) | 0.376–0.48 | 0.376–0.4 |
| Ferrallitisation | (−25, +23) | 0.16–0.24 | 0.17–0.22 | |
| Organic matter | (−25, +23) | 0.073–0.12 | 0.1–0.101 | |
| Soil texture | (−15, +23) | 0.252–0.36 | 0.303–0.342 | |
| Transportation Capability | pH | (−25, +3) | 0.096–0.137 | 0.1056–0.1248 |
| Soil texture | (−2, +16) | 0.501–0.6084 | 0.5096–0.5616 | |
| Slope | (−10, + 21) | 0.229–0.336 | 0.28–0.266 | |
| Organic matter | (−17, +25) | 0.05–0.097 | 0.074–0.0808 |
3.2. The Maps of Soil Al3+ Retention and Transportation Capabilities
3.3. Map Validation
4. Discussion
5. Conclusions
Author Contributions
Funding
Conflicts of Interest
References
- Milne, C.; Kinniburgh, D.; De Wit, J.; Van Riemsdijk, W.; Koopal, L. Analysis of proton binding by a peat humic acid using a simple electrostatic model. Geochim. Cosmochim. Acta 1995, 59, 1101–1112. [Google Scholar] [CrossRef]
- Iqbal, T. Effect of Al compounds on soil pH and bioavailability of Al in two acid soils. Turk. J. Agric. For. 2012, 36, 720–728. [Google Scholar]
- Delhaize, E.; Ryan, P.R. Aluminum toxicity and tolerance in plants. Plant Physiol. 1995, 107, 315. [Google Scholar] [CrossRef] [PubMed] [Green Version]
- Ma, J.F. Syndrome of aluminum toxicity and diversity of aluminum resistance in higher plants. Int. Rev. Cytol. 2007, 264, 225–252. [Google Scholar] [PubMed]
- Ribeiro, M.A.Q.; Almeida, A.-A.F.D.; Mielke, M.S.; Gomes, F.P.; Pires, M.V.; Baligar, V.C. Aluminum effects on growth, photosynthesis, and mineral nutrition of cacao genotypes. J. Plant Nutr. 2013, 36, 1161–1179. [Google Scholar] [CrossRef]
- Wong, M. Root infusion of phosphorus acid for the control of Phytophthora foot rot in black pepper (Piper nigrum L.). In Diversity and Management of Phytophthora in South East Asia; dan Guest, A., Ed.; ACIAR: Canberra, Australia, 2004; pp. 171–173. [Google Scholar]
- Guest, D.; Grant, B. The complex action of phosphonates as antifungal agents. Biol. Rev. 1991, 66, 159–187. [Google Scholar] [CrossRef]
- Goulding, K. Soil acidification and the importance of liming agricultural soils with particular reference to the United Kingdom. Soil Use Manag. 2016, 32, 390–399. [Google Scholar] [CrossRef]
- Copaja, S.V.; Gatica-Jeria, P. Effects of clay content in soil on pesticides sorption process. J. Chil. Chem. Soc. 2021, 66, 5086–5092. [Google Scholar] [CrossRef]
- Burkle, L.A.; Delphia, C.M.; O’Neill, K.M. A dual role for farmlands: Food security and pollinator conservation. J. Ecol. 2017, 105, 890–899. [Google Scholar] [CrossRef] [Green Version]
- Crist, E.; Mora, C.; Engelman, R. The interaction of human population, food production, and biodiversity protection. Science 2017, 356, 260–264. [Google Scholar] [CrossRef]
- Akıncı, H.; Özalp, A.Y.; Turgut, B. Agricultural land use suitability analysis using GIS and AHP technique. Comput. Electron. Agric. 2013, 97, 71–82. [Google Scholar] [CrossRef]
- Bandyopadhyay, S.; Jaiswal, R.; Hegde, V.; Jayaraman, V. Assessment of land suitability potentials for agriculture using a remote sensing and GIS based approach. Int. J. Remote Sens. 2009, 30, 879–895. [Google Scholar] [CrossRef]
- Tashayo, B.; Honarbakhsh, A.; Azma, A.; Akbari, M. Combined fuzzy AHP–GIS for agricultural land suitability modeling for a watershed in southern Iran. Environ. Manag. 2020, 66, 364–376. [Google Scholar] [CrossRef] [PubMed]
- Bogunovic, I.; Trevisani, S.; Pereira, P.; Vukadinovic, V. Mapping soil organic matter in the Baranja region (Croatia): Geological and anthropic forcing parameters. Sci. Total Environ. 2018, 643, 335–345. [Google Scholar] [CrossRef]
- Liu, L.; Zhang, X.; Zhong, T.; Wang, S.; Zhang, W.; Zhao, L. Spatial distribution and risk assessment of copper in agricultural soils, China. Hum. Ecol. Risk Assess. Int. J. 2017, 23, 1404–1416. [Google Scholar] [CrossRef]
- Wang, S.; Zhong, T.; Chen, D.; Zhang, X. Spatial distribution of mercury (Hg) concentration in agricultural soil and its risk assessment on food safety in China. Sustainability 2016, 8, 795. [Google Scholar] [CrossRef] [Green Version]
- Zhang, X.; Chen, D.; Zhong, T.; Zhang, X.; Cheng, M.; Li, X. Evaluation of lead in arable soils, China. CLEAN–Soil Air Water 2015, 43, 1232–1240. [Google Scholar] [CrossRef]
- Zhang, X.; Chen, D.; Zhong, T.; Zhang, X.; Cheng, M.; Li, X. Assessment of cadmium (Cd) concentration in arable soil in China. Environ. Sci. Pollut. Res. 2015, 22, 4932–4941. [Google Scholar] [CrossRef]
- Zhang, X.; Zhong, T.; Chen, D.; Cheng, M.; Liu, L.; Zhang, X.; Li, X. Assessment of arsenic (As) occurrence in arable soil and its related health risk in China. Environ. Geochem. Health 2016, 38, 691–702. [Google Scholar] [CrossRef]
- Zhang, X.; Zhong, T.; Liu, L.; Ouyang, X. Impact of soil heavy metal pollution on food safety in China. PLoS ONE 2015, 10, e0135182. [Google Scholar] [CrossRef] [Green Version]
- Zhang, X.; Zhong, T.; Liu, L.; Zhang, X.; Cheng, M.; Li, X.; Jin, J. Chromium occurrences in arable soil and its influence on food production in China. Environ. Earth Sci. 2016, 75, 257. [Google Scholar] [CrossRef]
- D’Emilio, M.; Caggiano, R.; Macchiato, M.; Ragosta, M.; Sabia, S. Soil heavy metal contamination in an industrial area: Analysis of the data collected during a decade. Environ. Monit. Assess. 2013, 185, 5951–5964. [Google Scholar] [CrossRef] [PubMed]
- Magistad, O.C. The aluminum content of the soil solution and its relation to soil reaction and plant growth. Soil Sci. 1925, 20, 181–226. [Google Scholar] [CrossRef]
- Curtin, D.; Smillie, G. Effects of incubation and pH on soil solution and exchangeable cation ratios. Soil Sci. Soc. Am. J. 1995, 59, 1006–1011. [Google Scholar] [CrossRef]
- Perdue, E.M. Acidic Functional Groups of Humic Substances. In Humic Substances in Soil, Sediment, and Water: Geochemistry, Isolation, and Characterization; Aiken, G.R., Ed.; Wiley: New York, NY, USA, 1985; pp. 493–526. ISBN 04-718-82747. [Google Scholar]
- Saaty, T.L.; Vargas, L.G. Hierarchical Analysis of Behavior in Competition: Prediction in Chess. Behav. Sci. 1980, 25, 18–191. [Google Scholar] [CrossRef]
- Abuzaid, A.S.; Abdellatif, A.D.; Fadl, M.E. Modeling soil quality in Dakahlia Governorate, Egypt using GIS techniques. Egypt. J. Remote Sens. Space Sci. 2021, 24, 255–264. [Google Scholar] [CrossRef]
- Barman, A.; Basak, N.; Narjary, B.; Mitran, T. Land degradation assessment using geospatial techniques. In Geospatial Technologies for Crops and Soils; Springer: Amsterdam, The Netherlands, 2021; pp. 421–453. [Google Scholar]
- Ostovari, Y.; Honarbakhsh, A.; Sangoony, H.; Zolfaghari, F.; Maleki, K.; Ingram, B. GIS and multi-criteria decision-making analysis assessment of land suitability for rapeseed farming in calcareous soils of semi-arid regions. Ecol. Indic. 2019, 103, 479–487. [Google Scholar] [CrossRef]
- IUSS Working Group WRB. World Reference Base for Soil Resources 2014, Update 2015: International Soil Classification System for Naming Soils and Creating Legends for Soil Maps; World Soil Resources Reports No. 106; Food and Agriculture Organization of the United Nations: Rome, Italy, 2015. [Google Scholar]
- Saaty, T.L. A scaling method for priorities in hierarchical structures. J. Math. Psychol. 1977, 15, 234–281. [Google Scholar] [CrossRef]
- Saaty, T.L. What is the analytic hierarchy process? In Mathematical Models for Decision Support; Springer: Amsterdam, The Netherlands, 1988; pp. 109–121. [Google Scholar]
- Saaty, T.L. Fundamentals of Decision Making and Priority Theory with the Analytic Hierarchy Process; RWS Publications: Pittsburgh, PA, USA, 2000. [Google Scholar]
- Murphy, E.M.; Zachara, J.M.; Smith, S.C.; Phillips, J.L. The sorption of humic acids to mineral surfaces and their role in contaminant binding. Sci. Total Environ. 1992, 117, 413–423. [Google Scholar] [CrossRef]
- Welhouse, G.J.; Bleam, W.F. NMR spectroscopic investigation of hydrogen bonding in atrazine. Environ. Sci. Technol. 1992, 26, 959–964. [Google Scholar] [CrossRef]
- Baskaran, S.; Bolan, N.; Rahman, A.; Tillman, R. Pesticide sorption by allophanic and non-allophanic soils of New Zealand. N. Z. J. Agric. Res. 1996, 39, 297–310. [Google Scholar] [CrossRef] [Green Version]
- Đurović, R.; Gajić-Umiljendić, J.; Đorđević, T. Effects of organic matter and clay content in soil on pesticide adsorption processes. Pestic. Fitomed. 2009, 24, 51–57. [Google Scholar] [CrossRef]
- Barriuso, E.; Baer, U.; Calvet, R. Dissolved organic matter and adsorption-desorption of dimefuron, atrazine, and carbetamide by soils. J. Environ. Qual. 1992, 21, 359–367. [Google Scholar] [CrossRef]
- Rahman, M.; Lee, S.-H.; Ji, H.C.; Kabir, A.H.; Jones, C.S.; Lee, K.-W. Importance of mineral nutrition for mitigating aluminum toxicity in plants on acidic soils: Current status and opportunities. Int. J. Mol. Sci. 2018, 19, 3073. [Google Scholar] [CrossRef] [PubMed] [Green Version]
- Kryzevicius, Z.; Karcauskiene, D.; Álvarez-Rodríguez, E.; Zukauskaite, A.; Slepetiene, A.; Volungevicius, J. The effect of over 50 years of liming on soil aluminium forms in a Retisol. J. Agric. Sci. 2019, 157, 12–19. [Google Scholar] [CrossRef]
- Meriño-Gergichevich, C.; Alberdi, M.; Ivanov, A.; Reyes-Díaz, M. Al3+-Ca2+ interaction in plants growing in acid soils: Al-phytotoxicity response to calcareous amendments. J. Soil Sci. Plant Nutr. 2010, 10, 217–243. [Google Scholar]
- Hargrove, W.; Thomas, G. Effect of organic matter on exchangeable aluminum and plant growth in acid soils. Chem. Soil Environ. 1981, 40, 151–166. [Google Scholar]
- Evans, C.E.; Kamprath, E. Lime response as related to percent Al saturation, solution Al, and organic matter content. Soil Sci. Soc. Am. J. 1970, 34, 893–896. [Google Scholar] [CrossRef]
- Sathyaseelan, N.; Karthika, K.S. Aluminium toxicity in soil and plants. HARIT DHARA 2019, 2, 15–19. [Google Scholar]
- Navia, R. Environmental Use of Volcanic Soil as Natural Adsorption Material; University of Leoben: Leoben, Austria, 2004. [Google Scholar]
- FAO. Guidelines for Soil Description; FAO: Rome, Italy, 2006. [Google Scholar]
- Ghazali, M.F.; Wikantika, K.; Harto, A.B.; Kondoh, A. Generating soil salinity, soil moisture, soil pH from satellite imagery and its analysis. Inf. Processing Agric. 2020, 7, 294–306. [Google Scholar] [CrossRef]
- Rząsa, S.; Owczarzak, W. Methods for the granulometric analysis of soil for science and practice. Pol. J. Soil Sci. 2015, 46, 1. [Google Scholar]
- Al-Busaidi, A.; Cookson, P.; Yamamoto, T. Methods of pH determination in calcareous soils: Use of electrolytes and suspension effect. Soil Res. 2005, 43, 541–545. [Google Scholar] [CrossRef]
- Walkley, A.; Black, I.A. An examination of the Degtjareff method for determining soil organic matter, and a proposed modification of the chromic acid titration method. Soil Sci. 1934, 37, 29–38. [Google Scholar] [CrossRef]
- McLean, E. Aluminum. Methods Soil Anal. Part 2 Chem. Microbiol. Prop. 1965, 9, 978–998. [Google Scholar]
- Chen, Y.; Yu, J.; Khan, S. Spatial sensitivity analysis of multi-criteria weights in GIS-based land suitability evaluation. Environ. Model. Softw. 2010, 25, 1582–1591. [Google Scholar] [CrossRef]
- Bojórquez-Quintal, E.; Escalante-Magaña, C.; Echevarría-Machado, I.; Martínez-Estévez, M. Aluminum, a friend or foe of higher plants in acid soils. Front. Plant Sci. 2017, 8, 1767. [Google Scholar] [CrossRef]
- Singh, S.; Tripathi, D.K.; Singh, S.; Sharma, S.; Dubey, N.K.; Chauhan, D.K.; Vaculík, M. Toxicity of aluminium on various levels of plant cells and organism: A review. Environ. Exp. Bot. 2017, 137, 177–193. [Google Scholar] [CrossRef]
- Kisnierienė, V.; Lapeikaitė, I. When chemistry meets biology: The case of aluminium—A review. Chemija 2015, 26, 148–158. [Google Scholar]
- Vitorello, V.A.; Capaldi, F.R.; Stefanuto, V.A. Recent advances in aluminum toxicity and resistance in higher plants. Braz. J. Plant Physiol. 2005, 17, 129–143. [Google Scholar] [CrossRef]
- Nabiollahi, K.; Golmohamadi, F.; Taghizadeh-Mehrjardi, R.; Kerry, R.; Davari, M. Assessing the effects of slope gradient and land use change on soil quality degradation through digital mapping of soil quality indices and soil loss rate. Geoderma 2018, 318, 16–28. [Google Scholar] [CrossRef]
- Ostovari, Y.; Ghorbani-Dashtaki, S.; Bahrami, H.-A.; Naderi, M.; Dematte, J.A.M.; Kerry, R. Modification of the USLE K factor for soil erodibility assessment on calcareous soils in Iran. Geomorphology 2016, 273, 385–395. [Google Scholar] [CrossRef]
- Seyedmohammadi, J.; Sarmadian, F.; Jafarzadeh, A.A.; McDowell, R.W. Development of a model using matter element, AHP and GIS techniques to assess the suitability of land for agriculture. Geoderma 2019, 352, 80–95. [Google Scholar] [CrossRef]
- Taghizadeh-Mehrjardi, R.; Nabiollahi, K.; Rasoli, L.; Kerry, R.; Scholten, T. Land suitability assessment and agricultural production sustainability using machine learning models. Agronomy 2020, 10, 573. [Google Scholar] [CrossRef]
- Mokarram, M.; Aminzadeh, F. GIS-based multicriteria land suitability evaluation using ordered weight averaging with fuzzy quantifier: A case study in Shavur Plain, Iran. Int. Arch. Photogramm. Remote Sens. Spat. Inf. Sci. 2010, 38, 508–512. [Google Scholar]
- Kuria, D.; Ngari, D.; Waithaka, E. Using geographic information systems (GIS) to determine land suitability for rice crop growing in the Tana delta. J. Geogr. Reg. Plan. 2011, 4, 525–532. [Google Scholar]
- Mesgaran, M.B.; Madani, K.; Hashemi, H.; Azadi, P. Iran’s land suitability for agriculture. Sci. Rep. 2017, 7, 7670. [Google Scholar] [CrossRef]
- Kazemi, H.; Akinci, H. A land use suitability model for rainfed farming by Multi-criteria Decision-making Analysis (MCDA) and Geographic Information System (GIS). Ecol. Eng. 2018, 116, 1–6. [Google Scholar] [CrossRef]
- Zolekar, R.B.; Bhagat, V.S. Multi-criteria land suitability analysis for agriculture in hilly zone: Remote sensing and GIS approach. Comput. Electron. Agric. 2015, 118, 300–321. [Google Scholar] [CrossRef]
- Huang, Y.; Chen, Q.; Deng, M.; Japenga, J.; Li, T.; Yang, X.; He, Z. Heavy metal pollution and health risk assessment of agricultural soils in a typical peri-urban area in southeast China. J. Environ. Manag. 2018, 207, 159–168. [Google Scholar] [CrossRef]
- Zang, F.; Wang, S.; Nan, Z.; Ma, J.; Zhang, Q.; Chen, Y.; Li, Y. Accumulation, spatio-temporal distribution, and risk assessment of heavy metals in the soil-corn system around a polymetallic mining area from the Loess Plateau, northwest China. Geoderma 2017, 305, 188–196. [Google Scholar] [CrossRef]
- Marrugo-Negrete, J.; Pinedo-Hernández, J.; Díez, S. Assessment of heavy metal pollution, spatial distribution and origin in agricultural soils along the Sinú River Basin, Colombia. Environ. Res. 2017, 154, 380–388. [Google Scholar] [CrossRef] [PubMed]
- Chen, H.; An, J.; Wei, S.; Gu, J. Spatial patterns and risk assessment of heavy metals in soils in a resource-exhausted city, Northeast China. PLoS ONE 2015, 10, e0137694. [Google Scholar] [CrossRef] [PubMed]
- Xia, F.; Zhu, Y.; Hu, B.; Chen, X.; Li, H.; Shi, K.; Xu, L. Pollution Characteristics, Spatial Patterns, and Sources of Toxic Elements in Soils from a Typical Industrial City of Eastern China. Land 2021, 10, 1126. [Google Scholar] [CrossRef]


| Sample | Sampling Depth (cm) | Soil Type | Soil Grain Size | pH H2O | pH KCl | Al3+ (meq/100 g) | Total (%) | ||||
|---|---|---|---|---|---|---|---|---|---|---|---|
| 0.2–2 mm | 0.02–0.2 mm | 0.002–0.02 mm | <0.002 mm | OM | Al | ||||||
| F1-10 | 10 | Luvisols | 1.514 | 17.49 | 13.576 | 67.419 | 5.2 | 3.26 | 4.72 | 3.945 | 0.473 |
| F1-20 | 20 | Luvisols | 3.26 | 6.255 | 4.281 | 1.69 | |||||
| F1-50 | 50 | Luvisols | 3.65 | 1.217 | 2.887 | 9.587 | |||||
| F4-10 | 10 | Luvisols | 27.818 | 13.43 | 8.654 | 50.096 | 6.1 | 4.31 | 0.034 | 2.512 | 1.74 |
| F4-20 | 20 | Luvisols | 4.42 | 0.016 | 2.407 | 1.119 | |||||
| F5-10 | 10 | Luvisols | 24.908 | 12.51 | 8.708 | 53.873 | 5.6 | 3.63 | 1.147 | 2.551 | 6.62 |
| F5-20 | 20 | Luvisols | 3.6 | 1.019 | 1.558 | 7.193 | |||||
| F5-50 | 50 | Luvisols | 4.36 | 0.047 | 2.05 | 2.764 | |||||
| F6-10 | 10 | Luvisols | 56.628 | 1.82 | 1.509 | 40.039 | 5 | 4.73 | 0.005 | 5.911 | 2.192 |
| F6-10-2 | 10 | Luvisols | 4.28 | 0.012 | 7.844 | 2.507 | |||||
| F6-20-2 | 20 | Luvisols | 4.75 | 0.001 | 6.528 | 1.182 | |||||
| F10-10 | 10 | Luvisols | 2.227 | 21.14 | 16.917 | 59.715 | 6.75 | 4.34 | 0.002 | 5.103 | 7.293 |
| F10-20 | 20 | Luvisols | 4.23 | 0.005 | 5.036 | 3.756 | |||||
| F7-10 | 10 | Ferralsols | 41.394 | 18.82 | 13.737 | 26.017 | 5.6 | 3.9 | 0.951 | 1.785 | 9.276 |
| F7-20 | 20 | Ferralsols | 3.9 | 0.786 | 2.593 | 12.724 | |||||
| F7-50 | 50 | Ferralsols | 3.86 | 1.426 | 3.317 | 12.384 | |||||
| F3-10 | 10 | Ferralsols | 1.322 | 34.56 | 11.499 | 52.618 | 6.25 | 4.46 | 0.001 | 2.947 | 0.613 |
| F3-20 | 20 | Ferralsols | 3.09 | 5.49 | 2.102 | 5.701 | |||||
| F3-50 | 50 | Ferralsols | 4.17 | 0.185 | 2.261 | 10.462 | |||||
| R-S1-10 | 10 | Ferralsols | 12.520 | 15.150 | 0.760 | 71.570 | 6.7 | 4.880 | 0.160 | 4.490 | 4.320 |
| R-S2-10 | 10 | Ferralsols | 14.250 | 10.380 | 2.070 | 73.300 | 6.5 | 4.600 | 0.290 | 5.350 | 6.930 |
| R-S3-10 | 10 | Ferralsols | 14.510 | 18.500 | 0.300 | 66.690 | 6.4 | 4.630 | 0.160 | 4.280 | 6.910 |
| Criteria | Factors | Standardized Value | References | |||
|---|---|---|---|---|---|---|
| 1 | 2 | 3 | 4 | |||
| Soil Al3+ retention capability | Soil pH | pH ≥ 6 | 5 < pH < 6 | 4.5 < pH ≤ 5.0 | 3 < pH ≤ 4.5 | Data from this study, [54,55,56,57] |
| Ferrallitisation | Luvisols, Gleysols | Acrisols | Ferralsols | Ferralsols | Soil experts’ opinions | |
| Organic matter | OM < 2% | 2% < OM < 3% | 3% < OM < 5% | OM > 5% | Data from this study, [3,40,43] | |
| Soil texture | Sand | Loam | Clay loam | Clay | [9,40] | |
| Soil Al3+ transportation capability | Soil pH | pH ≥ 6 | 5 < pH < 6 | 4.5 < pH ≤ 5.0 | 3 < pH ≤ 4.5 | Soil experts’ opinions |
| Soil texture | Clay | Clay loam | Loam | Sand | Soil experts’ opinions, [9,40] | |
| Soil slope | 0° | 0–10° | >10° | Soil experts’ opinions, [30,58,59,60,61] | ||
| Organic matter | OM >5% | 3% < OM < 5% | 2% < OM < 3% | OM < 2% | Data from this study, [43] | |
| Retention Capability | |||||
| Soil pH | Ferrallitisation | Organic Matter | Soil Texture | Weight | |
| Soil pH | 1 | 3 | 4 | 1 | 0.4 |
| Ferrallitisation | 1/3 | 1 | 2 | 1 | 0.2 |
| Organic matter | 1/4 | 1/2 | 1 | 1/3 | 0.1 |
| Soil texture | 1 | 1 | 3 | 1 | 0.3 |
| SUM | 2.583 | 5.5 | 10 | 3.333 | 1 |
| Transportation Capability | |||||
| Soil pH | Soil texture | Soil slope | Organic matter | Weight | |
| Soil pH | 1 | 1/5 | 1/2 | 2 | 0.12 |
| Soil texture | 5 | 1 | 3 | 3 | 0.52 |
| Soil slope | 2 | 1/3 | 1 | 6 | 0.28 |
| Organic matter | 1/2 | 1/3 | 1/6 | 1 | 0.08 |
| SUM | 8.5 | 1.867 | 4.667 | 12 | 1 |
| Soil reSoil Retention Capability of Al3+ | ||||
| Total area | Agricultural area | |||
| Area (ha) | Area (%) | Area (ha) | Area (%) | |
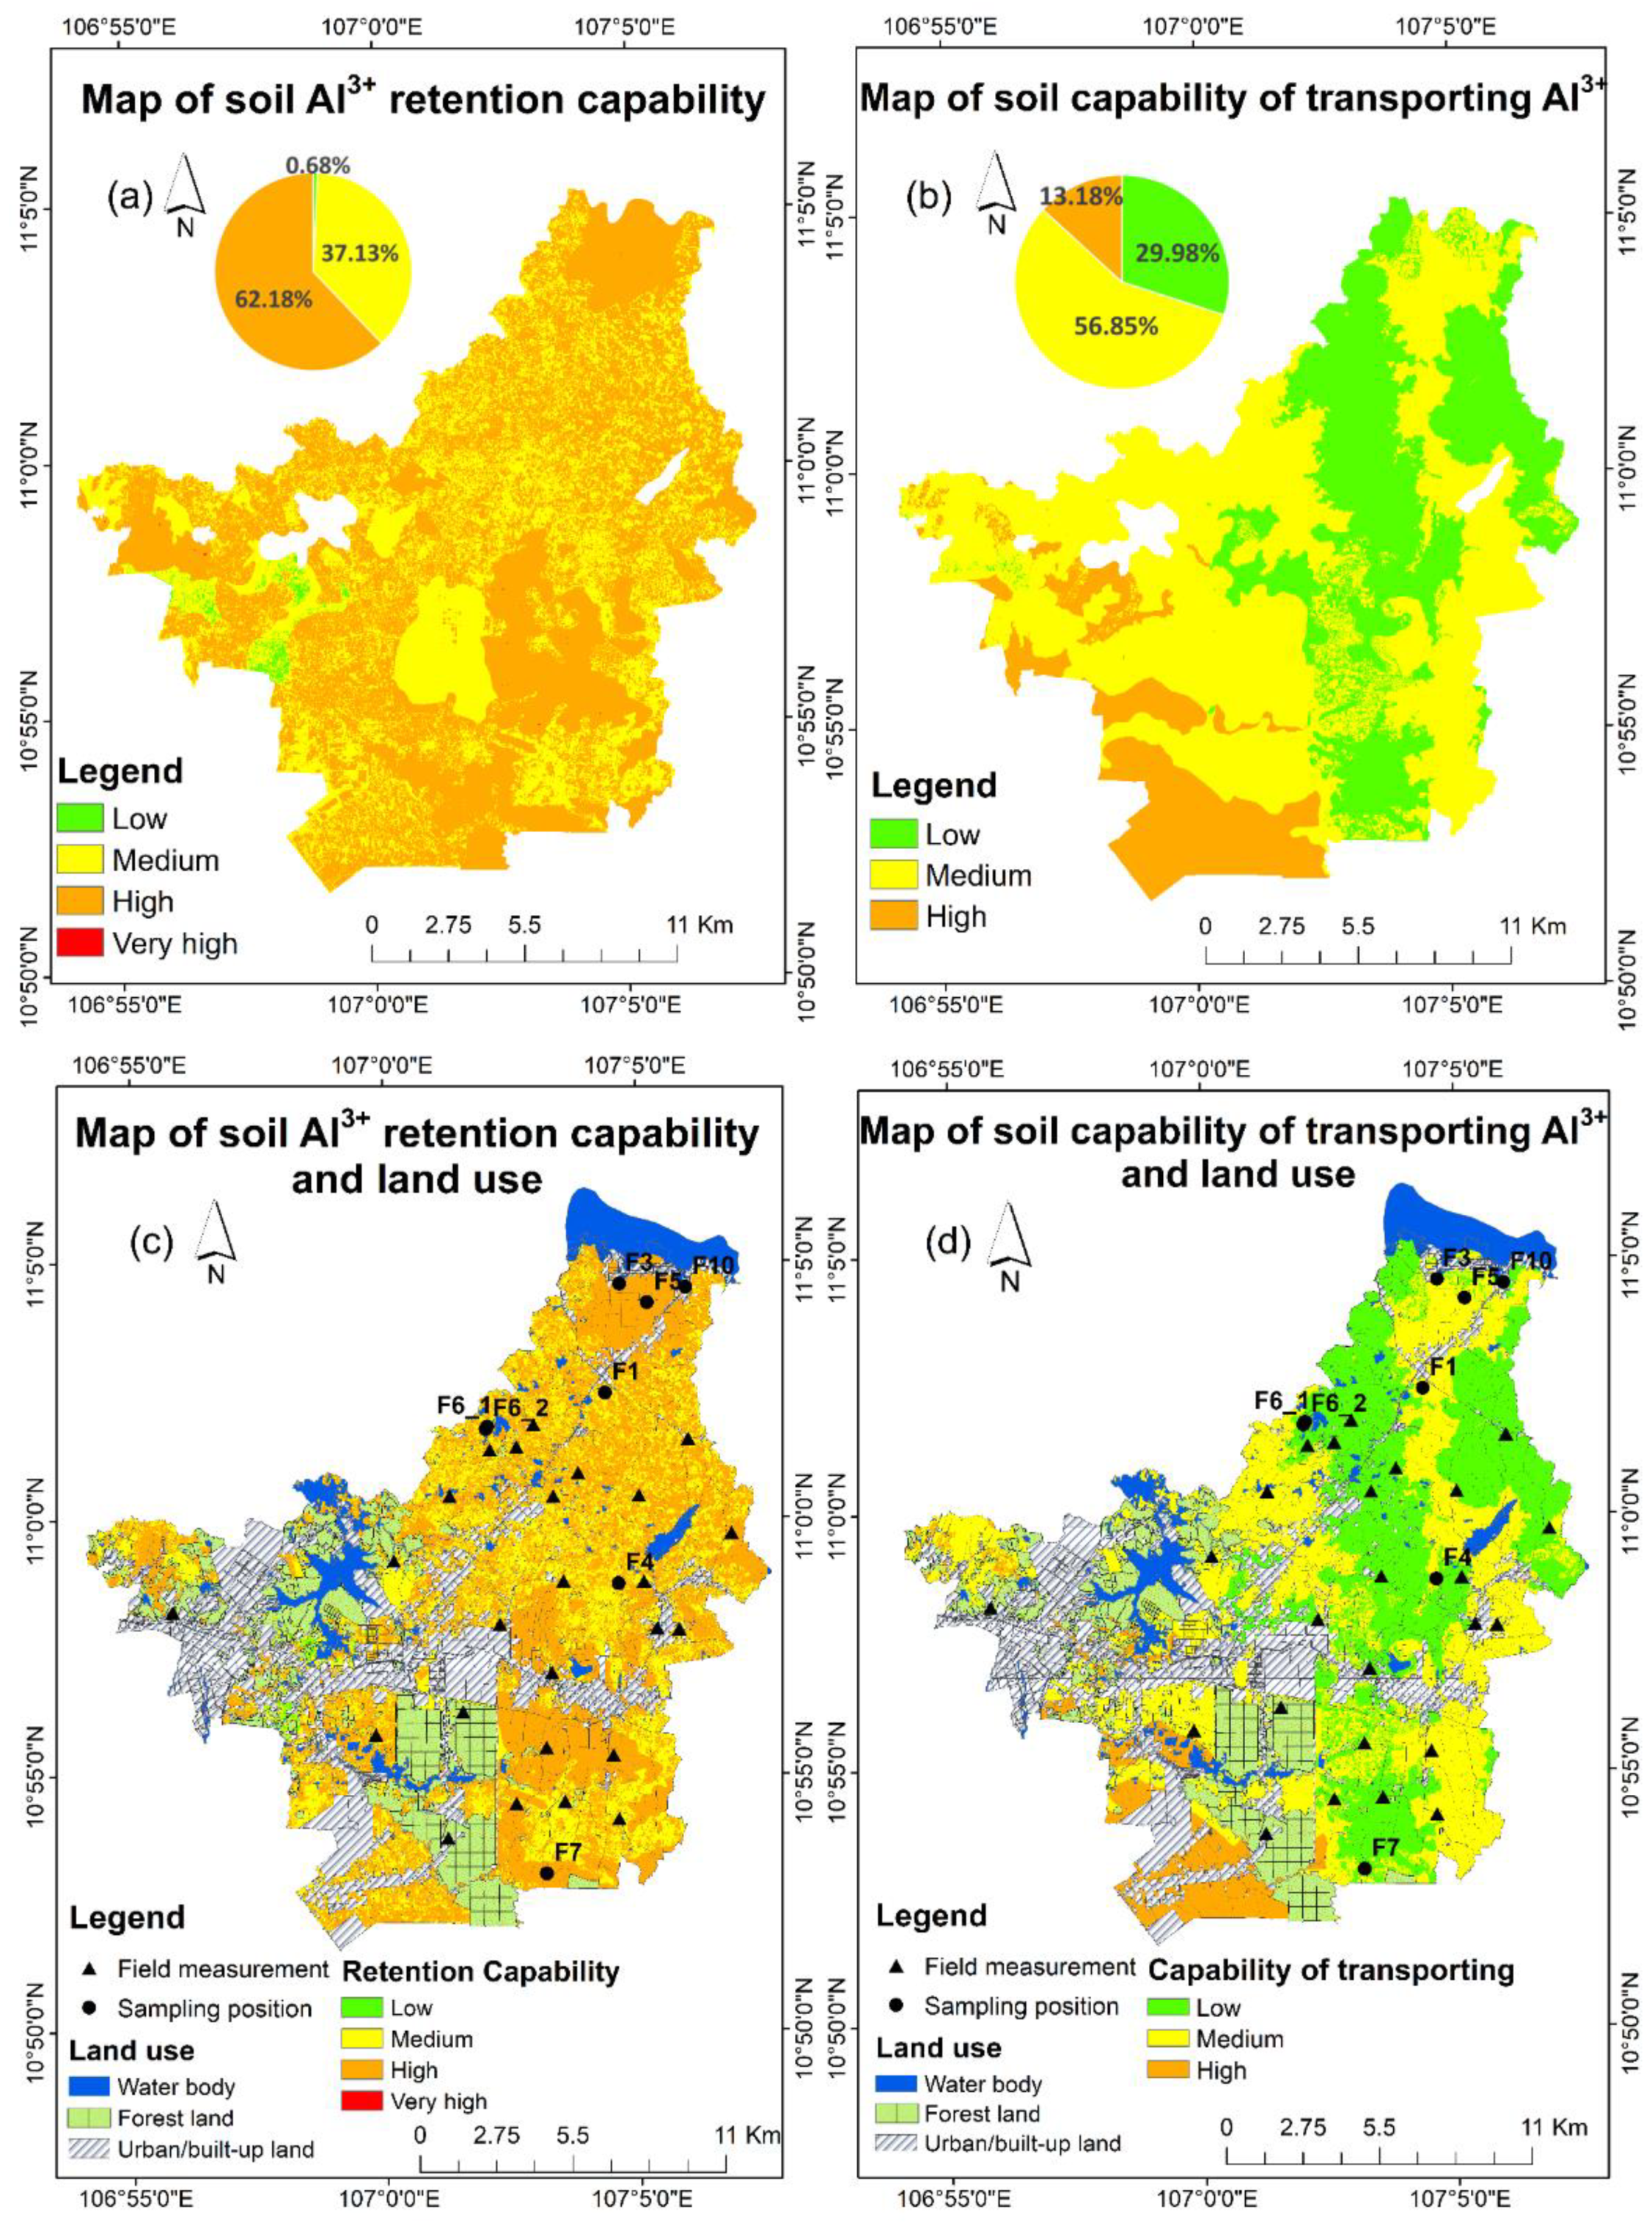
| S1 | 212.5 | 0.68 | 53.93 | 0.28 |
| S2 | 11,566.13 | 37.13 | 6761.58 | 35.65 |
| S3 | 19,370.27 | 62.18 | 12,150.27 | 64.06 |
| S4 | 4.21 | 0.014 | 1.7 | 0.009 |
| SUM | 31,153.11 | 100 | 18,967.48 | 100 |
| Soil Transportation Capability of Al3+ | ||||
| Total area | Agricultural area | |||
| Area (ha) | Area (%) | Area (ha) | Area (%) | |
| S1 | 9331.471 | 29.98 | 7969.81 | 42.03 |
| S2 | 17,695.52 | 56.85 | 9425.94 | 49.71 |
| S3 | 4101.4 | 13.18 | 1565.03 | 8.25 |
| SUM | 31,128.39 | 100 | 18,960.78 | 100 |
Publisher’s Note: MDPI stays neutral with regard to jurisdictional claims in published maps and institutional affiliations. |
© 2022 by the authors. Licensee MDPI, Basel, Switzerland. This article is an open access article distributed under the terms and conditions of the Creative Commons Attribution (CC BY) license (https://creativecommons.org/licenses/by/4.0/).
Share and Cite
Nguyen, A.; Nguyen, T.T.; Nguyen, D.K.; Richter, O.; Do, H.T.T. Management of Al3+ Residue in the Soil by Mapping Soil Capability in Retaining and Transporting Al3+ in the Farmland of Trang Bom District, Vietnam. Agronomy 2022, 12, 1243. https://doi.org/10.3390/agronomy12051243
Nguyen A, Nguyen TT, Nguyen DK, Richter O, Do HTT. Management of Al3+ Residue in the Soil by Mapping Soil Capability in Retaining and Transporting Al3+ in the Farmland of Trang Bom District, Vietnam. Agronomy. 2022; 12(5):1243. https://doi.org/10.3390/agronomy12051243
Chicago/Turabian StyleNguyen, Anh, Truc T. Nguyen, Dang Khue Nguyen, Otto Richter, and Huyen Thi Thu Do. 2022. "Management of Al3+ Residue in the Soil by Mapping Soil Capability in Retaining and Transporting Al3+ in the Farmland of Trang Bom District, Vietnam" Agronomy 12, no. 5: 1243. https://doi.org/10.3390/agronomy12051243
APA StyleNguyen, A., Nguyen, T. T., Nguyen, D. K., Richter, O., & Do, H. T. T. (2022). Management of Al3+ Residue in the Soil by Mapping Soil Capability in Retaining and Transporting Al3+ in the Farmland of Trang Bom District, Vietnam. Agronomy, 12(5), 1243. https://doi.org/10.3390/agronomy12051243