Article

Multiple Introductions of Moniliophthora roreri from the Amazon to the Pacific Region in Ecuador and Shared High Azoxystrobin Sensitivity

by
Fernando Espinoza-Lozano
1,
Darlyn Amaya-Márquez
2,3,
C. Miguel Pinto
4,
Mirian Villavicencio-Vásquez
1,
Daynet Sosa del Castillo
2 and
Simón Pérez-Martínez
5,*
1
Centro de Investigaciones Biotecnológicas del Ecuador, Escuela Superior Politécnica del Litoral (ESPOL), Campus Gustavo Galindo Km. 30.5 Vía Perimetral, Guayaquil P.O. Box 091050, Ecuador
2
Facultad de Ciencias de la Vida, Escuela Superior Politécnica del Litoral (ESPOL), Campus Gustavo Galindo Km. 30.5 Vía Perimetral, Guayaquil P.O. Box 09015863, Ecuador
3
Facultad de Ciencias Agrarias, Carrera de Ingeniería Agronómica, Universidad Agraria del Ecuador, Guayaquil P.O. Box 200350, Ecuador
4
Charles Darwin Research Station, Charles Darwin Foundation, Puerto Ayora P.O. Box 200350, Ecuador
5
Facultad de Ciencias e Ingeniería, Universidad Estatal de Milagro (UNEMI), Milagro P.O. Box 091050, Ecuador
*
Author to whom correspondence should be addressed.
Agronomy 2022, 12(5), 1119; https://doi.org/10.3390/agronomy12051119
Submission received: 8 April 2022 / Revised: 23 April 2022 / Accepted: 26 April 2022 / Published: 6 May 2022
(This article belongs to the Section Pest and Disease Management)

Abstract

:
One of the main problems in the production of cacao in Ecuador is the disease caused by the fungus Moniliophthora roreri (frosty pod rot) which affects the pods. Here, we evaluate the genetic diversity of this fungus in Ecuador, and its sensitivity to the fungicide azoxystrobin. We evaluated 76 monosporic cultures from the Amazon and the Pacific coast regions. In vitro sensitivity assays tested several doses of the fungicide azoxystrobin to determine the percent of growth inhibition and the IC50. Concentrations of 1 to 0.1 µg mL−1 inhibited the growth of at least 91% of the isolates. Three isolates were the less sensitive (IC50 = 0.0220–0.0364 µg mL−1), two from Guayas (Pacific coast) and one from Sucumbíos (Amazon) provinces. However, M. roreri is highly sensitive, and it could be used in integrated management of the disease. Genetic analyses were carried out by amplifying microsatellite markers (SSR). All the genetic diversity statistics show a higher diversity in the Amazon compared to samples of the coast region; however, the molecular variance was low (FST = 0.11). Discriminant analysis clearly distinguishes three clusters concurrent with the provinces (Sucumbíos, Orellana and El Oro) and a group with the rest of the provinces. Minimum spanning networks shows, unexpectedly, that M. roreri from the coast were derived from at least three independent introductions from the Amazon. Findings are discussed in light of previous Pan-American genetic studies and available historical reports.

1. Introduction

The frosty pod rot (FPR) is caused by Moniliophthora roreri and is, along with the witches’ broom (M. perniciosa), the most destructive disease of the cacao crop (Theobroma cacao) in Ecuador [1,2,3]. The disease is reported in the main cacao-producing countries from Latin America [4,5], but it had not yet been reported in Brazil. On the other hand, FPR has been observed in cupuazú (T. grandiflorum) in the Venezuelan Amazon, near the border with Brazil [6]. The establishment of the disease in new areas of Latin America and Africa is a matter of time due to known factors of the epiphytiology: (i) lack of useful resistance sources in production clones, (ii) homogeneity of susceptible and highly productive cacao clones and (iii) the mobility of people at a global level. These aspects have been verified through the pandemic distribution of the causal agent of the Panama disease in bananas [7].
Since the first reports of FPR in Ecuador [8], the control of the disease has been a main concern of the producers of the Pacific coastal region, the western side of the Andes Mountains. The Ecuadorian cacao production is centered in four provinces of the Pacific coast (Guayas, Los Ríos, Manabí, and Esmeraldas), although it is cultivated in 20 of the 24 Ecuadorian provinces [9]. The losses caused by FPR reported in the Pacific coast region were 40% of the total production by the end of the 1940s, although between March and May of some years, they could reach 98% [2]. At that time, cacao plantations in the Amazon region, the eastern side of the Andes, of Ecuador were insignificant [2]. Currently, it is reported that in Ecuador the damage reaches 80% and more [3,10]. In the Amazonian provinces Sucumbíos, Orellana, and Napo, more than 40% of the production, about 8000 tons of cacao, can be lost due to the FPR [11].
Chemical control of FPR in producing countries is little reported. Doing it only through agronomic tactics is economically unfeasible for small producers due to labor costs and the instability of cacao prices [12,13,14]. However, experimentally it has been demonstrated that effectively keeping damage levels below the economic threshold requires chemical control and other tactics together [12]. The use of azoxystrobin has been reported effective in recent outbreaks of the disease in Mexico [14], Costa Rica, and Peru [15,16]. Azoxystrobin is a systemic fungicide from the strobilurin analogs group [17]; however, it has shown its curative properties in the field [14]. The fungicides based on azoxystrobin are used to control basidiomycetes [18]. In the case of cacao, they are efficient in reducing both FPR and witches’ broom (M. perniciosa) [13].
The origin of T. cacao has been established in the upper Amazon tributaries region, where it displays its greatest genetic diversity [19]. The oldest evidence of domestication was reported in Southern Ecuador, where the pulp of the seeds was consumed fresh, as a juice, or as a fermented alcoholic beverage 5300 years ago [20]. Although the oldest report of chocolate powder comes from Central America, it was used as a drink at least 3100 years ago [21]. The origin of M. roreri was established in the upper Magdalena Valley of Colombia [22,23]. This region showed the highest levels of genetic diversity, with twenty distinct genotypes, of which thirteen were limited to this region. Both centers of origin are separated by about 1200 km in a straight line.
Studies of population biology of M. roreri shows a recent spread from its center of origin due to the decrease in genetic diversity as it moves away towards Peru or Central America [23]. Furthermore, its distribution pattern suggests that this infectious agent is in an invasive phase [24]. Three genetic groups of M. roreri are known in Ecuador. They are called I (isolated from T. gileri in the Highland), IV (obtained from T. cacao, in the coast), and V (from T. bicolor and T. cacao, in the Amazon region) [23]. This information originated from isolates collected in the period 1999–2000, plus two isolates from 1977. There were thirty-six isolates analyzed from Ecuador and fifty-eight from other seven countries of South and Central America. Discrimination among provinces was reported, according to discriminant analyzes of the ITS-RFLP band profile [25].
Information on the genetic structure of pathogens contributes to (i) directing genetic improvement programs based on the prevalence of one or another pathotype in production areas, (ii) creating efficiency in disease control either by chemical or biological means, and (iii) predicting the emergence of new pathotypes. The goal of this research aim was to determine the population genetic structure of M. roreri in Ecuador. Emphasizing the influence of the geographic origin and associating it with the sensitivity to a fungicide as a disease management option. Here, we show that the Pacific coastal population originates from the Amazon and that both populations are highly sensitive to azoxystrobin, with some minor tolerance present in isolates from both regions.

2. Materials and Methods

2.1. Isolation of M. roreri Strains and Monosporic Cultures

The M. roreri strains were isolated from cacao pods with signs of the disease and affected by less than 25%. The samples were collected during 2019 in six provinces of the Amazon region (Sucumbíos, Orellana, Morona Santiago, Napo, Pastaza, and Zamora-Chinchipe) and three provinces from the Pacific coast region (El Oro, Los Ríos, and Guayas). For details see Supplementary Table S1. After detaching the fruits, they were wrapped in newspaper. During the sampling trips, at night and in the morning of the following day, each fruit’s wrapping was changed to reduce humidity and sporulation of M. roreri. Next, the pods were taken to the laboratory to be processed (washed, cut in ~0.5 cm2 segments, disinfected with 70% alcohol and 2% sodium hypochlorite for 2 min, washed with sterile distilled water and dried with sterile paper). The segments were then placed onto potato dextrose agar medium (PDA) and incubated in darkness (27 °C/4 d). After the incubation time, the mycelial growth of M. roreri was transferred to fresh PDA incubated for 11 days. As a result, 76 monosporic cultures were obtained according to the recommendations described [26]. All the isolates are conserved in the Culture Collection of Microorganism of the Ecuadorian Centre of Biotechnological Researches (CCM-CIBE 1151, accessed on 7 April 2022. http://ccinfo.wdcm.org/index.php/collection/by_id/1151/) [27].

2.2. M. roreri’s Sensitivity to Azoxystrobin

A preliminary test was conducted with two isolates to estimate adequate concentrations. The in vitro sensitivity to azoxystrobin (Sigma Aldrich; ≥98% PESTANAL® analytical standard grade) on the mycelial growth of M. roreri was evaluated at concentrations of 1, 0.1, 0.01, 0.001, 0.0001 µg mL−1 of the fungicide in PDA with four replicates for each treatment. One 5 mm disk of the M. roreri isolates was transferred onto the PDA, amended with the fungicide, and incubated as described before for six days. After the inoculation time, the mycelial growth was evaluated as percent of growth inhibition PGI = ((R1 − R2)/R1) × 100, where R1 is the radius of the control pathogen and R2 is the pathogen with diluted crude extracts. Inhibitory concentrations 50% (IC50) were estimated from the growth data of each isolate (3–4 replicates) using Prism 6 software (GraphPad).

2.3. DNA Extraction and Amplification of Simple Sequence Repeats (Microsatellite Markers SSRs)

DNA was extracted from M. roreri mycelium grown for 11 days in a PDA [28]. Twelve primers were used, 10 from [29] (primers mr-6, mr-10, mr-11, mr-12, mr-13, mr-15, mr-22, mr-30, mr-31 and mr-33) and two from [23] (primers 816 and 890). The final reaction volume was 25 µL, containing the following mixture: 12.5 µL of Go Taq® Green Master mix combined with 0.5 µL of each primer, 2 µL of DNA (30 ng/µL), and 9.5 µL of bi-distilled water. The PCR program consisted of an initial denaturation (4 min/94 °C), followed by 12 touchdown cycles of 40 s/94 °C, 40 s/60 °C, and 1 min/72 °C, decreasing 1 °C per cycle to 48 °C. It ended with 10 cycles of 4 min/94 °C, 1 min/48 °C, and 1 min/72 °C. A final extension of 4 min/72 °C, finishing with 20 cycles of 4 min/94 °C; 1 min/48 °C; 1 min/72 °C, and a final extension of 4 min/72 °C. This procedure was executed with all loci, except for primers MR10 and MR15 that used an annealing temperature of 56 °C. The amplified products were separated on high-resolution agarose gels at 3% (Agarose SFRTM) and the size of each allele was estimated using a 25 bp Mixed DNA Ladder (Bioneer).

2.4. Sensitivity and Genetic Analyses

PGI data were analyzed using descriptive statistics, analysis of variance, and cluster analysis. IC50 data by cluster analysis. A matrix of 76 isolates and four concentrations (except 1 µg mL−1) was used in a cluster analysis (InfoStat software v29-09-2020). method Average linkage/ distance Euclidean
The microsatellite profiles were determined using 12 SSR markers (Supplementary Table S2). The database was elaborated with the number of alleles per marker and sample and the base pair sizes. The analyzed collection showed results between zero and seven alleles. Based on the molecular weights for each locus, the number of alleles per marker and per sample was determined. With these data, the following were calculated: the Allele Frequency f(A), the polymorphism information content (PIC), the fixation index (FST), and the Nei expected heterozygosity (HS). The results were obtained using GenAlex (v. 6.51) and Fstat (v. 2.9.4). The molecular variance analysis (AMOVA) was calculated with 9999 permutations to know the genetic variation within and between populations. Data was prepared in the GenAlEx format, separating the samples among provinces and two regions (Amazon and coast). The analyses were performed in R [30]. Genetic diversity estimates were obtained with the function poppr [31]. A discriminant analysis principal components (DAPC) was conducted by provinces [32]. Additionally, a minimum-spanning network (MSN) by regions was performed using Provesti distances with the poppr.msn function [31].

3. Results

3.1. M. roreri Sensitivity to Fungicides

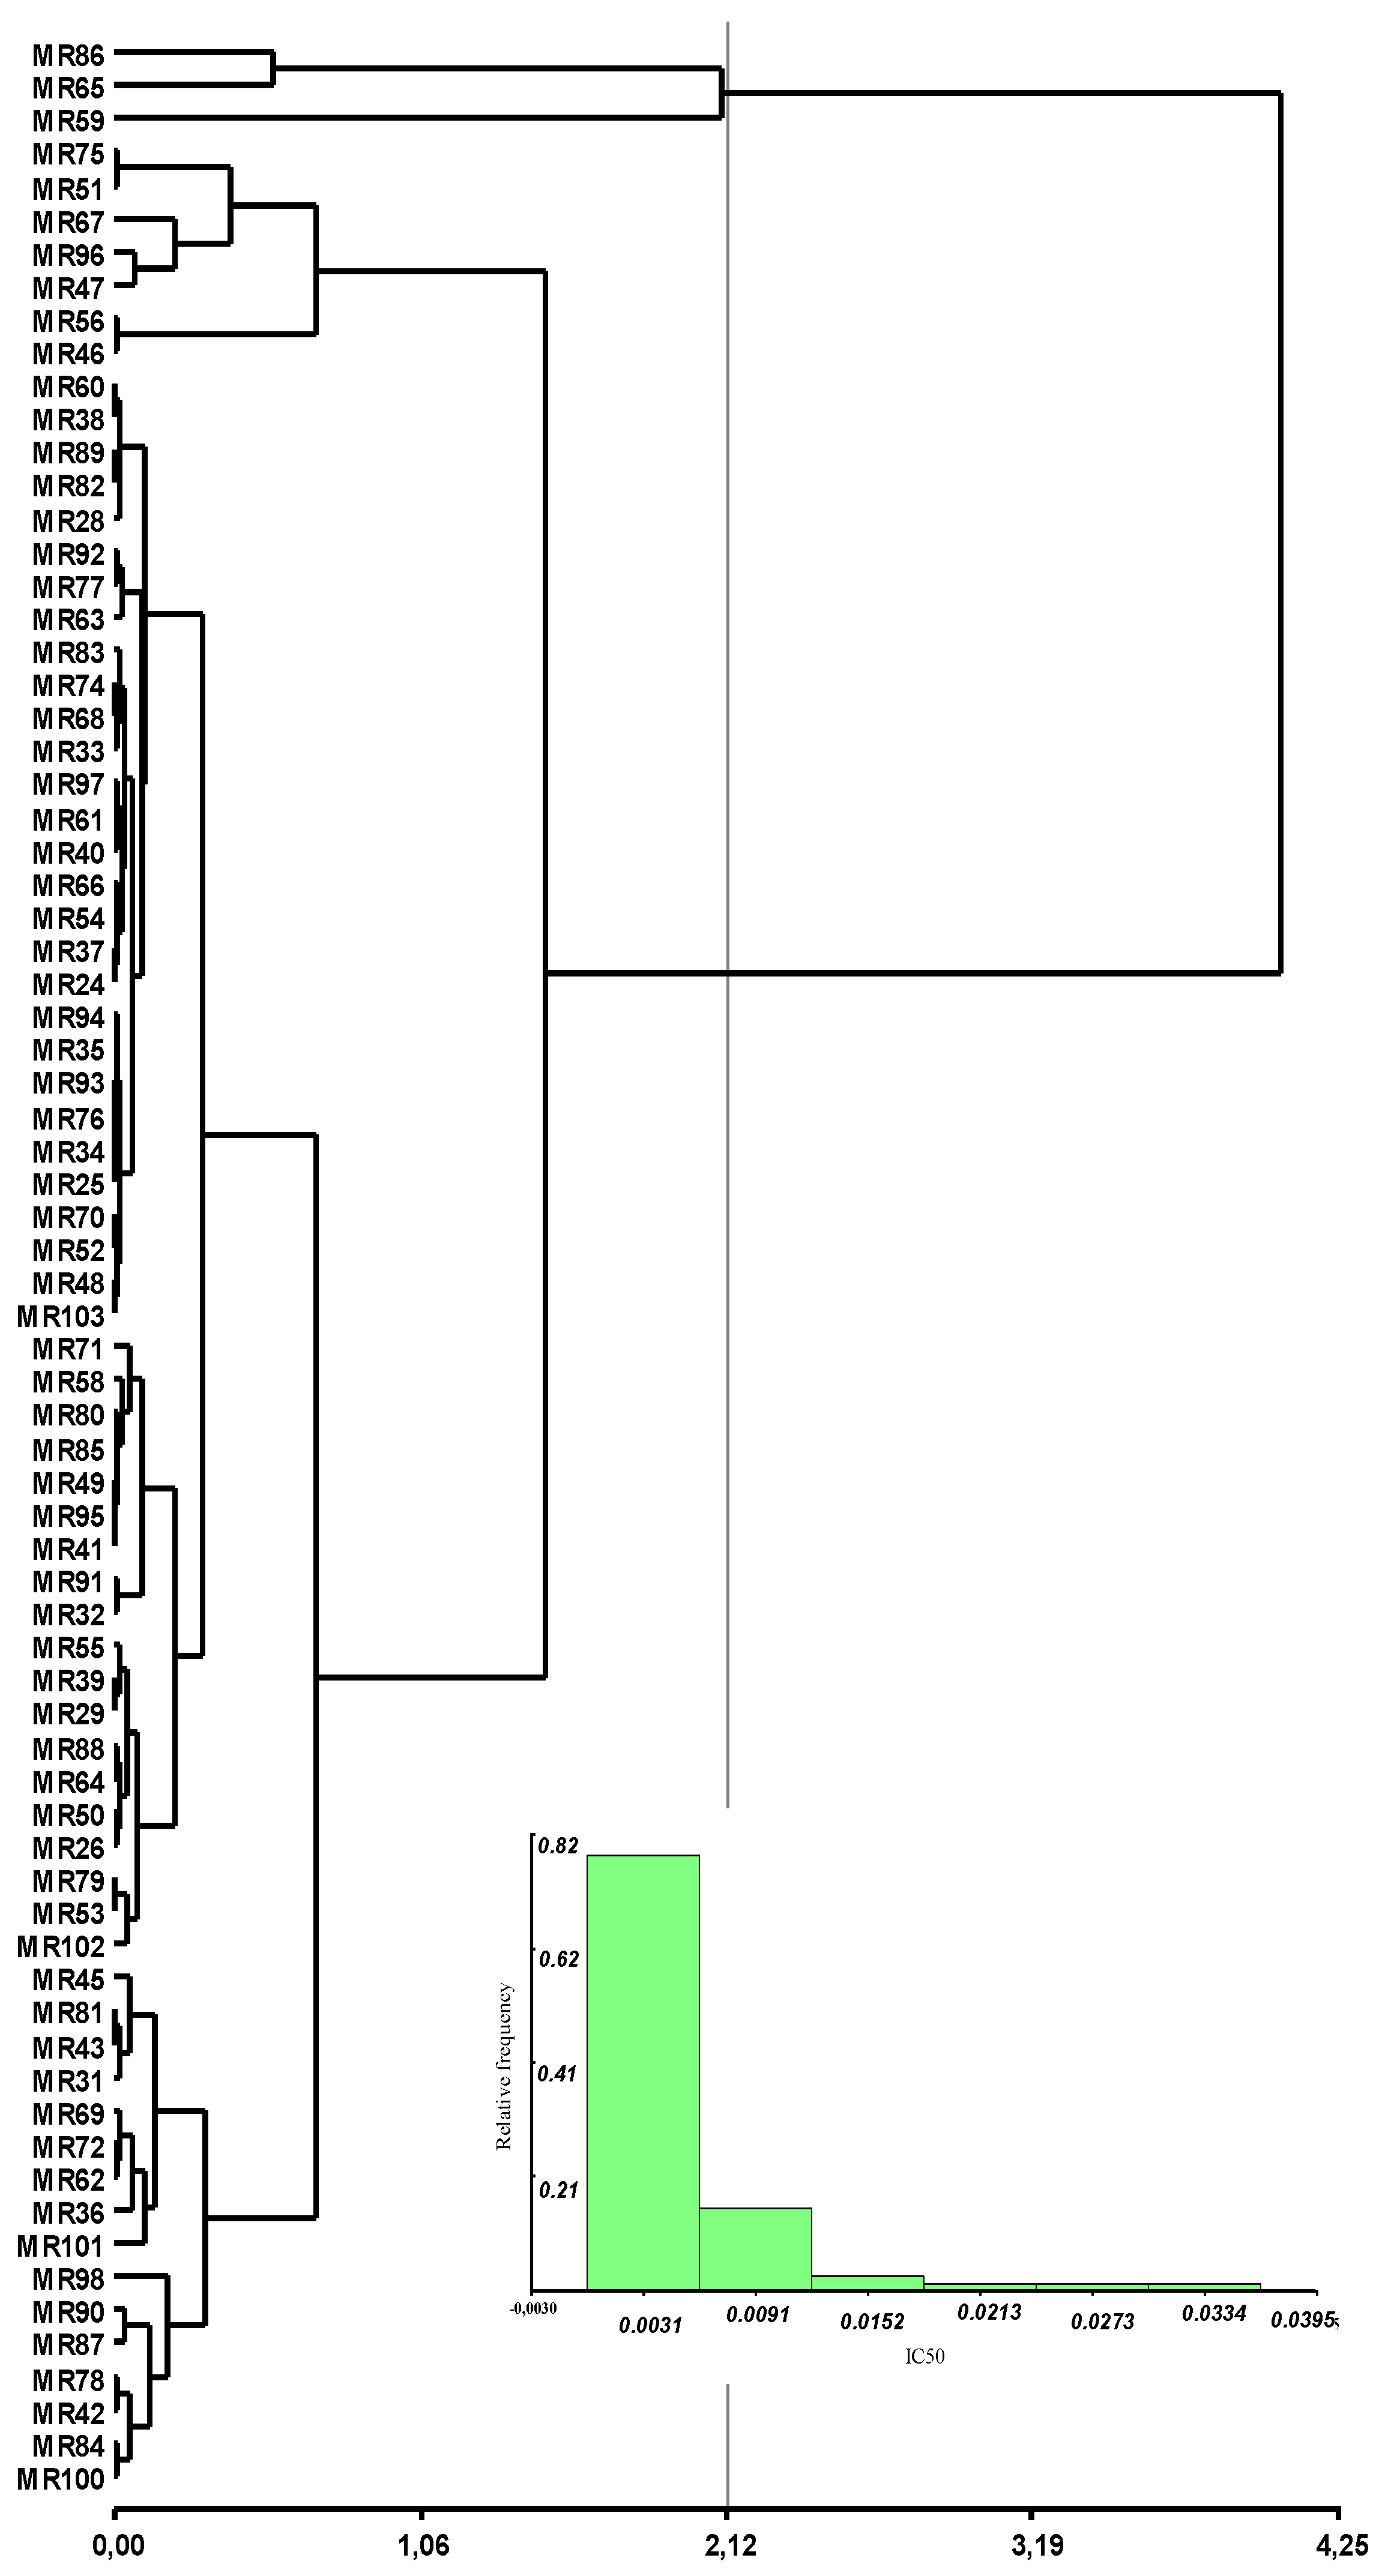
The effects of fungicides were observed in two ways: inhibiting the mycelial growth of each isolate growing with the fungicide in relation to the control (PGI) and the concentration of fungicide required to inhibit growth of the mycelium by half concerning the control (IC50). The former allows the visualization of the dynamics of each isolate through the concentrations (Figure 1). The latter generates a value that summarizes the behavior of an isolate at all concentrations (Figure 2). Six groups within the total of isolates were formed according to the average of the PGI. All isolates were inhibited at all concentrations against azoxystrobin, except the MR41 isolate at lowest concentration whose growth was stimulated (Figure 1, Gr3 at 0.0001 µg mL−1). Concentrations ≥ 0.1 µg mL−1 of the fungicide inhibited the growth of 91% of the isolates (Figure 1, Gr4).
The IC50 values were low for all isolates against azoxystrobin (Figure 2, Supplementary Table S1). The maximum IC50 observed was 0.0364 µg mL−1 (Figure 2, histogram), indicating a high sensitivity to this molecule in the Ecuadorian samples. This behavior was widespread among most samples, as shown the branch including most isolates in the dendrogram (Figure 2). No significant differences were observed between the IC50 values when separating the populations of the Amazon and the Pacific coast (data not shown).
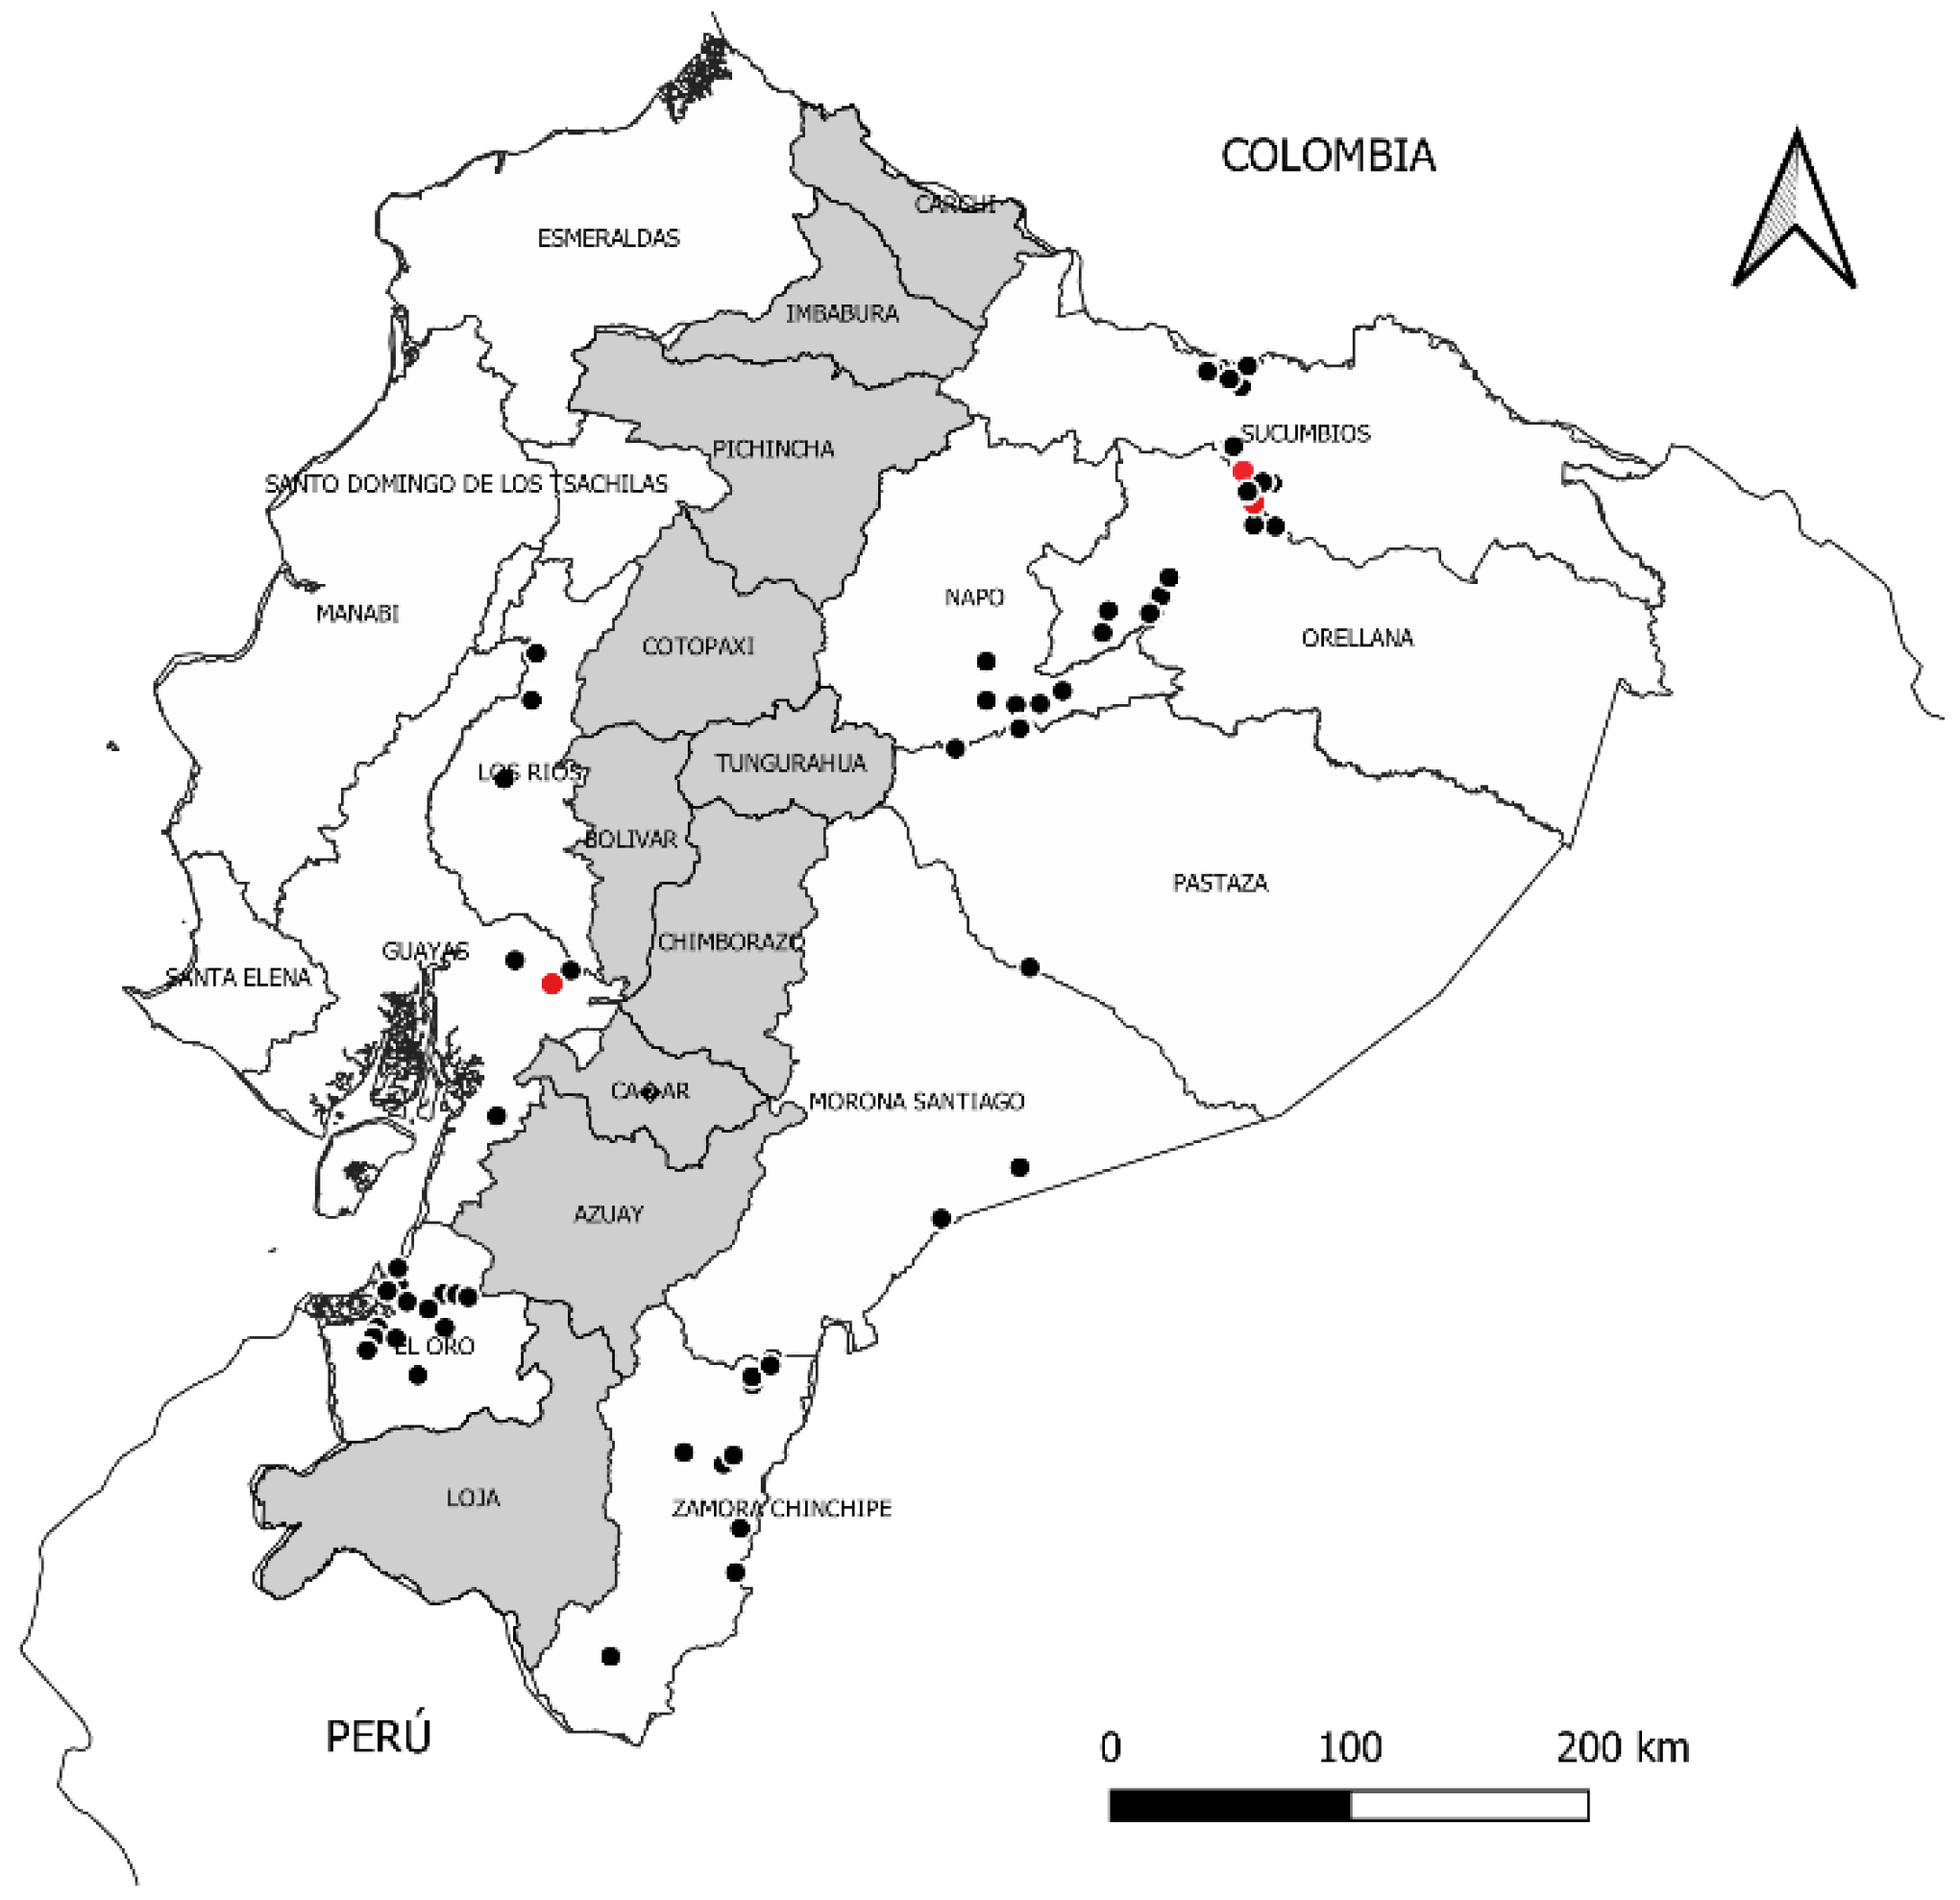
Despite observing low IC50 values for most isolates, three differed from the rest because they were less sensitive with values from 0.0220 to 0.0364 µg mL−1 (Figure 2, small branch of dendrogram). Figure 3 shows that the less sensitive isolates to azoxystrobin (red dots) were found in the Guayas and Sucumbíos provinces, one in the coast and two in the Amazon regions, respectively.

3.2. Genetic Analysis

Nine out of ten markers were polymorphic, mr-12 was monomorphic for the seventy-six isolates evaluated. The most informative were mr-10, mr-11, mr-22, and mr-30 according to the ICP; thirty-nine alleles were observed in the whole population (from 105–183 bp), and three to seven alleles per locus (Table S2). All the genetic diversity statistics show a higher diversity in the Amazon compared to samples of the coast region (Table 1).
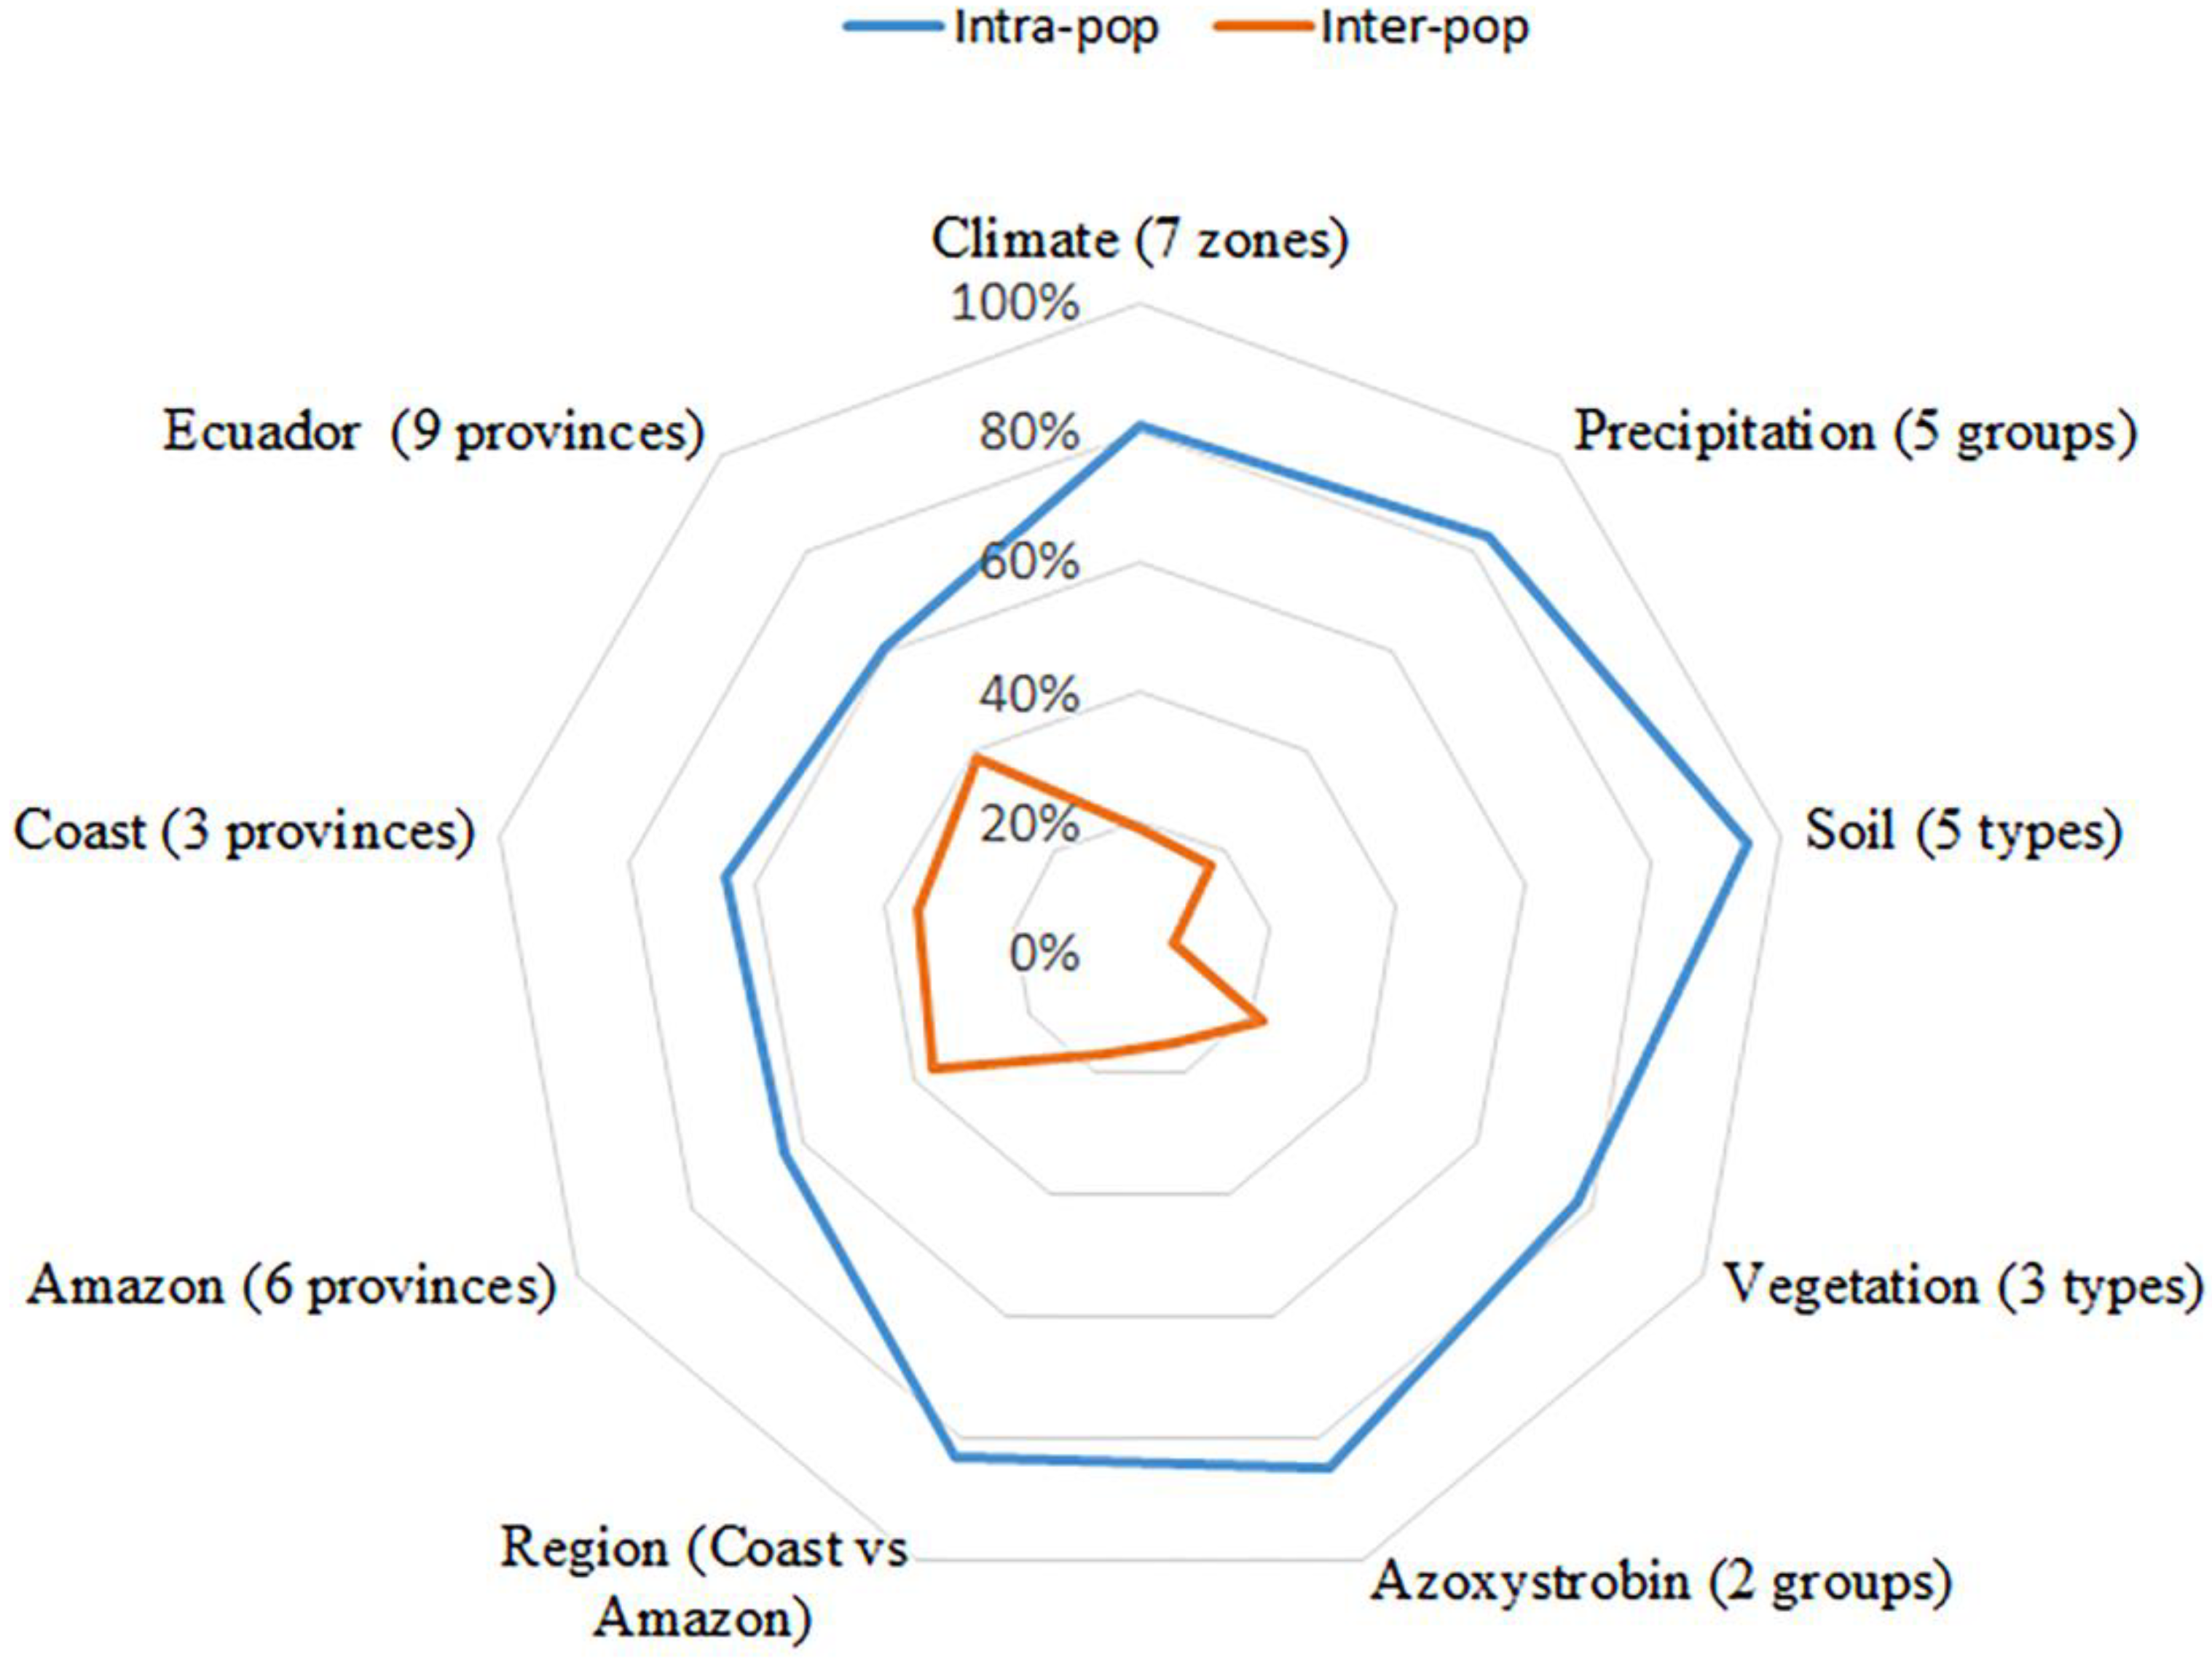
Molecular variance (AMOVA) among a priori defined subpopulations showed low differentiations indexes among the M. roreri Ecuadorian isolates. Figure 4 summarizes the distribution of molecular variance within and between populations. When separating the populations by environmental, geographical, or phenotype criteria (sensitivity to azoxystrobin), it was observed that the percentage of the variance explained by the intrapopulation variation was always at least 70%, indicating the slight influence of these factors on the population’s genetic structure of the pathogen.
The indices of genetic differentiation between the subpopulations were higher when separating the totality of isolates by the nine provinces (FST = 0.41, n = 77), followed in decreasing order by the six provinces of the Amazon (FST = 0.37, n = 55) and the three of the coast (FST = 0, 35, n = 22). These values indicate an important weight of the provinces in the genetic differentiation of the populations. However, when separating the total isolates by the Amazon and coastal regions, only an FST = 0.11 was achieved.
Unlike the AMOVA, the DAPC analysis clearly distinguishes three clusters (Figure 5) concurrent with the provinces. A main group in the upper left quadrant includes isolates from the coast and Amazon provinces. Another group comprises isolates only from the northern Amazon (Orellana and Sucumbíos, see Figure 3). Finally, a third group contains individuals only from the El Oro province, the southernmost region of the Pacific coast. These groups show a significant genetic overlap in the population studied, regardless the Andes mountains separating the Pacific coast from the Amazon.
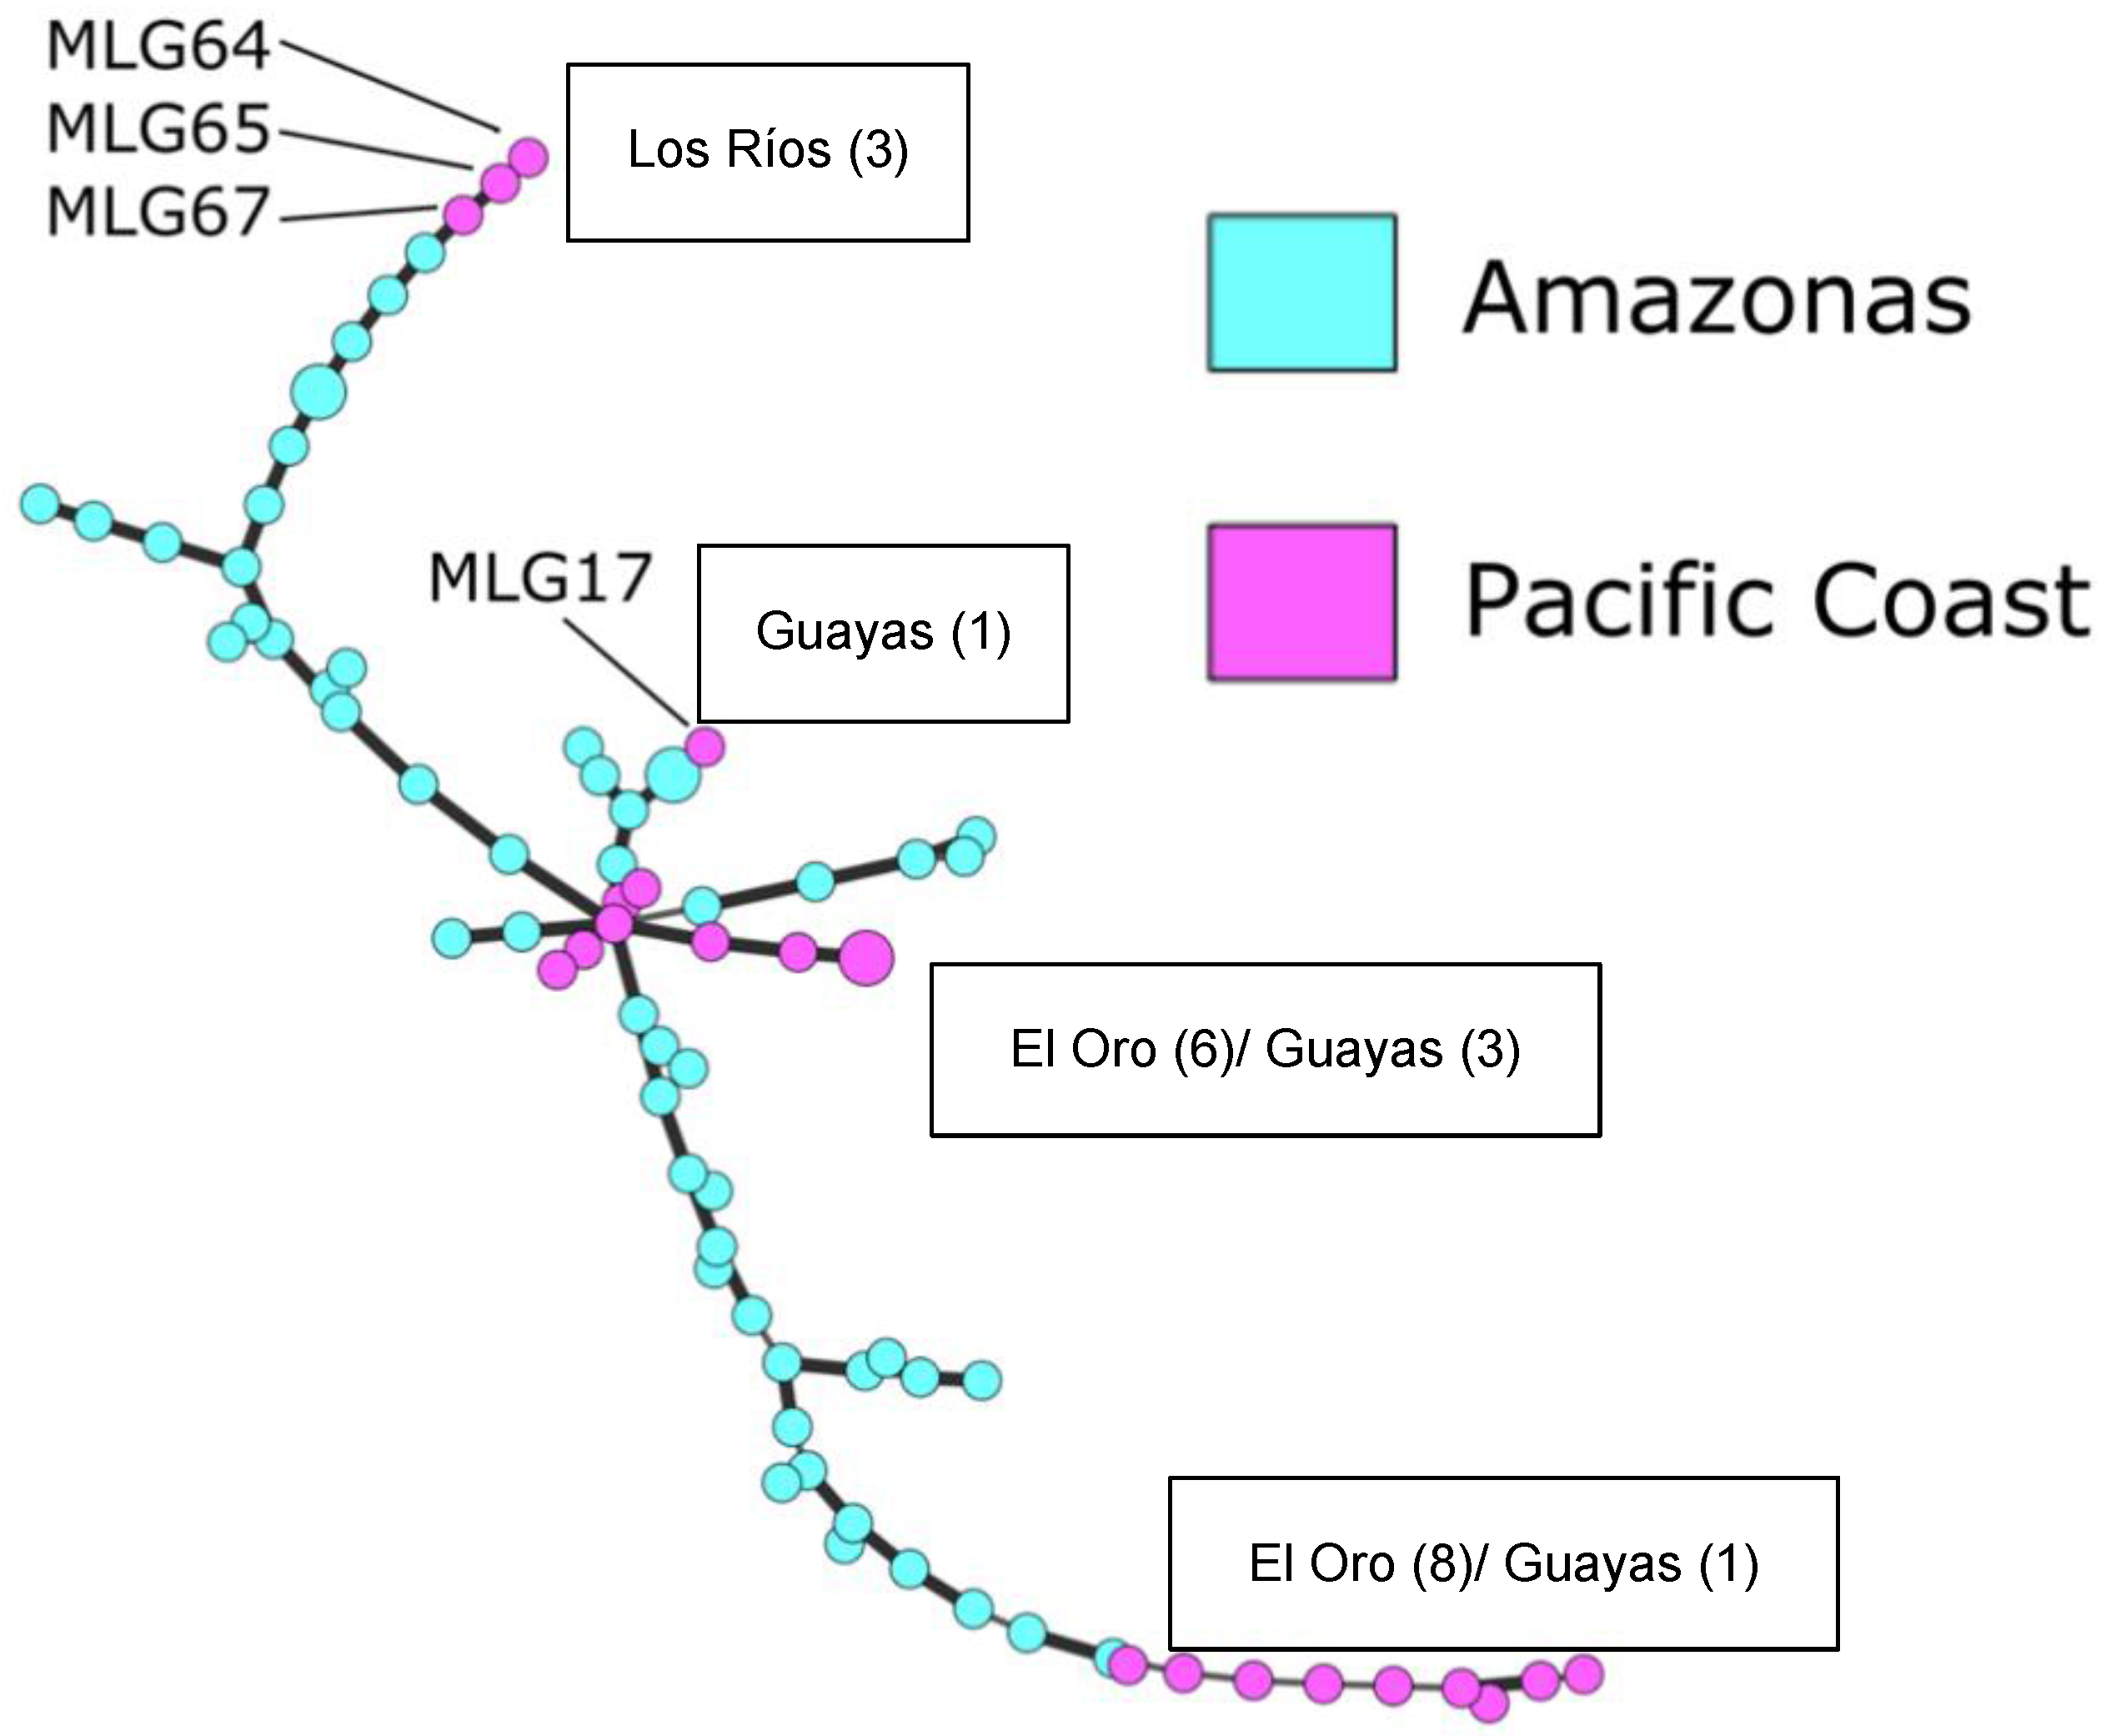
The representation of the MSN shows that the Amazonian isolates are more connected than the Pacific coast isolates, forming a cohesive group. At the same time, the isolates from the Pacific coast appear mostly towards the periphery (magenta circles). The Pacific coast isolates are distributed in four different places of the network (Figure 6), indicating different lineages. Surprisingly, isolates of Guayas province are found in three of the different lineages. These patterns added to the lower genetic diversity of the Pacific coast (Figure 5) show that the populations of the Pacific coast are derived from at least three or four independent introductions from the Amazon.

4. Discussion

M. roreri is a highly host-specialized pathogen, so much so that it has only been reported to cause symptoms on fruits of the genera Theobroma and Herrania. The infectious cycle begins with a biotrophic phase, where there are no visible symptoms of infection [24]. Once symptoms appear and signs of the pathogen are visible, the necrotrophic phase begins. The sign of FPR are its conidia, which are transferred to the new host by natural and artificial mechanisms (clothing, agricultural implements, or harvested fruits). The latter can transport the pathogen over the Andes, which in Ecuador has an average altitude of 2500 m [33] and divides the territory in three regions.
Three isolates from the Amazon (Orellana and Sucumbíos) and one from the coast (Guayas) stood out because of the lower potency that the fungicide showed to inhibit their growth. However, these less sensitive to azoxystrobin isolates can be considered equally susceptible compared to the response to other fungi such as Phytophthora infestans [34] or Alternaria dauci [35]. The same set of isolates used in this work is also highly sensitive to another systemic fungicide, flutolanil [36]. The high effectiveness of azoxystrobin (75/76 isolates) and flutolanil (66/76 isolates) in inhibiting the growth of the fungus in Ecuador leaves room to maneuver including these molecules in an integrated FPR management program, the only way that the disease can be maintained at sustainable levels [13,24].
Our data showed a higher genetic diversity of the Amazonian isolates because at least three genetic groups were differentiated in the DAPC analysis. Two separate clusters originated from the northern provinces of Sucumbíos and Orellana (Figure 5). A very similar mixture originated from the central provinces of Napo, Pastaza, and Morona-Santiago, and the southernmost Amazonian province of Zamora. It is worth noting that all isolates from Zamora showed higher diversity according to the AMOVA analysis with a Shannon Index of 0.78, higher than the rest, which was in the range 0.29–0.65. The southernmost mapped locality was Palanda, where cacao’s oldest archaeological domestication site was discovered [20]. However, this difference was not evident in the DAPC analysis. Thirteen of the fourteen isolates from the coastal province of El Oro differed from the other two coastal provinces (Los Rios and Guayas) and the whole Amazon (Figure 5), which also were retrieved as a peripheral group in the minimum spanning network (Figure 6).
The Magdalena Valley in Colombia is considered the center of origin of M. roreri. Phillip-Mora et al. (2007) [23] found there the highest genetic diversity of the species using ISSR and AFLP markers. This result was later verified using almost the same isolates but with SNP markers [22]. The evidence obtained so far indicates that from the Magdalena Valley decreases genetic diversity towards Peru and Central America. M. roreri is believed to have originated from wild species of Theobroma and Herrania in Colombia, and to have jumped many times to T. cacao as a host once commercial plantations began in Colombia. It would be interesting to generate comparable data from Ecuador to determine if these patterns hold, knowing that the center of cacao domestication is Ecuador [20].
Possibly the FPR was already present in Colombia as early as the year 1817 [37], but known as “la mancha” [38]. During the latter part of the nineteenth century, Ecuador replaced the “National cacao” monoculture in the coastal region with the more productive, but apparently more susceptible to FPR, “Forastero cacao” [8]. Eventually, M. roreri arrived from Colombia and the disease exploded in 1916 in the province of Guayas [8] on the coast of Ecuador. It also seems highly likely that the FPR was not evident in Ecuador before 1800 (Javier Véliz Alvarado, archaeologist, personal communication). This seems to be corroborated by finding that 3/4 genetic groups present in Ecuador are also present in Colombia [22]. Some studies suggest [39,40] that in 1986s, M. roreri was well-adapted in the province of Napo and moved from the coast to the Amazon region of Ecuador, surpassing the barrier of the Andes Mountains, through east–west oil activity [39,40]. On the Amazonian side of Ecuador, it continued its dispersion to the south. However, our results suggest that the movement of M. roreri occurred in the opposite direction, from the Amazon to the Pacific coast, and in at least three independent events (Figure 6). The minimum spanning network show for distinctive lineages in the coast; however, two of them are quite close indicating that more sampling most likely will connect these groups. Perhaps, large scale cacao production in the coast triggered the accidental importation of M. roreri from small farms in the Amazon.
In Ecuador, at least three [22], and four genetic groups have been reported in 2007 and 2015, respectively. In 2007, the report included only two Amazonian strains from the Napo province belonging to genetic group V. Group V was found on the other side of the Andes, in the coastal province of Manabí, and also in Colombia, Venezuela and Peru. In 2015 [22], which report included part of the strains used in 2007, confirmed that the same genetic group (Syn Grp. 2) was present in Peru and Bolivia This study did not include strains from the Amazon. The results reported here include 50 isolates from all Amazonian provinces, where each sample was separated by at least 10 km from each other.
Our results show that the isolates from the Ecuadorian Amazon are more diverse than those from the Pacific coast (Table 1, DPAC analysis in Figure 4 and MSN in Figure 6). Movement of MLGs within the Ecuadorian regions may have occurred repeatedly, given the low level of geographic genetic structure. In fact, AMOVA analyses showed that most genetic diversity (83%) was found within populations among populations of the Amazonia and the coast (Figure 4). DAPC was used to infer the number of clusters of genetically related individuals. This is a flexible and fast method recommended for these purposes because it does not require predetermined population genetics models (i.e., STRUCTURE) for data analysis [30]. It first reduces the data dimensions using principal component analysis (PCA). Then, the clusters are separated using discriminant analysis (DA). Minimum spanning networks (MSNs) are graphical representations of genetic differences between samples (e.g., identifying which samples are closest to an example of interest or clusters of closely related samples). This analysis is particularly recommended for detecting intraspecific differences where genetic distances are smaller [31].
Our results are surprising because the diversity of genetic groups was expected to be more significant in the coast, where MR has co-evolved with the cacao monoculture for more than 100 years [41]. In the north of the Ecuadorian Amazon, new plantations began to be promoted in the late 1970s [42]. Presence and damage of FPR was early reported only in the Experimental Station of INIAP-Ecuador in the province of Napo in 1985, this not being the case in the wild cacao areas [39]. It is worth noting that the difference in the number of isolates among regions in our study may contribute to the observed differences.
Continued genotyping of M. roreri from the other provinces of the coast (i.e., Esmeraldas and Manabí) will be necessary to confirm the results of genotype diversity, to track the movement and diversification of the lineages or to identify some dominant genotypes. In our results, given that only three MLGs contained two identical isolates (Figure 6, MGL.5, MGL.11 and MGL.19) no dominant genotype was identified. Particularly interesting would be to determine if the genetic group Syn Grp. 2 [22], exclusive to Bolivia, Perú and the coast, is also present in the Amazon. Additional analysis of M. roreri isolates from unrepresented nurseries such as from the Ecuadorian Amazon provinces and from other countries will be necessary to confirm that the global population of this species consists of two different main clonal lineages [22].
The sensitivity of the mycelium of M. roreri to azoxystrobin as a systemic fungicide would explain the effectiveness observed in the reduction in infected fruits in plantations in the Amazonian province of Orellana [10]. The applications would be recommended to protect the young fruits during the first two months [15,16,41]. In our results, genetic diversity was not associated with azoxystrobin sensitivity, since most isolates from all provinces of the coast and the Amazon were susceptible (Figure 2 and Figure 3).

5. Conclusions

This study complements the information available on the population structure of M. roreri previously published by Phillip et al. [23] and Alii et al. [22] Fifty-two strains from cocoa plantations from the six Amazonian provinces of Ecuador were included, and genetic diversity was associated with sensitivity to a fungicide. The data and the analysis methodology indicated that genetic diversity is greater in the population of M. roreri from the Amazon, and from there were repeated introductions to the coast. Most of the strains of M. roreri from Ecuador turned out to be highly sensitive to azoxystrobin, allowing the option of using this molecule in the management of FPR.
The results here presented determine that M. roreri was introduced from the Amazon to the Pacific coast at least three times. Increasing the data from isolates, particularly those collected from old small plantations and wild populations in the Amazon, will clarify with higher certainty the directionality of the M. roreri movements. A global study with the strains already available in culture collections from several American and European countries, and some new ad hoc collections, would provide a more complete and integrated picture of the population structure. Including the virulence of multiple isolates in future analyses would be highly desirable, although it is a laborious and time-consuming procedure [40] given the biotrophic nature of the pathogen.

Supplementary Materials

The following are available online at https://www.mdpi.com/article/10.3390/agronomy12051119/s1, Table S1: Origin and Average IC50 of azoxystrobin for all isolates of M. roreri; Table S2: Characteristics of 10 SSR markers according to expected and observed information (ICP) of M. roreri from Ecuador.

Author Contributions

Conceptualization, D.S.d.C. and S.P.-M.; formal analysis, C.M.P. and S.P.-M.; investigation, F.E.-L., D.A.-M. and M.V.-V.; resources, D.S.d.C.; data curation, F.E.-L., D.A.-M. and M.V.-V.; writing—original draft preparation, F.E.-L., D.A.-M. and M.V.-V.; writing—review and editing, S.P.-M. and C.M.P.; visualization, C.M.P. and D.A.-M.; supervision, S.P.-M.; project administration, D.S.d.C. and S.P.-M.; funding acquisition, S.P.-M. All authors have read and agreed to the published version of the manuscript.

Funding

This research was funded by UNEMI (Project 2016-CONV-P-01-04) and ESPOL.

Institutional Review Board Statement

Agreement for Access to Genetic Resources MAE–DNB–CM–2018–0092, Ministry of the Environment of Ecuador.

Informed Consent Statement

Not applicable.

Data Availability Statement

Not applicable.

Acknowledgments

We thank Byron Moyano, Jhonny España and the technicians of the Ministry of Agriculture of Ecuador for their assistance during the sampling; we also thank Christian Romero, Juan M. Cevallos and Pablo Chong for technical assistance. S.P.-M thanks to Delia M. Torres from Archivo Histórico del Guayas for the copy of the original Rorer’s report.

Conflicts of Interest

The authors declare no conflict of interest.

References

  1. Evans, H.C.; Holmes, K.A.; Phillips, W.; Wilkinson, M.J. What’s in a Name: Crinipellis, the Final Resting Place for the Frosty Pod Rot Pathogen of Cocoa? Mycologist 2002, 16, 148–152. [Google Scholar] [CrossRef]
  2. Fowler, R.; Lopez, G. The Cacao Industry of Ecuador; Foreign Agriculture Report; US Government Printing Office: Washington, DC, USA, 1949.
  3. Enríquez, G. Cacao Orgánico: Guía Para Productores Ecuatorianos, 2nd ed.; INIAP: Quito, Ecuador, 2010; Volume 54, ISBN 9978-43-493-3.
  4. Evans, H.C. Frosty Pod Rot (Moniliophthora roreri). In Cacao Diseases: A History of Old Enemies and New Encounters; Springer: Cham, Switzerland, 2016; pp. 63–96. ISBN 978-3-319-24789-2. [Google Scholar]
  5. Johnson, E.S.; Rutherford, M.A.; Edgington, S.; Flood, J.; Crozier, J.; Cafá, G.; Buddie, A.G.; Offord, L.; Elliott, S.M.; Christie, K.V. First Report of Moniliophthora roreri Causing Frosty Pod Rot on Theobroma cacao in Jamaica. New Dis. Rep. 2017, 36, 2. [Google Scholar] [CrossRef] [Green Version]
  6. Parra, D.; Martínez, S.P.; Sosa, D.; Rumbos, R.; Gutiérrez, B.; Moya, A. Avances en las investigaciones venezolanas sobre enfermedades del cacao. Rev. Estud. Transdiscipl. 2009, 1, 56–75. [Google Scholar]
  7. Pegg, K.G.; Coates, L.M.; O’Neill, W.T.; Turner, D.W. The Epidemiology of Fusarium Wilt of Banana. Front. Plant Sci. 2019, 10, 1395. [Google Scholar] [CrossRef] [Green Version]
  8. Rorer, J.B. Asociacion de Agricultores del Ecuador Enfermedades y Plagas del Cacao en el Ecuador y Metodos Modernos Apropiados al Cultivo del Cacao, Informe Presentado al Presidente y Miembros de la Asociación de Agricultores del Ecuador; El Diario Ilustrado: Guayaquil, Ecuador, 1918. [Google Scholar]
  9. Sánchez, V.; Zambrano, J.; Iglesias, C. La Cadena de Valor del Cacao en América Latina y el Caribe; INIAP, Estación Experimental Santa Catalina: Quito, Ecuador, 2019; ISBN 978-9942-36-465-4.
  10. Pico, J.T.; Paredes, N.J.; Subía, C.R.; Suárez, C.; Caicedo, V.C.; Fernández, F.M. Efecto de Prácticas de Manejo Sobre la Incidencia de Moniliophthora roreri (Cif & Par) y Rendimiento en el Cultivo de Cacao (Theobroma cacao L.), 1st ed.; AGN LATAM /INIAP, Estación Experimental Central de la Amazonía: Sacha, Ecuador, 2019; ISBN 978-9942-38-269-6. [Google Scholar]
  11. Phillips-Mora, W.; Amores, F. Moniliasis del Cacao. CropLife Latin America. Available online: https://www.croplifela.org/es/plagas/listado-de-plagas/moniliasis-del-cacao (accessed on 5 November 2021).
  12. Krauss, U.; Hidalgo, E.; Bateman, R.; Adonijah, V.; Arroyo, C.; García, J.; Crozier, J.; Brown, N.A.; Martijn, G.; Holmes, K.A. Improving the Formulation and Timing of Application of Endophytic Biocontrol and Chemical Agents against Frosty Pod Rot (Moniliophthora roreri) in Cocoa (Theobroma cacao). Biol. Control 2010, 54, 230–240. [Google Scholar] [CrossRef]
  13. Tirado-Gallego, P.A.; Lopera-Alvarez, A.; Ríos-Osorio, L.A. Estrategias de Control de Moniliophthora roreri y Moniliophthora Perniciosa En Theobroma cacao L.: Revisión Sistemática. Rev. Corpoica Cienc. Tecnol. Agropecu. 2016, 17, 417–430. [Google Scholar] [CrossRef] [Green Version]
  14. Torres De La Cruz, M.; Fredy, C.; García, O.; Ortiz, D.T.; Aguilera, A.M.; Nava Díaz, C.; De La Cruz, T.; Cf, G.; Ortíz, T.; Aguilera, M.; et al. Efecto Del Azoxystrobin Sobre Moniliophthora roreri, Agente Causal de La Moniliasis Del Cacao (Theobroma cacao). Rev. Mex. Fitopatol. 2013, 31, 65–69. [Google Scholar]
  15. Bateman, R.P.; Hidalgo, E.; Garcia, J.; Arroyo, C.; ten Hoopen, G.M.; Adonijah, V.; Krauss, U. Application of Chemical and Biological Agents for the Management of Frosty Pod Rot (Moniliophthora roreri) in Costa Rican Cocoa (Theobroma cacao). Ann. Appl. Biol. 2005, 147, 129–138. [Google Scholar] [CrossRef]
  16. Krauss, U.; Ten Hoopen, G.; Hidalgo, E.; Martinez, A.; Arroyo, C.; García, J.; Portuguez, A.; Sánchez, V. Manejo Integrado de La Moniliasis (Moniliophthora roreri) Del Cacao (Theobroma cacao) En Talamanca, Costa Rica. Agrofor. En Las Américas 2003, 10, 52–58. [Google Scholar]
  17. Brent, K.; Hollomon, D. Fungicide Resistance: The Assessment of Risk, 2nd ed.; Global Crop Protection Federation: Brussels, Belgium, 2007. [Google Scholar]
  18. Agrios, G. Plant Pathology, 5th ed.; Elsevier Academic Press: Amsterdam, The Netherlands, 2005. [Google Scholar]
  19. Thomas, E.; van Zonneveld, M.; Loo, J.; Hodgkin, T.; Galluzzi, G.; van Etten, J. Present Spatial Diversity Patterns of Theobroma cacao L. in the Neotropics Reflect Genetic Differentiation in Pleistocene Refugia Followed by Human-Influenced Dispersal. PLoS ONE 2012, 7, e47676. [Google Scholar] [CrossRef] [Green Version]
  20. Zarrillo, S.; Gaikwad, N.; Lanaud, C.; Powis, T.; Viot, C.; Lesur, I.; Fouet, O.; Argout, X.; Guichoux, E.; Salin, F.; et al. The Use and Domestication of Theobroma cacao during the Mid-Holocene in the Upper Amazon. Nat. Ecol. Evol. 2018, 2, 1879–1888. [Google Scholar] [CrossRef] [PubMed]
  21. Henderson, J.S.; Joyce, R.A.; Hall, G.R.; Hurst, W.J.; McGovern, P.E. Chemical and Archaeological Evidence for the Earliest Cacao Beverages. Proc. Natl. Acad. Sci. USA 2007, 104, 18937–18940. [Google Scholar] [CrossRef] [PubMed] [Green Version]
  22. Ali, S.S.; Shao, J.; Strem, M.D.; Phillips-Mora, W.; Zhang, D.; Meinhardt, L.W.; Bailey, B.A. Combination of RNAseq and SNP Nanofluidic Array Reveals the Center of Genetic Diversity of Cacao Pathogen Moniliophthora roreri in the Upper Magdalena Valley of Colombia and Its Clonality. Front. Microbiol. 2015, 6, 850. [Google Scholar] [CrossRef] [PubMed] [Green Version]
  23. Phillips-Mora, W.; Aime, M.C.; Wilkinson, M.J. Biodiversity and Biogeography of the Cacao (Theobroma cacao) Pathogen Moniliophthora roreri in Tropical America. Plant Pathol. 2007, 56, 911–922. [Google Scholar] [CrossRef]
  24. Bailey, B.; Evans, H.; Phillips-Mora, W.; Ali, S.; Meinhardt, L. Moniliophthora roreri, Causal Agent of Cacao Frosty Pod Rot. Mol. Plant Pathol. 2018, 19, 1580–1594. [Google Scholar] [CrossRef] [Green Version]
  25. Maridueña-Zavala, M.G.; Villavicencio-Vásquez, M.E.; Cevallos-Cevallos, J.M.; Peralta, E.L. Molecular and Morphological Characterization of Moniliophthora roreri Isolates from Cacao in Ecuador. Can. J. Plant Pathol. 2016, 38, 460–469. [Google Scholar] [CrossRef]
  26. Ram, A. Biology, epidemiology and control of moniliasis (Moniliophthora roreri) of cacao. Ph.D. Thesis, University of London, London, UK, 1989. [Google Scholar]
  27. Maridueña-Zavala, M.G.; Quevedo, A.; Aguaguiña, K.; Serrano, L.; Sosa del Castillo, D. Colección de cultivos microbianos CIBE (CCM-CIBE): Una colección para la investigación. Bionatura 2021, 6, 1664–1668. [Google Scholar] [CrossRef]
  28. Cenis, J.L. Rapid Extraction of Fungal DNA for PCR Amplification. Nucleic Acids Res. 1992, 20, 2380. [Google Scholar] [CrossRef]
  29. Melo, B.L.B.; de Souza, J.T.; Santos, R.M.F.; Rehner, S.A.; Solis, K.H.; Suarez, C.; Hebbar, P.K.; Lemos, L.S.L.; Gramacho, K.P. Development of Microsatellites for the Cacao Frosty Pod Rot Pathogen, Moniliophthora roreri. For. Pathol. 2014, 44, 320–324. [Google Scholar] [CrossRef]
  30. Dia, M.; Wehner, T.C.; Arellano, C. RGxE: An R Program for Genotype x Environment Interaction Analysis. Am. J. Plant Sci. 2017, 8, 1672–1698. [Google Scholar] [CrossRef] [Green Version]
  31. Kamvar, Z.N.; Tabima, J.F.; Grünwald, N.J. Poppr: An R Package for Genetic Analysis of Populations with Clonal, Partially Clonal, and/or Sexual Reproduction. PeerJ 2014, 2, e281. [Google Scholar] [CrossRef] [PubMed] [Green Version]
  32. Jombart, T.; Devillard, S.; Balloux, F. Discriminant Analysis of Principal Components: A New Method for the Analysis of Genetically Structured Populations. BMC Genet. 2010, 11, 94. [Google Scholar] [CrossRef] [PubMed] [Green Version]
  33. Portilla Farfán, F. Agroclimatología del Ecuador, 1st ed.; Editorial Abya-Yala: Quito, Ecuador, 2018; ISBN 978-9978-10-310-4. [Google Scholar]
  34. Qin, C.-F.; He, M.-H.; Chen, F.-P.; Zhu, W.; Yang, L.-N.; Wu, E.-J.; Guo, Z.-L.; Shang, L.-P.; Zhan, J. Comparative Analyses of Fungicide Sensitivity and SSR Marker Variations Indicate a Low Risk of Developing Azoxystrobin Resistance in Phytophthora infestans. Sci. Rep. 2016, 6, 20483. [Google Scholar] [CrossRef] [PubMed] [Green Version]
  35. Rogers, P.M.; Stevenson, W.R. Aggressiveness and Fungicide Sensitivity of Alternaria dauci from Cultivated Carrot. Plant Dis. 2010, 94, 405–412. [Google Scholar] [CrossRef] [PubMed] [Green Version]
  36. Amaya-Márquez, D.; Espinoza-Lozano, F.; Villavicencio-Vasquez, M.E.; Sosa del Castillo, D.; Perez-Martinez, S. Inhibition and Stimulation of Mycelial Growth of Moniliophthora roreri by Flutolanil in Populations of Ecuador. Acta Agron. 2021, 70, 3. [Google Scholar] [CrossRef]
  37. Gaceta Oficial Colombia. El Cacao. Instrucción Popular 1850. Año XIX (N° 1.148): 429–430. Available online: https://books.google.com.hk/books?id=7rszAQAAMAAJ&pg=PA425&lpg=PA425&dq=Gaceta+Oficial+Colombia+.+El+Cacao.+Instrucci%C3%B3n+popular+1850:+429%E2%80%93430.&source=bl&ots=pg68wXUSUz&sig=ACfU3U0oWCW6zfdQd8x1jIDpLgQccil_lQ&hl=en&sa=X&redir_esc=y#v=onepage&q=Gaceta%20Oficial%20Colombia%20.%20El%20Cacao.%20Instrucci%C3%B3n%20popular%201850%3A%20429%E2%80%93430.&f=false (accessed on 7 April 2022).
  38. Phillips-Mora, W. Origin, Biogeography, Genetic Diversity and Taxonomic Affinities of the Cacao (Theobroma cacao L.) Fungus Moniliophthora roreri (Cif.) Evans et al. as Determined Using Molecular, Phytopathological and Morpho-Physiological Evidence. PhD Thesis, The University of Reading, Reading, UK, 2003. [Google Scholar]
  39. Allen, J.A. Recolecciones de Cacao Silvestre de la Region Amazónlca Ecuatoriana. Proyecto Amazonas. Convenio INIAP-CCCA Reporte final-Primera Fase; INIAP-Estación Experimental Tropical Pichilingue: Quito, Ecuador, 1985; Volume 15. [Google Scholar]
  40. Evans, H.C. A Reassessment of Moniliophthora (Monilia) Pod Rot of Cocoa. Cocoa Grow. Bull. 1986, 37, 34–43. [Google Scholar]
  41. Ciferri, R.; Parodi, E. Descrizione del fungo che causa la “Moniliasi” del cacao. Phytopathol. Z. 1933, 6, 539–542. [Google Scholar]
  42. Hiraoka, M.; Yamamoto, S. Agricultural Development in the Upper Amazon of Ecuador. Geogr. Rev. 1980, 70, 423–445. [Google Scholar] [CrossRef]
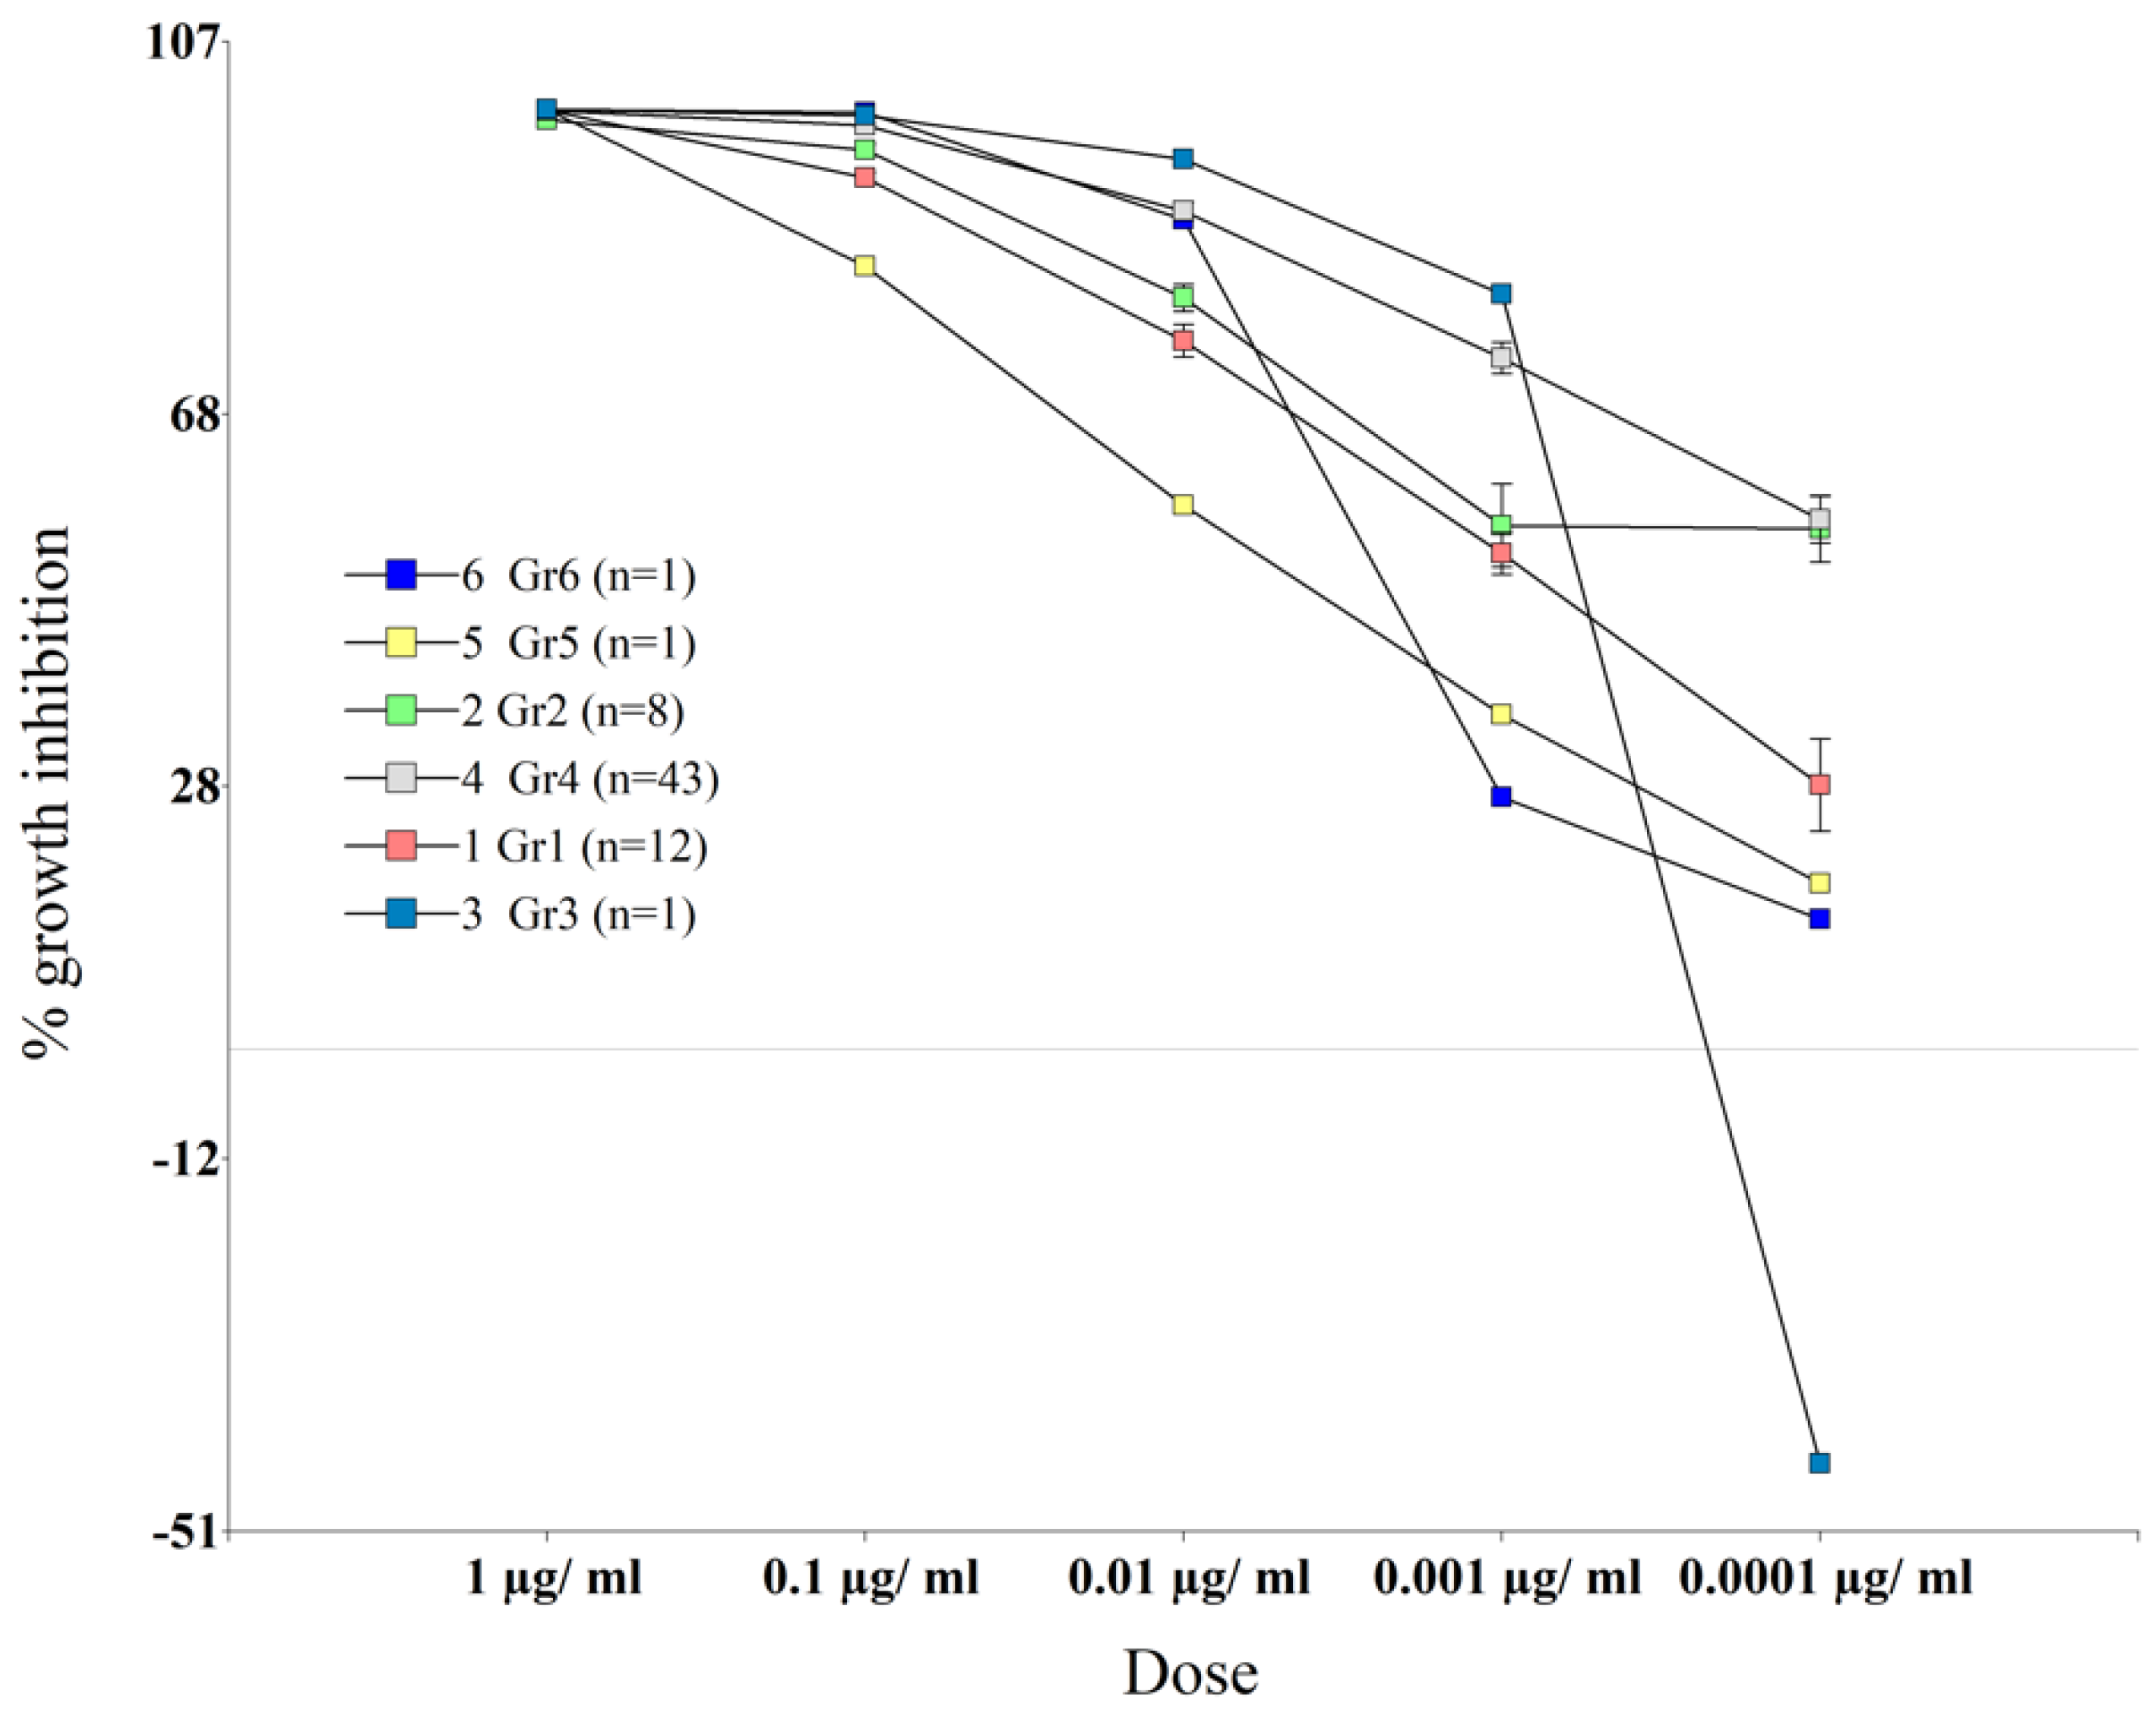
Figure 1. Dynamics of the mycelial growth inhibition of M. roreri groups on PDA plates poisoned with azoxystrobin (darkness/27 °C/6 d). Inhibition values less than zero (horizontal line) indicate growth stimulation compared to the control treatment. Grouping according to cluster analysis of the PGI of 66 isolates (cophenetic correlation 0.809). Bars indicates standard error.
Agronomy 12 01119 g001
Figure 2. Dendrogram shows two groups of 71 M. roreri isolates according to the IC50s values of azoxystrobin (cophenetic correlation 0.930). Ranges of the observed IC50 and the No. of isolates in each group (respectively) were: more sensitive 0.0000–0.0146 µg mL−1 (68) and less sensitive 0.0220–0.0364 µg mL−1 (3). Histogram shows the relative frequencies according to the IC50s.
Agronomy 12 01119 g002
Figure 3. Spatial distribution of M. rorei isolates according to sensitivity (IC50) to azoxystrobin. Red dots indicate the less sensitive, in black the more sensitive (details in Figure 2). Map of Ecuador showing the provinces of the coast (left), Amazon (right) and Andes (gray) regions.
Agronomy 12 01119 g003
Figure 4. Summary of intra- and interpopulation of molecular variance analyses between populations of M. roreri. Subpopulations (groups) according to geographical, environmental, and phenotypic criteria (sensitivity to azoxystrobin) were delimited.
Agronomy 12 01119 g004
Figure 5. Biplot of discriminant analysis of principal components (DAPC) for 76 isolates of M. roreri collected in Ecuador’s Amazon and coastal regions in 2019. The axes represent the first two Linear Discriminants (see histogram). Color represents provinces, and each dot represents an individual.
Agronomy 12 01119 g005
Figure 6. Minimum spanning networks (MSN) showing relationships between the individual multi-locus genotypes (MLGs) observed in the Ecuadorian M. roreri populations from the Amazon and the coast regions. The size of the circles is proportional to the number of individuals with the same haplotype (normally one but in three cases two), and the thickness of the lines represents the Euclidean genetic distance between two nodes (thicker lines mean larger genetic distance).
Agronomy 12 01119 g006
Table 1. Genetic diversity statistics of the coastal and Amazon populations of M. roreri.
PopulationNHGGnormLambdaHexp
Amazon543.9651.270.930.980.68
Coast223.0320.170.920.950.57
Total764.2971.430.930.990.71
N, numbers of isolates analyzed in the population; H, Shannon-Wiener Diversity index; G, Stoddard and Taylor’s index; Gnorm, normalized Stoddard and Taylor’s index (Gnorm = G/N); Lambda, Simpson’s index; Hexp, expected heterozygosity (Nei’s gene diversity).
Publisher’s Note: MDPI stays neutral with regard to jurisdictional claims in published maps and institutional affiliations.