
Identification of Unsound Grains in Wheat Using Deep Learning and Terahertz Spectral Imaging Technology

 , and
, and
Abstract
:1. Introduction
2. Equipment and Algorithm Principles
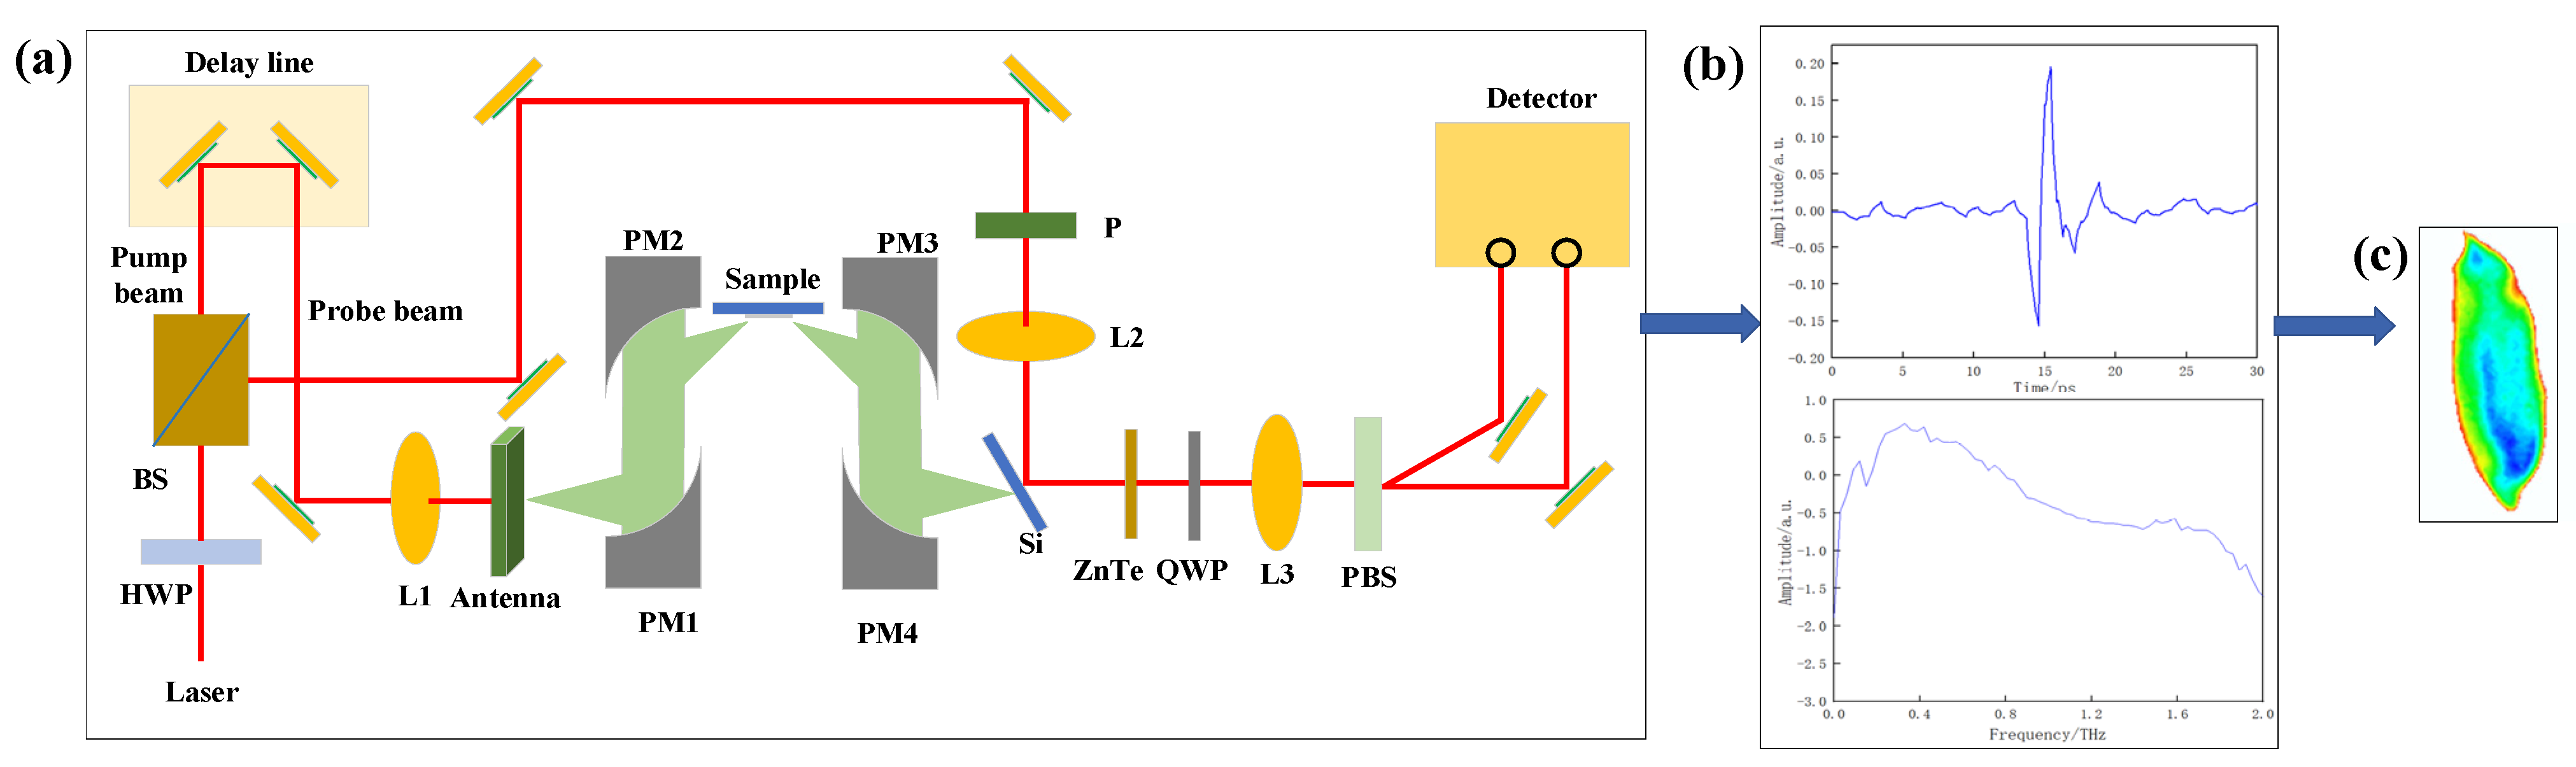
2.1. Experimental Setup and Principles
2.2. Principle of the Proposed Algorithm
2.2.1. CBDNet
2.2.2. VGG19
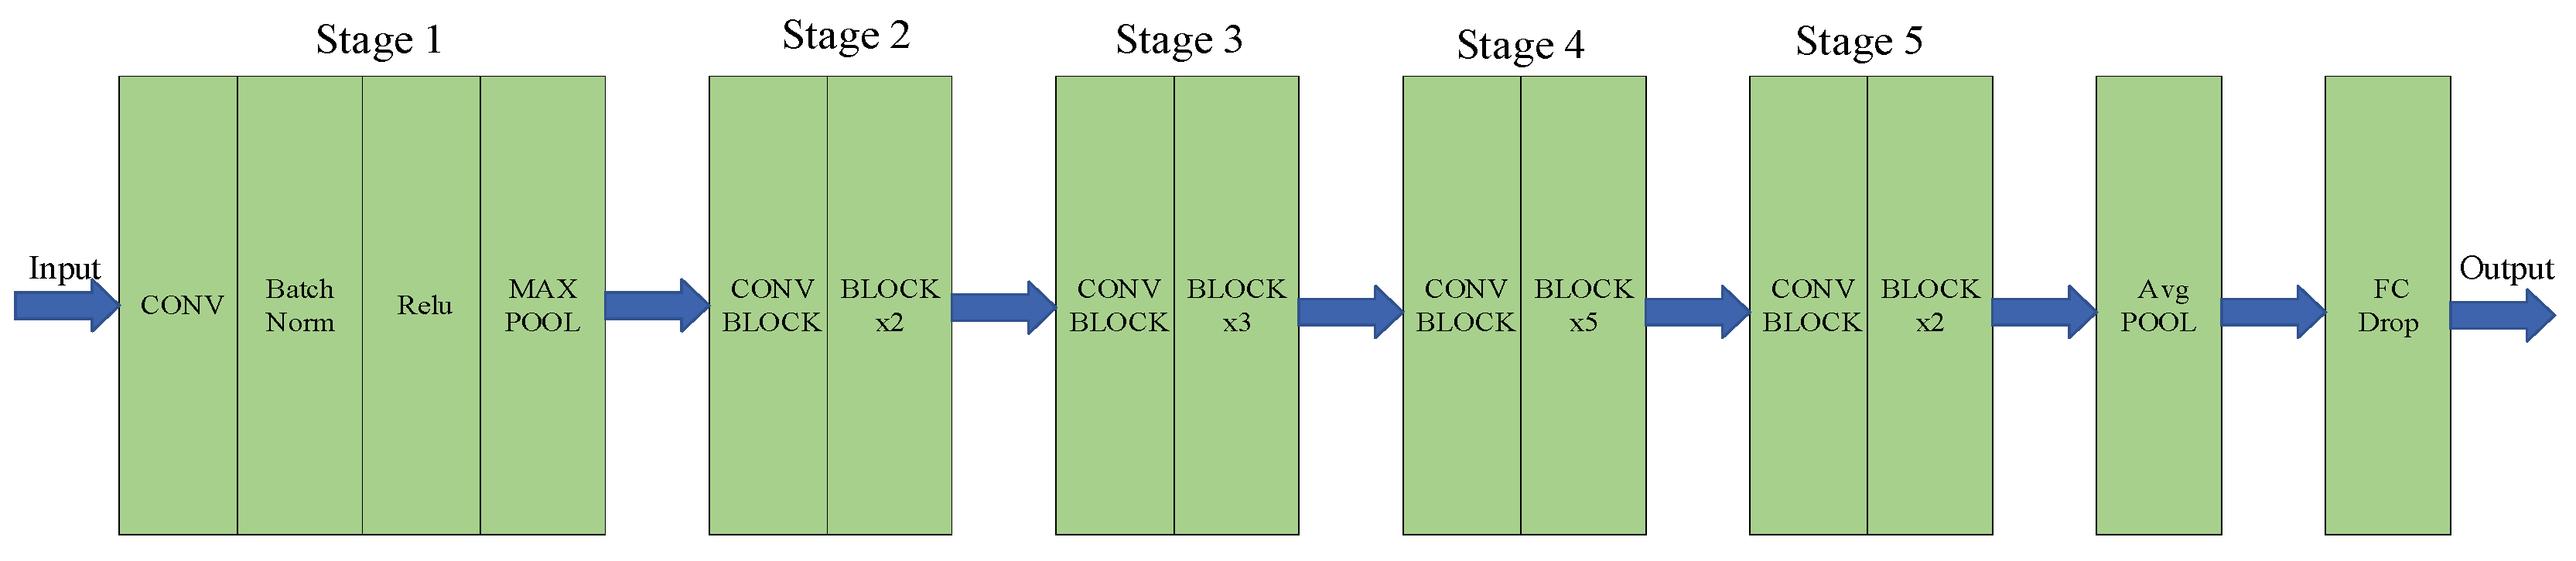
2.2.3. ResNet50
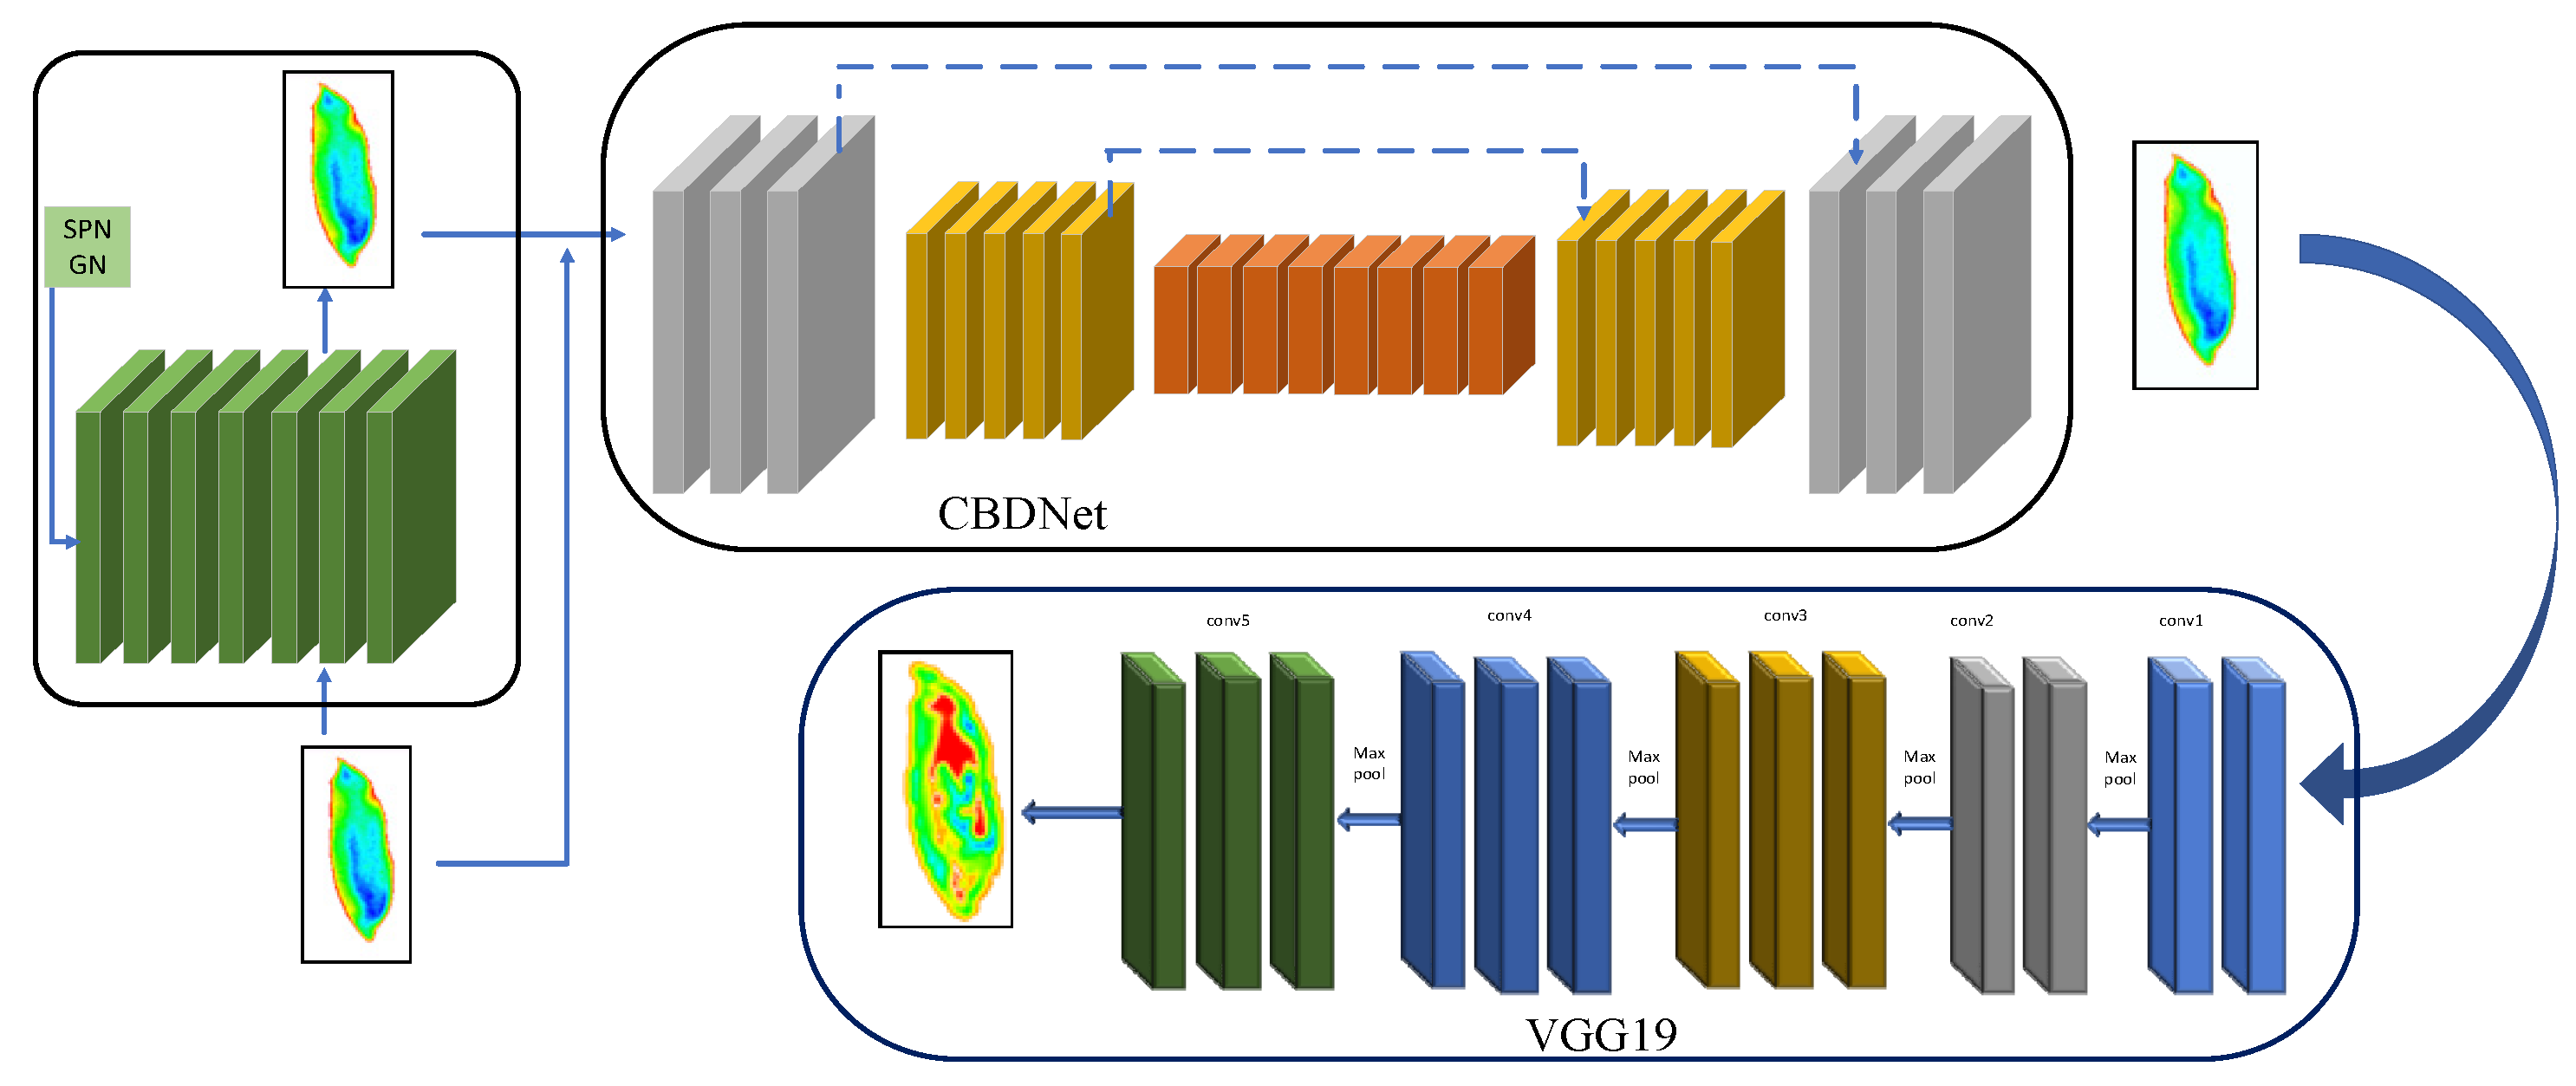
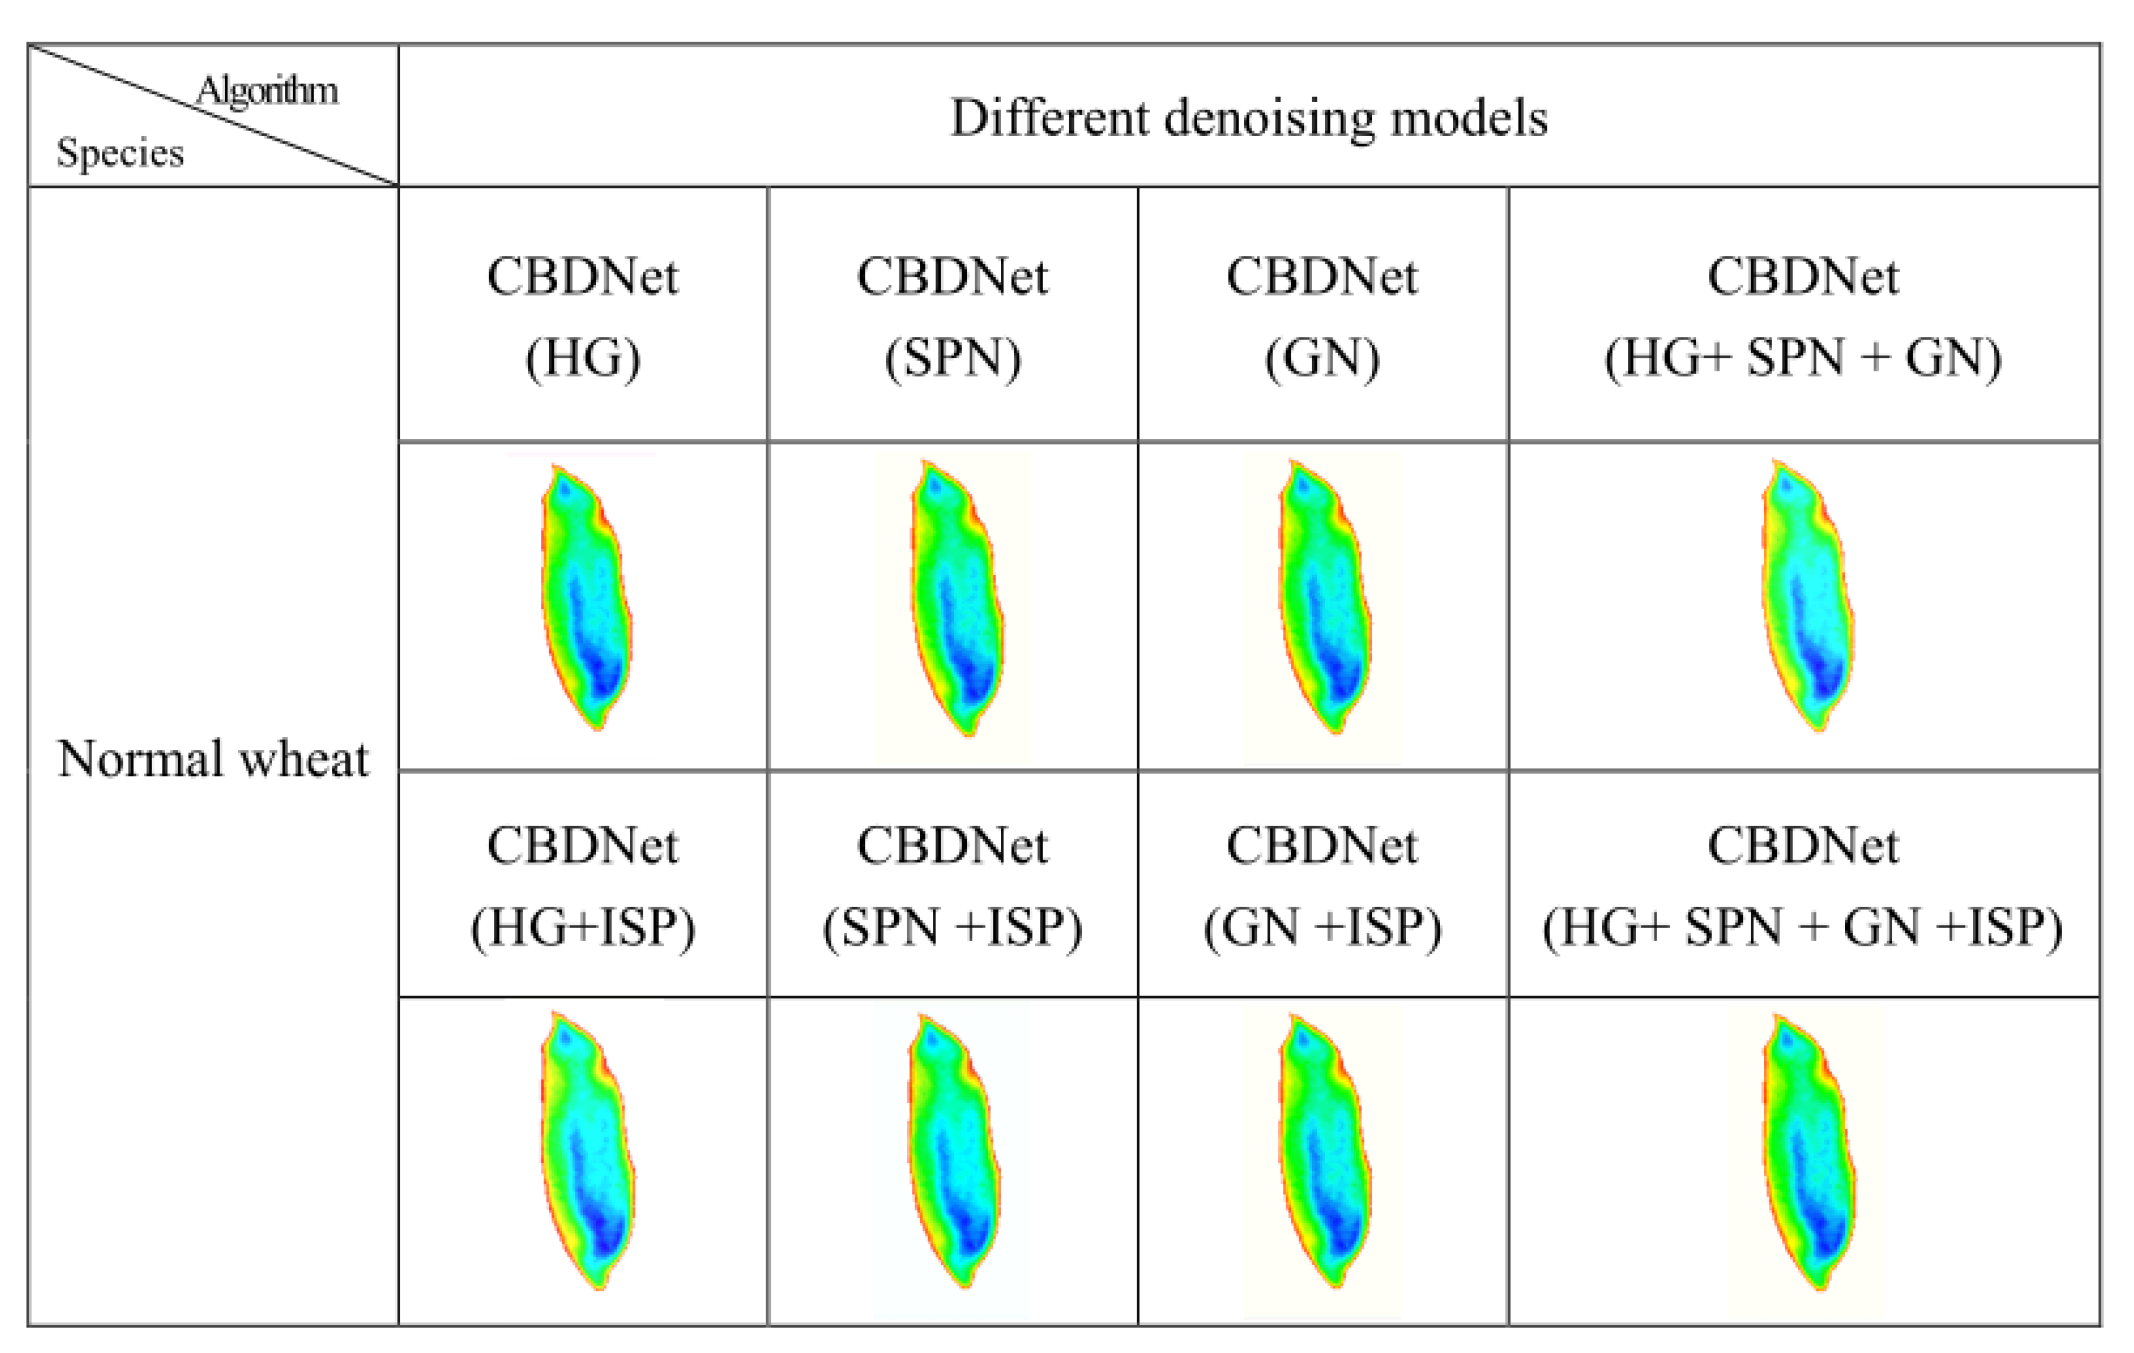
2.3. CBDNet-V Terahertz Spectral Image Enhancement Model
2.4. Evaluation Indicators
3. Experiments and Results
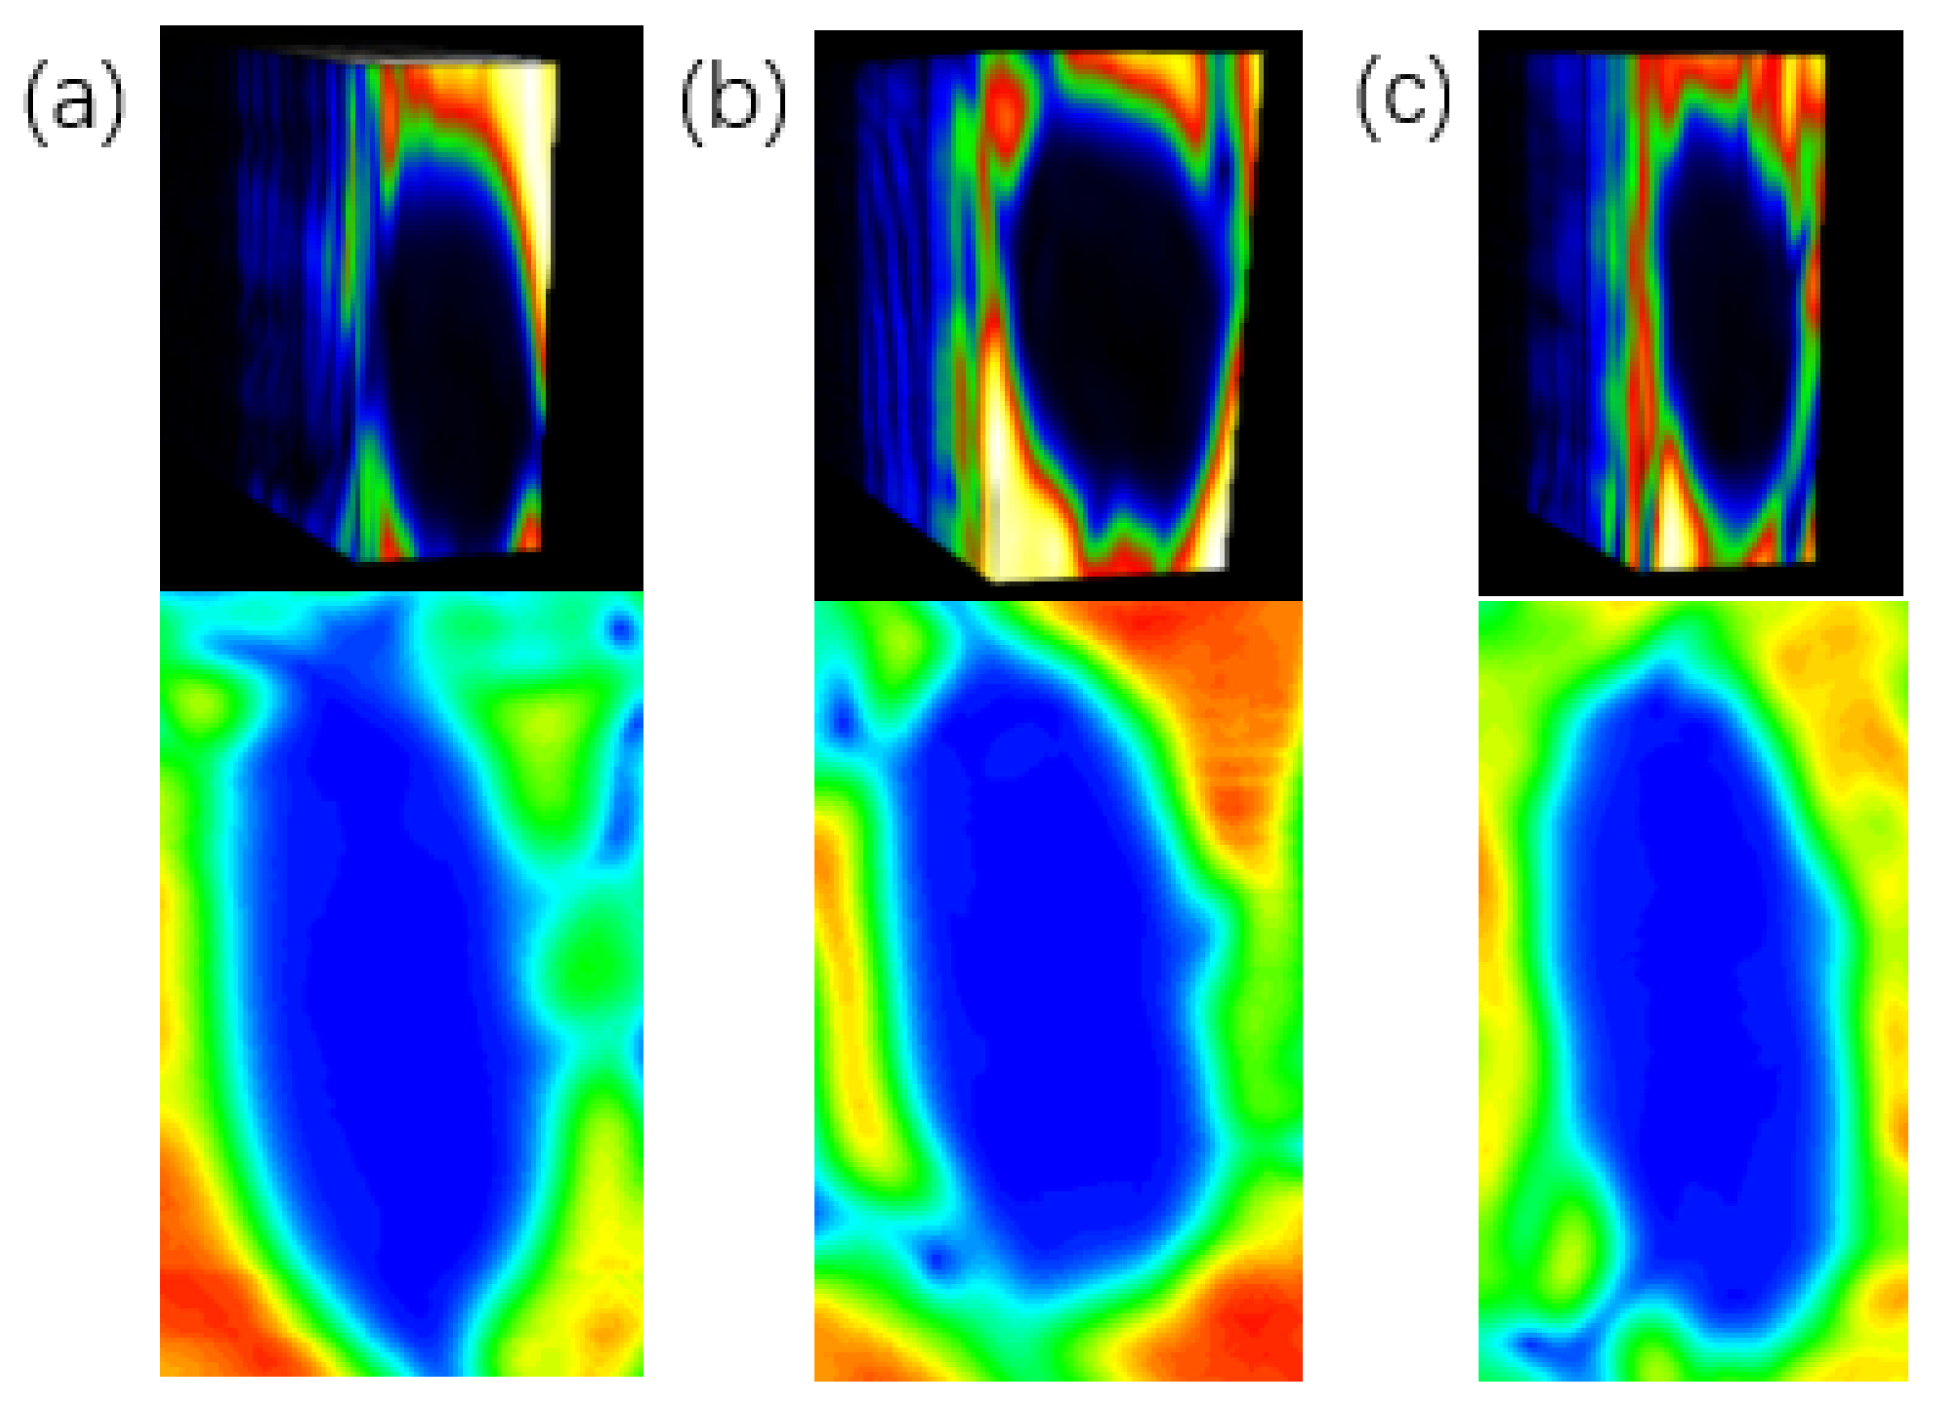
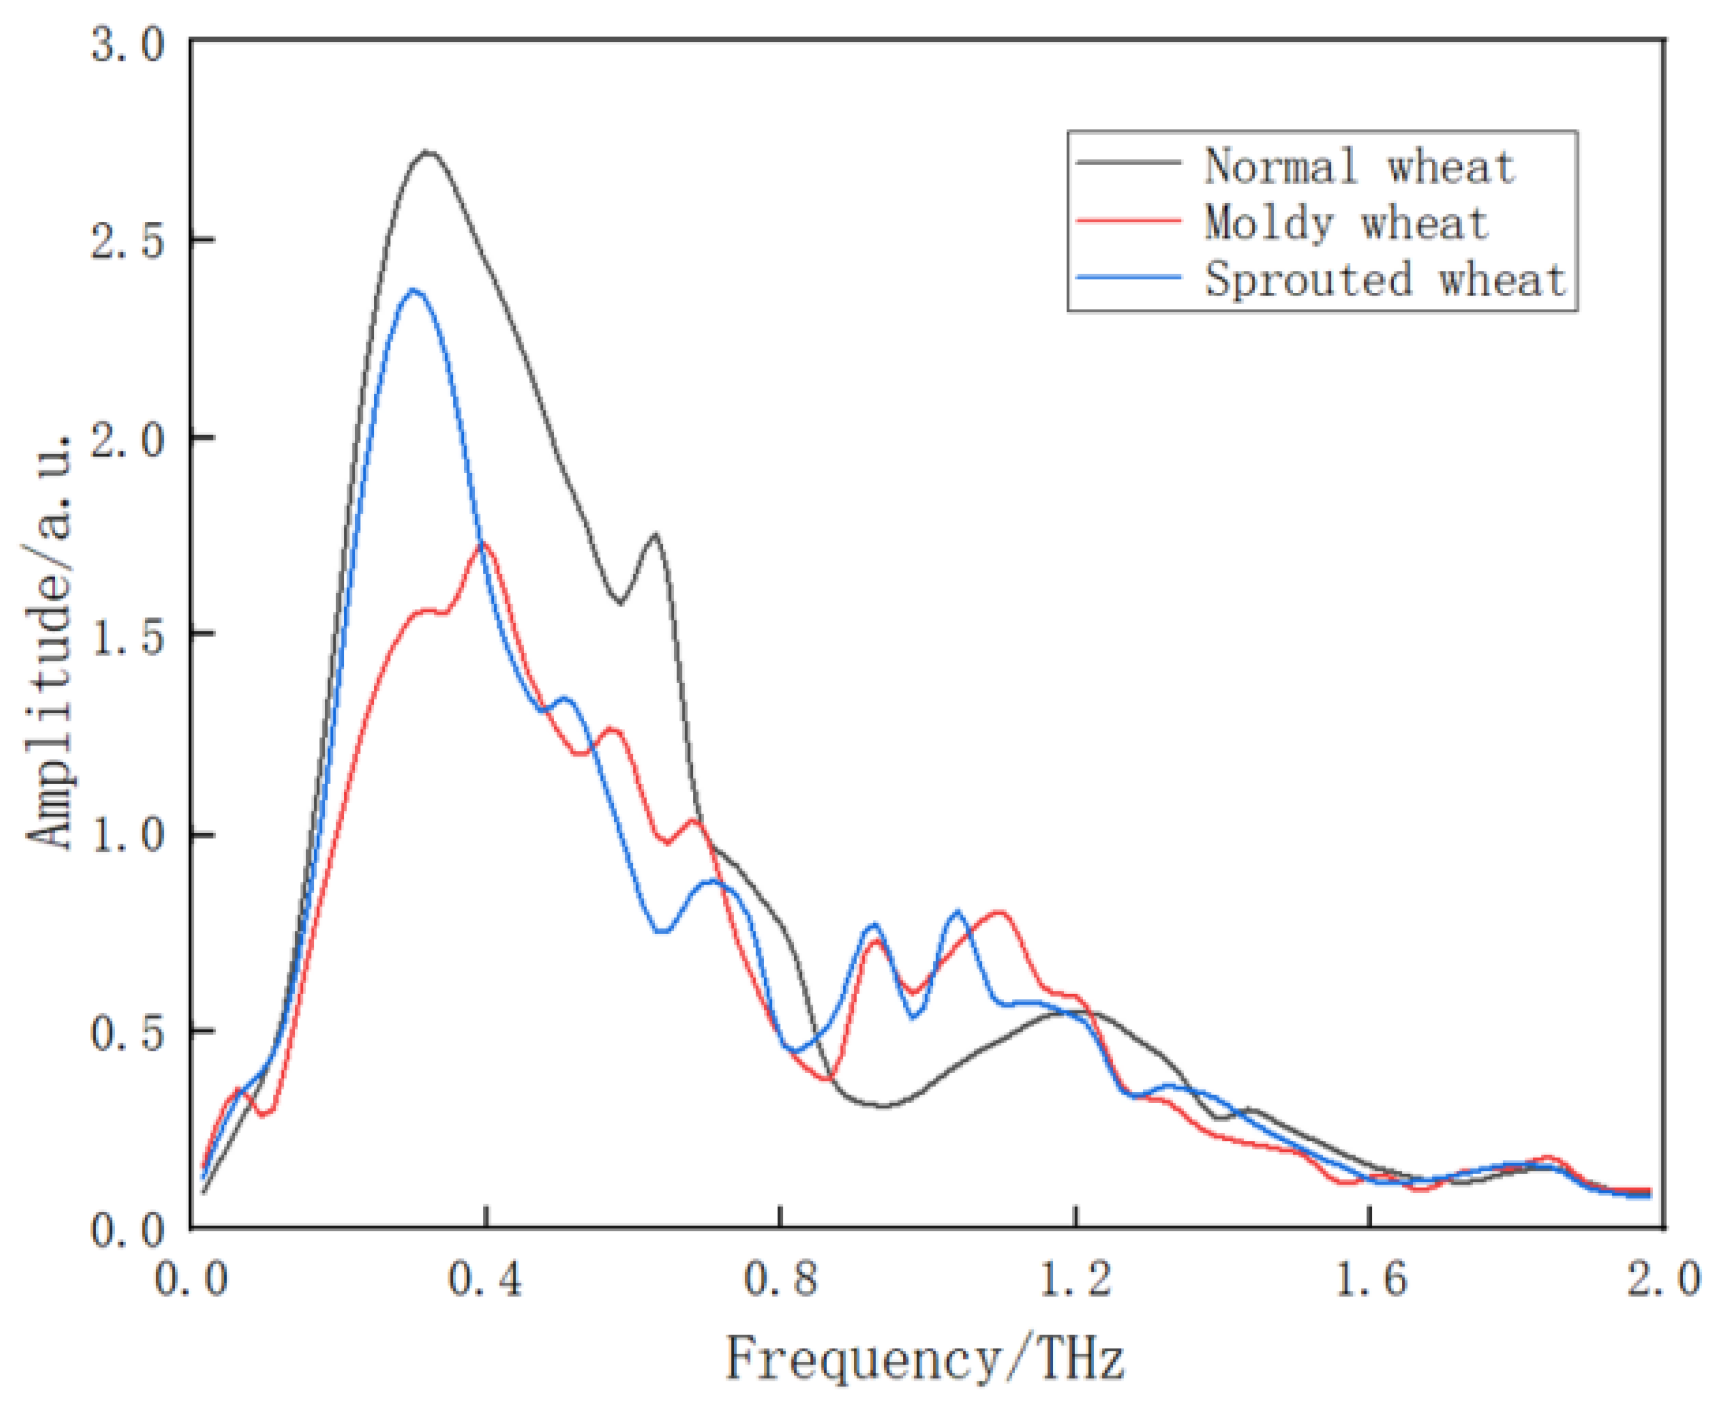
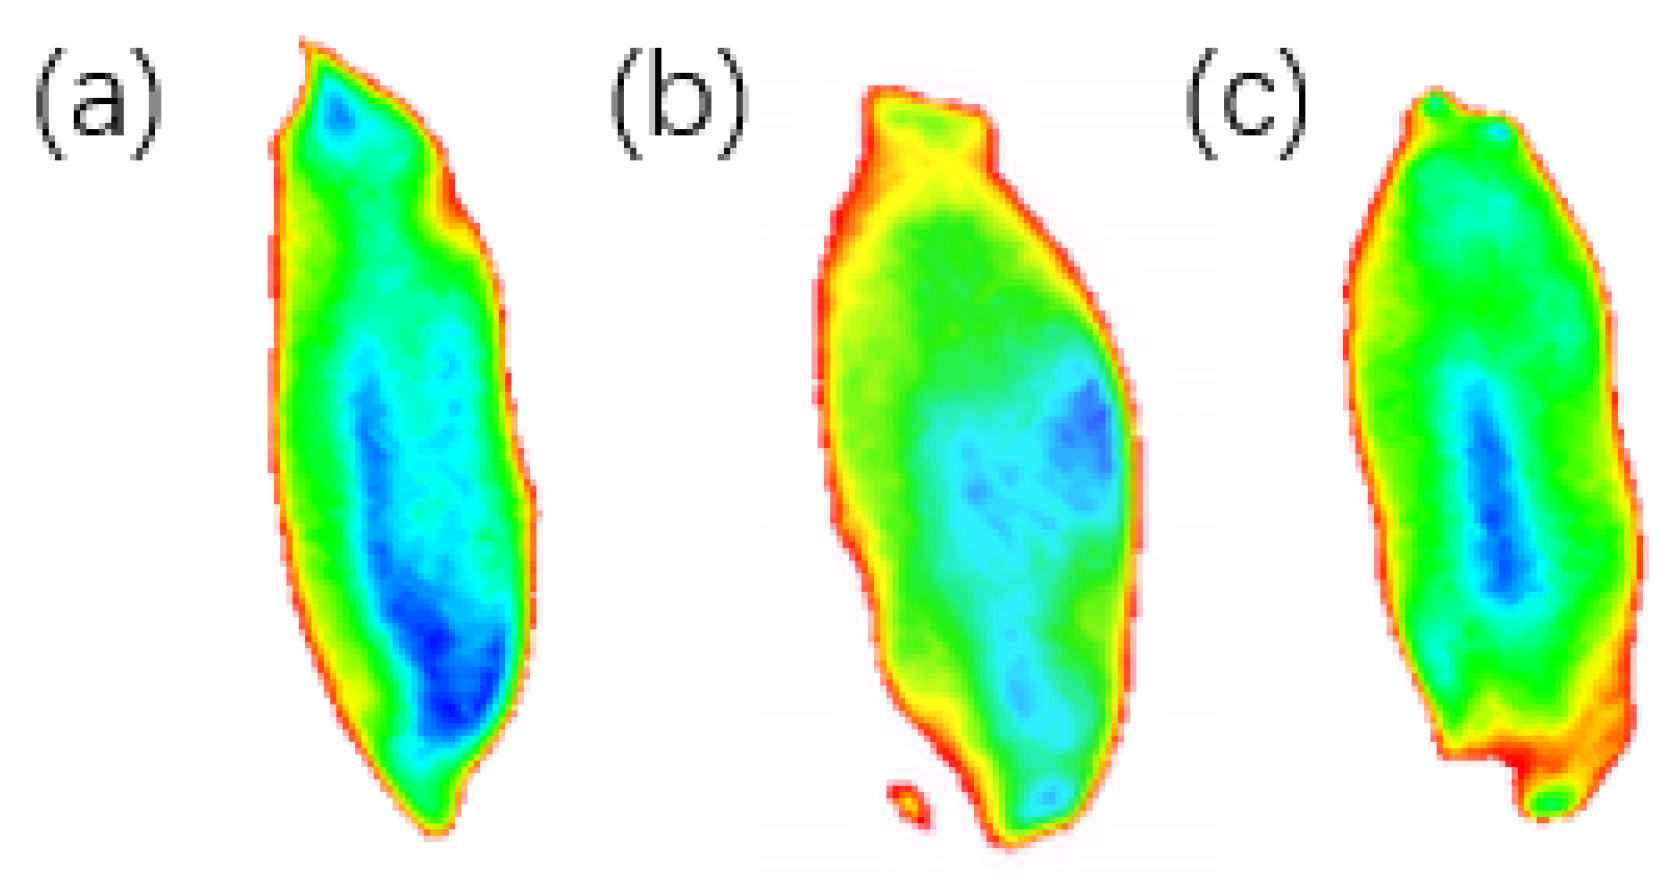
3.1. THz Spectral Image Data Acquisition of Wheat Unsound Grains
3.2. Network Training
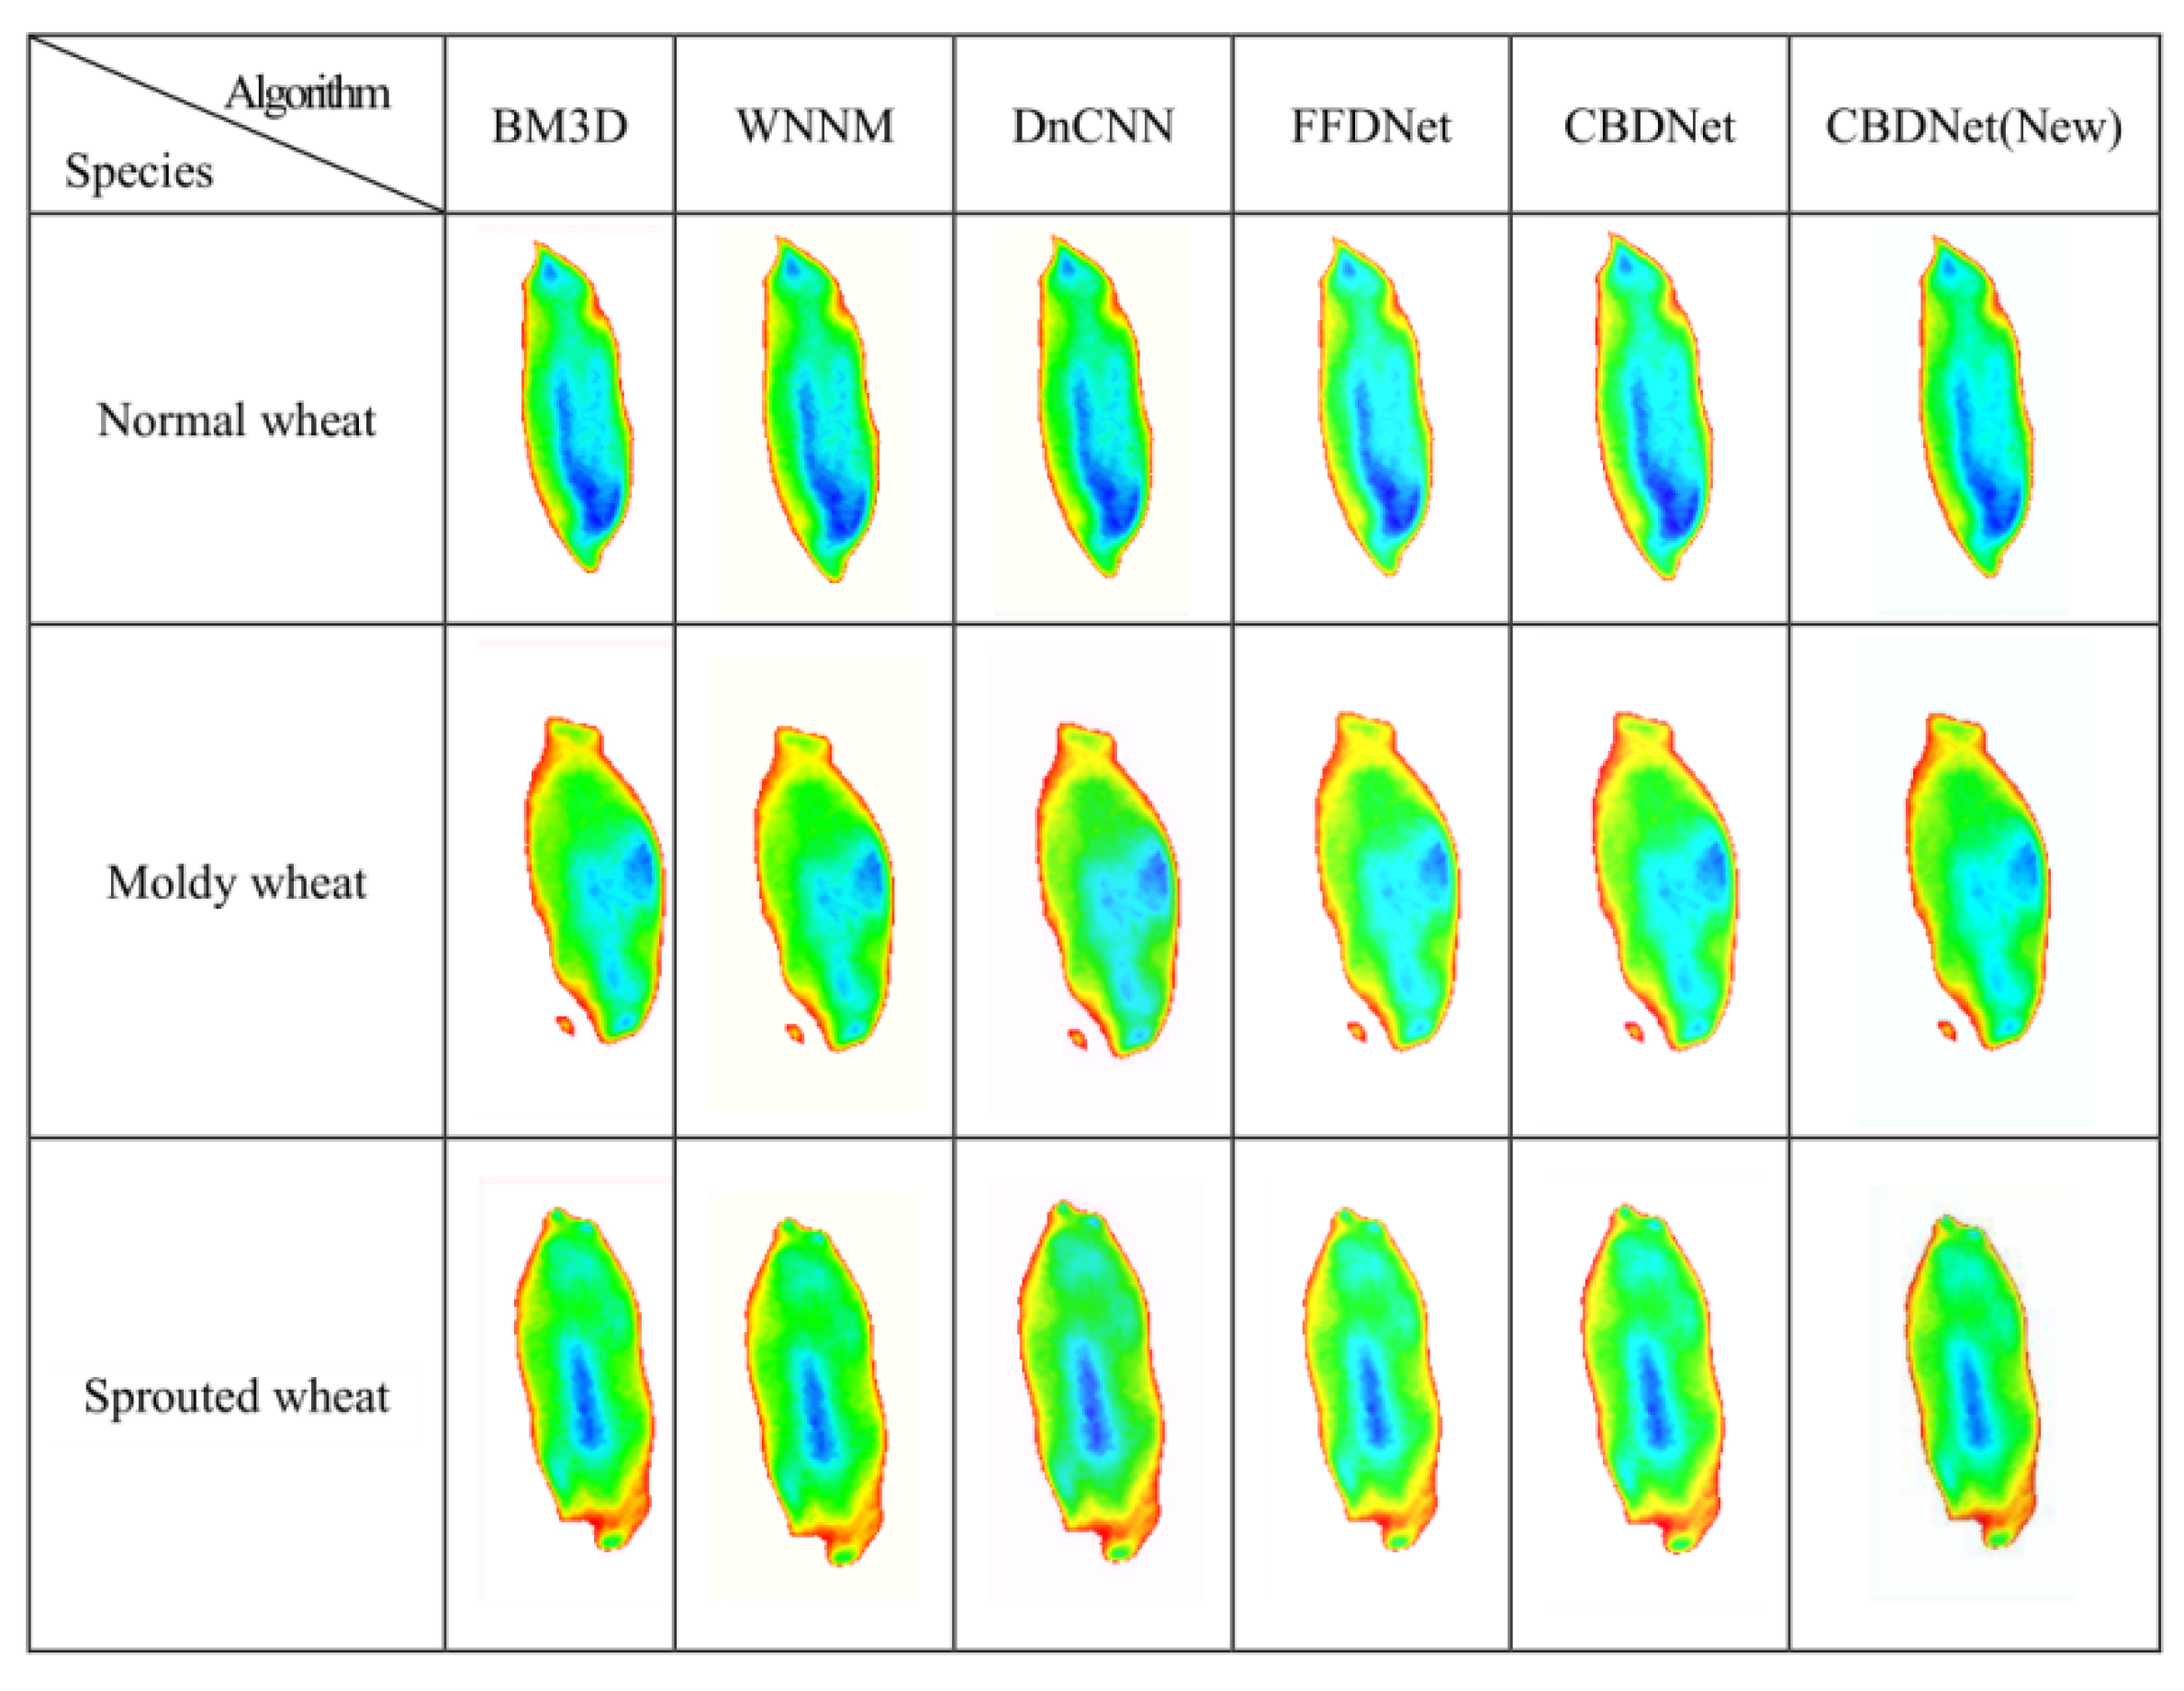
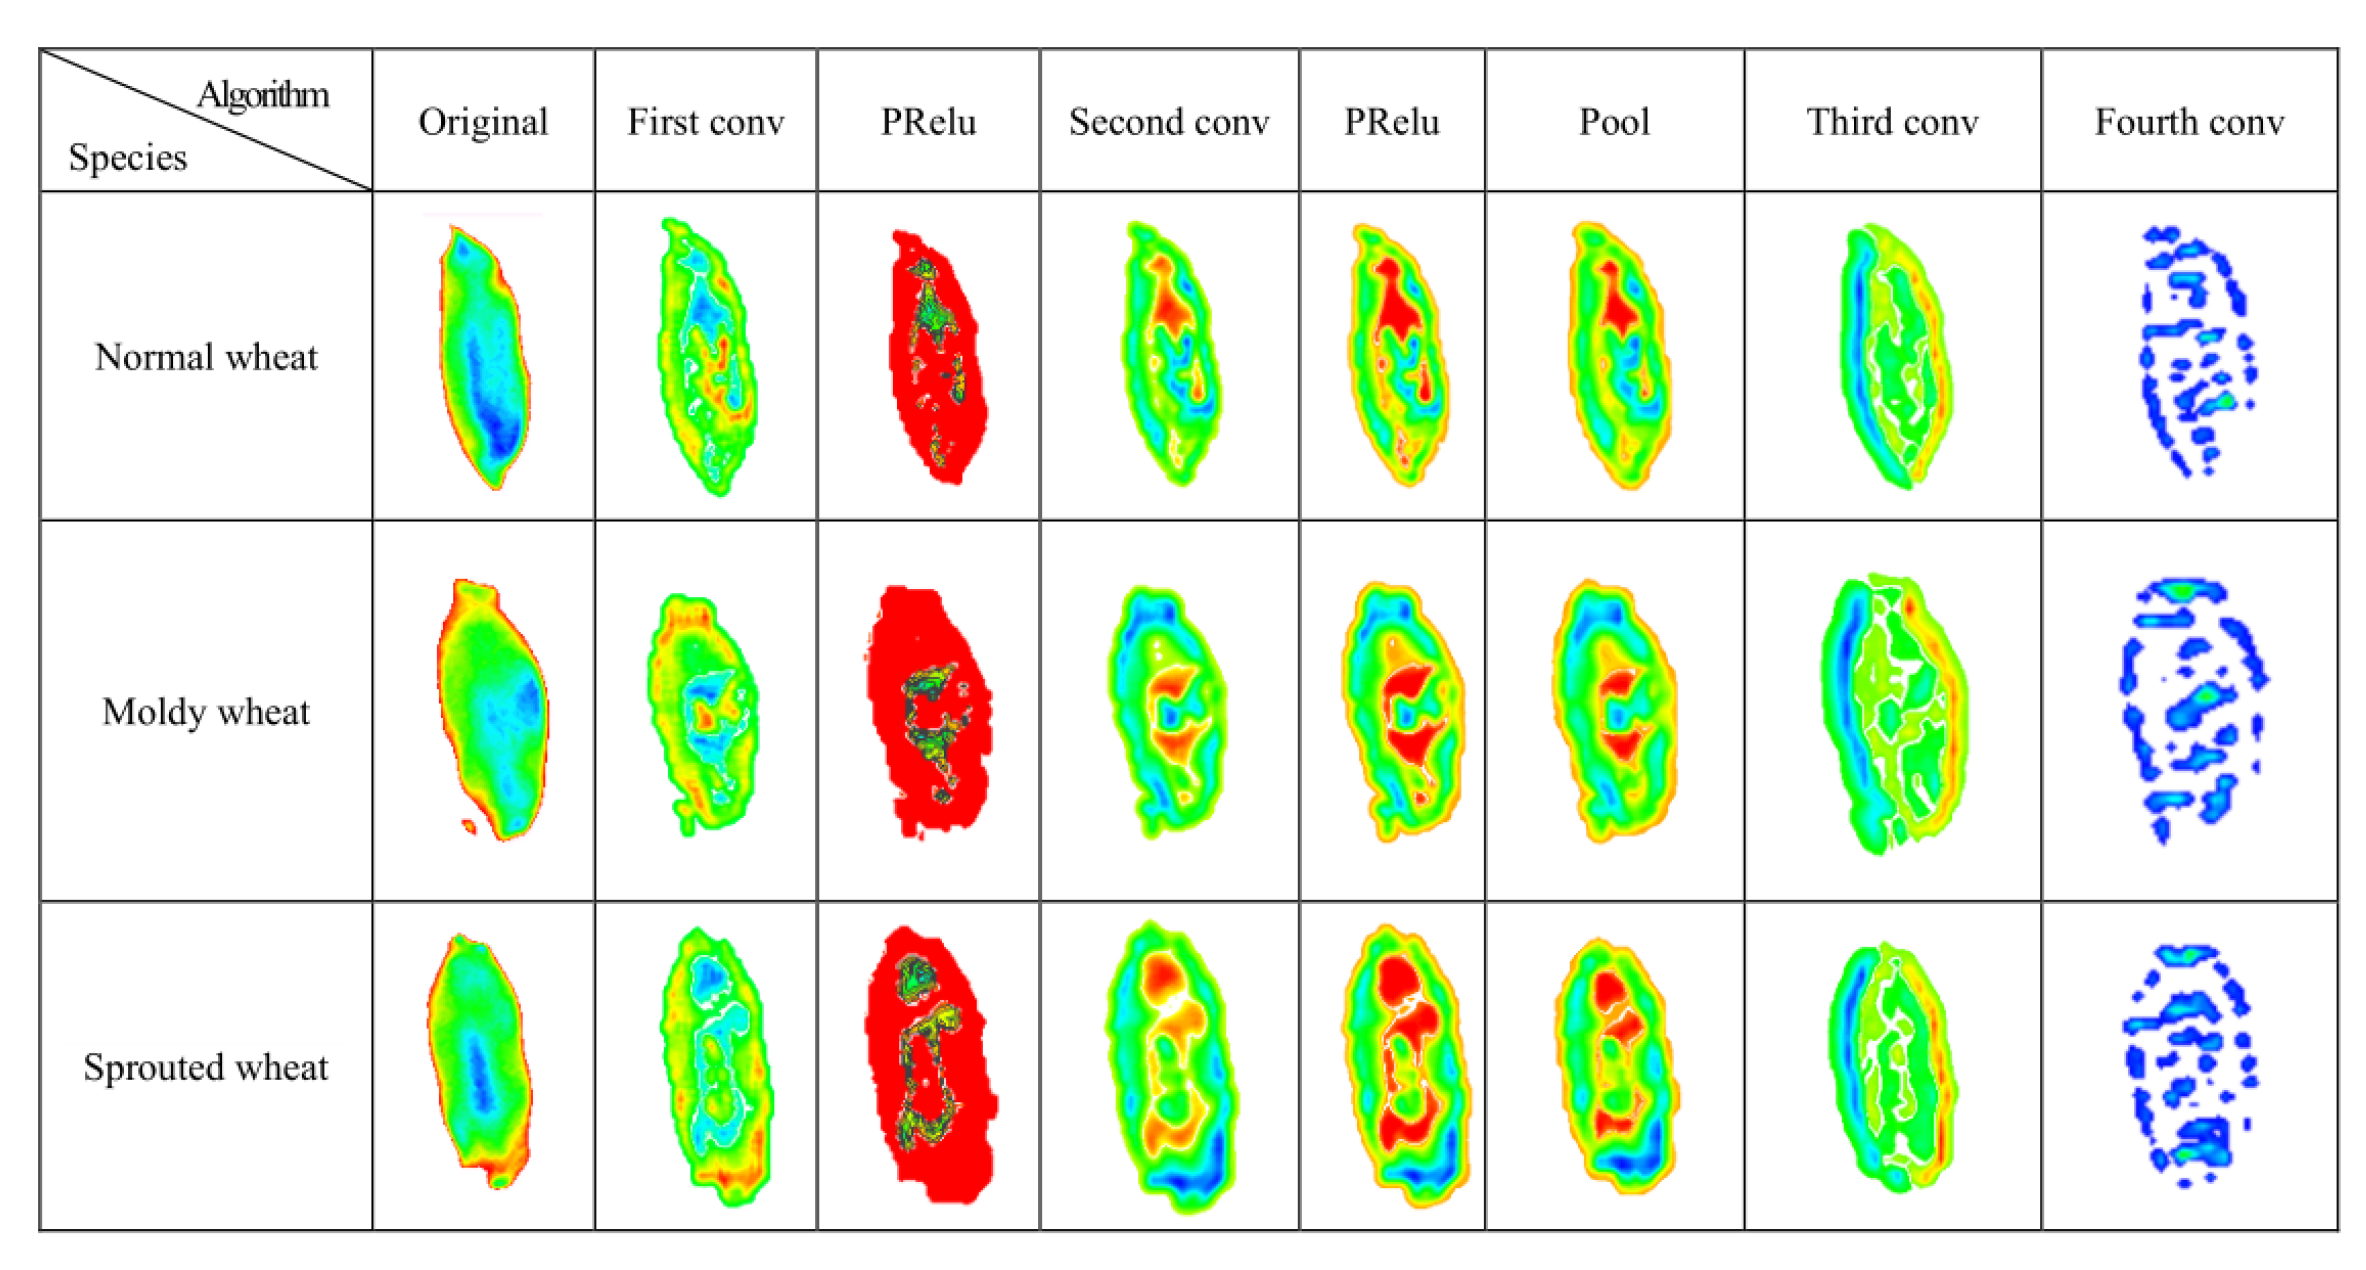
3.3. Experimental Results and Discussion
4. Conclusions
Author Contributions
Funding
Institutional Review Board Statement
Informed Consent Statement
Data Availability Statement
Conflicts of Interest
References
- Oviedo, M.S.; Ramirez, M.L.; Barros, G.G.; Chulze, S.N. Influence of water activity and temperature on growth and mycotoxin production by Alternaria alternata on irradiated soya beans. Int. J. Food Microbiol. 2011, 149, 127–132. [Google Scholar] [CrossRef] [PubMed]
- Oladunmoye, O.O.; Akinoso, R.; Olapade, A.A. Evaluation of some physical-chemical properties of wheat, cassava, maize and cowpea flours for bread making. J. Food Qual. 2010, 33, 693–708. [Google Scholar] [CrossRef]
- Carloni, E.; Amagliani, G.; Omiccioli, E.; Ceppetelli, V.; Del Mastro, M.; Rotundo, L.; Brandi, G.; Magnani, M. Validation and application of a quantitative real-time PCR assay to detect common wheat adulteration of durum wheat for pasta production. Food Chem. 2017, 224, 86–91. [Google Scholar] [CrossRef] [PubMed]
- Allmann, M.; Candrian, U.; Höfelein, C.; Lüthy, J. Polymerase chain reaction (PCR): A possible alternative to immunochemical methods assuring safety and quality of food. Detection of wheat contamination in non-wheat food products. Z. Lebensm.-Unters. Forsch. 1993, 196, 248–251. [Google Scholar] [CrossRef] [PubMed]
- Garcia-Febrero, R.; Salvador, J.P.; Sanchez-Baeza, F.; Marco, M.P. Rapid method based on immunoassay for determination of paraquat residues in wheat, barley and potato. Food Control 2014, 41, 193–201. [Google Scholar] [CrossRef]
- Zhao, J.; Zhang, X.; Yan, J.; Qiu, X.; Yao, X.; Tian, Y.; Zhu, Y.; Cao, W. A Wheat Spike Detection Method in UAV Images Based on Improved YOLOv5. Remote Sens. 2021, 13, 3095. [Google Scholar] [CrossRef]
- Sabanci, K. Detection of sunn pest-damaged wheat grains using artificial bee colony optimization-based artificial intelligence techniques. J. Sci. Food Agric. 2020, 100, 817–824. [Google Scholar] [CrossRef]
- Qiu, R.; Yang, C.; Moghimi, A.; Zhang, M.; Steffenson, B.J.; Hirsch, C.D. Detection of Fusarium Head Blight in Wheat Using a Deep Neural Network and Color Imaging. Remote Sens. 2019, 11, 2658. [Google Scholar] [CrossRef] [Green Version]
- Jiang, Y.; Ge, H.; Zhang, Y. Quantitative analysis of wheat maltose by combined terahertz spectroscopy and imaging based on Boosting ensemble learning. Food Chem. 2020, 307, 125533. [Google Scholar] [CrossRef]
- Cebi, N.; Dogan, C.E.; Develioglu, A.; Yayla, M.E.; Sagdic, O. Detection of L-Cysteine in wheat flour by Raman microspectroscopy combined chemometrics of HCA and PCA. Food Chem. 2017, 228, 116–124. [Google Scholar] [CrossRef]
- Zhang, L.; Ji, H.Y. Identification of wheat grain in different states based on hyperspectral imaging technology. Spectrosc. Lett. 2019, 52, 356–366. [Google Scholar] [CrossRef]
- Wu, Y.; Yun, Y.; Chen, J.; Liu, D. Discrimination of Waxy Wheats Using Near-Infrared Hyperspectral Spectroscopy. Food Anal. Methods 2021, 14, 1704–1713. [Google Scholar] [CrossRef]
- Sun, X.; Zhu, K.; Liu, J.; Hu, J.; Jiang, X.; Liu, Y.; Gong, Z. Terahertz spectroscopy determination of benzoic acid additive in wheat flour by machine learning. J. Infrared Millim. Terahertz Waves 2019, 40, 466–475. [Google Scholar] [CrossRef]
- Shen, Y.; Yin, Y.; Li, B.; Zhao, C.; Li, G. Detection of impurities in wheat using terahertz spectral imaging and convolutional neural networks. Comput. Electron. Agric. 2021, 181, 105931. [Google Scholar] [CrossRef]
- Zhang, J.; Yang, Y.; Feng, X.; Xu, H.; Chen, J.; He, Y. Identification of bacterial blight resistant rice seeds using terahertz imaging and hyperspectral imaging combined with convolutional neural network. Front. Plant Sci. 2020, 11, 821. [Google Scholar] [CrossRef] [PubMed]
- Zhai, Y.; Xiang, Y.; Yuan, W.; Chen, G.; Shi, J.; Liang, G.; Wen, Z.; Wu, Y. Fabrication of Graphene Nanomesh FET Terahertz Detector. Micromachines 2021, 12, 641. [Google Scholar] [CrossRef]
- Chen, G.; Li, Q. Markov chain Monte Carlo sampling based terahertz holography image denoising. Appl. Opt. 2015, 54, 4345–4351. [Google Scholar] [CrossRef]
- Liu, J.; Li, Z. Antcolony combined with adaptive threshold denoising and reconstruct for THz image. Optik 2014, 125, 3423–3427. [Google Scholar] [CrossRef]
- Zhang, Z.; Lu, Y.; Lv, C.; Mao, Q.; Wang, S.; Yan, S. Restoration of integrated circuit terahertz image based on wavelet denoising technique and the point spread function model. Opt. Lasers Eng. 2021, 138, 106413. [Google Scholar] [CrossRef]
- Guo, S.; Yan, Z.; Zhang, K.; Zuo, W.; Zhang, L. Toward convolutional blind denoising of real photographs. In Proceedings of the IEEE/CVF Conference on Computer Vision and Pattern Recognition, Long Beach, CA, USA, 15–20 June 2019; pp. 1712–1722. [Google Scholar]
- Song, Y.; Zhu, Y.; Du, X. Dynamic residual dense network for image denoising. Sensors 2019, 19, 3809. [Google Scholar] [CrossRef] [Green Version]
- Dey, N.; Zhang, Y.D.; Rajinikanth, V.; Pugalenthi, R.; Raja, N.S. Customized VGG19 architecture for pneumonia detection in chest X-rays. Pattern Recognit. Lett. 2021, 143, 67–74. [Google Scholar] [CrossRef]
- Theckedath, D.; Sedamkar, R. Detecting affect states using VGG16, ResNet50 and SE-ResNet50 networks. SN Comput. Sci. 2020, 1, 79. [Google Scholar] [CrossRef] [Green Version]
- He, K.; Zhang, X.; Ren, S.; Sun, J. Deep residual learning for image recognition. In Proceedings of the IEEE Conference on Computer Vision and Pattern Recognition, Las Vegas, NV, USA, 27–30 June 2016; pp. 770–778. [Google Scholar]
- Chan, R.H.; Ho, C.-W.; Nikolova, M. Salt-and-pepper noise removal by median-type noise detectors and detail-preserving regularization. IEEE Trans. Image Process. 2005, 14, 1479–1485. [Google Scholar] [CrossRef] [PubMed]
- Kamada, M.; Laitinen, A.; Zeng, W.; Will, M.; Sarkar, J.; Tappura, K.; Seppa, H.; Hakonen, P. Electrical Low-Frequency 1/f γ Noise Due to Surface Diffusion of Scatterers on an Ultra-low-Noise Graphene Platform. Nano Lett. 2021, 21, 7637–7643. [Google Scholar] [CrossRef]
- He, K.; Zhang, X.; Ren, S.; Sun, J. Delving deep into rectifiers: Surpassing human-level performance on imagenet classification. In Proceedings of the IEEE International Conference on Computer Vision, Washington, DC, USA, 7–13 December 2015; pp. 1026–1034. [Google Scholar]
- Setiadi, D.R. PSNR vs SSIM: Imperceptibility quality assessment for image steganography. Multimed. Tools Appl. 2021, 80, 8423–8444. [Google Scholar] [CrossRef]
- Shen, H.; Li, B.; Tao, M.; Wang, X. MSE-based transceiver designs for the MIMO interference channel. IEEE Trans. Wirel. Commun. 2010, 9, 3480–3489. [Google Scholar] [CrossRef]
- Sara, U.; Akter, M.; Uddin, M.S. Image quality assessment through FSIM, SSIM, MSE and PSNR—A comparative study. J. Comput. Commun. 2019, 7, 8–18. [Google Scholar] [CrossRef] [Green Version]
- Yang, D.; Sun, J. BM3D-Net: A convolutional neural network for transform-domain collaborative filtering. IEEE Signal Process. Lett. 2017, 25, 55–59. [Google Scholar] [CrossRef]
- Thakur, R.S.; Yadav, R.N.; Gupta, L. State-of-art analysis of image denoising methods using convolutional neural networks. IET Image Process. 2019, 13, 2367–2380. [Google Scholar] [CrossRef]
- Yang, H.; Park, Y.; Yoon, J.; Jeong, B. An improved weighted nuclear norm minimization method for image denoising. IEEE Access 2019, 7, 97919–97927. [Google Scholar] [CrossRef]
- Zhang, K.; Zuo, W.; Zhang, L. FFDNet: Toward a fast and flexible solution for CNN-based image denoising. IEEE Trans. Image Process. 2018, 27, 4608–4622. [Google Scholar] [CrossRef] [PubMed] [Green Version]


| Images | Algorithm | PSNR/dB | SSIM |
|---|---|---|---|
| Normal wheat | BM3D | 34.35 | 0.86 |
| WNNM | 35.02 | 0.86 | |
| DnCNN | 35.55 | 0.87 | |
| FFDNet | 36.63 | 0.90 | |
| CBDNet | 37.03 | 0.91 | |
| CBDNet (New) | 39.24 | 0.94 | |
| Moldy wheat | BM3D | 35.01 | 0.86 |
| WNNM | 35.36 | 0.87 | |
| DnCNN | 34.55 | 0.87 | |
| FFDNet | 36.11 | 0.91 | |
| CBDNet | 37.88 | 0.93 | |
| CBDNet (New) | 39.34 | 0.95 | |
| Sprouted wheat | BM3D | 34.80 | 0.86 |
| WNNM | 35.08 | 0.86 | |
| DnCNN | 35.45 | 0.90 | |
| FFDNet | 37.01 | 0.92 | |
| CBDNet | 37.71 | 0.93 | |
| CBDNet (New) | 39.30 | 0.95 |
| Images | Algorithm | PSNR/dB | SSIM |
|---|---|---|---|
| Normal wheat | CBDNet (SPN) | 32.15 | 0.79 |
| CBDNet (GN) | 33.06 | 0.80 | |
| CBDNet (HG) | 33.55 | 0.81 | |
| CBDNet (SPN+ISP) | 36.26 | 0.92 | |
| CBDNet (HG+ISP) | 36.57 | 0.90 | |
| CBDNet (GN+ISP) | 37.03 | 0.92 | |
| CBDNet (HG+SPN+GN) | 37.77 | 0.93 | |
| CBDNet (HG+SPN+GN+ISP) | 39.24 | 0.94 |
| Images | Denoising | Feature Extraction | Denoising + Feature Extraction |
|---|---|---|---|
| Prediction Results (%) | Prediction Results (%) | Prediction Results (%) | |
| Normal wheat | 91.1 | 92.9 | 94.8 |
| Moldy wheat | 90.6 | 91.6 | 93.3 |
| Sprouted wheat | 90.7 | 92.4 | 94.6 |
Publisher’s Note: MDPI stays neutral with regard to jurisdictional claims in published maps and institutional affiliations. |
© 2022 by the authors. Licensee MDPI, Basel, Switzerland. This article is an open access article distributed under the terms and conditions of the Creative Commons Attribution (CC BY) license (https://creativecommons.org/licenses/by/4.0/).
Share and Cite
Jiang, Y.; Wang, F.; Ge, H.; Li, G.; Chen, X.; Li, L.; Lv, M.; Zhang, Y. Identification of Unsound Grains in Wheat Using Deep Learning and Terahertz Spectral Imaging Technology. Agronomy 2022, 12, 1093. https://doi.org/10.3390/agronomy12051093
Jiang Y, Wang F, Ge H, Li G, Chen X, Li L, Lv M, Zhang Y. Identification of Unsound Grains in Wheat Using Deep Learning and Terahertz Spectral Imaging Technology. Agronomy. 2022; 12(5):1093. https://doi.org/10.3390/agronomy12051093
Chicago/Turabian StyleJiang, Yuying, Fei Wang, Hongyi Ge, Guangming Li, Xinyu Chen, Li Li, Ming Lv, and Yuan Zhang. 2022. "Identification of Unsound Grains in Wheat Using Deep Learning and Terahertz Spectral Imaging Technology" Agronomy 12, no. 5: 1093. https://doi.org/10.3390/agronomy12051093
APA StyleJiang, Y., Wang, F., Ge, H., Li, G., Chen, X., Li, L., Lv, M., & Zhang, Y. (2022). Identification of Unsound Grains in Wheat Using Deep Learning and Terahertz Spectral Imaging Technology. Agronomy, 12(5), 1093. https://doi.org/10.3390/agronomy12051093